Differentiation of coarse-mode anthropogenic, marine and dust particles in the High Arctic islands of Svalbard
←
→
Page content transcription
If your browser does not render page correctly, please read the page content below
Atmos. Chem. Phys., 21, 11317–11335, 2021
https://doi.org/10.5194/acp-21-11317-2021
© Author(s) 2021. This work is distributed under
the Creative Commons Attribution 4.0 License.

Differentiation of coarse-mode anthropogenic, marine and dust
particles in the High Arctic islands of Svalbard
Congbo Song1 , Manuel Dall’Osto2 , Angelo Lupi3 , Mauro Mazzola3 , Rita Traversi4,5 , Silvia Becagli4,5 ,
Stefania Gilardoni3 , Stergios Vratolis6 , Karl Espen Yttri7 , David C. S. Beddows8 , Julia Schmale9 , James Brean1 ,
Agung Ghani Kramawijaya1 , Roy M. Harrison1,a , and Zongbo Shi1
1 School   of Geography Earth and Environment Sciences, University of Birmingham, Birmingham B15 2TT, UK
2 Institute of Marine Science, Consejo Superior de Investigaciones Científicas (CSIC), Barcelona, Spain
3 National Research Council of Italy, Institute of Polar Sciences (CNR-ISP), Via P. Gobetti 101, 40129 Bologna, Italy
4 Department of Chemistry “Ugo Schiff”, University of Florence, Via della Lastruccia 3, 50019 Sesto Fiorentino, Italy
5 National Research Council of Italy, Institute of Polar Sciences (CNR-ISP), Via Torino 155, 30172 Venice-Mestre, Italy
6 ERL, Institute of Nuclear & Radiological Sciences & Technology, Energy & Safety, National Centre of Scientific Research

Demokritos, 15310 Ag. Paraskevi, Attiki, Greece
7 NILU – Norwegian Institute for Air Research, P.O. Box 100, 2027 Kjeller, Norway
8 National Centre for Atmospheric Science (NCAS), School of Geography, Earth and Environmental Sciences,

University of Birmingham, Birmingham B15 2TT, UK
9 School of Architecture, Civil and Environmental Engineering, École Polytechnique Fédéderale de Lausanne,

Lausanne, Switzerland
a also at: Department of Environmental Sciences/Center of Excellence in Environmental Studies,

King Abdulaziz University, P.O. Box 80203, Jeddah, 21589, Saudi Arabia

Correspondence: Manuel Dall’Osto (dallosto@icm.csic.es) and Zongbo Shi (z.shi@bham.ac.uk)

Received: 31 January 2021 – Discussion started: 15 February 2021
Revised: 28 June 2021 – Accepted: 3 July 2021 – Published: 28 July 2021

Abstract. Understanding aerosol–cloud–climate interactions         ond one (18 %) is attributed to larger-mode aerosol mixed
in the Arctic is key to predicting the climate in this rapidly     with sea salt. The three natural aerosol clusters were open-
changing region. Whilst many studies have focused on sub-          ocean sea spray aerosol (34 %), mineral dust (7 %) and an
micrometer aerosol (diameter less than 1 µm), relatively lit-      unidentified source of sea spray-related aerosol (32 %). The
tle is known about the supermicrometer aerosol (diameter           results suggest that sea-spray-related aerosol in polar regions
above 1 µm). Here, we present a cluster analysis of multiyear      may be more complex than previously thought due to short-
(2015–2019) aerodynamic volume size distributions, with di-        and long-distance origins and mixtures with Arctic haze, bio-
ameter ranging from 0.5 to 20 µm, measured continuously            genic and likely blowing snow aerosols. Studying supermi-
at the Gruvebadet Observatory in the Svalbard archipelago.         crometer natural aerosol in the Arctic is imperative for under-
Together with aerosol chemical composition data from sev-          standing the impacts of changing natural processes on Arctic
eral online and offline measurements, we apportioned the           aerosol.
occurrence of the coarse-mode aerosols during the study
period (mainly from March to October) to anthropogenic
(two sources, 27 %) and natural (three sources, 73 %) ori-
gins. Specifically, two clusters are related to Arctic haze with   1   Introduction
high levels of black carbon, sulfate and accumulation mode
(0.1–1 µm) aerosol. The first cluster (9 %) is attributed to am-   The Arctic is one of the most sensitive regions of the
monium sulfate-rich Arctic haze particles, whereas the sec-        world, and the Arctic environment is experiencing tremen-
                                                                   dous changes at a much faster pace than lower latitudes (Lan-

Published by Copernicus Publications on behalf of the European Geosciences Union.
11318                             C. Song et al.: Differentiation of coarse-mode anthropogenic, marine and dust particles

drum and Holland, 2020). The rising temperature, sea ice          tribute significantly to the Arctic sea salt budget, and they
melt and local air pollutant emissions (Schmale et al., 2018)     have different seasonality. With rapidly declining Arctic sea
in the Arctic all exert a broad range of impacts on natural and   ice extent and snow coverage and increasing ocean areas, the
anthropogenic processes, thereby changing Arctic aerosol          chemical nature and size distribution of SSA in the Arctic
properties and consequently radiative forcing and cloud for-      are both likely to change, which potentially alters cloud con-
mation (Abbatt et al., 2019; Willis et al., 2018). A better       densation nuclei (CCN) activity (Collins et al., 2013), ice nu-
knowledge of Arctic aerosol is an essential requisite for nar-    cleating capacity (Wilson et al., 2015; Russell, 2015) and ra-
rowing the uncertainty in assessing the impacts of aerosols on    diative forcing (Struthers et al., 2011). Murphy et al. (2019)
cloud formation and climate change (Schmale et al., 2021).        recently also reported a source of sea salt aerosol over pack
It is known that aerosol–cloud–climate interactions depend        ice that is distinct from that over open water, stressing that
upon aerosol properties, such as concentration, size distribu-    sea spray aerosols in the Arctic regions may be more com-
tion and chemical composition. In particular, the size distri-    plex than previously assumed.
bution of aerosols is important as size dictates many of the         Mineral dust is important owing to its ability to affect the
direct and indirect climate forcing properties of aerosols, as    radiation balance of the atmosphere as well as the surface
well as indicating their sources and atmospheric lifetimes.       energy balance by its presence in layers over high albedo
   There are several studies that have investigated particle      surfaces or deposited on snow and ice (Sanchez-Marroquin
number size distributions at High Arctic sites (Dall’Osto         et al., 2020; Kylling et al., 2018; Stone et al., 2007). They
et al., 2019; Freud et al., 2017; Asmi et al., 2016), but the     can also serve as ice nucleating particles and thus alter-
spectra generally measured by scanning mobility particle          ing the cloud properties and lifetime (Tobo et al., 2019).
sizers (SMPSs) are usually limited to aerosol diameters of        Sharma et al. (2019) found dust components in the Arctic
less than 1 µm, i.e., submicrometer aerosol. These studies are    to be most abundant in late summer/early autumn, whereas
highly informative, but the measured submicrometer aerosols       a less abundant but still significant peak was observed in
are unlikely to capture some important aerosol sources that       spring. The atmospheric dust load in the Arctic is presum-
are mainly present in the supermicrometer mode (i.e., above       ably influenced by high-latitude local dust emissions (Tobo
1 µm diameter) decisive for the volume and mass concen-           et al., 2019; Bullard et al., 2016) and long-range transported
tration basis, notably sea spray and mineral dust (Quinn          windblown dust from low-mid latitudes (Sirois and Barrie,
et al., 2015; Ricard et al., 2002; Porter and Clarke, 1997; Li    1999). Mineral species in Arctic aerosol were reported to
and Winchester, 1990). Recently, a long-term trend analysis       be mainly present in the supermicrometer mode with mean
demonstrated that aerosol observed at the Zeppelin Observa-       aerodynamic diameter at ∼ 5 µm on a volume/mass concen-
tory in Svalbard has become more dominated by coarse mode         tration basis (Ricard et al., 2002). The frequency of wind-
over time, most likely due the result of increases in the rela-   blown dust events is projected to increase in the Arctic as a
tive amount of sea spray aerosol (Heslin-Rees et al., 2020).      consequence of the rapid and widespread retreat of glaciers
   Sea spray aerosol (SSA) is primarily generated from the        leading to more ice free terrain (proglacial fields or flood-
wave-breaking process, resulting in bubble bursting at the        plains where fine glaciofluvial sediment deposits are exposed
sea surface, and is a significant contributor to the Arctic       to wind) (Tobo et al., 2019; Bullard et al., 2016).
aerosol mass burden (Quinn et al., 2002; Fitzgerald, 1991).          Measuring supermicrometer aerosol in the Arctic is impor-
SSA originates from film drops (fragment of the collapsed         tant to understand the chemical nature of SSA and mineral
cap), jet drops (shot from the cavity formed after the bub-       dust, their potential sources, and their impacts on aerosol–
ble bursting) and spume drops (torn off the wave crest by         radiation and aerosol–cloud interactions in the rapidly chang-
sufficient high wind stress) (Feng et al., 2017; Quinn et al.,    ing Arctic. Several studies have measured supermicrometer
2015). The film drops are evaporated in the atmosphere and        aerosol in the Arctic environment using multi-stage cascade
generate submicrometer SSA, while the jet and spume drops         impactors combined with offline chemical analysis (Ghahre-
can produce supermicrometer SSA (O’Dowd et al., 1997).            maninezhad et al., 2016; May et al., 2016; Ricard et al., 2002;
According to size-resolved chemical composition of individ-       Li and Winchester, 1990) and using single-particle analysis
ual SSA reproduced in a laboratory facility, submicrometer        (Tobo et al., 2019; Kirpes et al., 2019; Yu et al., 2019; Kir-
SSA is overwhelmingly dominated by organic matter and sea         pes et al., 2018; Chi et al., 2015; Geng et al., 2010). These
salt mixed with organic matter, while supermicrometer SSA         measurements were typically carried out for short periods
mainly consists of sea salt and biological species (Prather       in a particular season and serving specific research ques-
et al., 2013). This suggests that understanding supermicrom-      tions, thus providing only limited understanding of the sea-
eter aerosol in the Arctic is of great value for understand-      sonal cycle of the supermicrometer aerosol in the Arctic. One
ing not only sea salt but also biological processes. Contrary     exception is the multiyear (2006–2009) measurements of
to other global oceans, in the Arctic sea salt can be gen-        submicrometer and supermicrometer aerosols by May et al.
erated from open water, open leads in the sea ice (Kirpes         (2016), who found that open leads contribute year-round to
et al., 2019; May et al., 2016) and salty blowing snow (Frey      local Arctic SSA emissions. The aerosol size distribution and
et al., 2020; Huang and Jaeglé, 2017). All sources can con-       seasonal and interannual variations of the supermicrometer

Atmos. Chem. Phys., 21, 11317–11335, 2021                                         https://doi.org/10.5194/acp-21-11317-2021
C. Song et al.: Differentiation of coarse-mode anthropogenic, marine and dust particles                                    11319

aerosol remain open questions due to the low time resolution
and the limited aerosol size bins.
   To improve the current understanding of the seasonal cy-
cle and interannual variations of the submicrometer and su-
permicrometer aerosols, as well as the roles of natural and
anthropogenic aerosols in the Arctic, in situ aerosol aerody-
namic size distributions up to 20 µm were measured from
2015 to 2019 at an hourly time resolution at a background
site in Svalbard, i.e., Gruvebadet. A k-means clustering tech-
nique was applied to the size distribution to separate major
aerosol types (Lachlan-Cope et al., 2020; Dall’Osto et al.,
2019; Freud et al., 2017; Beddows et al., 2014, 2009). In
addition, the aerosol size distributions are complemented by
aerosol chemical composition data from several online and
offline measurements to distinguish anthropogenic and natu-
ral aerosol types and their potential sources. This study adds
to our knowledge of supermicrometer aerosol in the rapidly       Figure 1. Monthly average aerosol volume size distribution from
changing Arctic, and it is a complement to the submicrome-       2015 to 2019. There are missing data in some months but good data
ter aerosol number size distributions in the European Arctic     coverage from March to June. No data are available in December.
presented by Dall’Osto et al. (2019). Future studies will look   Monthly average aerosol number size distribution measured by the
at receptor modeling of both aerosol size distributions and      APS during 2015–2019 is shown in Fig. A1.
chemical composition in the Arctic.

                                                                 resolution and then averaged into hourly observations. The
2     Materials and methods                                      raw data from PSAP were corrected according to Virkkula
                                                                 et al. (2005). Aerosol absorption coefficient is directly pro-
2.1    Sampling and measurements                                 portional to the concentration of equivalent black carbon
                                                                 (eBC) (Petzold et al., 2013), a marker of anthropogenic and
A total of 5 years (from 2015 to 2019) of aerosol sampling       wildfire emissions in the Arctic (Abbatt et al., 2019). De-
and measurements were carried out at the Gruvebadet (GVB)        tails regarding the PSAP and eBC measurements at the site
Observatory (78.918◦ N, 11.895◦ E; 61 m above mean sea           are described by Gilardoni et al. (2020). The APS and PSAP
level), located at about 800 m southwest of the village of Ny-   are attached to a same inlet, which has followed EUSAAR-
Ålesund in the Svalbard archipelago. In the northeastern di-     ACTRIS protocol since 2011 and runs about 4 m above the
rection towards the Ny-Ålesund research village, a clean area    ground. Further information can be found elsewhere (Lupi
was established and motorized activity and other potentially     et al., 2016).
contaminant activities were forbidden. The geographic loca-         Aerosol filter samples were collected daily from Febru-
tion of GVB and the dominant winds ensure minimal anthro-        ary 2015 to August 2018, using a Tecora SkyPost sequential
pogenic contamination from local emissions (Udisti et al.,       sampler equipped with a PM10 sampling head, operating fol-
2016) while also capturing long-range transported pollution      lowing the EN 12341 European protocol. PM10 was collected
air masses.                                                      on Teflon filters (Pall Corp., 47 mm diameter, 2 µm porosity,
   The aerosol size distribution was measured by an aero-        collection efficiency 99.6 %); 606 daily samples were ana-
dynamic particle sizer (APS; TSI model 3321, 52 chan-            lyzed, of which 570 samples overlapped with the aerosol size
nels) (Traversi et al., 2020). The APS spectrometer pro-         distribution measurements. Samples were handled in a clean
vides real-time aerodynamic measurements of particles from       room (class 10 000), under a laminar flow hood (class 100)
0.5 to 20 µm diameter. Typical single-channel uncertainty        to minimize contamination. Half of each filter sample was
in aerosol number concentration measured by the APS is           extracted in an ultrasonic bath (15 min) using ultrapure water
±10 % according to the specification sheets. The aerosol size    (MilliQ, 18 M cm, 12 mL) for subsequent analysis of inor-
                                                                                                        2−
distribution was usually measured from March to Septem-          ganic anions (Cl− , Br− , NO− 3 and SO4 ) and cations (Na ,
                                                                                                                              +
                                                                      +     +     2+         2+
ber (see Fig. 1), with approximately 21200 hourly observa-       NH4 , K , Mg and Ca ) and selected organic anions
tions in total from 2015 to 2019, corresponding to approx-       (methanesulfonate (MSA) and oxalate) on a three Dionex ion
imately 909 and 140 aerosol size distributions after averag-     chromatography (IC) system equipped with electrochemical-
ing to daily and weekly observations, respectively. Aerosol      suppressed conductivity detectors. The configuration of the
light absorption was simultaneously measured at three wave-      three IC system is described by Giardi et al. (2016) and Ud-
lengths (i.e., 467, 530 and 660 nm) by a particle soot absorp-   isti et al. (2016, 2012). Analytic uncertainty is typically be-
tion photometer (PSAP, Radiance Research) at a 1 min time        low 5 %.

https://doi.org/10.5194/acp-21-11317-2021                                      Atmos. Chem. Phys., 21, 11317–11335, 2021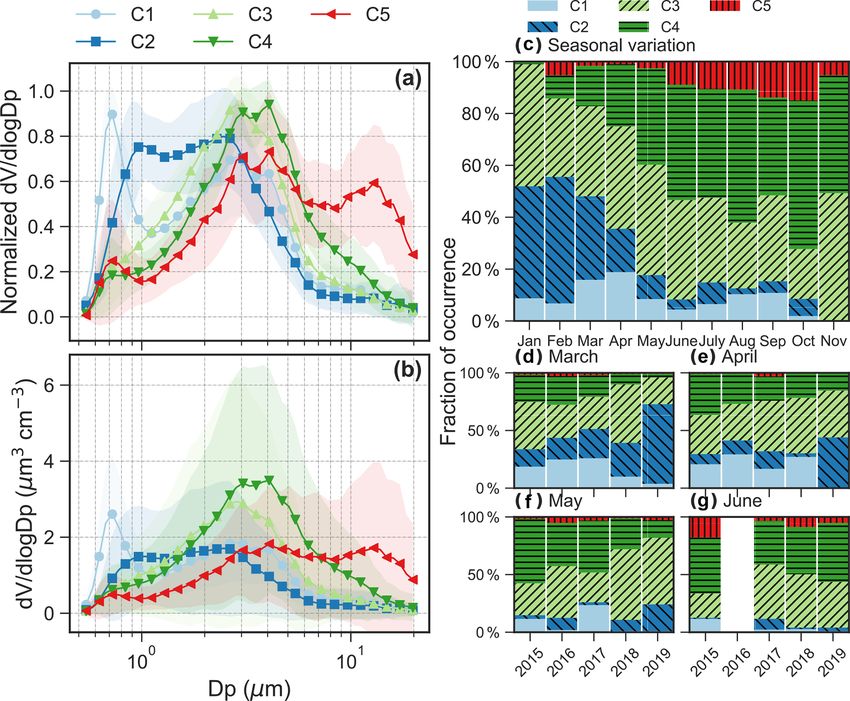
11320                              C. Song et al.: Differentiation of coarse-mode anthropogenic, marine and dust particles

   Meteorological parameters, including wind speed, wind
direction, relative humidity and ambient temperature, were
recorded hourly by a Vaisala thermo-hygrometer model              ss-Na+ = Na+ − nss-Ca2+ /1.78,                               (2)
HMP45AC and a Young Marine wind sensor model Wind                 nss-Ca 2+
                                                                              = Ca2+                   +
                                                                                       − 0.038 × ss-Na .                       (3)
Monitor 05106 at a height of 10 m (a.g.l.) on the Amundsen-
Nobile Climate Change Tower (Mazzola et al., 2016) in the            The sea salt fraction of sulfate (ss-SO2− 4 ) was calculated
neighborhood of Gruvebadet observatory.                           by multiplying the ss-Na+ (as a sea spray marker) concen-
                                                                  tration by 0.253 (indicating the SO2−         +
                                                                                                       4 / Na w/w ratio in sea
2.2    k-means cluster analysis
                                                                  water) (Bowen, 1979). The non-sea salt fraction of sulfate
Cluster analysis is commonly used to interpret particle num-      (nss-SO2−                                                 2−
                                                                            4 ) was calculated by subtracting the ss-SO4 con-
                                                                                                 2−
ber size distribution measurements (Lachlan-Cope et al.,          tribution from the total SO4 concentrations. The mineral
2020; Dall’Osto et al., 2019; Freud et al., 2017; Beddows         fraction of sulfate (mineral-SO2−  4 ) was estimated by mul-
et al., 2014, 2009). As we mainly focus on supermicrometer        tiplying the nss-Ca2+ content by 0.59 (SO2−      4 / Ca
                                                                                                                           2+ w/w
aerosol, we conduct cluster analysis of the aerosol volume        ratio in the uppermost part of Earth’s crust) (Guerzoni and
size distribution rather than aerosol number size distribution    Chester, 1996). It is worth noting that Ca in high-latitude dust
using a k-means clustering algorithm following a standard         may not be in the form of carbonate and thus will not be mea-
procedure by Beddows et al. (2014). The underlying prin-          surable as Ca2+ (McCutcheon et al., 2021; Baldo et al., 2020;
ciple of the k-means clustering is to minimize the sum of         Bachelder et al., 2020). Some studies also reported a low
squared Euclidean distances between each data point and the       amount of Ca-containing high-latitude dust (McCutcheon
corresponding cluster centers (the average spectra of the sub-    et al., 2021; Baldo et al., 2020; Bachelder et al., 2020). Thus,
group). This allows for dividing the whole dataset into a pre-    the nss-Ca2+ is a conservative tracer for mineral dust. Sulfate
defined number of subgroups that are as different as possible     formed by atmospheric oxidation of dimethylsulfide (DMS)
from each other and as coincident as possible within them-        from micro-algae, bio-SO2−   4 , was estimated by multiplying
selves.                                                           methanesulfonate (MSA) concentration by 3.0, which was
   To cluster the spectra modes irrespective of the magnitude     derived from the relationship between MSA and SO2−          4 at
of the concentrations, the aerosol size distributions were pre-   the same site by Udisti et al. (2016). In their study, they
processed using min–max normalization:                            used 136 PM10 samples from the spring–summer season of
                                                                  2014 to establish the MSA and bio-SO2−     4 relationship. The
           xi − min {xj }
                1≤j ≤n                                            anthropogenic fraction of sulfate (anthr-SO2−   4 ) in each sam-
yi =                           ,                           (1)
       max {xj } − min {xj }                                      ple is then estimated by subtracting the sum of the ss-SO2−   4 ,
       1≤j ≤n       1≤j ≤n
                                                                  mineral-SO2− 4  , and bio-SO  2−
                                                                                                4  fractions from   the total SO 2−
                                                                                                                                 4
where x and y are the absolute and normalized concentra-          concentration.
tions, respectively. The subscript i and j denote size bins,
and n is the number of size bins. The normalized concentra-       2.4   Back trajectories and potential source regions
tions were then clustered using k-means.
                                                                  The Hybrid Single Particle Lagrangian Integrated Trajectory
2.3    Source apportionment of sulfate                            (HYSPLIT 5.0.0) model (Stein et al., 2016) was used to cal-
                                                                  culate hourly backward trajectories arriving at an altitude of
Source apportionment of sulfate was carried out following         100 m (average mean sea level) at the GVB from 2015 to
Udisti et al. (2016) to understand potential sources of sul-      2019. The determination of the length of the back trajec-
fate for the identified aerosol clusters. We first apportion      tories is a compromise between the uncertainty in calcula-
Na+ and Ca2+ to sea salt and non-sea salt fractions. In gen-      tion, which increases with time, and the typical lifetime of
eral, Na+ and Ca2+ are considered proxies for sea salt and        aerosol in the Arctic, which is usually between 3 and 8 d for
mineral dust, respectively. However, a small amount of Na+ -      black carbon (Stohl, 2006) and up to 39 d during Arctic haze
containing aerosol in remote regions could be brought in by       (Baskaran and Shaw, 2001). In the present study, a 7 d air
non-sea salt sources and some fractions of Ca2+ -containing       mass backward trajectory was chosen.
aerosol originate from sea spray (Salter et al., 2016; Bigler        The HYSPLIT back trajectories provide a detailed history
et al., 2006). Assuming a Ca2+ / Na+ ratio (w/w) of 0.038         of the air parcels, including latitude, longitude, altitude and
for sea water and 1.78 for mineral dust (Bowen, 1979), the        the height of the mixing layer (ML). The back trajectories
measured total Na+ and Ca2+ can be apportioned to a sea           are divided into above or below the mixing layer height.
salt (ss) fraction and a non-sea salt (shortened to nss) frac-    Daily surface types in the Northern Hemisphere were ob-
tion calculated by                                                tained from the National Ice Center’s Interactive Multisen-
                                                                  sor Snow and Ice Mapping System (IMS) (U.S. National Ice
                                                                  Center, 2008), National Snow & Ice Center. The IMS map of

Atmos. Chem. Phys., 21, 11317–11335, 2021                                            https://doi.org/10.5194/acp-21-11317-2021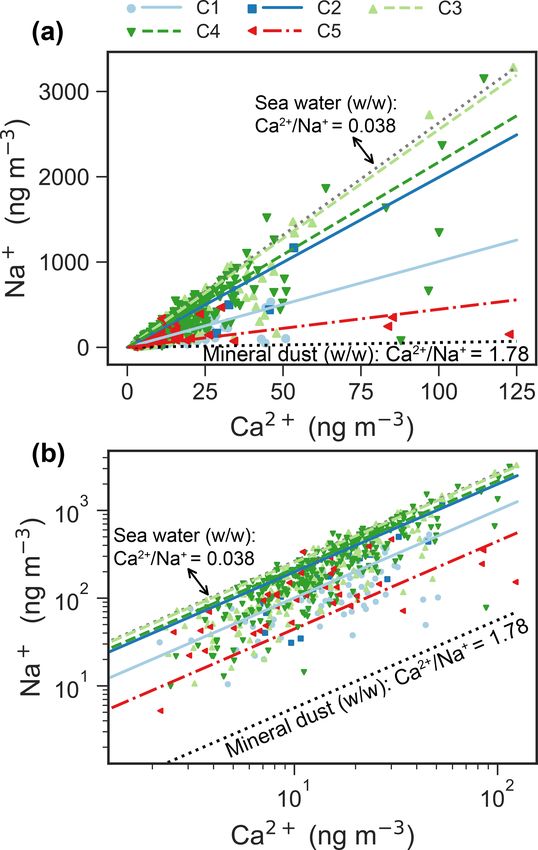
C. Song et al.: Differentiation of coarse-mode anthropogenic, marine and dust particles 11321
the Northern Hemisphere classified each of 1024 × 1024 grid of clusters that are compact, with a small variance between
cells (24 km spatial resolution) as sea, land (without snow), members of the cluster, and well separated, where the cluster
sea ice or snow-covered land (snow). The daily surface types centers are sufficiently far apart, as compared to the within
are temporally allocated with the back trajectories. Each data cluster variance. A higher DI indicates better separated clus-
point from the hourly back trajectories is labeled as (1) sea, ters. SW refers to a method of interpretation and validation
(2) sea ice, (3) snow, (4) land or (5) above ML. of consistency within clusters of data. A high SW indicates
The potential source contribution function (PSCF) values that an individual spectrum is well matched to its own clus-
were calculated using the “openair” package in R (Carslaw ter and poorly matched to neighboring clusters. For a given
and Ropkins, 2012) to identify the potential geographic ori- assignment of clusters, higher DI and SW values indicate
gins of each aerosol cluster. The geographic region covered better clustering results. According to the DI and SW val-
by the back trajectories was divided into 1◦ × 1◦ grid. The ues versus cluster numbers (Fig. A2), five- and seven-cluster
PSCF value is calculated by solutions appear to be the two promising solutions. For the
seven-cluster solution, we observed an obvious increase in
PSCFi,j = mi,j /ni,j Wi,j , (4) the DI value but a decrease in the SW value compared to
where ni,j is the total number of endpoints that fall in the those from the five-cluster solution, suggesting that some of
i, j th cell, and mi,j is defined as the number of endpoints the clusters in the seven-cluster solution tend to be similar
in the same cell that exceed the threshold criterion. In the to neighboring clusters. Figure A3 illustrates that the C3 to
present study, the 75th percentile of total volume concentra- C6 aerosol categories overlapped with each other and are not
tion for each cluster was used as the criterion value. A higher well separated, especially when taking into account the stan-
ratio of mi,j /ni,j indicates a higher probability of a particu- dard deviation. The five-cluster solution is able to overcome
lar grid through which a passing air parcel would result in a the overlapping issues and thus was chosen in the present
higher concentration at the receptor (Zeng and Hopke, 1989). study.
Wi,j is an empirical weight function to reduce the uncertainty Note that the five clusters (C1, C2, C3, C4 and C5) were
of mi,j /ni,j for the cells with ni,j less than 2 times the grid ranked by the main aerodynamic diameter of the peak con-
average number of the trajectory endpoint (2 × nave ). centration in the average spectrum from small to large diam-
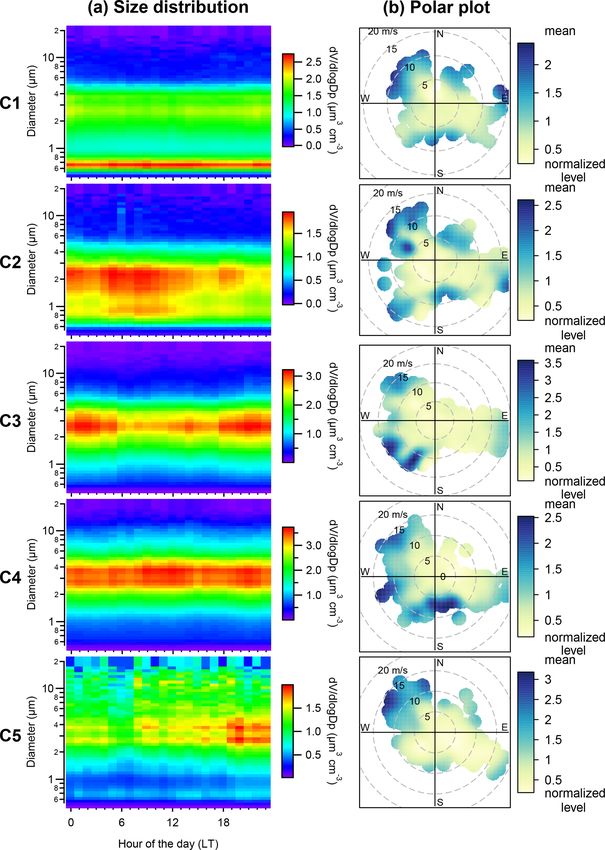
eters for C1 to C5 (Fig. 2). Figure 3 shows the daily temporal
trends and the polar plots of the five aerosol clusters. The
1.0, ni,j > 2nave
aerosol types are characterized as follows.
0.75, nave < ni,j ≤ 2nave
Wi,j = (5)
0.5, 0.5n ave < n i,j ≤ nave – C1, which occurs 9.3 ± 5.1 % (µ ± σ , average from
0.15, 0 < ni,j ≤ 0.5nave monthly occurrence frequency) of the time. C1 presents
a bimodal size distribution with a dominant peak in the
accumulation mode at ∼ 0.7 µm and a lower peak at
3 Results ∼ 3 µm (Figs. 2a–b and 3a). The predominant months
were March (15.9 %) and April (18.8 %), i.e., in spring
Figures 1 and A1 show the monthly average aerosol volume
(Fig. 2c). The relative contribution from different re-
and number size distributions from 2015 to 2019, respec-
gions to back-trajectory air parcels for C1 is simi-
tively. The peaks of monthly average number size distribu-
lar to that in March and April, which is characterized
tions all occurred in the accumulation mode and the number
by the highest fraction of historical air parcels above
concentration (dN/d log Dp) of the peaks are usually below
mixing-layer height among the five clusters or all sea-
10 cm−3 (Fig. A1). For volume size distribution, bimodal or
sons (Fig. A4a).
trimodal size distributions are often observed throughout the
years. The highest concentration was found at 2–4 µm diame-
– C2, which occurs 17.6 ± 17.4 % of the time. C2 shows
ter, regardless of season. A second peak was observed in the
a bimodal size distribution with peaks at ∼ 0.9 and 2–
submicrometer mode at 0.6–0.8 µm diameter, more promi-
3 µm (Figs. 2a–b and 3a). The concentration in the ac-
nent from March to May.
cumulation mode was lower but with a slightly larger
3.1 Characterization of the k-means derived aerosol diameter (∼ 1 µm) compared to C1. The predominant
types months are from January (43.2 %) to March (32.2 %),
i.e., in winter and early spring (Fig. 2c). C2 has the sec-
The k-means cluster analysis of aerosol volume size distribu- ond highest fraction of air masses above mixing-layer
tions was performed using 909 daily spectra collected from height (Fig. A4a).
2015 to 2019. The determination of the most appropriate
number of clusters is critical. Here, the Dunn Index (DI) and – C3, which occurs 34.2 ± 8.2 % of the time. The size dis-
silhouette width (SW) were calculated for cluster numbers tribution is dominated by the coarse mode with a peak
ranging from 2 to 15 (see Fig. A2). DI is to identify sets at ∼ 3 µm (Figs. 2a–b and 3a). C3 occurred throughout
https://doi.org/10.5194/acp-21-11317-2021 Atmos. Chem. Phys., 21, 11317–11335, 2021
11322                                 C. Song et al.: Differentiation of coarse-mode anthropogenic, marine and dust particles

Figure 2. (a) Normalized and (b) absolute aerosol volume size distributions for the five clusters. Shaded area for the size distribution shows 1
standard deviation. (c) Seasonal variation in relative abundance of the five clusters. Interannual variation in the relative abundance from 2015
to 2019 in the months of (d) March, (e) April, (f) May and (g) June. We only show the interannual variation from March to June because
these months have good data coverage in 2015–2019.

     all seasons, with a relative contribution ranging from               Table 1. Occurrence and key species for the five clusters.
     19.2 % in October to 49.3 % in November (Fig. 2c).
                                                                                    Occurrence           Key species
  – C4, which occurs 32.0 ± 18.7 % of the time. The size
                                                                             C1     9.3 ± 5.1 %          eBC, sulfate, ammonium, oxalate
    distribution is dominated by the coarse mode, with
                                                                             C2     17.6 ± 17.4 %        eBC, sulfate, ammonium, sea salt species∗
    a peak diameter of 3-4 µm (Figs. 2a–b and 3a). The                       C3     34.2 ± 8.2 %         Sea salt species∗ , MSA
    average peak concentration for C4 is slightly higher                     C4     32.0 ± 18.7 %        Sea salt species∗ , MSA
    and with a slightly larger diameter compared to C3.                      C5     6.9 ± 5.5 %          High ratio of Ca2+ / Na+
    This cluster dominated over other clusters from June to
                                                                          ∗ Sea salt species here refers to Na+ , Cl− and Mg2+ .
    November (Fig. 2c).
  – C5, which occurs 6.9 ± 5.5 % of the time. C5 shows
    a trimodal distribution with a peak in the accumula-                  terannual variations of fraction of occurrence from March to
    tion mode at ∼ 0.7 µm and in the coarse mode at 3–                    June are also shown in Fig. 2d–g. No clear interannual pat-
    4 and 12–14 µm (Figs. 2a–b and 3a). The predomi-                      terns were observed for the aerosol clusters identified. The
    nant months are from June (8.9 %) to October (15.0 %)                 polar plots show that high concentrations of the five clus-
    with warm temperature, low relative humidity and high                 ters were typically found when wind speed was higher than
    wind speed (Fig. A5), i.e., in summer and early autumn.               5 m s−1 (Fig. 3a), which is consistent with the probability
    These months also received relatively high fractions of               density distribution of the wind speed for aerosol volume
    air parcels spent above lands (Fig. A4a–b).                           concentrations exceeded their 90th-percentile values within
                                                                          each cluster (Fig. A5).
   The occurrence of the five clusters and the key chemical
species associated with each cluster are summarized in Ta-
ble 1. Note that the relative occurrences of the clusters are
limited to the study period (mainly from March to October),
and thus with limited coverage of the winter season. The in-

Atmos. Chem. Phys., 21, 11317–11335, 2021                                                       https://doi.org/10.5194/acp-21-11317-2021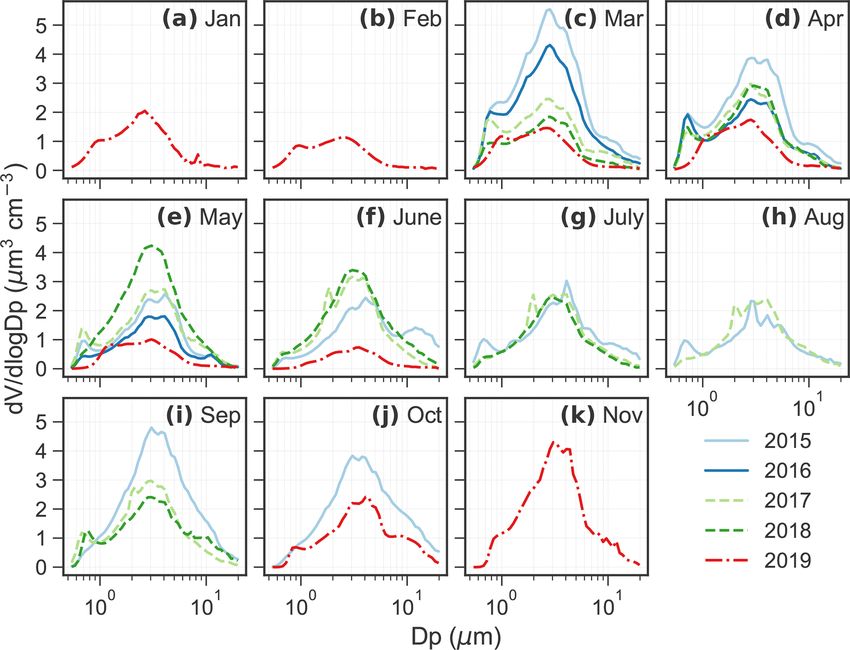
C. Song et al.: Differentiation of coarse-mode anthropogenic, marine and dust particles                                               11323

Figure 3. (a) Diurnal variation of the mean of the aerosol volume size distribution and (b) polar plots of total volume concentration for the
five aerosol clusters. Polar plots show that the average concentrations vary by wind speed and wind direction. The color scale of the polar
plot is the average concentration level normalized by dividing by the mean value from each cluster.

3.2   Relationship of aerosol clusters and chemical                      Absorption coefficients were relatively low for C3–5 com-
      components                                                         pared to C1 and C2 (see Fig. 5b). MSA (Fig. 4k), Na+
                                                                         (Fig. 4d) and Cl− (Fig. 4e) were enriched in C3. C4 showed
Figures 4 and 5 present average concentrations of each chem-             an enhanced concentration in MSA (Fig. 4k), Na+ (Fig. 4d)
ical species and absorption coefficients for the identified              and Cl− (Fig. 4e), whereas C5 was characterized by low-
                                                                                                                                      2−
clusters, respectively. Absorption coefficients (Fig. 5b), ox-           est K+ (Fig. 4a), NH4+                  −
                                                                                                 4 (Fig. 4f), NO3 (Fig. 4g) and SO4
alate (Fig. 4j), total SO2−                  +                           (Fig. 4h). The relationship between C1–5 and the absorption
                         4 (Fig. 4h) and NH4 (Fig. 4f) were
enhanced for C1. These components are also enriched in C2,               coefficient is shown in Fig. 5b. Clearly, the absorption coeffi-
along with Na+ (Fig. 4d), Cl− (Fig. 4e) and Br− (Fig. 4i).

https://doi.org/10.5194/acp-21-11317-2021                                               Atmos. Chem. Phys., 21, 11317–11335, 2021
11324                                C. Song et al.: Differentiation of coarse-mode anthropogenic, marine and dust particles

Figure 4. Box plot of mass concentration (unit: ng m−3 ) of each
chemical species for the identified clusters. The mean values are
marked as triangles.

                                                                        Figure 6. Scatter plot (a: linear scale; b: log scale) of daily Na+
                                                                        versus Ca2+ mass concentrations for each cluster. The ratios of
                                                                        Ca2+ / Na+ from sea water and Earth’s crust are denoted by dot-
                                                                        ted lines. The scatter points are usually in the ranges of ratios of sea
                                                                        water and Earth’s crustal (Bowen, 1979). The reduced major axis
                                                                        (RMA) regression between Na+ and Ca2+ for each cluster is su-
                                                                        perimposed onto the figure. The parameters of the regressions are
                                                                        listed in Table A1.

                                                                        Na+ in sea water and in the Earth’s crust (Eqs. 2–3). Figure 6
                                                                        shows a scatter plot of Ca2+ versus Na+ for the clusters, in-
                                                                        cluding Ca2+ / Na+ ratios for sea water (0.038, w/w) and
                                                                        the Earth’s crust (1.78, w/w). The regression line of Na+
                                                                        and Ca2+ for C5 is close to the “mineral” ratio, whereas it
                                                                        is closer to the sea water ratio for C2–4. Note that the Na+
                                                                        and Ca2+ regression line for C3 fits very well with that in
                                                                        sea water. The regression line for C1 is in the middle of the
                                                                        mineral ratio and the sea water ratio.
                                                                           The apportioned ss-SO2−                    2−
                                                                                                     4 , mineral-SO4 , bio-SO4 ,
                                                                                                                                   2−
                                                                                  2−
                                                                        anthr-SO4 and sea salt aerosol (Fig. 7) further improve
                                                                        our understanding of the aerosol cluster-associated sources.
                                                                        C2–4 were enhanced with respect to ss-SO2−  4 , ranging from
Figure 5. (a) Seasonal variation of absorption coefficient (σabs ) at   66.1 ng m−3 in C2 to 78.9 ng m−3 in C4, as well as SSA
wavelengths of 467, 530 and 660 nm in 2015–2019, and (b) boxplot        (ranging from 853.4 ng m−3 in C2 to 1019.2 ng m−3 in C4).
of absorption coefficient at the three wavelengths for each cluster.
                                                                        A high bio-SO2− 4 fraction was observed in C3 (86.2 ng m )
                                                                                                                                  −3
The mean values are marked as triangles.
                                                                        and C4 (61.6 ng m−3 ), whereas mineral-SO2−    4 is elevated
                                                                        in C1 (7.7 ng m−3 ) and C5 (7.9 ng m−3 ). The anthr-SO2−    4
cient for C1–2 was enhanced in comparison to that for C3–5.             level decreased from C1 (763.8 ng m−3 ) to C5 (49.7 ng m−3 ).
We will discuss these results in detail in Sect. 4.                     Anthr-SO2− 4 contributes to 34.4 % in C5 to 91.7 % in C1.
   Na+ and Ca2+ are usually apportioned to a sea salt and a
non-sea salt fractions using characteristic ratios of Ca2+ and

Atmos. Chem. Phys., 21, 11317–11335, 2021                                                 https://doi.org/10.5194/acp-21-11317-2021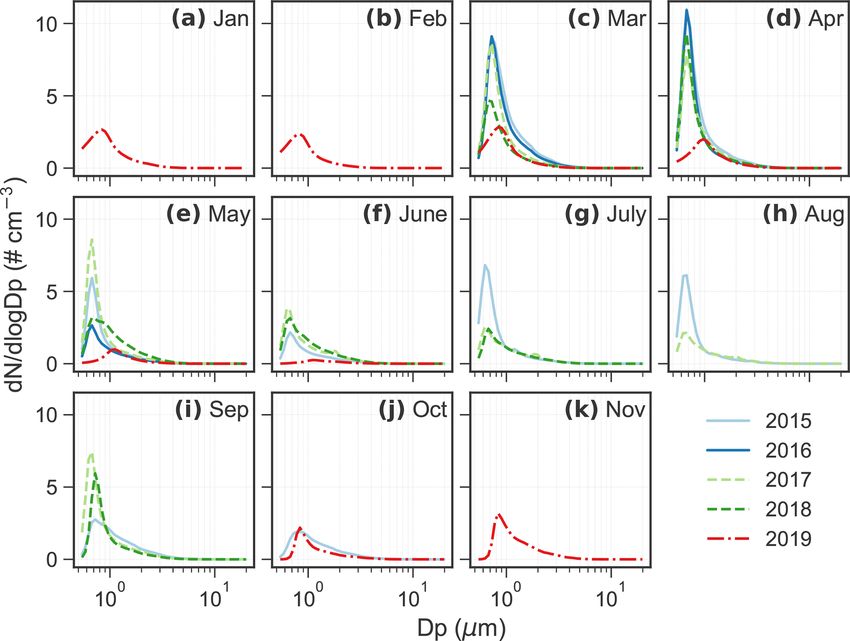
C. Song et al.: Differentiation of coarse-mode anthropogenic, marine and dust particles                                           11325

Figure 7. Box plot of (a) sea salt SO2−       2−                  2−               2−                   2−         2−
                                     4 (ss-SO4 ), (b) mineral SO4 (mineral-SO4 ), (c) biogenic SO4 (bio-SO4 ), (d) anthropogenic
   2−            2−
SO4 (anthr-SO4 ) and (e) sea salt for each cluster. The (e) sea salt aerosol is calculated by multiplying the ss-Na+ by a factor of 3.248
(Kerminen et al., 2000; Brewer, 1975). The mean values are marked as triangles.

3.3    Potential source areas of the aerosol clusters                  4.1.1   C1: anthropogenic Arctic haze

The PSCF probability map (Fig. 8) for C1 illustrates that air          The distinct peaks of C1 are typical modes of Arctic haze
mass origin was mainly from northeastern Russia (lat > 60◦ ).          (Radke et al., 1984). The high occurrence of C1 in March and
Potential geographical source regions of C2 are more com-              April is consistent with typical months of springtime Arctic
plex and likely distributed in northern Eurasia (lat > 60◦ ),          haze (Abbatt et al., 2019), which have the highest absorp-
the western and northern coasts of Greenland, the Norwe-               tion coefficient (Fig. 5a). C1 is characterized by the high-
gian Sea, the Barents Sea and the North Sea (lat > 55◦ ). In           est eBC (Fig. 5b), sulfate (total sulfate, particularly anthro-
contrast to C1–2, several regions of elevated probability for          pogenic sulfate, Figs. 4h and 7d) and ammonium (Fig. 4f)
C3 appear in open-sea and open-ocean regions (lat > 55◦ ),             among the five clusters. These chemical species are usually
including the Norwegian Sea, the North Atlantic Ocean, the             abundant in Arctic haze (Adachi et al., 2021; Law and Stohl,
Barents Sea, the Kara Sea and Baffin Bay. C4 is likely associ-         2007; Quinn et al., 2007) and found to be mainly related to
ated with both land and snow (e.g., Greenland, northern Eu-            the accumulation mode aerosol (Tunved et al., 2013; Porter
rope, northwestern Russia) and sea and ocean regions (e.g.,            and Clarke, 1997; Radke et al., 1984). This is supported by
the Greenland Sea, the Norwegian Sea, the North Atlantic               the highest concentrations in the accumulation mode of C1
Ocean, the Barents Sea, Baffin Bay). C5 exhibits high PSCF             compared to the other clusters (Fig. 2b). Thus, C1 is domi-
values near the western and northern coasts of Greenland               nated by anthropogenic Arctic haze.
(e.g., the Kangerlussuaq area), northern Eurasia, and north-
ern Alaska. For the whole aerosol population, high PSCF val-           4.1.2   C2: anthropogenic wintertime Arctic haze
ues were broadly observed in the surrounding sea and ocean
regions and occasionally observed in land and snow regions             C2 shows a similar size distribution to that of C1 (Fig. 2a)
(e.g., northern Eurasia and Greenland). Note that potentially          but with a much lower concentration in the accumulation
local sources can not be captured by the back-trajectory anal-         mode, which is still higher than those in the other clusters
ysis.                                                                  (Fig. 2b). Compared to the other clusters, C2 has intermedi-
                                                                       ate concentrations of eBC (Fig. 5b), sulfate (particularly an-
                                                                       thropogenic sulfate, Fig. 7d) and ammonium (Fig. 4f). The
4     Discussion                                                       main differences relative to C1 are a temporal trend towards
                                                                       colder January–March months (Fig. 2c) and an abundance of
4.1    Dominant sources of the aerosol clusters                        sea salt. PSCF maps also point to the Greenland coast and
                                                                       Northern Europe as potential source regions (Fig. 8), likely
The dominant source for each aerosol cluster that distin-              associated with industrial activities. In summary, whilst C1
guishes the aerosol clusters from each other was identified            is mainly associated with the typical Arctic haze with sulfate
based on (1) volume size distribution, (2) chemical compo-             and eBC-rich aerosols (9.3 %), industrial activities may also
nents, (3) seasonality in occurrence of the clusters and (4) po-       be an important source of anthropogenic aerosols (17.6 %) in
tential source maps. It is possible that each cluster does not         winter in the Arctic. In addition, wintertime Arctic haze at
represent a pure source but contain signals of other aerosol           the site is more likely mixed with SSA since the occurrence
sources. In the following contents, sources of aerosol clus-           fraction of C2 is above twice that of C1.
ters refer to the sources that distinguish the aerosol clusters
from each other.

https://doi.org/10.5194/acp-21-11317-2021                                             Atmos. Chem. Phys., 21, 11317–11335, 2021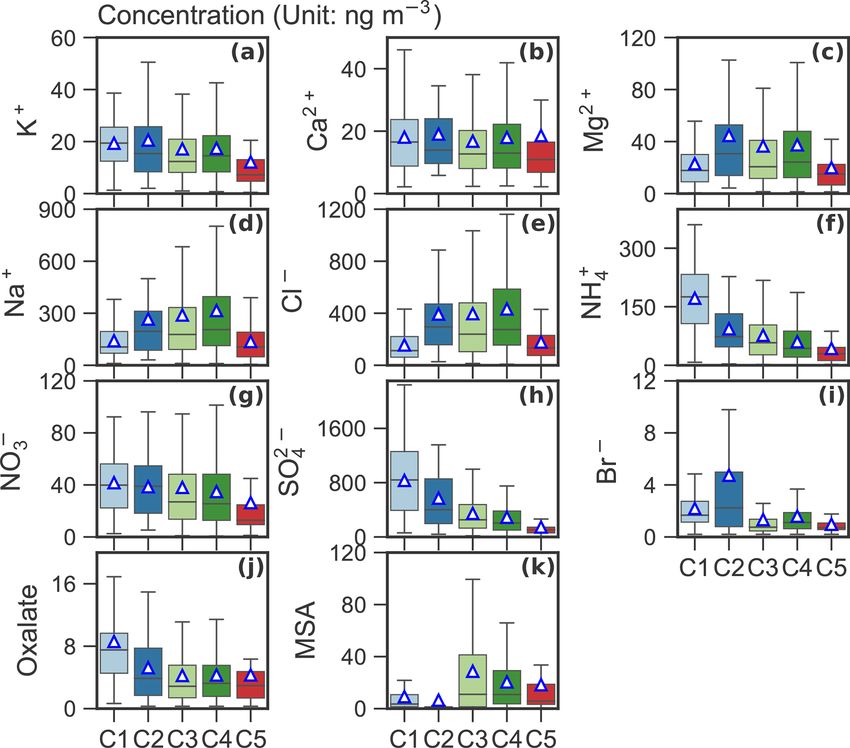
11326                               C. Song et al.: Differentiation of coarse-mode anthropogenic, marine and dust particles

Figure 8. Potential source contribution function (PSCF) map for each cluster and all data. The GVB station is denoted as a black dot on the
map.

4.1.3   C3: sea spray aerosol                                           consistency might be due to the mixture of sea spray and
                                                                        biogenic sources. Ricard et al. (2002) reported that MSA
                                                                        has two submicrometer modes (∼ 0.3 and ∼ 0.7 µm) and one
The average size distribution of C3 is similar to that of sea           supermicrometer mode (∼ 2 µm) between 43 nm and 20 µm
salt species (e.g., Na+ , Cl− and Mg2+ ), which are gener-              in summer of the marine environment. These modes are in
ally dominated by a supermicrometer mode (Morawska et al.,              agreement with those for wintertime sea salt aerosol (Ricard
1999; Porter and Clarke, 1997) with a peak at ∼ 4 µm in sum-            et al., 2002). The PSCF map also shows that C3 aerosols are
mer (Dall’Osto et al., 2006; Ricard et al., 2002; Wall et al.,          likely coming from surrounding ocean and sea ice (Fig. 8c),
1988) and a peak between 2 and 3 µm (more close to 3 µm)                where sea salt and MSA originate. In addition, the ambi-
in the winter in the marine environment (Ricard et al., 2002).          ent temperatures for C3 exceeded their 90th-percentile value
In addition, the average size distribution of C3 (Fig. 2a–b)            present a bimodal pattern (Fig. A5) with two modes of cold
agrees well with that of sea salt aerosol observed in Antarc-           temperature at ∼ −5 ◦ C and warm temperature at ∼ 5 ◦ C,
tic (Fan et al., 2021). High loadings of sea salt (Fig. 7e) and         respectively. The wind speeds for C3 exceeded their 90th-
their associated species (Fig. 4c–e) and the average ratio of           percentile value and have bimodal distribution with peaks
Na+ / Ca2+ (Fig. 6) for C3 further indicate that C3 is asso-            around 2 and 10 m s−1 , which may suggest that local and
ciated with SSA. MSA and apportioned bio-SO2−       4 are also          long-range-transported sea spray aerosol are both important.
enriched in C3 (Figs. 4k and 7c).                                       Thus, this cluster is associated with sea spray aerosols com-
   Arctic MSA has been reported to be abundant in late                  ing from marine open ocean, likely co-existing with sec-
spring and in summer (Becagli et al., 2019; Sharma et al.,              ondary MSA-containing biogenic aerosol.
2019), but C3 does not show the same seasonality. This in-

Atmos. Chem. Phys., 21, 11317–11335, 2021                                                https://doi.org/10.5194/acp-21-11317-2021
C. Song et al.: Differentiation of coarse-mode anthropogenic, marine and dust particles 11327
4.1.4 C4: unidentified sea spray-related aerosol tic aerosol is driven by many aspects, such as the annual
cycle in Arctic sea ice, temperature, radiation, atmospheric
The average size distribution of C4 is quite similar to that oxidants, cloud properties, and seasonally varying transport
of C3 but with an enhancement at larger diameters and a and removal mechanisms (Abbatt et al., 2019; Willis et al.,
lower average ratio of Na+ / Ca2+ (Fig. 6). The main differ- 2018). In this study, potential drivers of the coarse-mode
ences relative to C3 are more sea salt mass (Figs. 2a and 7e) anthropogenic aerosol and natural aerosol are discussed in
and more source contribution from Greenland (Fig. 8d). The Sect. 4.2.1 and 4.2.2.
PSCF map for C4 is quite different compared to C3 (Fig. 8),
suggesting that drivers of C4 might be different from those 4.2.1 Coarse-mode anthropogenic aerosol
of C3. Specifically, potential sources of C4 are in shorter
distance than C3 and are observed largely from Greenland High occurrences of C1–2 in winter and early spring suggest
(Fig. 8), which is mostly covered by snow throughout the that anthropogenic sources are a predominant contributor
year. to Arctic haze, particularly for accumulation-mode aerosol
The ratio of Ca2+ / Na+ suggests that C4 is more likely (Fig. 2a–b). According to the chemical composition of C1-2,
associated with SSA compared to mineral dust (Fig. 6). Note Arctic haze contains a large fraction of eBC (Fig. 5b), sulfate
that a few samples of C4 in Fig. 6 tend to be mineral dust, (particularly anthropogenic sulfate, Figs. 4h and 7d), ammo-
especially for samples with high concentration of Ca2+ . This nium (Fig. 4f) and oxalate (Fig. 4j), implying that both pri-
may suggest a possible source of uplifted snow with mineral mary and secondary sources (including secondary inorganic
dust that was deposited on the snow surface. C4 also shows and organic aerosols) contributed to the Arctic haze. On aver-
a higher relative abundance in the months of September– age, the contributions of anthropogenic sources to total sul-
November (Fig. 2c). Therefore, C4 is considered unidenti- fate were 91.7 % for C1 and 84.1 % for C2, which are al-
fied sea spray aerosol, possibly short-distance sea spray, or most twice as high as those for the other clusters (ranging
a mixture of sea spray and blowing snow. More research is from 34.2 % for C5 to 52.7 % for C3) (Fig. 7). According
needed to better understand the potential sources of C4. to the PSCF maps of C1–2 (Fig. 8a–b), long-range transport
from northern Eurasia to Arctic regions might be mainly re-
4.1.5 C5: mineral dust sponsible for the anthropogenic aerosol in winter and spring.
High contributions from air parcels above the mixing layer
C5 has distinct peaks in the coarse modes (Fig. 2a–b) point- for C1–2 also support the critical role of long-range trans-
ing towards dust sources (Denjean et al., 2016; Ricard et al., port (Fig. A4a). It is suggested that meteorological condi-
2002; Porter and Clarke, 1997). C5 occurs usually from June tions during the Arctic haze period are conducive to long-
to October, which are the months with frequent dust emis- range transport from northern Eurasia to the Arctic (Willis
sions from Svalbard and/or high-latitude sources (Tobo et al., et al., 2018; Law and Stohl, 2007). Furthermore, the polar
2019). The ratio of Ca2+ / Na+ (Fig. 6) and the mineral frac- front could extend to about 40◦ N in winter to include indus-
tion of sulfate (Fig. 7b) for C5 further indicate a mineral trial emissions that can be transported into the High Arctic,
dust source. According to the PSCF map (Fig. 8e), C5 very thus leading to the presence of industrial sources in the win-
likely originated from typical dust sources at high-latitude tertime Arctic aerosol (Law and Stohl, 2007).
ice-free terrain (proglacial fields or floodplains where fine However, C2 contains a sea salt fraction (Figs. 6–7).
glaciofluvial sediment deposits are exposed to wind), such Prather et al. (2013) showed that submicrometer sea spray
as the western and northern coasts of Greenland (e.g., the aerosol consists of two externally mixed particle types, sea
Kangerlussuaq area), northern Eurasia, and coastal Alaska salt mixed with organic carbon and organic aerosol with-
(Tobo et al., 2019; Groot Zwaaftink et al., 2016; Bullard out chloride, based on transmission electron microscopy with
et al., 2016; Crusius et al., 2011). Note that C5 has one simi- energy-dispersive X-ray analysis. Yu et al. (2019) found that
lar mode (∼ 3–4 µm diameter) to C3–4, which might suggest sulfate and organic matter are often internally mixed based
that C5 is a mixture of mineral dust and sea salt. The consid- on individual particles (100 nm to 2 µm) collected in the Sval-
erable fractions of air parcels spent over land and sea or sea bard Archipelago in summer. Thus, the enrichment of eBC,
ice for C5 (Fig. A4) further indicate the possibility of mix- sulfate, organic aerosol and sea salt in C2 is likely due to the
ture of mineral dust and sea salt, which has been reported by chemical mixing state of the particle size ranges, leading to
Geng et al. (2010). a mixed anthropogenic and natural aerosol, which is a transi-
tion mode driven by both Arctic haze and sea spray.
4.2 Drivers of coarse-mode aerosols in the Arctic
4.2.2 Coarse-mode natural aerosol
In the present study, Arctic aerosol is characterized by preva-
lent Arctic haze between winter and late spring, biogenic The drivers of natural aerosol in the Arctic are even more
aerosol and mineral dust during warm seasons and sea spray complex than those of anthropogenic aerosol, mainly be-
aerosol throughout all seasons. The seasonal cycle in the Arc- cause of various natural sources. Our analysis identified three
https://doi.org/10.5194/acp-21-11317-2021 Atmos. Chem. Phys., 21, 11317–11335, 202111328 C. Song et al.: Differentiation of coarse-mode anthropogenic, marine and dust particles
main natural sources, including open ocean sea spray aerosol Arctic appears to be related to sea ice retreat, but the in-
(Figs. 2a and 6 and 7e and 8c), unidentified source of sea- terannual trend in MSA concentration is likely to be driven
spray-related aerosol (Figs. 2a, 6, 7e and 8d) and mineral by the extent of the ice-free marginal zone (Becagli et al.,
dust (Figs. 2a, 6, 7 and 8e). These natural aerosols domi- 2019, 2016).
nated the Arctic aerosol population with a fraction of > 50 % Mineral dust was identified as another natural aerosol
throughout all seasons, and with a much higher fractions of mainly in C5. Mineral dust aerosol appears to originate from
> 80 % in summer and autumn than those during the Arc- dust sources at high-latitude ice-free terrain (Fig. 8e) in warm
tic haze period (Fig. 2b). Warm seasons facilitate the pro- seasons (Fig. A5d). Unfortunately, geological minerals were
duction of natural aerosols in many ways, such as enhanced not reconstructed in the present study due to lack of measure-
marine primary production (Becagli et al., 2016), biogenic ments of mineral elements. Measurements of metal elements
new particle formation and growth (Lange et al., 2019, 2018; at the station are urgently needed in future studies to bet-
Dall’Osto et al., 2018, 2017) as well as high-latitude dust ter understand the mineral dust in the High Arctic (Becagli
source emissions (Tobo et al., 2019; Groot Zwaaftink et al., et al., 2020; Moroni et al., 2015). Furthermore, mineral dust
2016; Bullard et al., 2016). In addition, high fractions of air is often mixed with sea salt in C5, which makes it difficult to
parcels spent over land and open ocean were observed in quantify absolute contributions from mineral dust to C5.
warm seasons (Fig. A4b), which could facilitate generation
of mineral dust and sea spray aerosol.
Notably, C3–4 comprised the largest fraction of the aerosol 5 Conclusions
population throughout all seasons (Fig. 2b), suggesting that
In summary, we have reported relatively long-term (2015–
SSA is ubiquitous in the High Arctic regardless of season.
2019) measurements of aerosol aerodynamic volume size
The production of sea salt has been attributed to various me-
distributions up to 20 µm in the High Arctic for the first time.
chanical processes, such as wind-driven sea spray and bubble
Our results provide insights into supermicrometer aerosol
bursting from open ocean (Quinn et al., 2015), leads (Kirpes
properties and their potential sources around at an Arctic site
et al., 2019; May et al., 2016), or wind-blown snow (Huang
in Svalbard, particularly sea spray aerosol, MSA-containing
and Jaeglé, 2017). The prevalence of C3 in all seasons and
biogenic aerosol and mineral dust. The study elucidated five
the closest ratio of Ca2+ / Na+ to sea water (Fig. 6) provide
main aerosol volume size distributions and their natural and
compelling evidence that it is driven by open-ocean emis-
anthropogenic sources in the High Arctic, which may help
sion. More studies are needed to elucidate the underlying
us to better understand the complex interactions and feed-
drivers of the occurrence of C3 throughout all seasons.
backs between aerosol, cloud, radiation, and air–sea dynamic
MSA-containing biogenic aerosol was observed mainly
exchange and biota (Abbatt et al., 2019; Willis et al., 2018;
in C3–4 (Figs. 4k and 7c). Lin et al. (2012) found that
Browse et al., 2014). Our study shows that about two-thirds
MSA constitutes a major fraction of total aerosol sulfate over
of the coarse-mode aerosols are related to two sea-spray-
the remote ocean by means of isotope analysis. However,
related aerosol clusters, indicating that sea spray aerosol –
their analysis was based on submicrometer-mode (< 1 µm)
commonly assumed to be a known source from open ocean
aerosol. Our study suggests that a fraction of MSA could oc-
– may be more complex in the Arctic environment. Further
cur in the coarse mode and is not entirely in the submicrom-
studies – both ambient and laboratory-based – are strongly
eter fraction. The fractions of biogenic sulfate in total sulfate
needed to understand sea spray sources. Measurements of
for C3 (∼ 24.6 %) and C4 (∼ 21.2 %) were much higher than
metal elements up to coarse mode are encouraged in fu-
those for anthropogenic Arctic haze (i.e., ∼ 3.3 % for C1 and
ture studies to better understand local and transported min-
∼ 3.4 % for C2) but were lower than that of anthropogenic
eral dust and anthropogenic pollution (e.g., industrial activity
sulfate (i.e., 53.7 % for C3 and 50.3 % for C4). The contribu-
and shipping emissions) in the High Arctic. Further measure-
tions of biogenic emissions to sulfate for C3–4 are consistent
ments in the winter season are needed to fill the gaps in the
with Udisti et al. (2016), who reported that biogenic emis-
present study. In addition, a more in-depth observation (such
sions contributed ∼ 35 % to sulfate in summertime Arctic,
as single-particle composition) and analysis is needed to bet-
mainly because C3–4 predominated (> 80 %) summertime
ter quantify local sources, which might have been overlooked
Arctic aerosol. However, the biogenic sulfate fraction for C3
here because local sources are not captured by the backward
is less than half of that from anthropogenic sulfate. It means
trajectory analyses. More advanced receptor modeling and
that long-range-transported anthropogenic pollution still ap-
observational data, such as insoluble particles (Tobo et al.,
pears to be the largest source of sulfate in the Arctic, even for
2019; Geng et al., 2010) are needed to address the ubiqui-
MSA-containing biogenic aerosol type.
tous mixing sources found in the k-means clusters.
Biogenic aerosol in the Arctic is likely to be mixed with
SSA, which is consistent with Prather et al. (2013), who
reported that supermicrometer marine biogenic aerosol is
mixed with SSA based on the single-particle chemical mix-
ing state. The seasonal variation in biogenic aerosol in the
Atmos. Chem. Phys., 21, 11317–11335, 2021 https://doi.org/10.5194/acp-21-11317-2021C. Song et al.: Differentiation of coarse-mode anthropogenic, marine and dust particles 11329
Appendix A
Figure A1. Monthly average aerosol number size distribution from
2015 to 2019. There are missing data in some months but good data
coverage from March to June. No data are available in December.
Figure A3. Average aerosol size distribution of the seven clusters
using a seven-cluster solution.
Figure A2. Silhouette width and Dunn Index for cluster numbers
ranging from 2 to 15.
Figure A4. (a) Relative contribution (%) of the accumulated time
for back-trajectory air parcels spent over sea, sea ice, snow, land
and above the mixing layer (ML) for each month and each clus-
ter. (b) Relative contribution without considering back trajectories
above the mixing layer.
https://doi.org/10.5194/acp-21-11317-2021 Atmos. Chem. Phys., 21, 11317–11335, 202111330 C. Song et al.: Differentiation of coarse-mode anthropogenic, marine and dust particles
Table A1. Parameters for reduced major axis (RMA) regression be-
tween Na+ and Ca2+ for the five clusters
C1 C2 C3 C4 C5
n 68 22 185 256 39
r square 0.33 0.78 0.84 0.7 0.16
Slope 10.1 19.9 25.5 21.7 4.5
2.5 % slope 8.2 16.0 24.1 20.3 3.3
97.5 % slope 12.3 24.8 27.1 23.2 6.0
Intercept −40.5 −113.4 −139 −75.0 54.6
2.5 % intercept −80.8 −206.0 −164.8 −102.3 26.0
97.5 % intercept −7.6 −39.0 −114.6 −49.5 75.7
Figure A5. Probability density distribution of the meteorological
conditions for aerosol volume concentrations that exceeded their
90th-percentile values within each cluster.
Atmos. Chem. Phys., 21, 11317–11335, 2021 https://doi.org/10.5194/acp-21-11317-2021C. Song et al.: Differentiation of coarse-mode anthropogenic, marine and dust particles 11331
Data availability. The APS data can be accessed from E., Keita, S. A., Kodros, J. K., Köllner, F., Kolonjari, F., Kunkel,
https://doi.org/10.5281/zenodo.3961473 (Traversi et al., 2020). D., Ladino, L. A., Law, K., Levasseur, M., Libois, Q., Liggio, J.,
The absorption coefficient data are available upon request from Lizotte, M., Macdonald, K. M., Mahmood, R., Martin, R. V., Ma-
Gilardoni et al. (2020). Data supporting this publication can be son, R. H., Miller, L. A., Moravek, A., Mortenson, E., Mungall,
accessed upon request from the corresponding authors. E. L., Murphy, J. G., Namazi, M., Norman, A.-L., O’Neill, N. T.,
Pierce, J. R., Russell, L. M., Schneider, J., Schulz, H., Sharma, S.,
Si, M., Staebler, R. M., Steiner, N. S., Thomas, J. L., von Salzen,
Author contributions. MDO conceived the study and discussed the K., Wentzell, J. J. B., Willis, M. D., Wentworth, G. R., Xu, J.-
analysis and results. ZS supervised the project, discussed the anal- W., and Yakobi-Hancock, J. D.: Overview paper: New insights
ysis and results, and funded this study. CS performed data analy- into aerosol and climate in the Arctic, Atmos. Chem. Phys., 19,
sis, data visualization, and data interpretation and wrote the origi- 2527–2560, https://doi.org/10.5194/acp-19-2527-2019, 2019.
nal draft. DCSB provided the raw R code for k-means clustering. Adachi, K., Oshima, N., Ohata, S., Yoshida, A., Moteki, N., and
AL, MM, RT, SB, SG and SV carried out the field measurements at Koike, M.: Compositions and mixing states of aerosol parti-
the GVB station and chemical analysis of the offline samples and cles by aircraft observations in the Arctic springtime, 2018, At-
provided feedback on the draft. JS, KEY, MDO, ZS, JB, AGK and mos. Chem. Phys., 21, 3607–3626, https://doi.org/10.5194/acp-
RMH participated in editing the manuscript. All the authors com- 21-3607-2021, 2021.
mented on the manuscript and approved the submission. Asmi, E., Kondratyev, V., Brus, D., Laurila, T., Lihavainen, H.,
Backman, J., Vakkari, V., Aurela, M., Hatakka, J., Viisanen, Y.,
Uttal, T., Ivakhov, V., and Makshtas, A.: Aerosol size distribution
Competing interests. The authors declare that they have no conflict seasonal characteristics measured in Tiksi, Russian Arctic, At-
of interest. mos. Chem. Phys., 16, 1271–1287, https://doi.org/10.5194/acp-
16-1271-2016, 2016.
Bachelder, J., Cadieux, M., Liu-Kang, C., Lambert, P., Filoche, A.,
Galhardi, J. A., Hadioui, M., Chaput, A., Bastien-Thibault, M.-
Disclaimer. Publisher’s note: Copernicus Publications remains
P., Wilkinson, K. J., King, J., and Hayes, P. L.: Chemical and
neutral with regard to jurisdictional claims in published maps and
microphysical properties of wind-blown dust near an actively re-
institutional affiliations.
treating glacier in Yukon, Canada, Aerosol Sci. Tech., 54, 2–20,
https://doi.org/10.1080/02786826.2019.1676394, 2020.
Baldo, C., Formenti, P., Nowak, S., Chevaillier, S., Cazaunau, M.,
Acknowledgements. The authors acknowledge the staff of the Arc- Pangui, E., Di Biagio, C., Doussin, J.-F., Ignatyev, K., Dagsson-
tic Station Dirigibile Italia of the National Research Council of Waldhauserova, P., Arnalds, O., MacKenzie, A. R., and Shi,
Italy for their support in measurements at the GVB station. Julia Z.: Distinct chemical and mineralogical composition of Ice-
Schmale holds the Ingvar Kamprad Chair for Extreme Environment landic dust compared to northern African and Asian dust, Atmos.
Research. The authors acknowledge the NOAA Air Resources Lab- Chem. Phys., 20, 13521–13539, https://doi.org/10.5194/acp-20-
oratory (ARL) for providing the HYSPLIT model used to analyze 13521-2020, 2020.
the back trajectories. Baskaran, M. and Shaw, E. G.: Residence time of arctic
haze aerosols using the concentrations and activity ratios
of 210 Po, 210 Pb and 7 Be, J. Aerosol Sci., 32, 443–452,
Financial support. This research has been supported by the https://doi.org/10.1016/S0021-8502(00)00093-8, 2001.
Natural Environment Research Council (grant no. NE/S00579X/1). Becagli, S., Lazzara, L., Marchese, C., Dayan, U., Ascanius,
S., Cacciani, M., Caiazzo, L., Di Biagio, C., Di Iorio, T., di
We acknowledge support of the publication fee by the CSIC Sarra, A., Eriksen, P., Fani, F., Giardi, F., Meloni, D., Mus-
Open Access Publication Support Initiative through its Unit of cari, G., Pace, G., Severi, M., Traversi, R., and Udisti, R.: Re-
Information Resources for Research (URICI). lationships linking primary production, sea ice melting, and
biogenic aerosol in the Arctic, Atmos. Environ., 136, 1–15,
https://doi.org/10.1016/j.atmosenv.2016.04.002, 2016.
Review statement. This paper was edited by Drew Gentner and re- Becagli, S., Amore, A., Caiazzo, L., Iorio, T. D., Sarra, A. d., Laz-
viewed by two anonymous referees. zara, L., Marchese, C., Meloni, D., Mori, G., Muscari, G., Nuc-
cio, C., Pace, G., Severi, M., and Traversi, R.: Biogenic Aerosol
in the Artic from Eight Years of MSA Data from Ny Ålesund
(Svalbard Islands) and Thule (Greenland), Atmosphere, 10, 349,
References https://doi.org/10.3390/atmos10070349, 2019.
Becagli, S., Caiazzo, L., Di Iorio, T., di Sarra, A., Mel-
Abbatt, J. P. D., Leaitch, W. R., Aliabadi, A. A., Bertram, A. K., oni, D., Muscari, G., Pace, G., Severi, M., and Traversi,
Blanchet, J.-P., Boivin-Rioux, A., Bozem, H., Burkart, J., Chang, R.: New insights on metals in the Arctic aerosol in a
R. Y. W., Charette, J., Chaubey, J. P., Christensen, R. J., Cirisan, climate changing world, Sci. Total Environ., 741, 140511,
A., Collins, D. B., Croft, B., Dionne, J., Evans, G. J., Fletcher, https://doi.org/10.1016/j.scitotenv.2020.140511, 2020.
C. G., Galí, M., Ghahremaninezhad, R., Girard, E., Gong, W., Beddows, D. C. S., Dall’Osto, M., and Harrison, R. M.: Clus-
Gosselin, M., Gourdal, M., Hanna, S. J., Hayashida, H., Herber, ter Analysis of Rural, Urban, and Curbside Atmospheric
A. B., Hesaraki, S., Hoor, P., Huang, L., Hussherr, R., Irish, V.
https://doi.org/10.5194/acp-21-11317-2021 Atmos. Chem. Phys., 21, 11317–11335, 2021You can also read