Siberian Arctic black carbon: gas flaring and wildfire impact
←
→
Page content transcription
If your browser does not render page correctly, please read the page content below
Research article
Atmos. Chem. Phys., 22, 5983–6000, 2022
https://doi.org/10.5194/acp-22-5983-2022
© Author(s) 2022. This work is distributed under
the Creative Commons Attribution 4.0 License.

                      Siberian Arctic black carbon: gas flaring
                                 and wildfire impact
               Olga B. Popovicheva1 , Nikolaos Evangeliou2 , Vasilii O. Kobelev3 , Marina A. Chichaeva4 ,
                       Konstantinos Eleftheriadis5 , Asta Gregorič6,7 , and Nikolay S. Kasimov4
                          1 SINP,  Lomonosov Moscow State University, 119991 Moscow, Russia
                           2 NILU   – Norwegian Institute for Air Research, 2007 Kjeller, Norway
                      3 Moscow Department of Russian Geographical Society, 119991 Moscow, Russia
                4 Geographical Department, Lomonosov Moscow State University, 119991 Moscow, Russia
                   5 ERL, Institute of Nuclear and Radiological Science & Technology, Energy & Safety,

                                      NCSR Demokritos, 15341 Attiki, Athens, Greece
                                         6 Aerosol d.o.o., 1000, Ljubljana, Slovenia
                7 Center for Atmospheric Research, University of Nova Gorica, 5270, Ajdovščina, Slovenia

                         Correspondence: Nikolaos Evangeliou (nikolaos.evangeliou@nilu.no)

                               Received: 19 October 2021 – Discussion started: 13 December 2021
                          Revised: 10 February 2022 – Accepted: 3 March 2022 – Published: 6 May 2022

      Abstract. As explained in the latest Arctic Monitoring and Assessment Programme (AMAP) report released in
      early 2021, the Arctic has warmed 3 times more quickly than the planet as a whole, as well as faster than previ-
      ously thought. The Siberian Arctic is of great interest mainly because observations are sparse or largely lacking.
      A research aerosol station has been developed on Bely Island (Kara Sea) in western Siberia. Measurements of
      equivalent black carbon (EBC) concentrations were carried out at the “Island Bely” station continuously from
      August 2019 to November 2020. The source origin of the measured EBC and the main contributing sources
      were assessed using atmospheric transport modeling coupled with the most updated emission inventories for
      anthropogenic and biomass burning sources of BC.
         The obtained climatology for BC during the period of measurements showed an apparent seasonal variation
      with the highest concentrations between December and April (60 ± 92 ng m−3 ) and the lowest between June and
      September (18 ± 72 ng m−3 ), typical of the Arctic haze seasonality reported elsewhere. When air masses arrived
      at the station through the biggest oil and gas extraction regions of Kazakhstan, Volga-Ural, Komi, Nenets and
      western Siberia, BC contribution from gas flaring dominated over domestic, industrial and traffic sectors, ranging
      from 47 % to 68 %, with a maximum contribution in January. When air was transported from Europe during the
      cold season, emissions from transportation were more important. Accordingly, shipping emissions increased due
      to the touristic cruise activities and the ice retreat in summertime. Biomass burning (BB) played the biggest
      role between April and October, contributing 81 % at maximum in July. Long-range transport of BB aerosols
      appeared to induce large variability to the absorption Ångström exponent (AAE) with values > 1.0 (excluding
      outliers). As regards the continental contribution to surface BC at the Island Bely station, Russian emissions
      dominated during the whole year, while European and Asian ones contributed up to 20 % in the cold period.
      Quantification of several pollution episodes showed an increasing trend in surface concentrations and frequency
      during the cold period as the station is directly in the Siberian gateway of the highest anthropogenic pollution
      sources to the Russian Arctic.

Published by Copernicus Publications on behalf of the European Geosciences Union.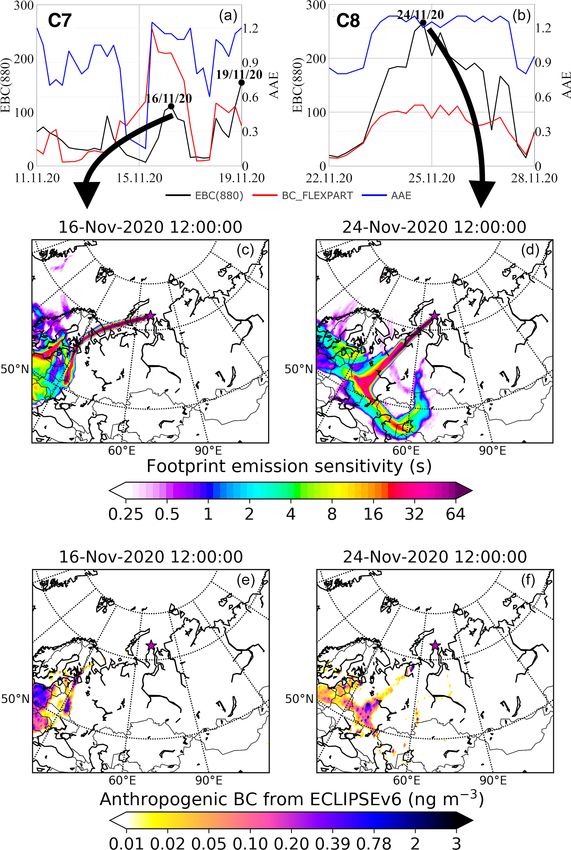
5984                                   O. B. Popovicheva et al.: Siberian Arctic black carbon: gas flaring and wildfire impact

1   Introduction                                                   dated by estimates of European BC emissions (Winiger et al.,
                                                                   2016).
Global carbon pollution is annually produced by the burn-             Due to large size and continuous production, gas flaring of
ing of fossil fuel and biomass. Combustion emissions are in-       the oil industry is one of the highest BC emission sources (Is-
creasingly recognized as an important source of chemically         mail and Umukoro, 2012) with a strong environmental and
active aerosols. Black carbon (BC) originates from the in-         climatic impact on the Arctic (Cho et al., 2019). Flaring in
complete combustion of fossil fuels and biomass burning; it        ECLIPSEv6 dominates BC emissions in the Arctic; models
is a short-lived climate forcer, absorbs incoming solar radia-     have found that flaring contributes 42 % to the annual mean
tion and, therefore, is of high significance for the Arctic cli-   BC surface concentrations in the Arctic (Stohl et al., 2013).
mate (Wang et al., 2011). The combined total effects of BC         However, because flares are difficult to measure, their par-
and sulfates cause an Arctic surface warming of +0.29 K, ex-       ticulate emissions and physicochemical properties are still
plaining approximately 20 % of the observed Arctic warming         underestimated (Conrad and Johnson, 2017; Popovicheva et
since the early 1980s (Ren et al., 2020). BC resides in the        al., 2019a). Currently, models are struggling to reproduce BC
lowest atmospheric layer, affects aerosol–cloud interactions       concentrations largely due to emission-related uncertainties
(Yun et al., 2013), and has a cloud and sea-ice feedback when      in the Arctic region (Schacht et al., 2019). The observed an-
deposited (Flanner, 2013), thus accelerating melting (Quinn        nual mean contribution of fossil fuel combustion to the Arc-
et al., 2008).                                                     tic concentrations agrees within a factor of 2 (Qi and Wang,
   Long-range transport to the Arctic carries, among               2019).
other aerosol constituents, many tracers of anthropogenic             High-latitude flaring emissions mainly originate from the
and wildfire origin (Chang et al., 2011). Winiger et               North Sea, Norwegian Sea, the northeastern part of European
al. (2016) showed that BC in Arctic Scandinavia is predomi-        Russia (Komi Republic) and western Siberia. The largest oil
nantly linked to emissions in Europe. Over the whole Arctic        and gas producing regions of northwestern Siberia are lo-
region (north of 66◦ N), Russia contributes 62 % to surface        cated along the main low-level pathway of air masses en-
BC (Zhu et al., 2020). Industrial and residential sources are      tering the Arctic and thus make a disproportionally large
responsible for the highest measured BC concentrations at          contribution to the Arctic lower troposphere (Stohl, 2006).
Tiksi station (Siberian Arctic) (Popovicheva et al., 2019b).       Eleftheriadis et al. (2009) and Tunved et al. (2013) identi-
Stathopoulos et al. (2021) have demonstrated that the long-        fied these regions as a key source for the highest measured
term impact of light-absorbing carbon in the high Arctic           BC concentrations and sub-micrometer aerosol mass concen-
is 3 times higher in the cold period of the year compared          trations, respectively, at Zeppelin station. The impact of BC
to the warm period. There, fossil sources mostly prevail dur-      long-range transport from northwestern Siberia was also ob-
ing the winter–spring season, while biomass burning sources        served at Ice Base Cape Baranova station located on Sever-
dominate during low-BC-concentration periods in summer             naya Zemlya archipelago (eastern Siberia) (Manousakas et
(Winiger et al., 2017). Although BC dominates light absorp-        al., 2020). Accordingly, possible gas flaring impact was ob-
tion by atmospheric aerosols, other carbonaceous aerosol           served at Tiksi station (northeastern Siberia) despite the large
species (brown carbon, BrC) represent an important fraction        distance of the station from the largest oil and gas produc-
of light absorption in the UV and near-UV spectra, thus hav-       ing regions (Winiger et al., 2017). To better understand and
ing an important role in the assessment of radiative forcing in    quantify the contribution of gas flaring to the Arctic envi-
the Arctic climate. Spectral dependence of the light absorp-       ronment, targeted aerosol and atmospheric composition mea-
tion is generally described by the absorption Ångström expo-       surements at the closest distance from the flaring facilities
nent (AAE), which is typically used to differentiate between       are needed. The present operating Eurasian Arctic stations
aerosol types (BC, BrC) and sources of BC (Sandradewi et           are all too far away to allow for the assessment of how air
al., 2008; Helin et al., 2021; Zotter et al., 2017).               masses are affected by gas flares or what the contribution
   Quantification of the particulate Arctic pollution is a seri-   from different source categories is (Stohl et al., 2013). Simu-
ous problem worldwide; reliable source emission inventories        lations combined with observations of BC at the proximity of
are challenged, and regional contributions of BC sources in        the source regions (e.g., the plumes from gas flaring regions
the Arctic are still inconclusive (Zhu et al., 2020). The global   over the Kara Sea) provide a better constraint (Popovicheva
anthropogenic emission dataset ECLIPSEv6 (Evaluating the           et al., 2017). In addition, measurements of BC coupled with
Climate and Air Quality Impacts of Short-lived Pollutants)         conditional probability simulations performed inside the oil
using the GAINS model (Klimont et al., 2017) includes all          and gas producing region of northwestern Siberia have suc-
major economic sectors, such as energy and industrial pro-         cessfully distinguished between multiple industrial and ur-
duction, transport, residential combustion, agriculture, and       ban sources (Popovicheva et al., 2020).
waste, distinguishing between sector fuel technology, fuels           Recent efforts have sought to develop a new Russian BC
and emission control options. The model predictions for the        emission inventory (BCRUS) for the Siberian Arctic, based
European gateway to the Arctic were greatly improved when          on activity data from local information, improved spatial
the emission inventory from anthropogenic sources was up-          distribution of BC emissions, and updated emission factors

Atmos. Chem. Phys., 22, 5983–6000, 2022                                             https://doi.org/10.5194/acp-22-5983-2022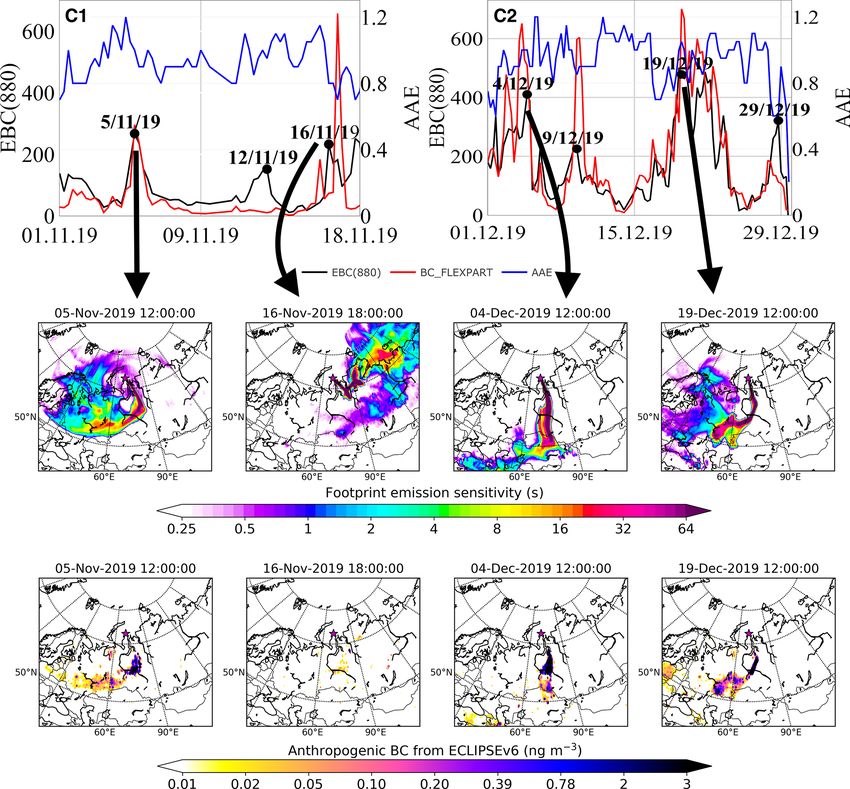
O. B. Popovicheva et al.: Siberian Arctic black carbon: gas flaring and wildfire impact                                   5985

for oil and gas fields in northwestern Siberia (Huang et          western Siberian Arctic from the main large-scale emission
al., 2015). According to this, it was found that BC emis-         regions of the Eurasian continent using Lagrangian modeling
sions from gas flaring account for 36 % of the total anthro-      coupled with continuous observations.
pogenic BC emissions over Russia. Residential BC emis-
sions, transportation, industry and power plants contribute
                                                                  2     Experimental
25 %, 20 %, 13 % and 5.4 %, respectively. The emissions
from gas flaring in BCRUS show a discrepancy more than            2.1    Aerosol station Island Bely
40 % higher than ECLIPSEv5. Using BCRUS, modeled sur-
face BC at Zeppelin, Barrow and Alert stations were basi-         Western Siberia is the world’s largest gas flaring region with
cally improved (Huang et al., 2015). The contribution of an-      a leading oil and gas production industry (Fig. 1). YNAO
thropogenic emissions in Russia to the annual total Arctic        is located north of the West Siberian Plain and covers a
surface BC was calculated to be 56 %, with gas flaring from       vast area of 769 000 km2 . More than 94 % of the region’s
the Yamalo-Nenets Autonomous Okrug (YNAO), Khanty-                economy is associated with industrial applications related to
Mansiysk Autonomous Okrug (KMAO) and Komi Republic                the extraction of fuels, their processing and transportation.
being the main source (31 % of Arctic surface BC) (Zhu et         Specifically, YNAO has the largest reserves of Russia’s nat-
al., 2020). However, due to the absence of BC inventories for     ural gas and oil; YNAO emissions of BC are the largest in
industrial emissions and a denser observational network in        the Russian territory (Vinogradova, 2015). The relative con-
the western Siberian High Arctic, the spatial distribution of     tributions from gas flaring to annual mean BC surface con-
BC sources is still associated with large uncertainties.          centrations from all emission sources (surface transportation,
   Agricultural fires in East Europe and North America are a      industry, residential, biomass burning) exceed 70 % (Stohl et
major source of biomass burning in the Eurasian Arctic (Tr-       al., 2013).
effeisen et al., 2007; Stohl et al., 2006, 2007). Springtime         Bely Island is located in the Kara Sea, north of the YNAO
fires in Siberia can double the North American Arctic back-       (Fig. 1). For the purpose of atmospheric composition obser-
ground (Warneke et al., 2010). Long-term airborne observa-        vations and sampling at the Island Bely station, the aerosol
tions of BC in northern Siberia have revealed a strong im-        pavilion has been built approximately half a kilometer to the
pact from forest fires in summer (Kozlov et al., 2016; Paris et   southeast of the Roshydromet meteorological station contin-
al., 2009). Particulate BrC emitted by intensive wildfires has    uously operating on the island (Fig. 1). There are no other
been measured in plumes transported for over 2 d (Forrister et    anthropogenic constructions on the island. Thus, the major
al., 2015). In summer 2019, wildfire activity in Central and      advantage of a newly developed research station is its long
East Siberia occurred along the trans-Arctic transport path-      distance from any local anthropogenic sources. Previous re-
way of Siberian biomass burning emissions resulting in en-        search at Tiksi station has shown significant aerosol pollu-
hanced aerosol lamina observed in western Canada (Johnson         tion from local sources (Popovicheva et al., 2019b), which is
et al., 2021).                                                    not the case at the Island Bely station. An aerosol sampling
   In 2019, a new aerosol station was developed by Moscow         system was installed at the aerosol pavilion in May 2019.
State University on Bely Island located in the Kara Sea           Three total suspended particle (TSP) inlets were installed ap-
(western Siberian Arctic) (https://peexhq.home.blog/2019/         proximately 1.5 m above the roof and 4 m above the ground.
12/11/new-research-aerosol-stations-in-the-russian-arctic,        One is used for the real-time BC monitoring with air flow at
last access: 1 April 2022) (Fig. 1). The region was chosen        5 L min−1 and two for aerosol chemical characterization op-
because it is close to the air pathway of large-scale emission    erating with 2.3 m3 h−1 flow. The TSP inlet is equipped with
plumes from populated industrial regions of Eurasia and           an electric heating wire to prevent rimming and ice blocking
Siberian wildfires to the Arctic. We present here the ground-     of the system.
based continuous BC (equivalent BC, EBC) measurements                A model AE33 aethalometer (Magee Scientific, Aerosol
from August 2019 until November 2020 at the “Island               d.o.o.) was used to measure the light attenuation caused
Bely” station for the first time. The Arctic annual trends of     by particles depositing on two filter spots at different flow
BC are assessed, while the geospatial source origin of the        rates (Drinovec et al., 2015) and at seven wavelengths from
air arriving at the station is identified using a Lagrangian      ultraviolet (370 nm) to infrared (950 nm). The “dual spot”
particle dispersion model. Furthermore, the anthropogenic         technique is applied for real-time loading effect compensa-
and biomass burning contributions to the modeled surface          tion. The light-absorbing content of carbonaceous aerosol at
concentrations of BC are evaluated against measured               880 nm is reported as equivalent black carbon concentration
BC concentrations at the station. Characterization of the         (EBC), which is determined for each time interval from the
pollution events in cold and warm periods separates the           change in the light attenuation at a wavelength of 880 nm us-
impact of gas flaring versus biomass burning. In addition,        ing a mass absorption cross-section of 7.7 m2 g−1 and a filter
the spectrally resolved absorption measurements provide           multiple scattering parameter C of 1.57. Light-absorbing or-
an opportunity for the characterization of BC sources. The        ganic components (BrC) absorb light at shorter wavelengths
present study assesses long-range transport of BC to the          more effectively than at 880 nm, which is observed as an in-

https://doi.org/10.5194/acp-22-5983-2022                                          Atmos. Chem. Phys., 22, 5983–6000, 2022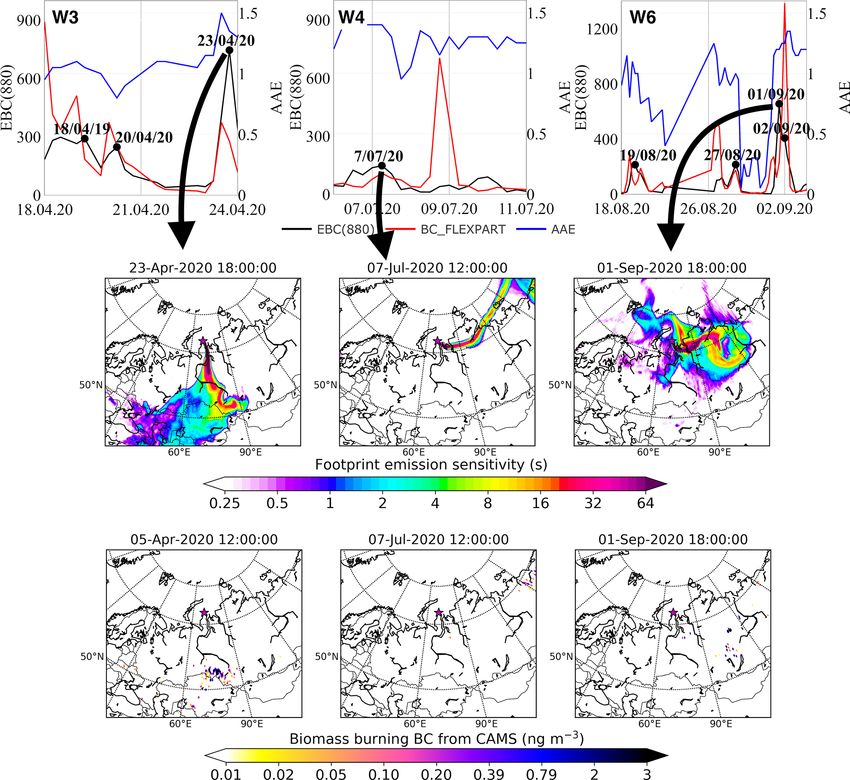
5986 O. B. Popovicheva et al.: Siberian Arctic black carbon: gas flaring and wildfire impact
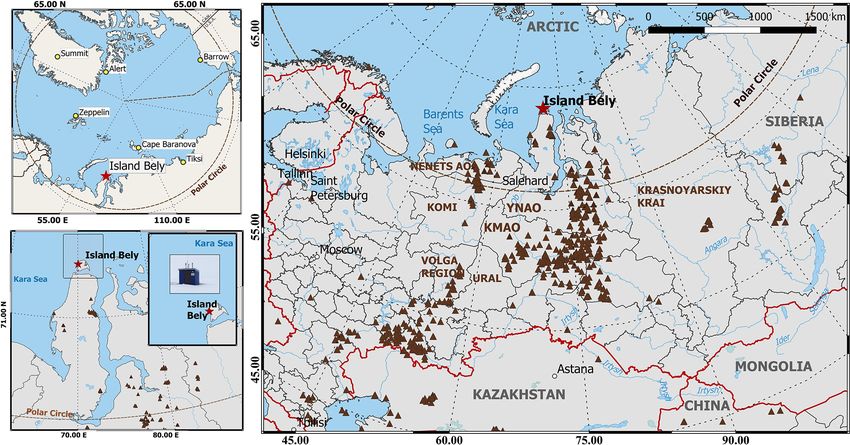
Figure 1. Top-left map shows the location of the newly established Island Bely aerosol station in contrast to other Arctic stations (Zeppelin,
Alert, Barrow, Summit, Tiksi and Cape Baranova). Bottom-left map shows a zoomed-in version of the location of Bely Island in the Kara
Sea, where the new station was developed (73◦ 200 7.5700 N, 70◦ 40 49.0500 E). The map on the right shows the Island Bely aerosol station in
combination with the European part of Russia and western Siberia and the Yamalo-Nenets Autonomic Okrug (YNAO). Flares of oil and gas
fields are shown for the year 2019 in brown triangles (adopted from https://skytruth.org/, last access: 1 April 2022).
creased AAE (Sandradewi et al., 2008; Grange et al., 2020; wildfires where different burning modes (flaming or smol-
Helin et al., 2021). AAE was calculated using Eq. (1) for dering) and different types of wood can significantly influ-
470 nm and 950 nm wavelengths: ence BrC emissions and its chemical composition (Kalo-
gridis et al., 2018b). Furthermore, chemical evolution after
ln(babs(470)/babs(950)) emissions and atmospheric aging (i.e., aerosol mixing state,
AAE = , (1)
ln(950/470) particle morphology and size distribution) additionally influ-
ence aerosol absorption, which can be noticed especially for
where babs stands for the absorption coefficient at 470 and long-range-transported air masses (Cappa et al., 2016; Saleh
950 nm. In order to avoid instrumental noise when calcu- et al., 2013; Romshoo et al., 2021). Forrister et al. (2015)
lating the AAE, the following data processing was imple- have shown that BrC emitted from wildfires was highly un-
mented. The 1 min absorption coefficients for the whole pe- stable, with 6 % of BrC remaining above background levels
riod were averaged to 1 h. The dataset was filtered to periods after 2 d.
when EBC exceeded 20 ng m−3 (sensitivity level at 1 h time BC measurements at the Island Bely station were per-
resolution), and then the AAE was averaged to 3 h. formed from 10 August 2019 to 30 November 2020 with a
The aethalometer model (Sandradewi et al., 2008) is typi- time resolution of 1 min. Basic meteorological parameters,
cally used for the source apportionment of EBC when mea- such as temperature and wind speed and direction, were ob-
surements of absorption coefficient are performed by filter tained every 3 h from a meteorological station located 500 m
photometers. The model uses an a priori assumed pair of from the Island Bely station. Cleaning of 1 min time-resolved
AAEs for traffic (AAETR) and biomass burning (AAEBB) BC data was based on the definition of what can be consid-
to determine the contribution of both sources. Although the ered as a peak: a strong fast increase in BC value a few times
aethalometer model is an efficient tool for source apportion- higher than previous value and then a similarly fast decrease.
ment of EBC in a well-mixed urban atmosphere where two The analysis of meteorological parameters was complemen-
sources with distinct aerosol optical properties prevail (fos- tary to check whether the wind originated from the sector
sil fuel from traffic and fresh biomass burning), the results corresponding to locations of diesel generators at the Roshy-
can be affected when the characteristic optical properties of a dromet meteorological station (240–250◦ from the “Bely Is-
specific source change over time. This is usually the case for
Atmos. Chem. Phys., 22, 5983–6000, 2022 https://doi.org/10.5194/acp-22-5983-2022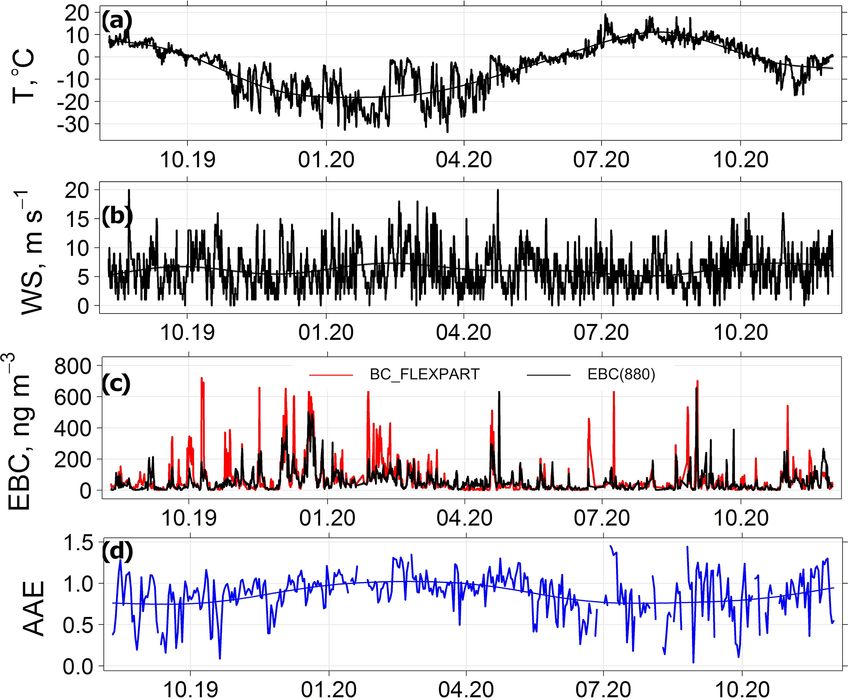
O. B. Popovicheva et al.: Siberian Arctic black carbon: gas flaring and wildfire impact                                   5987

land” station). In such cases, strong peaks of BC were re-      displayed as a function of the time elapsed since the emis-
moved from further analysis. The total duration of the peaks    sion occurred (i.e., “age”), which can be shown as “age spec-
under the influence of local contamination varies from sev-     trum”.
eral minutes to 1–2 h per day and monthly. For instance, in        In this study, anthropogenic emission fluxes were adopted
January 2020, when wind blew from 240–250◦ for 24 h in          from the latest version (v6b) of the ECLIPSE (Evaluating
total, large peaks corresponding to a fraction of 13 % of the   the Climate and Air Quality Impacts of Short-lived Pol-
data were removed. In July 2020, when wind originated from      lutants) dataset, an upgraded version of the previous ver-
the same location for a total of 45 h, measurements corre-      sion (Klimont et al., 2017). The inventory includes indus-
sponding to a fraction of 22 % of the data were removed.        trial combustion (IND) emissions from industrial boilers and
Lack of windy weather at Bely Island is a very rare event,      industrial production processes. The energy production sec-
only 0.7 % of the observation time; during such weather,        tor (ENE) includes emissions from combustion processes in
peaks of BC were never observed.                                power plants and generators. The residential and commercial
                                                                sector (DOM) includes emissions from combustion in heat-
2.2   Atmospheric transport model coupling with
                                                                ing and cooking stoves and boilers in households and public
      emissions
                                                                and commercial buildings. The waste treatment and disposal
                                                                sector (WST) resembles emissions from waste incineration
To investigate the possible origin of BC, the Lagrangian par-   and treatment. The transport sector (TRA) includes emis-
ticle dispersion model FLEXPART (FLEXible PARTicle dis-         sions from all land-based transport of goods, animals and
persion model) version 10.4 was used (Pisso et al., 2019).      persons on road networks and off-road activities. Emissions
The model was driven by 3 h operational meteorological          from shipping activities in in-land waters (SHP) is included
fields from the European Centre for Medium-Range Weather        as a separate sector. The gas flaring (FLR) sector includes
Forecasts (ECMWF) with 137 vertical levels and a horizon-       emissions from oil and gas facilities. The methodology for
tal resolution of 1◦ × 1◦ . In FLEXPART, computational par-     obtaining emissions from FLR specifically over Russia has
ticles were released at heights of 0–100 m from the recep-      been improved in ECLIPSEv6 (Böttcher et al., 2021). Up-
tor (Island Bely station) and were tracked backward in time     dates were based on new field-type-specific emission factors
in FLEXPART’s “retroplume” mode. Simulations extended           that were applied to Visible Infrared Imaging Radiometer
over 30 d backward in time, sufficient to include most BC       Suite (VIIRS) observations of the flared gas volume at indi-
emissions arriving at the station given a typical BC lifetime   vidual flaring locations. For comparison, BCRUS emissions
of 1 week (Bond et al., 2013).                                  for the FLR sector (Huang et al., 2015) were also used in this
   The tracking includes gravitational settling for spherical   study.
particles of the size observed. FLEXPART differs from tra-         Emissions from biomass burning (BB) were adopted
jectory models due to its ability to simulate dry and wet       from Copernicus Atmosphere Monitoring Services (CAMS)
deposition of gases or aerosols (Grythe et al., 2017), turbu-   Global Fire Assimilation System (GFAS). CAMS GFAS
lence (Cassiani et al., 2015), and unresolved mesoscale mo-     assimilates fire radiative power (FRP) observations from
tions (Stohl et al., 2005), while it includes a deep convec-    satellite-based sensors converting the energy released dur-
tion scheme (Forster et al., 2007). For our simulations, we     ing fire combustion into gas and aerosol daily fluxes
assumed that BC has a density of 1500 kg m−3 and follows a      (Di Giuseppe et al., 2016; Kaiser et al., 2012). Data are avail-
logarithmic size distribution with an aerodynamic mean di-      able globally on a regular grid with a horizontal resolution of
ameter of 0.25 µm and a logarithmic standard deviation of       0.1◦ from 2003 to the present. FRP observations assimilated
0.3 (Long et al., 2013).                                        in GFAS are the NASA Terra MODIS and Aqua MODIS
   FLEXPART simulations were performed every 3 h during         active fire products (http://modis-fire.umd.edu/, last access:
the studied period. The FLEXPART output consists of a foot-     1 April 2022, Kaufman et al., 2003). FRP measures the heat
print emission sensitivity which results in a modeled con-      power emitted by fires as a result of the combustion pro-
centration at the receptor when coupled with gridded emis-      cess and is directly related to the total biomass combusted
sions from an emission inventory. The emission sensitivity      (Wooster et al., 2005). Using land-use-dependent conversion
expresses the probability of any release occurring in each      factors, GFAS converts FRP into emission estimates for 44
grid cell to reach the receptor. The source contributions to    smoke constituents (Kaiser et al., 2012), one of which is BC.
receptor BC were derived by combining each gridded emis-           Biomass burning emissions were also adopted from the
sion sector (gas flaring, transportation, waste management,     Global Fire Emission Dataset version 4.1 (GFEDv4.1). The
etc.) from an emission inventory with the footprint emission    product combines satellite information on fire activity and
sensitivity. Calculations for anthropogenic sources (emission   vegetation productivity to estimate gridded monthly burned
sectors are described below) and open biomass burning were      area and fire emissions, as well as scalars that can be used to
performed separately. This enabled the identification of the    calculate higher-temporal-resolution emissions. All data are
exact origin of BC and allowed for the quantification of its    publicly available for use in large-scale atmospheric and bio-
source contribution. The modeled concentrations can also be     geochemical studies and include (i) burned area (Giglio et al.,

https://doi.org/10.5194/acp-22-5983-2022                                        Atmos. Chem. Phys., 22, 5983–6000, 2022
5988                                   O. B. Popovicheva et al.: Siberian Arctic black carbon: gas flaring and wildfire impact

2013), (ii) burned area from “small” fires based on active fire
detections outside the burned area maps detailed in Rander-
son et al. (2012) and updated in van der Werf et al. (2017),
(iii) carbon and dry matter emissions from van der Werf et
al. (2017), (iv) fractional contributions of various fire types
to total emissions, and (v) list of emission factors to compute
trace gas and aerosol emissions based on Akagi et al. (2011)
and Andreae and Merlet (2001). The current version (v4) has
a spatial resolution of 0.25◦ and is available from 1997 on-
wards.
   In the present paper, several different configurations
were used to calculate modeled surface BC concentra-
tions at Island Bely station, namely ECLIPSEv6 with
GFED4 (ECLIPSEv6-GFED4) and ECLIPSEv6 with CAMS
(ECLIPSEv6-CAMS). The same two configurations were
also used after substituting the FLR emissions in ECLIP-
SEv6 with those from BCRUS (Huang et al., 2015).
                                                                  Figure 2. Meteorological conditions with respect to (a) mean tem-
                                                                  perature and (b) wind speed (data were smoothed to show long-term
3     Results and discussion
                                                                  variations), (c) time-series of 24 h median EBC (black) and model
                                                                  BC using ECLIPSEv6-CAMS emissions (red), and (d) 24 h aver-
3.1    Monthly climatology of black carbon
                                                                  age absorption Ångström exponent (AAE) measured at Island Bely
The climate at Bely Island is characterized by an average         station from 10 August 2019 to 30 November 2020 (date format in
annual temperature of −8 ◦ C, precipitation of 450 mm and         mm.yy).
stable snow coverage from October to May. Meteorology
displays a large annual variability determined by alternating
periods of the polar night and midnight sun. Median tem-          lowest ones from June to August, in agreement with the typi-
peratures stay above 0 ◦ C for 4 months each year between         cal seasonal trend of the Arctic aerosol concentrations (Stone
June and September. This period is also characterized by the      et al., 2014). EBC monthly climatology during the study pe-
highest-frequency occurrence of ocean air masses and the          riod is shown in Fig. 4a in terms of the median and upper
most stable wind speeds. A shift occurred in October with         and lower quartiles. For winter months, the maximum me-
decreased solar insolation resulting in a temperature shift to    dian EBC concentration was 165 ng m−3 observed in De-
below 0 ◦ C. The cold month winds were primarily continen-        cember 2019. The increase in the Arctic concentrations in
tal, with a low-frequency occurrence of ocean air masses.         winter, known as the Arctic haze, was more pronounced in
   The cycle of temperature and wind speed variations ob-         November–December 2019 and January–March 2020. On
served during the study period is shown in Fig. 2a and b. The     average, concentrations in summer were about 10 times
period from 1 November 2019 to 1 April 2020, when temper-         lower than those in winter, with a minimum median value of
atures dropped below −10 ◦ C, as well as November 2020,           30 ng m−3 in July 2020. Observations at the Island Bely sta-
is denoted as the “cold period”. The remaining period of          tion for the second year started from August 2020 and lasted
our study, from 10 August to 31 October 2019, as well as          until November 2020 to confirm the general annual trend of
from April to 1 November 2020, is considered as the “warm         low summer and high winter BC concentrations. However,
period”. Figure 2c illustrates the long-term time series of       monthly median EBC in September 2020 demonstrated a
24 h median EBC concentrations measured at a wavelength           value of 30.7 ng m−3 .
of 880 nm (EBC(880)) during the study period, with a me-             A similar annual trend was recorded in 2015–2016 at
dian of 37 ± 64 ng m−3 (maximum: 520 ng m−3 ; minimum:            Tiksi station (coast of Laptev Sea), with high concentrations
6 ng m−3 ). The polar frequency plot of wind speed and di-        reaching 130 ng m−3 during winter–spring and low concen-
rection shows the maximum number of hours the wind was            trations of about 20 ng m−3 observed from May to Octo-
from northeast and southwest directions at around 5 m s−1         ber (Popovicheva et al., 2019b). As shown by earlier stud-
(Fig. 3a). BC concentration roses in Fig. 3 indicate the          ies at various polar stations, such as in Ny-Ålesund, Alert
sources of the highest concentrations, which originated from      and Barrow, aerosols display Arctic haze peak concentra-
the continent in both cold and warm periods.                      tions during winter and early spring months (Stone et al.,
   Figure 4 illustrates a long-term time series of monthly        2014). EBC during Arctic haze at both Island Bely and
EBC concentrations at the Island Bely station during the pe-      Tiksi stations are typically higher as compared to those ob-
riod from August 2019 to November 2020. The highest con-          served at Alert (100 ± 65 ng m−3 ), a station that has shown
centrations were observed from November to April and the          the largest concentrations among all polar stations (Sharma

Atmos. Chem. Phys., 22, 5983–6000, 2022                                             https://doi.org/10.5194/acp-22-5983-2022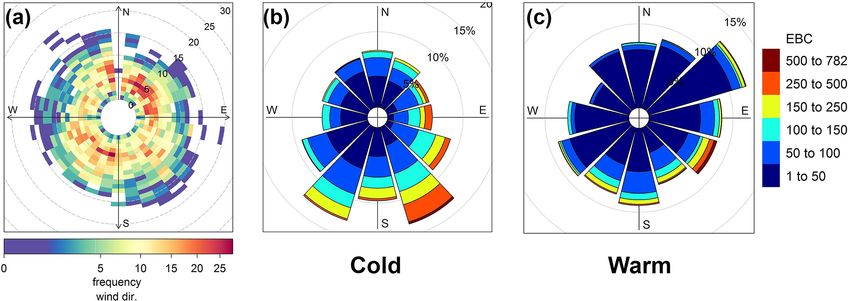
O. B. Popovicheva et al.: Siberian Arctic black carbon: gas flaring and wildfire impact                                             5989

Figure 3. (a) Polar frequency plots of wind speed and direction. Each cell gives the total number of hours the wind was originating from a
certain wind direction. The dashed circular grey lines show the wind speed (in m s−1 ). Rose diagrams show EBC concentrations during the
cold (b) and warm (c) periods.

et al., 2004). The latter confirms previous findings from Eck-         mainly denote the variability in air mass transport patterns
hardt et al. (2015) and Winiger et al. (2017) that the Siberian        in different seasons. In the cold season, the Siberian Arc-
Arctic is mainly polluted as a result of the influence from            tic tends to force the air from south to north into the Arc-
emissions occurring on the Eurasian continent.                         tic (Stohl, 2006), thus bringing more anthropogenic BC from
   Near-surface measurements allow for the evaluation of the           highly populated regions.
capability of transport models to reproduce the distribution              Monthly averaged BC contributions from different sources
of BC in the Arctic based on different emission datasets               simulated by FLEXPART using ECLIPSEv6 emissions are
(Schacht et al., 2019; Zhu et al., 2020). Figure 4a and Supple-        shown in Fig. 4c and Supplement Table S3. From Novem-
ment Table S2 show observed and modeled BC monthly me-                 ber 2019 to March 2020 the FLR sector contributed 47 %–
dian mass concentrations at the Island Bely station. The use           68 % (maximum in January 2020) to surface BC when air
of ECLIPSEv6 emissions caused overestimations of modeled               masses arrived at Bely through oil and gas extraction sites.
BC concentrations of up to 46 % (February 2020). All simu-             February and November 2020 demonstrated the biggest non-
lated BC concentrations were found in the range between the            gas flaring impact. More specifically, February 2020 coin-
25th and 75th percentiles of measured EBC. Modeled BC is               cides with the largest model overestimation (Fig. 4a), im-
underestimated in March–May 2020, being 29 ng m−3 below                plying a likely misestimation of non-gas flaring emissions in
the 25th percentile of EBC in April 2020. When FLR emis-               ECLIPSEv6. From April 2020 the impact of FLR dropped
sions in ECLIPSEv6 were substituted by BCRUS FLR, sim-                 significantly (Supplement Table S4), with a minimum of
ilar modeled BC monthly median concentrations were cal-                12 % in June. Starting from April to October 2020, BB emis-
culated, thus indicating that other sectorial emissions might          sions played the biggest role in surface BC, contributing
make a large contribution to surface BC at the station.                81 % in July 2020. It is noteworthy that the impact of SHP
   Figure 4b shows the so-called “age spectrum” of modeled             emissions became quite perceptible in the warm period when
BC for the Island Bely station. In the cold period of high             the oceanic ice is absent in the Arctic and touristic cruises
EBC concentrations, the longest age of more than 19 d back             peak.
affects up to 60 % of the surface concentrations. In this time,           Emission sensitivities of surface BC presented over the
due to the geographical proximity, Russia dominates. How-              whole Arctic (north of 66◦ N) have been also simulated
ever, both Europe and Asia contribute around 20 % to the               using the same model (Zhu et al., 2020). Anthropogenic
monthly averaged surface BC, with the largest contribution             sources contributed 82 % of the annual BC, as estimated
being in February 2019 and November 2020 (Fig. 4b, d). The             from the BCRUS emission dataset. Arctic BC originated pre-
most aged air masses (from 28 to 30 d back) contributed up to          dominantly from anthropogenic emissions in Russia (56 %),
50 %, arriving at the Island Bely station in December 2019,            mainly FLR from YNAO, KMAO and Komi Republic (31 %
which is the month of the highest observed EBC concentra-              of surface Arctic BC). In summer (July–August), open BB in
tions during the study period. The impact of the closest re-           Siberia, Alaska and Canada contributed 75 %. At Zeppelin,
gions with ages between 7 and 9 d is more significant in the           modeled BC (39.1 ng m−3 for annual mean) was reported
winter months, while in the warm period, such short-term               to be 85 % higher than the observed value (21.1 ng m−3
contributions become negligible. The calculated age and con-           for annual mean) (Zhu et al., 2020). At Tiksi, modeled
tinental spectrum of BC obtained for the Island Bely station           BC was underestimated (74.4 ng m−3 for annual mean) by

https://doi.org/10.5194/acp-22-5983-2022                                                Atmos. Chem. Phys., 22, 5983–6000, 2022

5990                                    O. B. Popovicheva et al.: Siberian Arctic black carbon: gas flaring and wildfire impact

Figure 4. (a) Monthly climatology of EBC at the Island Bely station depicting medians and 25th and 75th percentiles (dashed lines).
Near-surface monthly median BC concentrations simulated with FLEXPART coupled to ECLIPSEv6-CAMS (steel blue) and ECLIPSEv6-
BCRUS-CAMS (red) emissions are also shown. (b) Age spectrum of modeled BC from all possible sources showing the contribution
of emissions from each day back in time to the surface concentration of BC. (c) Contribution from different emission source types to
surface BC concentrations. The emission sources of biomass burning (BB) adopted from GFEDv4.1 and residential and commercial (DOM),
power plants, energy conversion and extraction (ENE), gas flaring (FLR), industrial combustion and processing (IND), shipping (SHP), and
transportation (TRA) adopted from ECLIPSEv6 were considered. (d) Continental spectrum showing the contribution from each continent or
region to surface BC concentrations; 10 regions were considered, namely Africa, Asia, Australia, Central America, Europe, Greenland and
Antarctica, North America, world ocean, Russia, and South America (see Supplement Fig. S3).

40 % compared with observations (104.2 ng m−3 for annual              ference in FLR emissions in the two datasets (Supplement
mean) (Zhu et al., 2020). Annual (from September 2019 to              Table S4).
August 2020) median modeled concentrations of BC using
ECLIPSEv6, BCRUS and CAMS for the Island Bely station
are shown in Supplement Table S2. We find that modeled BC             3.2   Cold season pollution
(78.4 ng m−3 for annual mean) is 26 % higher than the ob-
served value (61.8 ng m−3 for annual mean); the overestima-           Figure 5a shows EBC concentrations measured at the Island
tion is much smaller than observed for other remote stations.         Bely station during the cold period from November 2019
Annual averaged contributions of anthropogenic emissions              to April 2020 and from 1 to 30 November 2020. The time
by ECLIPSEv6 and ECLIPSEv6 with flaring from BCRUS                    series indicates that EBC undergoes the typical Arctic sea-
were equal to 76 % and 80 %, respectively, due to the dif-            sonal trend with higher concentrations in winter and early
                                                                      spring and lower in summer. Background pollutant concen-
                                                                      trations at Arctic stations are generally very low without any

Atmos. Chem. Phys., 22, 5983–6000, 2022                                                 https://doi.org/10.5194/acp-22-5983-2022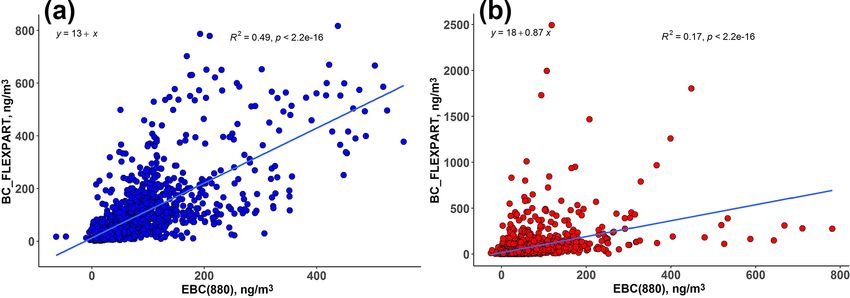
O. B. Popovicheva et al.: Siberian Arctic black carbon: gas flaring and wildfire impact                                   5991

detectable influence from local or regional sources (Elefthe-    (Supplement Fig. S1). The model strongly underestimated
riadis et al., 2004; Popovicheva et al., 2019b). We relate the   measured EBC concentrations by about 10 times (Fig. 7). We
Arctic background to the lowest 20th percentile of EBC data      fail to provide a concrete explanation for this; a simplified
(10 ng m−3 ). Long-term pollution episodes were assumed to       hypothesis is that a number of flaring sites located at the Ya-
be repeated events of high EBC concentration above the 80th      mal Peninsula might have not been included in the emission
percentiles (90 ng m−3 ) that are clearly distinguishable from   database, but this certainly needs further research. In con-
the background (Fig. 5a).                                        trast, the model strongly overestimated measured EBC con-
   The aerosol optical properties with respect to absorption,    centrations on 16 November 2019. At that time, air masses
presented as daily median AAE, are shown in Fig. 2d. The         passed through remote regions of eastern Siberia and arrived
AAE for highly aged aerosols measured during periods of          through the gas flaring sites of Krasnoyarskiy Kray at the
low BC was lower than 1 (reaching values as low as 0.2)          station (Fig. 7) causing an FLR contribution of 98.6 % to
and is mostly related to the aerosol size distribution (large    surface BC (Supplement Table S5). The reason might be the
particles) and internally mixed BC particles (Cappa et al.,      use of incorrect emission factors for BC at the FLR facilities
2016). As shown by modeling studies (Virkkula, 2021), pure       of Krasnoyarskiy Kray in the adopted emissions because di-
BC particles surrounded by non-absorbing coatings can have       rect transport from this region was observed. During 12 and
AAEs in the range from < 1 to 1.7, also depending on the         16 November 2019 the AAE was in the range from 0.7 to
morphology of the fractal aggregates (Romshoo et al., 2021).     1, which agrees with the expected optical properties for the
The AAE increased in periods of higher aerosol concentra-        FLR sources.
tion levels in the cold period ranging from 0.6 to 1.35.            Pollution episode C2 in December 2019 gave the high-
   In many cases, when AAE exceeded 1 in the cold period,        est EBC concentrations observed during the whole cold pe-
the pollution episodes could be identified as being influenced   riod (Fig. 5a). On 4 December, EBC approached 400 ng m−3 ,
by BB. However, due to the mixing with background aerosol        when air masses originated from Kazakhstan and the Rus-
and aging processes, a large variability in AAE values might     sian gas flaring regions of KMAO and YNAO (Fig. 8). The
be observed at receptors of long-range-transported pollution,    maximum EBC concentration of approximately 500 ng m−3
and AAE may not be representative of BB sources. Never-          with an AAE of 1.05 was observed on 19 December when
theless, it can still be used as a qualitative parameter when    air came from Europe, initially through the Russian oil and
extra information is available. Such events of increased AAE     gas basins of Volga-Ural in the south of European Russia and
were rarely observed in our study, and the most prominent        then through KMAO and YNAO in western Siberia (Fig. 8).
BB impact occurred during the pollution episodes C4, C7          During the December pollution events, FLR contribution
and C8 when the impact of domestic sources was significant       dominated, reaching 73 % on 19 December (Supplement Ta-
(Fig. 5a).                                                       ble S5).
   In general, FLEXPART coupled with ECLIPSEv6-CAMS                 The highest FLR contributions were observed during the
emissions captures periods with both high and low concen-        pollution episodes C3–C6 (Supplement Table S5). Similar
trations relatively well (Fig. 2c). A good correlation be-       air mass transportation through either gas and oil fields of
tween measurements and simulations, with a Pearson coef-         YNAO and KMAO in western Siberia or Komi and Nenets
ficient R of 0.7 and the root mean squared error (RMSE) of       regions north of European Russia occurred in all of the events
89.2 ng m−3 , was obtained for the cold period (Fig. 6a). Ac-    (Supplement Fig. S1).
cording to monthly median contributions to BC concentra-            In contrast to the aforementioned events, the pollution
tions in the cold period, the impact of anthropogenic sources,   episode C7 was unrelated to FLR as air masses did not cross
namely FLR, DOM and TRA, dominated surface BC by                 flaring regions (Fig. 8). On 16 November 2020, retroplumes
97.7 % (Fig. 4c).                                                confirm the origin of surface BC from Central and East Eu-
   Looking closely to specific episodes, during pollution        rope and the Kola Peninsula (Fig. 8). DOM and TRA hold the
episode C1, three events of high EBC concentrations were         largest share of the source contribution with 73 % and 20 %,
observed (Fig. 5a). On 5 November 2019, measured EBC             respectively (Supplement Table S5), while the model over-
reached 180 ng m−3 , while FLEXPART simulated similarly          estimated measured EBC. Episode C8 gave the biggest EBC
high BC values. Footprint emission sensitivities at this time    (370) concentration which reached 346 ng m−3 and exceeded
showed that air masses originated from East and North Eu-        EBC(880) (133 ng m−3 ) on 24 November 2020 (Supplement
rope, passed south of European Russia, and then turned           Table S5). At this time, air masses came to Bely Island di-
straight through West Siberia approaching Bely Island from       rectly from the most populated region of European Russia
the southeast (Fig. 7). The same air mass moved towards the      (Fig. 8). The contributions of DOM and TRA were 34 % and
large Russian FLR sources of YNAO, KMAO and Krasno-              23 %, respectively. AAE approached the highest value ob-
yarskiy Kray (see Fig. 1), causing up to a 71 % contribution     served (1.3) during the study period. This might show a de-
to surface BC (Supplement Table S5).                             tectable impact of biomass burning in the classified DOM
   On 12 November 2019, air masses arrived at Bely Island        emissions. BC from wood burning contributes around 61 %
through the Yamal Peninsula after passing from the ocean         of the total residential emissions, especially in areas where

https://doi.org/10.5194/acp-22-5983-2022                                        Atmos. Chem. Phys., 22, 5983–6000, 2022
5992                                     O. B. Popovicheva et al.: Siberian Arctic black carbon: gas flaring and wildfire impact

Figure 5. The 24 h median EBC concentrations measured at 880 nm (black) and 370 nm (red), as well as source contributions to surface BC
from anthropogenic (DOM, ENE, FLR, IND, SHP, WST, TRA) and BB sources for (a) the cold and (b) the warm period. Pollution episodes
were composed from the periodically repeated events of high EBC concentration. The straight green line indicates the pollution level of the
80th percentile.

Figure 6. Scatterplots of 3 h median measured EBC(880) against modeled BC from FLEXPART for the (a) cold and (b) warm period. Solid
line is the linear regression fit of the comparison between modeled and observed values.

Atmos. Chem. Phys., 22, 5983–6000, 2022                                                    https://doi.org/10.5194/acp-22-5983-2022
O. B. Popovicheva et al.: Siberian Arctic black carbon: gas flaring and wildfire impact                                               5993

Figure 7. Examples of pollution episodes C1 and C2 observed in the cold period (see Fig. 5a), during which FLR contribution prevails. The
6 h median EBC(880) (black line), BC simulated with FLEXPART (red line) and AAE (blue line) (upper row) values. Footprint emission
sensitivities in seconds showing the largest probability of emission origin (middle row). Spatial distribution of anthropogenic contribution
(in ng m−3 ) to surface BC at the Island Bely station (bottom row).

there is limited use of natural gas (Kalogridis et al., 2018a)          American emissions (Fig. 4). EBC concentrations rarely ex-
and in forest regions (Huang et al., 2015). Note that the im-           ceeded the 80th percentile that was set as the pollution cri-
pact of IND emissions was the largest in episodes C7 and C8             terion, while the duration of the warm period episodes was
as compared to the whole cold period (Supplement Table S5)              shorter.
due to industrial emissions from sites in central European                 Due to the mixing with background aerosol and aging pro-
Russia.                                                                 cesses, air masses influenced by BB events should be ex-
                                                                        pected to have increased AAE as compared to the BC pro-
                                                                        duced by fossil fuel. However, aging processes may induce
3.3   Warm season pollution                                             a high variability in AAE in areas affected by long-range
                                                                        transport, and hence AAE may not be representative of a BB
Figure 5b shows EBC concentrations measured at the Is-
                                                                        source. Pollution events were rarely observed in this season,
land Bely station during the warm period from 10 August to
                                                                        and the most sufficient BB impact occurred during the pollu-
31 October 2019 and from 1 April to 1 November 2020. It is
                                                                        tion episodes W4, W7 and W8.
immediately seen that BC in the warm period was mainly af-
                                                                           However, events characterized by higher AAE were ob-
fected by Russian emissions (90 %) and only in October 2020
                                                                        served more often, indicating that BB impact was more sig-
and August 2019 partly (∼ 20 %) by European and North

https://doi.org/10.5194/acp-22-5983-2022                                                 Atmos. Chem. Phys., 22, 5983–6000, 2022
5994 O. B. Popovicheva et al.: Siberian Arctic black carbon: gas flaring and wildfire impact Figure 8. Examples of pollution episodes C7 and C8 observed in the cold period (see Fig. 5a), during which DOM and TRA contributions prevail. Time series of measured EBC, modeled BC and AAE (a, b), footprint emissions sensitivities (c, d), and anthropogenic contribution to surface BC (e, f) are shown. nificant during the warm period, mainly during spring and 1 % as a result of the increase in touristic activity in the Arc- summer (episodes W3, W4 and W6). A comparison between tic and the more active use of the Northern Sea Route due to measured and modeled concentrations showed a poor corre- the Arctic ice retreat. lation (R of 0.41 and RMSE of 121 ng m−3 ) (Fig. 6). Accord- From the beginning of the study period in August 2019, ing to monthly median contributions to surface BC concen- large wildfires were observed in Siberia (Voronova et al., trations in the warm period, the impact of BB emissions was 2020). The latter resulted in a strong BB impact at the Is- as high as 50 % (Fig. 4c). SHP emissions contributed about land Bely station (Fig. 5b). However, during episode W1, Atmos. Chem. Phys., 22, 5983–6000, 2022 https://doi.org/10.5194/acp-22-5983-2022
O. B. Popovicheva et al.: Siberian Arctic black carbon: gas flaring and wildfire impact                                      5995

EBC concentrations not caused by wildfire plumes reached             higher than the largest Arctic haze concentration observed
approximately 200 ng m−3 (Fig. 5). During this time, air             in December 2019 (Supplement Table S5). Increased AAE
masses were transported from northern Europe (Supplement             of around 1.4 revealed a strong BB impact. This event re-
Fig. S1), and the main contribution to surface BC at the Is-         sulted from long-range transport of BC from the Eurasian
land Bely station was due to TRA emissions (36 %, Supple-            continent during the intensive wildfires in western Siberia
ment Table S5).                                                      (Krasnoyarskiy Kray and Yakutia) (Fig. 9), where around
    Episode W2 during October 2019 (Fig. 5) was charac-              1 000 000 ha of forest was burned in August 2020. The con-
terized by EBC of 119 ng m−3 , while modeled BC was                  tribution of BB to surface BC at the Island Bely station was
strongly overestimated (Supplement Fig. S1). The calculated          as high as 95 %.
BB contribution to the station’s surface BC was 64 % (Sup-              Despite the exclusive BB origin of the light-absorbing car-
plement Table S5), and the hotspot BB sources were near              bon measured at the Island Bely station, the AAE was much
the Pur River (YNAO), as recorded by CAMS (Supplement                lower than the established value for fresh BB (close to 2)
Fig. S1). The measured AAE does not indicate any contri-             (Sandradewi et al., 2008) likely due to aging. This apparent
bution from BrC, as would be expected for BB sources, and            reduction in the BrC contribution to absorption is in agree-
observed AAE values were lower than 1 (Supplement Ta-                ment with Forrister et al. (2015), who examined BrC concen-
ble S5). Note that the FIRMS active fire data analyses (https:       trations and AAE from western US forest fires as a function
//firms.modaps.eosdis.nasa.gov/, last access: 1 April 2022)          of aging. Their results show that most of the BrC (∼ 94 %)
indicate that the fire spots were in the same grid cell as indus-    emitted from wildfires was lost within a day. Similar obser-
trial facilities of an oil extraction field in the Purovsky region   vations have been reported for long-range-transported North
(YNAO). Thus, it might be that thermal anomalies from flar-          American smoke over the northeastern Atlantic (Zheng et al.,
ing facilities were mistakenly related to fires in CAMS. This        2020) and for transported Russian smoke over the Mediter-
hypothesis is reinforced by the fact that no wildfires were          ranean (Diapouli et al., 2014).
recorded by the local forest fire service (https://aviales.ru,          The last pollution episode W7 was observed at the end of
last access: 1 April 2022) during October 2020 in western            October 2020. Although it occurred in the warm period, it is
Siberia and Krasnoyarskiy Kray.                                      rather related to Russian FLR and European TRA emissions
    Pollution episode W3 is related to strong springtime wild-       (Supplement Table S5, Fig. 5b). At the end of October 2020
fire activity that occurred in southern Siberia. The retro-          air masses came mainly from Europe, passing through the
plumes on 18 and 23 April 2020 showed that the air origi-            Yamal Peninsula.
nated from Central Asia, a large territory of southern Siberia
and Krasnoyarskiy Kray, and arrived at Bely Island through           4    Conclusions
western Siberia from the southeast (Supplement Fig. S1,
Fig. 9). High footprint emission sensitivities coincided with        The present paper aims at performing a quantitative analy-
the location of large wildfires resulting in BB contribution to      sis of the Arctic pollution via high-resolution measurements
surface BC at the station equal to 28 % (18 April 2020) and          from a recently developed aerosol station at Bely Island
19 % (23 April 2020). The most significant impact of wild-           (Kara Sea) combined with Lagrangian modeling. A conse-
fires was observed on 23 April 2020, when the 6 h median             quent goal is to examine the impact of anthropogenic and
EBC concentration reached 700 ng m−3 with AAE ranging                natural sources to the high Arctic as a result of long-range
from 1.3 to 1.5, clearly indicating an elevated contribution of      transport. The main results can be summarized as follows.
BrC (Supplement Table S5).
    Wildfires occurred in northern Krasnoyarskiy Kray and                – EBC monthly climatology is following the typical Arc-
Sakha Republic, Central Siberia, between April and Novem-                  tic aerosol seasonal variation characterized by higher
ber 2020 (https://aviales.ru/popup.aspx?news=6286, last ac-                EBC concentrations in winter and lower in summer.
cess: 1 April 2022) that burned around 7 000 000 ha of for-
est. The pollution episode W4 on 7 July 2020 recorded a                  – AAE for aged BC larger than 1 indicates wildfire impact
6 h median EBC of 150 ng m−3 and an AAE of around 1.4,                     in the warm period, but mixing with gas flaring emis-
clearly indicating BB impact. The model captures this event                sions from nearby regions was also observed.
well, providing the highest BB contribution exactly when ob-             – The recently upgraded ECLIPSEv6 emissions and
served, equal to 90 % (Supplement Table S5). Air masses ar-                ECLIPSEv6 coupled with FLR from BCRUS represent
rived from the east and passed north of Krasnoyarskiy Kray                 measured EBC accurately in the cold period. Annual av-
where the large wildfires occurred (Fig. 9).                               erage contributions of anthropogenic emissions to sur-
    Unprecedented high wildfire-related BC concentrations                  face BC were 76 % and 80 % (50 % and 59 % from gas
were observed in September 2020 (pollution episode W6).                    flaring) for each dataset, respectively.
EBC concentrations exceeded 5 and 20 times the 80th per-
centile of the measurements. Maximum 6 h median EBC                      – The most significant model overestimation was ob-
reached 534 ng m−3 on 1 September 2020, and it was even                    served in February 2020 when air masses passed

https://doi.org/10.5194/acp-22-5983-2022                                             Atmos. Chem. Phys., 22, 5983–6000, 2022
5996 O. B. Popovicheva et al.: Siberian Arctic black carbon: gas flaring and wildfire impact
Figure 9. Examples of pollution episodes W3, W4 and W6 in the warm period (see Fig. 5b), during which BB contribution prevails. The
figure has been arranged similar to Fig. 7 (time series of measured EBC, modeled BC and AAE, footprint emissions sensitivities and BB
contribution to surface BC).
through non-gas-flaring regions. The largest underes- warm period, respectively. This is consistent with previ-
timation occurred in April 2020 during the period of ously reported source contributions to the Russian Arc-
spring agriculture fires. tic. When air is transported from Europe, other sources
such as TRA become important. The same applies for
– Daily BB emissions from CAMS were more efficient SHP emissions that become important in summertime
in representing pollution episodes than monthly GFED4 because of cruise activities and ice retreat.
emissions, and therefore they were mainly used here.
– Emissions from gas and oil fields in western Siberia and
– Russian emissions dominate during the whole year; Eu- northern European Russia cause the vast majority of the
ropean and Asian ones contribute up to 20 % in the pollution episodes in the Arctic.
cold period. Pollution episodes with EBC concentra-
tions above 90 ng m−3 occur in 18.5 % of the obser- – A total of 15 pollution episodes with concentrations
vation time. Monthly average FLR emissions dominate reaching close to 723 ng m−3 were detected. The dura-
(98 %) any other emission sector. tion of the cold pollution episodes is longer than of the
warm period, and the median (up to 160 ng m−3 ) and
– FLR and BB emissions contribute the largest share of maximum EBC (up to 450 ng m−3 ) concentrations are
EBC to the Island Bely station during the cold and higher.
Atmos. Chem. Phys., 22, 5983–6000, 2022 https://doi.org/10.5194/acp-22-5983-2022O. B. Popovicheva et al.: Siberian Arctic black carbon: gas flaring and wildfire impact 5997
In conclusion, the significance of high-quality measure- All model and code developments and calculations were supported
ments at the Island Bely station is established in the present by the COMBAT (Quantification of Global Ammonia Sources con-
study because (i) the station is located along the main path- strained by a Bayesian Inversion Technique) project funded by
way of air masses entering the Arctic, and (ii) it is north of ROMFORSK – Program for romforskning of the Research Coun-
the world’s largest gas flaring regions. The operation of the cil of Norway (Project ID: 275407) and the EC Horizon 2020 – Re-
search and Innovation Framework Programme ATMO-ACCESS In-
Island Bely station is an asset in source emission optimiza-
tegrating Activity under grant agreement no. 101008004. The work
tion because EBC measurements in the High Arctic are still was partly supported by the European Union’s Horizon 2020 Eu-
rare. ropean research infrastructures program ACTRIS-IMP under grant
agreement no. 871115. The article processing charges for this pub-
lication were paid by NILU – Norwegian Institute for Air Research.
Data availability. All model data used in the present publication,
together with all figures of footprint analysis and source contri-
butions to surface BC, are openly available through the websites Review statement. This paper was edited by Andreas Petzold
https://niflheim.nilu.no/NikolaosPY/Bely_2020_cams.py (Evange- and reviewed by three anonymous referees.
liou, 2022a) and https://niflheim.nilu.no/NikolaosPY/Bely_2020_
huang_cams.py (Evangeliou, 2022b). All raw model data can be
obtained from the corresponding author upon request. The defini-
tions of the regions and continents used in the current analysis are References
based on regional masks that can be seen in Supplement Fig. S3.
Akagi, S. K., Yokelson, R. J., Wiedinmyer, C., Alvarado, M. J.,
Reid, J. S., Karl, T., Crounse, J. D., and Wennberg, P. O.: Emis-
Supplement. The supplement related to this article is available sion factors for open and domestic biomass burning for use
online at: https://doi.org/10.5194/acp-22-5983-2022-supplement. in atmospheric models, Atmos. Chem. Phys., 11, 4039–4072,
https://doi.org/10.5194/acp-11-4039-2011, 2011.
Andreae, M. O. and Merlet, P.: Emission of trace gases and aerosols
Author contributions. OBP supervised the station operation, in- from biomass burning, Global Biogeochem. Cy., 15, 955–966,
terpreted data and wrote the manuscript. NE performed all the 2001.
FLEXPART simulations and analyses and wrote and coordinated Bond, T. C., Doherty, S. J., Fahey, D., Forster, P., Berntsen, T.,
the paper. VOK analyzed the data. MAC prepared the figures and DeAngelo, B., Flanner, M., Ghan, S., Kärcher, B., and Koch, D.:
assisted in the interpretation of the results. KE provided BB impact Bounding the role of black carbon in the climate system: A sci-
and AAE aging evaluation. AG performed AAE calculations and entific assessment, J. Geophys. Res.-Atmos., 118, 5380–5552,
evaluation of data quality. NSK supported the research. All authors 2013.
contributed to the final version of the manuscript. Böttcher, K., Paunu, V.-V., Kupiainen, K., Zhizhin, M., Matveev,
A., Savolahti, M., Klimont, Z., Väätäinen, S., Lamberg, H., and
Karvosenoja, N.: Black carbon emissions from flaring in Rus-
sia in the period 2012–2017, Atmos. Environ., 254, 118390,
Competing interests. The contact author has declared that nei-
https://doi.org/10.1016/j.atmosenv.2021.118390, 2021.
ther they nor their co-authors have any competing interests.
Cappa, C. D., Kolesar, K. R., Zhang, X., Atkinson, D. B., Pekour,
M. S., Zaveri, R. A., Zelenyuk, A., and Zhang, Q.: Under-
standing the optical properties of ambient sub- and supermi-
Disclaimer. Publisher’s note: Copernicus Publications remains cron particulate matter: results from the CARES 2010 field study
neutral with regard to jurisdictional claims in published maps and in northern California, Atmos. Chem. Phys., 16, 6511–6535,
institutional affiliations. https://doi.org/10.5194/acp-16-6511-2016, 2016.
Cassiani, M., Stohl, A., and Brioude, J.: Lagrangian stochastic mod-
elling of dispersion in the convective boundary layer with skewed
Acknowledgements. This research was performed in the frame turbulence conditions and a vertical density gradient: Formula-
of the development program of the Interdisciplinary Scientific and tion and implementation in the FLEXPART model, Bound.-Lay.
Educational School of M. V. Lomonosov Moscow State University Meteorol., 154, 367–390, 2015.
“Future Planet and Global Environmental Change”. The authors Chang, R. Y.-W., Leck, C., Graus, M., Müller, M., Paatero, J.,
wish to thank Tony Hanson (Magee Scientific) for his support on Burkhart, J. F., Stohl, A., Orr, L. H., Hayden, K., Li, S.-M.,
the AE33 aethalometer installation and operation at the Island Bely Hansel, A., Tjernström, M., Leaitch, W. R., and Abbatt, J.
station, as well as Anton Sinitsky for organizational support. P. D.: Aerosol composition and sources in the central Arctic
Ocean during ASCOS, Atmos. Chem. Phys., 11, 10619–10636,
https://doi.org/10.5194/acp-11-10619-2011, 2011.
Financial support. Development of the methodology for aethalo- Cho, M.-H., Park, R. J., Yoon, J., Choi, Y., Jeong, J. I., Labzovskii,
metric measurements and AAE calculations was performed in the L., Fu, J. S., Huang, K., Jeong, S.-J., and Kim, B.-M.: A missing
frame of RSF project #19-77-30004. The aerosol infrastructure de- component of Arctic warming: black carbon from gas flaring,
velopment methodology was implemented under the RF Ministry of Environ. Res. Lett., 14, 094011, https://doi.org/10.1088/1748-
Science and Higher Education (agreement no. 075-15-2021-938). 9326/ab374d, 2019.
https://doi.org/10.5194/acp-22-5983-2022 Atmos. Chem. Phys., 22, 5983–6000, 2022You can also read