Contrasts in dissolved, particulate, and sedimentary organic carbon from the Kolyma River to the East Siberian Shelf
←
→
Page content transcription
If your browser does not render page correctly, please read the page content below

Research article
Biogeosciences, 20, 271–294, 2023
https://doi.org/10.5194/bg-20-271-2023
© Author(s) 2023. This work is distributed under
the Creative Commons Attribution 4.0 License.

Contrasts in dissolved, particulate, and sedimentary organic carbon
from the Kolyma River to the East Siberian Shelf
Dirk Jong1 , Lisa Bröder1,2 , Tommaso Tesi3 , Kirsi H. Keskitalo1 , Nikita Zimov4 , Anna Davydova4 , Philip Pika1 ,
Negar Haghipour2 , Timothy I. Eglinton2 , and Jorien E. Vonk1
1 Department    of Earth Sciences, Vrije Universiteit, Amsterdam, the Netherlands
2 Geological   Institute, Swiss Federal Institute of Technology, Zürich, Switzerland
3 Institute of Polar Sciences, National Research Council, Bologna, Italy
4 Pacific Geographical Institute, Far East Branch, Russian Academy of Sciences, Northeast Science Station, Cherskiy, Russia

Correspondence: Dirk Jong (d.j.jong@vu.nl) and Jorien E. Vonk (j.e.vonk@vu.nl)

Received: 20 June 2022 – Discussion started: 27 June 2022
Revised: 11 October 2022 – Accepted: 13 December 2022 – Published: 17 January 2023

Abstract. Arctic rivers will be increasingly affected by the    more, decreasing mineral surface area-normalised OC- and
hydrological and biogeochemical consequences of thaw-           biomarker loadings suggest that SOC might be reactive along
ing permafrost. During transport, permafrost-derived organic    the land–ocean continuum and almost all parameters were
carbon (OC) can either accumulate in floodplain and shelf       subjected to rapid change when moving from freshwater to
sediments or be degraded into greenhouse gases prior to fi-     the marine environment. This suggests that sedimentary dy-
nal burial. Thus, the net impact of permafrost OC on cli-       namics play a crucial role when targeting permafrost-derived
mate will ultimately depend on the interplay of complex         OC in aquatic systems and support earlier studies highlight-
processes that occur along the source-to-sink system. Here,     ing the fact that the land–ocean transition zone is an efficient
we focus on the Kolyma River, the largest watershed com-        reactor and a dynamic environment. The prevailing inconsis-
pletely underlain by continuous permafrost, and marine sed-     tencies between freshwater and marine research (i.e. target-
iments of the East Siberian Sea, as a transect to investi-      ing predominantly DOC and SOC respectively) need to be
gate the fate of permafrost OC along the land–ocean con-        better aligned in order to determine to what degree thawed
tinuum. Three pools of riverine OC were investigated for        permafrost OC may be destined for long-term burial, thereby
the Kolyma main stem and five of its tributaries: dissolved     attenuating further global warming.
OC (DOC), suspended particulate OC (POC), and riverbed
sediment OC (SOC). They were compared with earlier find-
ings in marine sediments. Carbon isotopes (δ 13 C, 114 C),
lignin phenol, and lipid biomarker proxies show a contrast-     1   Introduction
ing composition and degradation state of these different car-
bon pools. Dual C isotope source apportionment calculations     Permafrost regions store approximately half of the global
imply that old permafrost-OC is mostly associated with sedi-    soil organic carbon (OC) (Hugelius et al., 2014; Zimov et
ments (SOC; contribution of 68±10 %), and less dominant in      al., 2006a). Amplified warming of the Arctic, currently three
POC (38 ± 8 %), whereas autochthonous primary production        times as fast as the global average (IPCC, 2021), warms per-
contributes around 44 ± 10 % to POC in the main stem and        mafrost on a global scale (Biskaborn et al., 2019). Permafrost
up to 79±11 % in tributaries. Biomarker degradation indices     thaw and associated shifts in hydrology (Walvoord and Kury-
suggest that Kolyma DOC might be relatively degraded, re-       lyk, 2016), impact regional carbon cycling through the re-
gardless of its generally young age shown by previous stud-     lease of organic matter from this previously frozen pool to the
ies. In contrast, SOC shows the lowest 114 C value (oldest      fluvial network. In addition, the release of nutrients and sed-
OC), yet relatively fresh compositional signatures. Further-    iment leads to a multitude of effects on the biogeochemical
                                                                properties of inland and coastal waters (Terhaar et al., 2021;

Published by Copernicus Publications on behalf of the European Geosciences Union.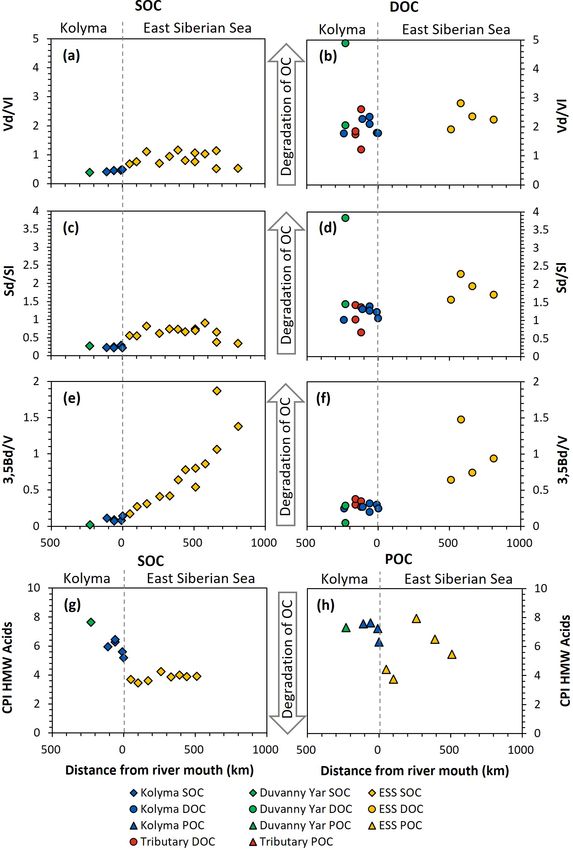
272                   D. Jong et al.: Contrasts in DOC, POC and SOC from the Kolyma River to the East Siberian Shelf

Vonk et al., 2015). Furthermore, decomposition of OC from           port, and especially its interplay with DOC and SOC, remain
thawing permafrost soils releases greenhouse gases (CO2 ,           elusive.
CH4 ) into the atmosphere, causing further climate warming             To better understand the interaction and exchange of POC
(Schuur et al., 2015).                                              with river- and marine sediments, as well as DOC, all these
   Arctic rivers, like rivers in general, serve as integrators of   OC pools need to be considered. Yet to date, studies on
their catchments, tracking changes in terrestrial signatures of     riverine SOC transport and degradation are limited and con-
the transported organic matter at the river mouth, and can          tradictory. In the Danube River, SOC concentrations and
therefore be used as indicators for watershed-wide processes        mineral-specific surface area-normalised biomarker loadings
such as permafrost thaw or soil remobilization (van Dongen          decrease downstream, suggesting significant SOC degrada-
et al., 2008; Wild et al., 2019; Feng et al., 2013). Based on       tion during fluvial transport (Freymond et al., 2018). On the
river mouth monitoring, the six largest Arctic rivers are esti-     contrary, Scheingross et al. (2019) found in an experimental
mated to transport 40 Tg of fluvial OC, of which 34 Tg DOC          setting that particle abrasion and turbulent mixing of POC
and 6 Tg POC, into the Arctic Ocean (Holmes et al., 2012;           in the water column has only a limited effect on degrada-
McClelland et al., 2016). These estimates serve as impor-           tion, and suggests that degradation takes place mostly during
tant baseline data for terrestrial carbon export to the Arc-        floodplain storage of sediment. Repasch et al. (2021) (Rio
tic Ocean. However, fluvial OC cycling already occurs in            Bermejo, Argentina) and Hilton et al. (2015) (Mackenzie
headwater streams, and extends beyond the river mouth to            River, Canada) show that eroded POC is efficiently trans-
the shelf seas. Inland waterways are known not just to con-         ported by rivers, redeposited in floodplains or basins off-
servatively channel fluvial OC towards the ocean but also           shore, and suggest that sediment transport time and min-
on the one hand to actively degrade OC into greenhouse              eral protection of OC might regulate the magnitude and rate
gases and on the other hand to sequester OC on short and            of POC degradation. Additionally, processes such as leach-
long timescales (days to millennia) (Cole et al., 2007; Drake       ing of POC and SOC, and, vice versa, adsorption of DOC
et al., 2018). Similarly, the breakdown of terrestrial OC in        to soil or mineral particles, influence both the composition
the marine environment (e.g., Alling et al., 2010; Bröder et        and degradability of OC (mineral binding ballasts), and slow
al., 2018), subsequent ocean acidification (Semiletov et al.,       down the degradation of OC (Hemingway et al., 2019; Keil
2016) and increase in marine primary production (Terhaar et         et al., 1994; Keskitalo et al., 2022; Kleber et al., 2021; Vonk
al., 2021) have been the focus of recent studies. To better as-     et al., 2010b), whereas leaching of OC to the dissolved phase
sess the processing and fate of terrestrial organic matter in       increases its potential for degradation (Abbott et al., 2014;
aquatic systems, we should regard these environments as be-         Mann et al., 2015; Rogers et al., 2021; Vonk et al., 2013). No
ing linked in a land–ocean continuum or as a carbon cycle           previous studies, to our knowledge, have addressed transport
“without boundaries” (Battin et al., 2009).                         and degradation of SOC in the Kolyma River using riverbed
   For a complete assessment of fluvial OC, one needs to            samples upstream from the Kolyma River mouth.
look at three different compartments: dissolved organic car-           Here, for the first time in this river system, we com-
bon (DOC; operationally defined as < 0.7 µm), suspended             bine the investigation of three fractions of fluvial OC (dis-
particulate organic carbon (POC; > 0.7 µm), and sedimen-            solved, particulate, and sedimentary), along a 250 km-long
tary organic carbon (SOC). In the six largest Arctic rivers,        river transect in the lower reaches of the Kolyma River, in-
DOC concentrations are generally higher than POC concen-            cluding five of its tributaries. Furthermore, we connect our
trations (Holmes et al., 2012; McClelland et al., 2016); how-       fluvial data with published records from a 1000 km-long tran-
ever, DOC consists predominantly of recent terrestrial ma-          sect across the East Siberian Sea (ESS) (Tesi et al., 2014;
terial, whereas POC is predominantly sourced from deeper            Vonk et al., 2010a, 2012; Bröder et al., 2019; Salvadó et al.,
soils and permafrost (Wild et al., 2019). The fraction of DOC       2016). We applied a variety of bulk analyses (OC %, δ 13 C,
that is derived from Yedoma permafrost, Pleistocene-aged            114 C, mineral-specific surface area), and used molecular
permafrost deposits rich in OC, along the Kolyma River, is          geochemical tracers (long-chain n-alkanoic acids, and lignin
rapidly degraded upon thawing (Mann et al., 2015; Rogers et         and cutin-derived products) to untangle, for each fraction of
al., 2021; Vonk et al., 2013). In contrast, POC derived from        OC, its sources and the effect of fractionation and degra-
thermal erosion of river banks and coastlines, thermokarst,         dation during its transport via different aquatic (freshwater,
and other abrupt permafrost thaw features may be less prone         marine) and sedimentary (i.e. river, delta, estuary, shelf) en-
to rapid degradation, and transported over longer distances         vironments of the land–ocean continuum.
(Keskitalo et al., 2022; Salvadó et al., 2016). Concentra-
tions, fluxes, and isotopic signatures of POC in Arctic rivers
have been studied in the past decade (McClelland et al.,
2016; Wild et al., 2019), including more recent studies on
the molecular structure and degradation (e.g., Kolyma river;
Bröder et al., 2020; Keskitalo et al., 2022). However, the cy-
cling and degradation of POC during lateral aquatic trans-

Biogeosciences, 20, 271–294, 2023                                                       https://doi.org/10.5194/bg-20-271-2023
D. Jong et al.: Contrasts in DOC, POC and SOC from the Kolyma River to the East Siberian Shelf                               273

2     Methods                                                    cluded in the present study to give an insight into temporal
                                                                 variations at these locations, in addition to spatial variations
2.1    Study area and sample locations                           along the transect.
                                                                    Furthermore, this new dataset is compared with published
The Kolyma River in Northeast Siberia is the world’s largest     data on surface water DOC and POC, and surface sediments
watershed (653 000 km2 ) entirely underlain by continuous        from the East Siberian Sea. The East Siberian Sea is situ-
permafrost (Holmes et al., 2012). Its discharge follows a dis-   ated between the Laptev Sea and the New Siberian Islands
tinct seasonal pattern typical of Arctic rivers, with a strong   to the west and the Chukchi Sea and Wrangel Island to the
peak during the spring freshet, and lower baseflow in winter.    east (Fig. 1a). It covers an area of approximately one million
Annual water discharge is 109±7 km3 (Holmes et al., 2012),       square kilometres, and has an average depth of 58 metres.
and the average annual DOC and POC flux from the Kolyma          Previous publications (Tesi et al., 2014; Vonk et al., 2010a,
River to the East Siberian Sea is 818 Gg (109 g) and 123 Gg      2012) have characterised surface water DOC and POC in
per year respectively (Holmes et al., 2012; McClelland et al.,   the ESS, along with underlying surface sediments, follow-
2016). In its lower reaches, the river flows roughly north-      ing the paleoriver valley of the Kolyma up to 600 km off-
ward through lowlands that consist of icy loess-like Yedoma      shore (Fig. 1c). The samples along this transect were col-
deposits, or ice complex permafrost deposits (ICD), of the       lected on 3–5 September 2008, and started ca. 12 km farther
Pleistocene age. This Yedoma permafrost has a high OC con-       offshore than our farthest river transect point (K6). An in-
tent (2 %–5 %; Zimov et al., 2006b). Most of the Kolyma          crease in salinity was measured in surface water moving from
watershed is covered by boreal forests (taiga) dominated by      K 5 (0.15) to K 6 (2.6) to the first point of the marine tran-
the Cajanderi larch (Larix cajanderi Mayr), and the Kolyma       sect (YS-34B, 17.8; Vonk et al., 2010a). Data from a more
Delta further north is in the tundra biome.                      recent cruise (between 31 July and 4 August 2014) are used
   Sampling of the Kolyma River took place from the North-       to extend this transect up to 1000 km offshore (Bröder et al.,
east Science Station in Cherskiy during summer 2018,             2019; Salvadó et al., 2016). The ESS around the extended
from 23 July to 3 August, directly after spring freshet          transect is influenced by the Pacific inflow and the Transpolar
(Fig. A1). We covered a 250 km-long transect of the Kolyma       Drift farther offshore, and the West to East flowing Siberian
River starting at 68.63890◦ N 159.12080◦ E, where the river      Coastal Current closer to shore (Stein and Macdonald, 2004;
passes a ca. 10 km-long Yedoma-deposit riverbank expo-           Dudarev et al., 2022). The list of ESS station locations and
sure (Duvanny Yar, DY) to the delta outflow into the East        data used in this study can be found in Table A1.
Siberian Sea, including sampling the less-studied western
delta branch of the Kolyma River (K1–K6, Fig. 1b, Ta-            2.2     Sampling and sample processing
ble 1). In addition to the samples from the Kolyma River
main stem, samples were taken from several tributaries with      2.2.1    Particulate and dissolved organic matter, and
varying catchment sizes. Two of the larger tributaries of                 solid phase extractions
the Kolyma were sampled, the Maly Anyuy (MA), and the
Bolshoy Anyuy (BA), with a catchment size of 49 800 and          About 20 L of surface water was collected in LDPE bags (Vi-
57 300 km2 respectively, and a smaller tributary, the Pan-       top, Rink GmbH) in the centre of the river at each location,
teleikha (PAN; 1630 km2 ), where an algal bloom was ob-          except for sample DY KOL, which was sampled at the shore
served at the time of sampling (30 July 2018). In addition,      of the Kolyma in the outflow of a thaw stream (Table 1).
two small streams with contrasting characteristics were sam-     Within 12 h of sampling, the collected surface water was fil-
pled: (i) Y3 (∼ 17 km2 ), characterised by a relatively high     tered through pre-combusted (400 ◦ C, 12 h including tem-
DOC load and low POC load, representing soil leaching and        perature ramping) and pre-weighed glass fibre filters (pore
active layer drainage (Bröder et al., 2020), and (ii) a thaw     size 0.7 µm, Whatman GF/F). Small GF/F filters (diameter
stream at Duvanny Yar (DY TS; < 0.1 km2 ), characterised         47 mm; glass filtration tower, Wheaton) were used for total
by an extremely high POC load, and a relatively low DOC          suspended particulate matter (SPM), POC concentration, and
load, representing eroding Yedoma permafrost (Vonk et al.,       carbon isotope analyses, whereas large GF/F filters (diameter
2013). At Duvanny Yar, additional samples were taken from        90 mm, pore size 0.7 µm, Whatman; custom made, stainless
a thawing permafrost headwall, and from the outflow of a         steel filtration tower) were used to collect larger quantities
thaw stream into the Kolyma River (DY KOL) to characterise       of suspended material for biomarker analysis. Filters were
the Yedoma permafrost endmember and mixing of the thaw           stored and transported frozen (−20 ◦ C), and freeze-dried be-
streams with Kolyma waters.                                      fore further analyses.
   We compare our samples with the data reported in Bröder          The filtrate (DOC) was stored in pre-combusted 40 mL
et al. (2020), including POC samples from the Kolyma River       amber glass vials, acidified to pH 2 with concentrated HCl,
(sampled at Cherskiy) and the tributary stream Y3, cover-        and transported refrigerated (+5 ◦ C) and dark. After sub-
ing the open-water seasons (late May until late September        sampling, the remaining filtrate (0.8 to 12.8 L, depending
or early October) of 2013 and 2015. These samples were in-       on DOC concentration) was used for the solid phase extrac-

https://doi.org/10.5194/bg-20-271-2023                                                     Biogeosciences, 20, 271–294, 2023
274                    D. Jong et al.: Contrasts in DOC, POC and SOC from the Kolyma River to the East Siberian Shelf

Figure 1. (a) Location of the Kolyma watershed (Made with ArcMap™, © Esri. All rights reserved.). (b) Kolyma River delta with sample
locations. In blue the Kolyma mainstem samples, orange the tributaries (Panteleikha (PAN), Bolshoy and Maly Anyuy (BA and MA), and
Y3), green Duvanny Yar (DY). For reference, location K 2 is at the town of Cherskiy. Background image adapted from Mann et al. (2012).
(c) Sample location in the East Siberian Sea following the Kolyma paleoriver-transect, extended to the shelf break. In red, the first eight
locations offshore from South to North: YS34B to YS41 (Vonk et al., 2010a; Tesi et al., 2014); four locations farther offshore from South to
North: YS91, YS90/SWE-63, YS88, YS86. In green, south to north: SWE-60, SWE-61, YS90/SWE-63, SWE-64, SWE-65, SWE-66, and
SWE-67 (Salvadó et al., 2016; Bröder et al., 2019). The black box shows the location of panel (b).

Table 1. Sample locations, description, sampling data, short ID, and the distance of each location to the mouth of the Kolyma River.

   Short ID      Location description                      Date sampled     Latitude (◦ N)   Longitude (◦ E)    Distance to ocean (km)
   Kolyma
   K1            Before Duvanny Yar                        23 Jul 2018      68.63890         159.12080                                 240
   K2            At Cherskiy                               31 Jul 2018      68.77598         161.26494                                 110
   K3            Eastern branch                            28 Jul 2018      69.20045         161.44044                                  60
   K4            Western branch                            31 Jul 2018      69.09501         161.01700                                  60
   K5            Main delta channel                        28 Jul 2018      69.53432         161.93555                                  10
   K6            Outflow to ESS                            28 Jul 2018      69.67805         162.38632                                   0
   Duvanny Yar
   DY TS         Yedoma thaw stream                        2 Aug 2018       68.62987         159.14470                                 230
   DY KOL        Kolyma directly at thaw stream outflow    23 Jul 2018      68.63060         159.15478                                 230
   Tributaries
   BA            Bolshoy Anyui                             1 Aug 2018       68.46015         160.78267                                 160
   MA            Maly Anyui                                1 Aug 2018       68.45193         160.81279                                 160
   Y3            Y3                                        26 Jul 2018      68.75919         161.44769                                 120
   PAN           Panteleikha                               30 Jul 2018      68.70301         161.51472                                 120

Biogeosciences, 20, 271–294, 2023                                                             https://doi.org/10.5194/bg-20-271-2023
D. Jong et al.: Contrasts in DOC, POC and SOC from the Kolyma River to the East Siberian Shelf                                275

tion (SPE) of DOC, following the method of Louchouarn et           larly checked against two certified reference materials (5.41
al. (2000) and Spencer et al. (2010). For this purpose, the fil-   and 27.46 m2 g−1 ).
trate was acidified to pH 2 using concentrated HCl (37 %)
and 2 % methanol was added to aid extraction efficiency            2.4     Bulk elemental analyses
(Spencer et al., 2010). The acidified filtrate was pumped
through a pre-rinsed SPE cartridge (60 mL Mega Bond-Elut           2.4.1    Carbon concentrations and stable carbon isotope
C18; Agilent) using a peristaltic pump with flexible silicone               analyses
tubing (Cole-Parmer instrument company). The loaded SPE
cartridges were stored and transported refrigerated (+5 ◦ C)
and dark. Back at the Vrije Universiteit Amsterdam, the SPE        Concentration of DOC and DOC-δ 13 C were analysed with
                                                                   an Aurora1030 TOC analyser coupled to a Delta V Advan-
cartridges were extracted by eluting twice with 40 mL of
methanol into pre-combusted glass vials, which were subse-         tage isotope ratio mass spectrometer (IRMS) at KU Leuven
quently dried on a hot plate at 40–50 ◦ C under a stream of N2 .   (Belgium), following the method described by Deirmendjian
The recovery of the SPE procedure was 63 ± 7 % (n = 12).           et al. (2020).
                                                                      The POC concentrations, and POC-δ 13 C were measured
                                                                   on a combined elemental analyser – isotope ratio mass spec-
2.2.2    Riverbed sediment organic matter
                                                                   trometer (EA-IRMS) at the National Research Council Insti-
Riverbed sediments of the Kolyma main stem were sampled            tute of Polar Sciences (Bologna, Italy). Before subsampling,
using a Van Veen grab-sampler, sampling surface sediment           the concentration of SPM was determined by weighing the
up to 1–5 cm, and stored in sterile Whirl-Pak® bags. These         sediment-loaded filters after freeze-drying and dividing by
samples represent recently deposited sediment (i.e. with a         the volume of water filtered. A subsample was punched out
large fraction of silt and clay) in more quietly flowing lo-       of each 47 mm GF/F filter, placed in a pre-combusted silver
cations of the river and delta. Within 12 h of collection, sed-    capsule, and weighed. Inorganic C was removed by adding
iments were frozen (−20 ◦ C) and remained so during trans-         50 µL of 1 M HCl twice to the silver capsules. After oven
port. At the laboratory at the Vrije Universiteit Amsterdam,       drying (over NaOH pellets to neutralise acid, at 60 ◦ C), the
the samples were freeze-dried, and sieved through a 200 µm         silver capsules were wrapped in tin capsules to aid combus-
and a 63 µm mesh, resulting in three size fractions of sedi-       tion during analysis.
ment: coarse sand (> 200 µm), fine sand (63–200 µm) and a             Sediment (< 63 µm fraction) was crushed and homoge-
combination of silt and clay (< 63 µm).                            nized in an agate mortar, and two subsamples of each sample
   Particles coarser than silt (> 63 µm) are quickly deposited     were weighed into pre-combusted silver capsules for total
during sediment transport, and carry little mineral-associated     OC and δ 13 C analyses. The sediment was acidified as de-
OC. In contrast, the fine sediment fraction (< 63 µm) carries      scribed above for the filters to remove inorganic C, wrapped
the bulk of the mineral-associated OC (Coppola et al., 2007;       in tin capsules after acidification, and measured for OC at
                                                                   the Sediment Laboratory and for δ 13 C at the Stable Isotope
Keil et al., 1994; Tesi et al., 2016) and is considered to rep-
resent an integrated signal of suspended matter transported        Laboratory of the Vrije Universiteit Amsterdam (The Nether-
by the river (Freymond et al., 2018). Therefore, in this study,    lands). All δ 13 C values are reported in ‰ relative to the in-
we focus only on the fine, easily transportable fraction of the    ternational standard Vienna Pee Dee Belemnite (VPDB).
sediment. The term “SOC” here therefore refers to the OC
content of the < 63 µm sediment fraction. This fractionation       2.4.2    Radiocarbon analyses
step allows us to cross-compare the same fraction of sedi-
ment and OC at different locations along the river transect        Radiocarbon (14 C) analyses were carried out using an EA
and beyond, on the shelf, despite the heterogeneity of bulk        coupled to a MICADAS accelerator mass spectrometer at
sediments.                                                         the Laboratory of Ion Beam Physics of the Swiss Federal
                                                                   Institute of Technology (ETH, Zürich, Switzerland), follow-
2.3     Mineral-specific surface area analysis                     ing the method described in McIntyre et al. (2017). A sec-
                                                                   ond subsample of the GF/F filters (POC) was punched out
For mineral surface area (SA) measurements, subsamples of          and a subsample of sediment (SOC) was taken and weighed
about 1.5 g freeze-dried sediment were combusted at 450 ◦ C        in pre-combusted silver capsules for 14 C analyses. For these
for 12 h to remove OC, rinsed twice with MilliQ to re-             samples, inorganic carbon was removed by fumigation in a
move salt and ashes, and freeze dried again. Directly prior        desiccator with 37 % HCl at 60 ◦ C for 72 h (Komada et al.,
to analysis, the samples were degassed for a minimum of            2008). After fumigation, samples were dried over NaOH pel-
2 h at 300 ◦ C under vacuum. The analyses were performed at        lets at 60 ◦ C for 72 h to neutralise the acid, and wrapped
the Vrije Universiteit Amsterdam on a Quantachrome Nova            in tin capsules. The final 14 C results are corrected for con-
4200e, using the six-point Brunauer–Emmett–Teller method           stant background contamination using the method described
(Brunauer et al., 1938). The SA measurements were regu-            in Haghipour et al. (2018). All radiocarbon data are presented

https://doi.org/10.5194/bg-20-271-2023                                                      Biogeosciences, 20, 271–294, 2023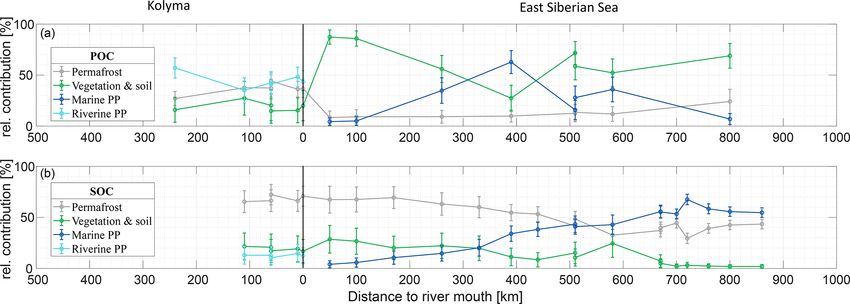
276                   D. Jong et al.: Contrasts in DOC, POC and SOC from the Kolyma River to the East Siberian Shelf

either as 114 C (‰) or as conventional, uncalibrated radiocar-     was further cleaned of impurities by column chromatography
bon age (years) (Stuiver and Polach, 1977).                        (SiO2 , water-deactivated), by eluting first with hexane, then
                                                                   DCM : hexane (4 : 1) and DCM. The cleaned methylated n-
2.5     Molecular and biomarker analyses                           alkanoic acids, concentrated in the DCM : hexane fraction,
                                                                   were then analysed on a GC-MS at the National Research
2.5.1    CuO oxidation products                                    Council Institute of Polar Sciences (Bologna, Italy). Quan-
                                                                   tification of high molecular weight (HMW; carbon chain
Microwave-assisted alkaline CuO oxidation was carried out          length 24–30) n-alkanoic acids was done by comparison with
at the laboratory of the Vrije Universiteit Amsterdam to ex-       commercially available standards (alkanoic acid C22, C24,
tract lignin and cutin products from SPE-DOC and SOC sam-          C26, C28 and C30; Sigma-Aldrich). The carbon preference
ples, following the method of Goñi and Montgomery (2000).          index (CPI) of the HMW n-alkanoic acids is calculated as the
In summary, Teflon extraction vessels were loaded with ∼ 2–        ratio between even and odd carbon chain lengths (Eq. 1):
4 mg OC, 500 mg CuO and 50 mg ferrous ammonium sul-
                                                                               1
                                                                                   · [C23 + C25 + C27 + C29] + 21 · [C25 + C27 + C29 + C31]
fate. For SPE-DOC samples, 10 mg of glucose was added              CPI =
                                                                               2
                                                                                                                                               .   (1)
to prevent superoxidation of lignin polymers. Then, 10 mL                                         [C24 + C26 + C28 + C30]

of degassed 2 N NaOH solution was added under oxygen-              2.6     Endmember analyses
free conditions. The oxidation was performed using a MARS
6 microwave (CEM Cooperation) at 150 ◦ C (1600 W, 8 min            Source apportionment models are commonly used to dis-
ramp, with continued heating for 90 min). The resulting ex-        tinguish different source contributions to the total OC pool
tract was centrifuged, transferred to a pre-combusted glass        based on their isotopic signature. Dual-carbon isotope end-
vial, and an internal recovery standard (Ethyl vanillin;           member mixing models have proven to be useful tools for
Sigma-Aldrich) was added. The samples were acidified to            disentangling the various sources of organic matter in dif-
pH 1 by adding concentrated HCl, and then extracted twice          ferent environments, as these Markov chain Monte Carlo
with ethyl acetate. The samples were dehydrated with anhy-         (MCMC) techniques account for uncertainties in both the
drous Na2 SO4 , transferred to combusted amber glass vials,        endmember values and the uncertainties in sample measure-
and dried under a flow of N2 . Prior to analyses on an Agilent     ments and thus provide better constraints on the relative con-
gas chromatograph-mass spectrometer (GC-MS) at the Na-             tributions of different sources to bulk OC (Andersson et al.,
tional Research Council Institute of Polar Sciences (Bologna,      2015; Bosch et al., 2015; Vonk et al., 2012; Wild et al.,
Italy), samples were re-dissolved in pyridine and methylated       2019). For this sample set, we identified three different OC
with N, O-Bistrifluoroacetamide. The individual lignin phe-        sources that contributed to the POC and SOC, and calculated
nols, benzoic acids, and p-hydroxybenzenes were quantified         their relative fractions using a dual-isotope δ 13 C and 114 C
by comparison with commercially available standards, and           endmember mixing model. Our approach combines an iso-
quantification of cutin-derived products was carried out us-       topic mass-balance source apportionment model, Bayesian
ing the response of trans-cinnamic acid.                           MCMC, which uses dual-isotope signatures (endmembers)
                                                                   from bulk OC to differentiate between the following three
2.5.2    Lipid biomarker analyses                                  sources: (i) permafrost OC; (ii) modern vegetation and sur-
                                                                   face soil OC; (iii) riverine primary production OC (for the
For the extraction of lipid biomarkers from POC, freeze-           Kolyma samples) or marine primary production OC (for the
dried 90 mm GF/F filters were selected and placed in pre-          ESS samples). We defined the endmember for permafrost OC
extracted Teflon extraction vessels. For some locations, mul-      as a mixture of Pleistocene ice complex deposits (ICD) and
tiple filters (up to three) had to be extracted to obtain enough   Holocene permafrost (including Holocene peat), with a δ 13 C
material (∼ 6 to 26 mg OC). For riverbed SOC, ∼ 2 g of sedi-       value of −26.3±0.7 ‰ (Vonk et al., 2012) and a 114 C value
ment was weighed in per extraction vessel, containing ∼ 12–        of −761.2 ± 120 ‰. This 114 C value was derived as the
17 mg OC. Samples were solvent-extracted twice with 15 mL          mean of the ICD endmember (−954±65.8 ‰; n = 329; Wild
DCM : MeOH (9 : 1 v/v) at 100 ◦ C (1600 W, 5 min ramp,             et al., 2019) and the Holocene/peat permafrost endmember
continued heating for 15 min), using a MARS 6 microwave            (−567 ± 157 ‰; n = 138; Wild et al., 2019) assuming ap-
(CEM Cooperation). The resulting extract was saponified            proximately equal carbon stock input of these two pools in
with 10–15 mL of KOH in methanol (0.5 M) at 70 ◦ C for             this region (Zimov et al., 2006a). Different weighing of these
2 h. Subsequently, 5–10 mL of MilliQ water with 2 % NaCl           two permafrost OC pools (e.g., spatial area-weighing of ICD
was added. The neutral fraction (containing n-alkanes) was         coverage giving a 114 C value of −683.7 ± 136 ‰) did not
extracted with hexane (3 × 10 mL), after which the samples         significantly change the result of the model. The endmember
were acidified to pH 2 with concentrated HCl. The acid             for the second source, modern vegetation and surface soil
fraction was then extracted with hexane : DCM (4 : 1 v/v),         OC (including the active layer, soil OC, and recent vegeta-
methylated with BF3 -MeOH (80 ◦ C, 30 min), and extracted          tion; hereafter “vegetation/soil OC”), was adapted from Wild
with DCM after addition of MilliQ water. The acid fraction         et al. (2019) with a δ 13 C value of −27.2 ± 1.1 ‰ (n = 150)

Biogeosciences, 20, 271–294, 2023                                                                https://doi.org/10.5194/bg-20-271-2023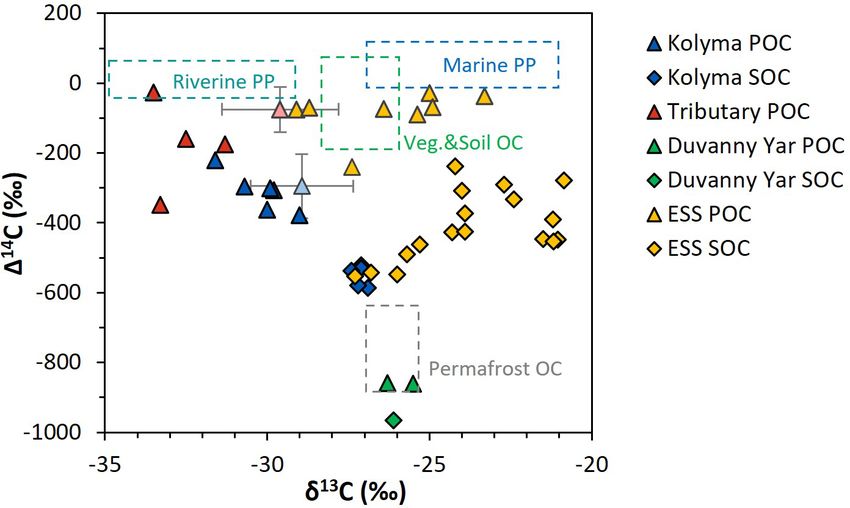
D. Jong et al.: Contrasts in DOC, POC and SOC from the Kolyma River to the East Siberian Shelf                                277

and a 114 C value of −52.7 ± 137.3 ‰ (n = 118). Wild et           (e.g., Bröder et al., 2020; McClelland et al., 2016), we do not
al. (2019) presented endmembers of these sources separately,      focus on the seasonal OC variability within fluvial systems
but, owing to the inclusion of a primary production source as     (i.e. comparing different stages of the hydrograph), but aim
a third source, we combined them into one contemporary ter-       to convey a consolidated picture of riverine dissolved, par-
restrial endmember. Therefore, their values were averaged,        ticulate, and sedimentary OC delivered to the East Siberian
equally weighted to one endmember. The third source, pri-         Sea, and to give an insight into the processes that affect these
mary production OC (fluvial or marine), has an endmember          OC pools along the land–ocean continuum.
δ 13 C value of −32.1±3.0 ‰ and a 114 C value of +11.0±37
for riverine samples (henceforth named “Riverine PP OC”),         3.1   Three contrasting OC pools: concentrations of
whereas the endmember for marine samples (“Marine PP                    DOC, POC, and SOC
OC”) is δ 13 C = −24.0 ± 3 ‰, 114 C = +60 ± 60 ‰ (Vonk et
al., 2012). The riverine PP OC endmember is based on a com-       In Arctic rivers, DOC and POC concentrations vary signif-
pilation of samples and using the endmember values of previ-      icantly during seasons. Concentrations found in this study
ous studies: δ 13 C = −30.5 ± 2.5 ‰, 114 C = +41.9 ± 4.2 ‰        (Table 2) match the typical range of DOC and POC val-
(Winterfeld et al., 2015a), δ 13 C = −30.6 ± 3.3 ‰, 114 C         ues of the Kolyma River in the late summer season (Bröder
= +48 ± 11 ‰ (Wild et al., 2019), and the sample of the           et al., 2020; Holmes et al., 2012; McClelland et al., 2016).
Panteleikha River from this study (δ 13 C = −33.5 ‰, 114 C        The DOC concentrations along the Kolyma River transect
= −26 ‰), where an algal bloom was observed during the            range from 2.76 to 4.97 mg L−1 , which is a little higher than
study period. For the marine δ 13 C endmember (−24.0 ±            DOC in ESS surface waters (∼ 0.6–1.8 mg L−1 ; Salvadó et
3 ‰), we also tested a value of −21 ± 1 ‰, used in Bröder et      al., 2016; Alling et al., 2010). The POC concentrations dur-
al. (2016) for ESS sediments. The modelling results showed        ing this period range from 1.49 to 2.73 mg L−1 and show a
a minimal, non-significant change for SOC in endmember            rapid decrease once offshore in the ESS, from 2.7 mg L−1
contributions (Fig. A2). However, for POC, there was a large      at location K6 to 0.2 mg L−1 approximately 50 km farther
shift on the first part of the marine transect from POC be-       at location YS34B (at a water depth of 10 m; Vonk et al.,
ing marine PP dominated to being vegetation/soil OC dom-          2010a, Fig. 1). The Kolyma tributaries PAN and Y3 show
inated using the −21 ± 1 ‰ endmember (Fig. A2). This is           notably higher DOC and POC concentrations of 21.5 and
probably related to the sharp transition from a riverine PP to    9.71 mg L−1 DOC, and 4.50 and 2.38 mg L−1 POC, respec-
a marine PP endmember, whereas in reality the transition is       tively, than the Kolyma. The sample DY TS shows ex-
not as sharp and likely a mixture of these two sources within     tremely high concentrations of DOC (103 mg L−1 ) and POC
the estuary. The contribution of the permafrost endmember to      (> 7300 mg L−1 ), which are in the same range as other thaw
the POC pool was not significantly affected by this shift. In-    streams at this location (Vonk et al., 2013). Sample DY KOL,
creasing or decreasing the standard deviation of either of the    located right at the outflow of a thaw stream into the Kolyma
marine PP endmembers (−24 ‰ and −21 ‰) from ±1 ‰ to               River, shows that the extremely high concentrations of DOC
±3 ‰ did not make a difference.                                   and POC coming from DY thaw streams are quickly di-
   The dual-isotope/three-sources version of the MCMC             luted by river water and/or settle rapidly to the riverbed.
source apportionment model was adapted from Bosch et              The DOC concentration in this sample is in the same range
al. (2015). We used MATLAB (version 2021a) to model               as the Kolyma main stem (2.75 mg L−1 ), whereas the POC
contributions of the three different sources, with the follow-    concentration remains elevated at 103 mg L−1 . The SOC
ing model parameters: 1 000 000 iterations, a burn-in (initial    concentrations in the < 63 µm fraction of riverine sediment
search phase) of 10 000, and a data thinning of 10. For further   show values ranging from 0.45 % to 1.0 % (0.76 ± 0.19 %,
details on the method see (Andersson et al., 2015; Andersson,     mean ± standard deviation, n = 5) along the Kolyma River
2011; Bosch et al., 2015).                                        transect, which are slightly lower than ESS SOC (which was
                                                                  not sieved), with concentrations between 0.80 % and 1.76 %
                                                                  (mean of 1.15 ± 2.94 %, n = 18; Salvadó et al., 2016; Vonk
3   Results and Discussion                                        et al., 2010a). The fraction of OC in particulate matter (OC
                                                                  concentrations normalised to TSS) is much higher than in
The Kolyma River transports fluvial organic matter towards        SOC, ranging from 6.7 % to 12.8 % within the Kolyma and
the East Siberian Sea in three different compartments: the        with values up to 47 % for the Pantaleikha, pointing towards
dissolved, particulate, and sedimentary OC pools. Our study       a significant contribution of primary production (i.e. pure or-
targets all these compartments and adds a spatial dimension       ganic matter without minerals) to the particulate load.
by not only sampling along a 250 km main stem transect, but
also including a range of tributaries, and extending the river-
ine transect ∼ 1000 km across the ESS using existing data
(Table A1; Bröder et al., 2019; Salvadó et al., 2016; Tesi et
al., 2014; Vonk et al., 2010a). In contrast to previous studies

https://doi.org/10.5194/bg-20-271-2023                                                      Biogeosciences, 20, 271–294, 2023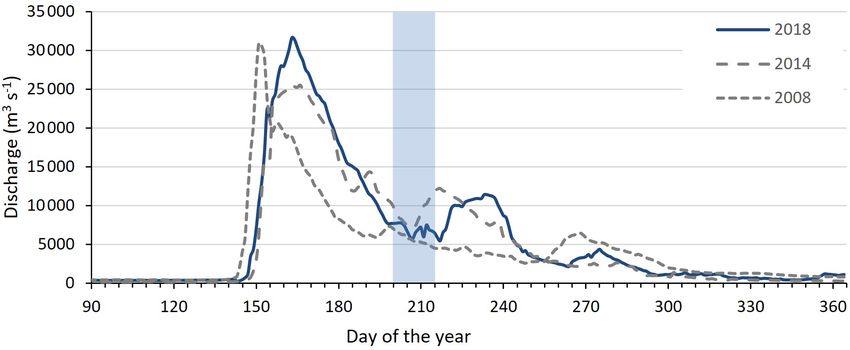
278                    D. Jong et al.: Contrasts in DOC, POC and SOC from the Kolyma River to the East Siberian Shelf

Table 2. Bulk data for sediment organic carbon (SOC), dissolved organic carbon (DOC), and particulate organic carbon (POC). Including
concentrations, surface area (SA), organic carbon loading and isotopic data δ 13 C, 114 C, conventional, uncalibrated radiocarbon age (years),
and fraction modern (Fm) with the measurement error.

  Short ID              SOC           SA    OC loading    Grain size                     δ 13 C       114 C       14 C age     Fm    Fm error
  Sediment < 63 µm     wt. %      m2 g−1    mg OC m−2     median µm                         ‰            ‰           years                 ±
  Kolyma
  K2                    0.82          9.6          0.85         39.5                   −27.1          −521           5850    0.483     0.003
  K3                    0.66          8.7          0.75         39.4                   −26.9          −586           7020    0.418     0.004
  K4                    1.00         11.9          0.84         37.0                   −27.1          −530           6000    0.474     0.003
  K5                    0.88         11.9          0.74         31.5                   −27.4          −537           6120    0.467     0.005
  K6                    0.45          8.4          0.54         46.8                   −27.2          −579           6890    0.424     0.004
  Duvanny Yar
  DY PF                 0.63         13.4          0.47         34.5                   −26.1          −965          26 800   0.036     0.001
  DOC and POC          DOC     DOC δ 13 C         POC          POC          SPM     POC δ 13 C    POC 114 C   POC 14 C age     Fm    Fm error
                     mg L−1            ‰        mg L−1        wt. %      mg L−1             ‰            ‰           years                 ±
  Kolyma
  K1                    2.76       −28.3           1.42         12.8        11.2       −31.6          −221           1940    0.785     0.010
  K2                    2.96       −30.0           1.71         6.68        25.6       −29.0          −379           3760    0.627     0.007
  K3                    3.60       −30.0           1.71         7.28        23.5       −29.8          −306           2870    0.700     0.008
  K4                    3.49       −29.4           1.49         8.12        18.4       −30.0          −362           3540    0.643     0.007
  K5                    3.23       −28.8           1.67         9.10        18.4       −30.7          −296           2750    0.710     0.010
  K6                    4.97       −27.3           2.73         8.12        33.7       −29.9          −301           2810    0.705     0.008
  Duvanny Yar
  DY TS                  103       −29.8          7325          1.22   6.00 × 10⁵      −25.5          −860          15 730   0.141     0.002
  DY KOL                2.75       −28.7          15.7          4.50          348      −26.3          −859          15 670   0.142     0.003
  Tributaries
  BA                    4.43       −29.5           1.70         7.85        21.7       −31.3          −175           1480    0.832     0.009
  MA                    3.16       −28.9           1.29         15.9        8.11       −33.3          −348           3370    0.658     0.006
  Y3                    21.5       −29.4           2.38         18.3        13.0       −32.5          −160           1500    0.830     0.010
  PAN                   9.71       −31.2           4.50         46.6        9.67       −33.5           −26            145    0.984     0.010

3.2    Three contrasting OC pools: isotopes of DOC,                       times of permafrost DOC in Arctic waters (Rogers et al.,
       POC, and SOC                                                       2021).
                                                                             The δ 13 C of Kolyma POC ranges from −29.0 ‰ to
                                                                          −31.6 ‰ , and the 114 C ranges from −221 ‰ to −379 ‰,
Each organic carbon pool (DOC, POC, and SOC) shows dis-
                                                                          corresponding to 1940 to 3760 years (Fig. 2). The δ 13 C val-
tinctly different stable carbon isotope (δ 13 C) and radiocarbon
                                                                          ues of the Kolyma transect correlate with POC % (the OC
isotope (114 C) ratios, which are important tools in character-
                                                                          weight % of dried particulate matter; R 2 = 0.91, p < 0.01)
ising OC and tracing OC from different sources. The DOC-
                                                                          and 114 C (R 2 = 0.79, p < 0.01), in other words, samples
δ 13 C along the Kolyma River transect ranges from −27.3 ‰
                                                                          with a high POC % have a more depleted δ 13 C value and a
to −30.0 ‰ (Table 2), which is comparable with previously
                                                                          less negative (younger) 114 C value, both supporting a sig-
published data (Feng et al., 2013; Mann et al., 2015; Wild
                                                                          nificant contribution from riverine production. The tributary
et al., 2019). Although we have not measured DOC-114 C
                                                                          and Duvanny Yar samples are clearly different from those of
in this work, earlier studies show that the Kolyma River and
                                                                          the Kolyma in their isotopic signature of POC: the two Du-
its tributary DOC is relatively young (114 C within the range
                                                                          vanny Yar POC samples are higher in δ 13 C (−25.5 ‰ and
+150 ‰ to −100 ‰; Neff et al., 2006; Wild et al., 2019). The
                                                                          −26.3 ‰), and have a substantially lower 114 C (−859 ‰
DOC-δ 13 C of the tributaries and Duvanny Yar are within the
                                                                          and −860 ‰; 15 700 years) than Kolyma POC, whereas
same range as the Kolyma, except for sample PAN, which
                                                                          the other tributaries (PAN, MA, BA, and Y3) show gener-
shows a lower δ 13 C value of −31.2 ‰. An earlier study on
                                                                          ally lower δ 13 C values (−31.3 ‰ to −33.5 ‰) and higher
a Duvanny Yar thaw stream found DOC-114 C values be-
                                                                          (i.e. younger) 114 C values (−26 ‰ to −348 ‰; 145 to
tween −974 ‰ and −911 ‰ (up to 30 000 years old) (Vonk
                                                                          3370 years) than Kolyma POC. The 114 C-POC values in the
et al., 2013). However, such old DOC has not been found in
                                                                          Kolyma (K1–K6) are within the same range as Kolyma sum-
the main Kolyma River, likely because of the rapid turnover

Biogeosciences, 20, 271–294, 2023                                                                 https://doi.org/10.5194/bg-20-271-2023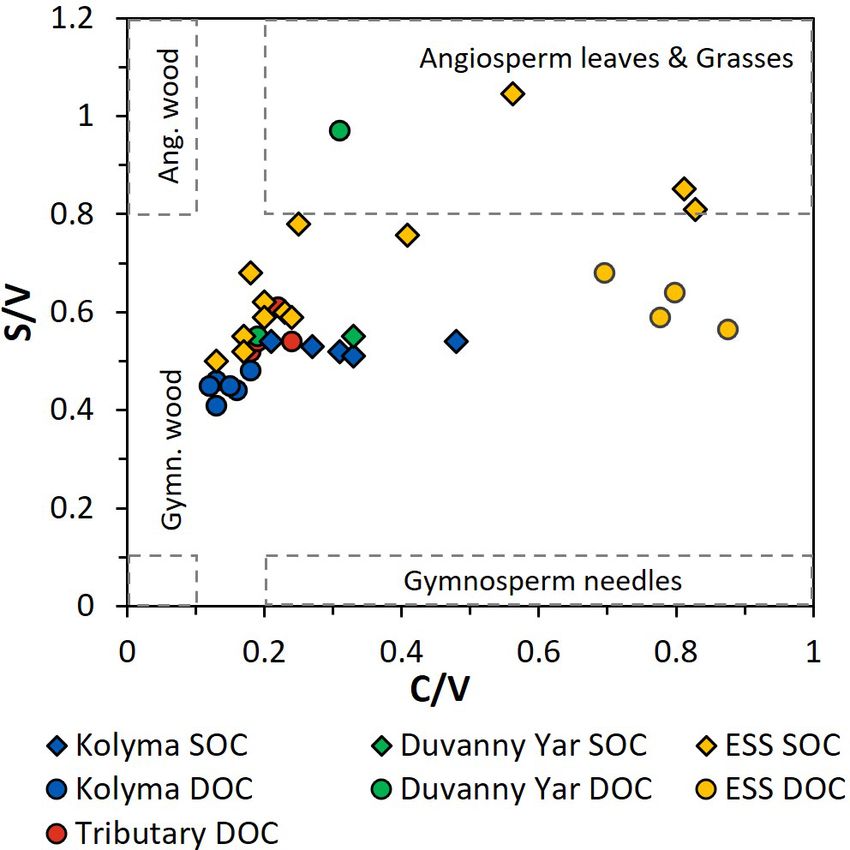
D. Jong et al.: Contrasts in DOC, POC and SOC from the Kolyma River to the East Siberian Shelf                                       279

                                                                         outer ESS, and similarly less negative δ 13 C: ranging from
                                                                         −23.3 ‰ to −29.1 ‰, with a trend towards higher values
                                                                         moving from the river mouth further offshore (Salvadó et
                                                                         al., 2016; Vonk et al., 2010a). This abrupt transition between
                                                                         fresh water and saline water POC composition is likely tied
                                                                         to the different phytoplankton communities present in these
                                                                         respective environments, as seen in other Arctic river deltas
                                                                         (e.g., Kraberg et al., 2013; Lena River delta).
                                                                            We find that the Kolyma SOC is distinctly older (114 C
                                                                         of −521 ‰ to −586 ‰; 5850 to 7020 years) and shows less
                                                                         negative δ 13 C than POC, displaying a narrow range in δ 13 C
                                                                         values (−26.9 ‰ to −27.4 ‰) (Figs. 2, 3a and c). On the
                                                                         other hand, Kolyma River SOC is distinctly younger than the
Figure 2. 114 C versus δ 13 C values of the Duvanny Yar (DY),            Yedoma permafrost material from Duvanny Yar (Fig. 2). The
Kolyma, tributary, and East Siberian Sea (ESS) samples. Triangles        Yedoma permafrost sample DY PF shows an extremely low
are POC samples, diamonds are SOC samples. The Kolyma main
                                                                         114 C value of −965 ‰ (26 800 years), and a slightly higher
stem is in dark blue, ESS in yellow, tributaries in red, and the DY in
green. The boxes represent the endmembers as defined in Sect. 2.6.
                                                                         δ 13 C ratio than Kolyma POC-. The ESS SOC close to shore
The triangles with standard deviation show the mean ± standard de-       shows a similar age to the Kolyma SOC in this study, with
viation of Kolyma particulate organic carbon (POC, faded blue) and       a trend towards less negative 114 C values further offshore
Y3, one of the tributaries, POC (faded red) samples of Bröder et         (−624 ‰ to −332 ‰, 114 C). In ESS SOC-δ 13 C, a trend
al. (2020) for reference.                                                can be seen moving from −27.1 ‰, close to the Kolyma
                                                                         SOC, towards higher δ 13 C values of −22.4 ‰ further off-
                                                                         shore (Fig. 3a). This increase in δ 13 C and 114 C values of
mer POC of 2013 and 2015 (−314±83 ‰, n = 38; Bröder et                   POC and SOC moving from river to shelf is likely due to
al., 2020; Fig. 2), and slightly younger than the mean Kolyma            the increased contribution of marine PP OC to the SOC and
summer POC between 2003 and 2011 (−463±15 ‰, n = 32;                     POC pools further offshore, together with sorting and set-
McClelland et al., 2016).                                                tling of terrestrial and permafrost-derived OC (Bröder et al.,
   These trends in δ 13 C and 114 C in POC point towards the             2018; Tesi et al., 2014; Vonk et al., 2012), processes that will
influence of a younger, more 13 C-depleted source of OC in               be discussed in more detail in the next sections.
the Kolyma River and especially in the tributaries. A similar
trend was found in Bröder et al. (2020), suggesting the influ-
                                                                         3.3   Quantifying the sources of OC: End member
ence of riverine primary production. In situ production of OC
                                                                               mixing analyses
by fluvial organisms in Arctic rivers and streams has not re-
ceived much attention, but frequently displays very low δ 13 C
values (e.g., −30.5±2.5 ‰ in Winterfeld et al. (2015a) Lena              The 114 C and δ 13 C signatures of POC and SOC can be used
River; −30.6 ± 3.3 ‰ Ob and Yenisey rivers, Galimov et                   to quantify the relative contributions of different organic car-
al. (2006); −33.4 ± 4.2 ‰ in Shakil et al. (2020), streams on            bon sources (i.e., permafrost OC; vegetation/soil OC; river-
the Peel Plateau). The lower δ 13 C values of heterotrophic OC           ine PP OC for the Kolyma and marine PP OC for the ESS)
are due to contributions of recycled CO2 that sources from               to these two carbon pools, following the method described
terrestrial organic matter breakdown, which is already rela-             in Sect. 2.6. We revisit the endmember mixing results from
tively low in δ 13 C (Meyers, 1994). Winterfeld et al. (2015a)           Vonk et al. (2012) for the ESS and from Wild et al. (2019)
applied a source-apportionment approach to Lena River POC                for the Kolyma River to connect river and shelf environ-
in summer and found that primary production accounted for                ments with the newly defined endmembers (see Sect. 2.6 for
up to 80 % of the fluvial POC. This “recycled carbon” (Wild              endmember definitions). Relative contributions of the differ-
et al., 2019) appears to be an important component of sum-               ent sources varied considerably between POC and SOC, and
mer POC transport, which is reflected in the overall 13 C-               Kolyma and ESS (Fig. 4).
depleted values in the Kolyma River and tributaries’ POC                    Along the river transect, Kolyma River main stem POC
pool (Fig. 2, and Sect. 3.3).                                            consists largely of riverine PP OC (44±10 %), while the trib-
   Comparing the carbon isotope data of fluvial POC col-                 utary POC shows even higher riverine PP OC contributions
lected in this study with surface water POC collected along              of 64 ± 10 % (mean ± standard deviation). The contribution
the extended Kolyma River transect in the ESS shows a                    of vegetation/soil OC is roughly equal for POC and SOC,
large difference between the terrestrial and marine samples              ranging from 18±14 % in Kolyma main stem POC, 15±11 %
(Figs. 2, 3b and d). The ESS POC is distinctly younger than              in tributary POC and 19 ± 12 % in Kolyma SOC. Permafrost
the Kolyma POC: 114 C values between −28 ‰ and −75 ‰                     OC is the dominant source in Kolyma SOC (68 ± 10 %), and
for the inner ESS and between −69 ‰ and −240 ‰ for the                   the second largest contributor to the Kolyma main stem POC

https://doi.org/10.5194/bg-20-271-2023                                                             Biogeosciences, 20, 271–294, 2023
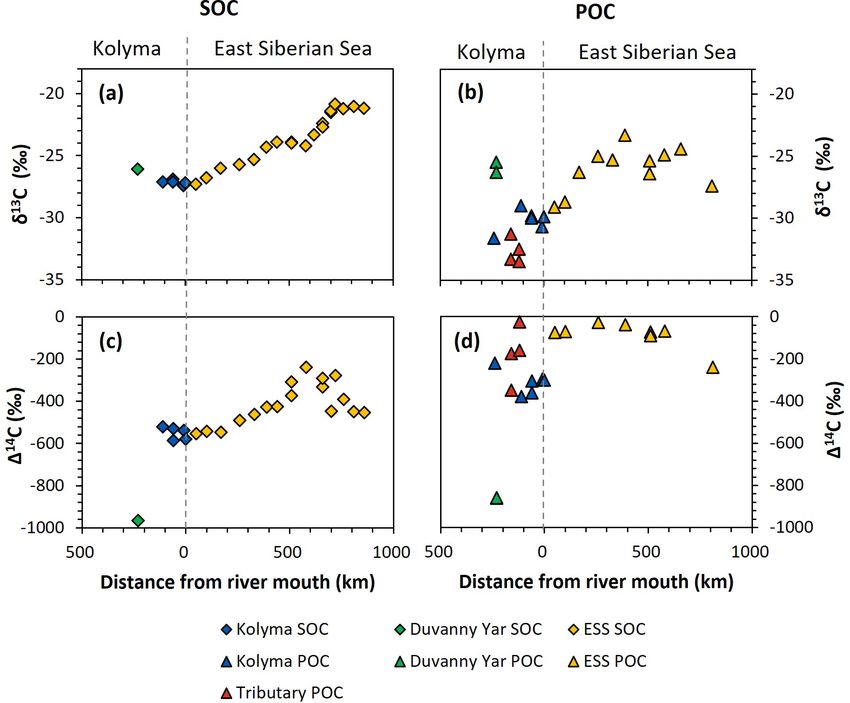
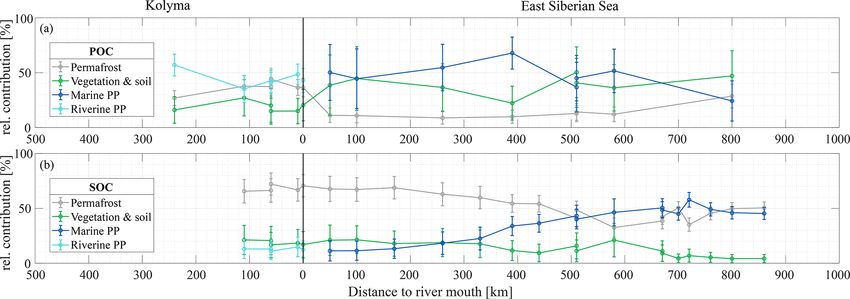
280                     D. Jong et al.: Contrasts in DOC, POC and SOC from the Kolyma River to the East Siberian Shelf

Figure 3. Carbon isotopes over the transect distance, with the riverine part on the left side of each figure, and the marine part on the right.
(a) δ 13 C ratio (in ‰ relative to VPDB) of Duvanny Yar (DY; green), Kolyma (blue), and East Siberian Sea (ESS; yellow) sediment organic
carbon (SOC). (b) δ 13 C ratio of DY (green), Kolyma (blue), tributaries’ (red), and ESS (yellow) particulate organic carbon (POC). (c) 114 C
ratio of DY, Kolyma, and ESS SOC. Lower 114 C ratios indicate older OC. (d) 114 C ratio of DY, Kolyma, tributaries’, and ESS POC.

Figure 4. Mean relative contribution (± standard deviation from Monte Carlo simulations) of three endmembers over transect distance for
(a) surface water particulate organic carbon (POC) and (b) sediment organic carbon (SOC), based on dual carbon isotope (114 C and δ 13 C)
endmember analyses. For the riverine part of the transect (Kolyma; left side of the figure), the endmembers are: Permafrost organic carbon
(OC) in grey, Vegetation/soil OC in green, and Riverine primary production (PP) OC in cyan. For the marine part of the transect (East Siberian
Sea; right side of the figure), the endmembers are: Permafrost OC in grey, Vegetation/soil OC in green, and Marine primary production OC
in dark blue. Definition of the endmembers are described in Sect. 2.6 and can be seen Fig. 2.

Biogeosciences, 20, 271–294, 2023                                                               https://doi.org/10.5194/bg-20-271-2023
D. Jong et al.: Contrasts in DOC, POC and SOC from the Kolyma River to the East Siberian Shelf                                  281

(38 ± 8 %). As expected, the contribution of permafrost OC          3.4   Sources of OC: lignin biomarker concentrations
is highest in Duvanny Yar POC and SOC samples (93±4 %).                   and proxies
   Source apportionment modelling on the Kolyma POC data
from Bröder et al. (2020) shows that the mean contribu-             Terrigenous biomarkers such as lignin derived phenols,
tion of permafrost OC to Kolyma POC is in the same range            cutin-derived hydroxy fatty acids and HMW n-alkanoic acids
(38 ± 9 %) as in this study over their whole sampling period        can be used to further trace the source, pathway, and fate of
(ranging from spring 2012 to fall 2015), while the contribu-        OC in rivers and in the marine environment (e.g., Freymond
tion of vegetation/soil OC is slightly (26 ± 16 %) higher, and      et al., 2018; Tesi et al., 2014). The lignin content, either nor-
the contribution of riverine PP OC is slightly (37 ± 12 %)          malised to OC content (as mg g−1 OC) or to mineral surface
lower than in the samples of this study. This could be due          area (as µg m−2 ), refers to the sum of vanillyl (V), syringyl
to the timing of the sampling; Bröder et al. (2020) also in-        (S) and cinnamyl (C) phenols, and is an indicator for the con-
clude the early and late summer when riverine PP may not            tribution of higher vascular plant material to the total organic
be high, while our study likely includes the peak of the river-     matter pool (Goñi and Hedges, 1992). The ratios between
ine PP production. At tributary Y3, including this dataset, the     lignin phenol groups S / V and C / V can be used for tracing
contribution of permafrost OC is only 11 ± 6 %. The bulk of         the various types of plants generating these phenols (Hedges
the POC in Y3 comes from the other two sources: 51 ± 19 %           and Mann, 1979). These lignin source proxies have been ex-
from riverine and 38 ± 20 % from vegetation/soil, which is          tensively used to characterize and trace different pools of OC
in line with the conclusion of Bröder et al. (2020), that the       on land, in rivers and in the marine environment (e.g., Amon
Y3 tributary does not have the erosional force to mobilize          et al., 2012; Goñi et al., 2000).
permafrost.                                                            The lignin concentrations in DOC of the Kolyma tran-
   For the marine transect, the riverine primary production         sect range from 1.70 to 5.11 mg g−1 OC (Table 3), and the
endmember was “replaced” with the marine primary produc-            DOC lignin concentration in the four tributaries (MA, PAN,
tion endmember, since marine primary production is absent           Y3 and BA) are in the same range as the Kolyma transect
in the river, and riverine primary production OC is thought to      (3.61 to 5.62 mg g−1 OC). These are in the same range as
be rapidly recycled in a marine setting, which is supported by      earlier results in the Kolyma River (4.7 mg g−1 OC; Feng et
the rapid shift towards a higher δ 13 C ratio of POC in the first   al., 2017; 6.5 mg g−1 OC Amon et al., 2012). Sample DY
part of the offshore ESS transect. Marine primary production        TS is a notable exception, with a higher lignin concentra-
appears to be the dominant source of POC in the ESS, sup-           tion of 11.79 mg g−1 OC. For the ESS, only a few dissolved
plying roughly half of the OC along the entire ESS transect         lignin concentrations are published, and they are an order
(47 ± 12 %). Furthermore, we find similar results as Vonk et        of magnitude lower than in the Kolyma River, at roughly
al. (2012, 2010a) for ESS SOC: an increase in the contribu-         0.2 mg g−1 OC at four points in the outer ESS (Salvadó et
tion of marine PP OC (from 10 % to ∼ 50 %; Fig. 4b), and a          al., 2016). Lignin concentrations in Kolyma SOC (< 63 µm)
steady decrease of the two terrestrial endmembers farther off-      range from 6.46 to 14.87 mg g−1 OC, which is clearly higher
shore. Notably, the permafrost OC endmember remains the             than in DOC, but lower than in the first two sampling points
dominant source of OC up to 500 km offshore, decreasing             in the ESS (not sieved; 28.40 and 16.00 mg g−1 OC; Salvadó
from 70 % to ∼ 40 %, before marine PP OC becomes dom-               et al., 2016). Farther offshore, the lignin concentrations in
inant. Note that we have not incorporated lateral transport         SOC gradually decrease to 0.10 mg g−1 OC, indicating a de-
times of sediment OC (estimated up to 3600 years. across            creasing influence of terrestrial biomass on the total OC pool,
the Laptev shelf; Bröder et al., 2018) that affect all terres-      which is supported by the bulk C isotopes (Salvadó et al.,
trial OC during sedimentary transport. In contrast, for POC         2016).
we find an initial sharp decrease in the contribution of per-          A similar pattern is evident in cutin concentrations. For the
mafrost OC, from ∼ 40 % in the Kolyma River to ∼ 10 % at            Kolyma transect, they range from 0.40 to 1.35 mg g−1 OC
the first transect point offshore (Fig. 4a), remaining around       for DOC and 2.18 to 5.67 mg g−1 OC for SOC. The cutin
10 % for the entire length of the transect. Likely, the per-        concentrations of the four tributaries are in the same range
mafrost OC consists mostly of mineral-bound OC, material            (0.52 to 1.23 mg g−1 OC) as for Kolyma DOC, while in the
that has been shown to rapidly settle in the near-shore region      Duvanny Yar thaw stream (DY TS) the concentrations are
(Jong et al., 2020; Karlsson et al., 2011; Vonk et al., 2010b),     much higher at 4.79 mg g−1 OC. The cutin to lignin ratio
which may explain the high permafrost contribution to the           is higher for SOC than for DOC in the main Kolyma sam-
SOC pool and rapid decrease of permafrost OC in the POC             ples (0.40 ± 0.12 versus 0.21 ± 0.11, respectively; Fig. A3),
pool. On the contrary, primary production biomass and or-           which could be due to a methodological bias: the SOC cutin
ganic debris is not mineral-bound and can be transported over       to lignin ratio could be artificially raised by the sieving step
long distances (Karlsson et al., 2011; Vonk et al., 2010b; Tesi     while processing the sediments, thus the lignin-rich organic
et al., 2016), which is reflected in the relatively high contri-    debris could remain in the coarse fraction (Tesi et al., 2016).
butions of these pools in the POC of the ESS.                          To further pinpoint the source of higher plant-derived OC,
                                                                    ratios between lignin phenol groups (C / V and S / V) can be

https://doi.org/10.5194/bg-20-271-2023                                                        Biogeosciences, 20, 271–294, 2023
282 D. Jong et al.: Contrasts in DOC, POC and SOC from the Kolyma River to the East Siberian Shelf
3.5 Sorting and degradation of OC along the
land-ocean continuum: OC and biomarker loading
Changes in surface area normalized concentrations (i.e.,
loadings) of terrestrial OC at bulk and molecular level, mea-
sured across coastal shelves (e.g., Tesi et al., 2016; Bröder
et al., 2018) and along riverine transects (e.g., Freymond
et al., 2018), provide means to quantify loss of OC due to
degradation (Aller and Blair, 2006; Keil et al., 1997). Due to
the large variability in hydrodynamic conditions and hetero-
geneous sediments found within a river, and even more so
along a river to shelf transect, it is necessary to trace a spe-
cific fraction (e.g., through a consistent method of sediment
fractionation) to be able to directly compare sediments across
dynamic land-ocean transects. Mineral SA normalization is
useful for the fraction high in mineral-bound OC (generally
the < 63 µm fraction: silt and finer), but works less well on
sediment with either large fractions of non-mineral bound
carbon (e.g., loose organic debris) or material low in mineral-
bound OC (e.g., coarse sand). In addition, the < 63 µm frac-
tion is the most easily transported fraction of sediment in
Figure 5. The ratios between syringyl / vanillyl (S / V) and cin- rivers, even at lower flow velocities, and is thus the fraction
namyl / vanillyl (C / V) can be used as biomarker source proxies
that is transported farthest offshore, as coarse organic debris
for sediment organic carbon (SOC; diamonds), dissolved organic
carbon (DOC; circles) from the Kolyma River (blue), Duvanny Yar
and sand quickly settles near the coasts (Tesi et al., 2016;
(green), East Siberian Sea (ESS; yellow) and a few smaller tribu- Wakeham et al., 2009).
taries of the Kolyma (red). Ranges for vegetation and tissue types The SA-normalised OC-loadings of the < 63 µm river sed-
(boxes) are based on Goñi et al. (2000). iment range from 0.54 to 0.85 mg OC m−2 , with no apparent
trend along the main stem transect. These OC loadings are
within the range of typical river-influenced sediments (0.4–
1.0 mg OC m−2 ; (Keil et al., 1994; Mayer, 1994; Blair and
used to distinguish different vegetation sources: woody ver- Aller, 2012), and similar to OC loadings found in other river
sus non-woody material and gymnosperm versus angiosperm systems (Freymond et al., 2018; Danube River; similar sedi-
material (Hedges and Mann, 1979; Goñi and Hedges, 1992; ment sampling protocol). The loading of OC on Kolyma sed-
Goñi and Montgomery, 2000). The S / V and C / V ratios iment is on average higher than for the surface sediments of
show fairly consistent values for the Kolyma transect DOC, the ESS (Bröder et al., 2019; 0.19 to 0.46 mg OC m−2 ), and
with an S / V ratio of 0.41 to 0.48 and a C / V ratio of 0.12 a decreasing trend in OC loadings can be seen with increas-
to 0.18 (Fig. 5). For the Kolyma SOC, the S / V and C / V ing distance from land/water depth, suggesting that loss of
ratios are slightly higher than those for DOC (0.51 to 0.54 mineral-bound OC occurs during offshore transport (Keil et
and 0.21 to 0.48). These ratios indicate a roughly equal mix al., 1997).
of gymnosperm and angiosperm material in both DOC and For biomarkers, the SA-normalized lignin concentra-
SOC within the Kolyma main stem (Fig. 5), and an equal tions of Kolyma River sediment vary between 5.13 and
mix of woody and non-woody material in DOC. This is in 12.67 µg m−2 (Fig. 6b), while the SA-normalized cutin con-
accordance with earlier studies on the sources of DOC in centrations are lower, ranging between 1.17 and 4.18 µg m−2
the Kolyma River (Amon et al., 2012), and indicative of the (Fig. 6c). The SA-normalised HMW acid concentrations are
mixed vegetation of the Kolyma watershed (taiga- and tundra between 2.26 and 2.92 µg m−2 (Fig. 6d). For Duvanny Yar,
vegetation). The DOC sample DY TS appears to consist com- the OC and biomarker loadings are lower than for Kolyma
pletely of non-woody angiosperm organic matter, with very sediments, due to the combination of high SA and lower OC
high S / V and C / V ratios of 0.97 and 0.31, respectively. and biomarker concentration. Freymond et al. (2018) found
However, the DOC sample at DY KOL and the permafrost HMW n-alkanoic acid loadings of 0.4–1.5 µg m−2 , and lignin
SOC sample DY PF show to be more of a mix of angiosperm loadings between 0.6 and 26.4 µg m−2 in sediments from the
and gymnosperm soft tissue material (S / V 0.55, C / V 0.33), Danube River and its tributaries, using the same sampling
in the same range as Kolyma SOC and DOC, and in line with and similar extraction methods, which is on the same order
other studies on Yedoma deposits (Winterfeld et al., 2015b; of magnitude as for the Kolyma River.
with 0.51–1.24 for S / V and 0.27–1.07 for C / V, Lena Delta Along the ESS transect sediments, a sharply decreasing
Pleistocene and Holocene deposits). trend in lignin loadings was found in earlier studies (Karls-
Biogeosciences, 20, 271–294, 2023 https://doi.org/10.5194/bg-20-271-2023You can also read