Vertical profiles of trace gas and aerosol properties over the eastern North Atlantic: variations with season and synoptic condition
←
→
Page content transcription
If your browser does not render page correctly, please read the page content below
Atmos. Chem. Phys., 21, 11079–11098, 2021
https://doi.org/10.5194/acp-21-11079-2021
© Author(s) 2021. This work is distributed under
the Creative Commons Attribution 4.0 License.

Vertical profiles of trace gas and aerosol properties over the eastern
North Atlantic: variations with season and synoptic condition
Yang Wang1,2 , Guangjie Zheng1 , Michael P. Jensen3 , Daniel A. Knopf4 , Alexander Laskin5 , Alyssa A. Matthews6 ,
David Mechem7 , Fan Mei6 , Ryan Moffet8 , Arthur J. Sedlacek3 , John E. Shilling6 , Stephen Springston3 ,
Amy Sullivan9 , Jason Tomlinson6 , Daniel Veghte6 , Rodney Weber10 , Robert Wood11 , Maria A. Zawadowicz3,6 , and
Jian Wang1
1 Center for Aerosol Science and Engineering, Washington University in St. Louis, St. Louis, Missouri, USA
2 Department  of Civil, Architectural and Environmental Engineering, Missouri University of Science and Technology,
Rolla, Missouri, USA
3 Environmental and Climate Sciences Department, Brookhaven National Laboratory, Upton, New York, USA
4 School of Marine and Atmospheric Sciences, Stony Brook University, State University of New York, Stony Brook,

New York, USA
5 Department of Chemistry, Purdue University, West Lafayette, Indiana, USA
6 Atmospheric Sciences & Global Change, Pacific Northwest National Laboratory, Richland, Washington, USA
7 Department of Geography & Atmospheric Science, University of Kansas, Lawrence, Kansas, USA
8 Sonoma Technology, San Francisco, CA, USA
9 Department of Atmospheric Science, Colorado State University, Fort Collins, Colorado, USA
10 Department of Earth and Atmospheric Science, Georgia Institute of Technology, Atlanta, Georgia, USA
11 Department of Atmospheric Science, Washington University, Seattle, Washington, USA

Correspondence: Jian Wang (jian@wustl.edu)

Received: 8 April 2021 – Discussion started: 12 April 2021
Revised: 22 June 2021 – Accepted: 23 June 2021 – Published: 22 July 2021

Abstract. Because of their extensive coverage, marine low       mer 2017 and 19 during winter 2018. During summer, long-
clouds greatly impact the global climate. Presently, the re-    range-transported aerosol layers were periodically observed
sponse of marine low clouds to the changes in atmospheric       in the lower free troposphere (FT), leading to elevated FT
aerosols remains a major source of uncertainty in climate       CCN concentrations (NCCN ). Both biomass burning and pol-
simulations. One key contribution to this large uncertainty     lution from North America contribute to submicron aerosol
derives from the poor understanding of the properties and       mass in these layers, with pollution likely the dominant con-
processes of marine aerosols under natural conditions and the   tributor. In contrast, long-range transported continental emis-
perturbation by anthropogenic emissions. The eastern North      sions have a much weaker influence on the aerosol properties
Atlantic (ENA) is a region of persistent but diverse sub-       in the ENA during the winter season. While the entrainment
tropical marine boundary layer (MBL) clouds, where cloud        of FT air is a major source of particle number in the MBL
albedo and precipitation are highly susceptible to perturba-    for both seasons, on average it does not serve as a direct
tions in aerosol properties. Here we examine the key pro-       source of CCN in the MBL because the average FT NCCN
cesses that drive the cloud condensation nuclei (CCN) pop-      is the same or even lower than that in the MBL. The par-
ulation in the MBL using comprehensive characterizations        ticle number flux due to FT entrainment is dominated by
of aerosol and trace gas vertical profiles during the Aerosol   pre-CCN (particles that are too small to form cloud droplets
and Cloud Experiments in the Eastern North Atlantic (ACE-       under typical conditions, i.e., particles with sizes below the
ENA) field campaign. During ACE-ENA, a total of 39 re-          Hoppel minimum) due to the elevated Npre-CCN in the lower
search flights were conducted in the Azores: 20 during sum-     FT. Once these pre-CCN are entrained into the MBL, they

Published by Copernicus Publications on behalf of the European Geosciences Union.
11080                                       Y. Wang et al.: Trace gas and aerosol properties in the eastern North Atlantic

can grow and reach CCN size range through condensational         aerosols (Dp >300 nm) are dominated by sea spray aerosols
growth, representing an indirect and major source of MBL         with a higher concentration in winter than in summer, largely
CCN in the ENA. The impact of synoptic conditions on the         due to the seasonal variation in wind speed. The growth
aerosol properties is examined. Under pre-front and post-        of nucleation- and Aitken-mode aerosols in the MBL rep-
front conditions, shallow convective activity often leads to     resents a substantial source of accumulation-mode aerosols,
a deep and decoupled boundary layer. Coalescence scaveng-        with the highest contribution potentially reaching 60 % dur-
ing and evaporation of drizzle below clouds lead to reduced      ing summer (Zheng et al., 2018). Using the long-term mea-
NCCN and larger accumulation-mode particle sizes in the up-      surement data from the size-resolved CCN measurement sys-
per cloud-containing decoupled layer, indicating that surface    tem, Zheng et al. (2020a) further found that over the ENA, or-
measurements overestimate the NCCN relevant to the forma-        ganics represent an important or even dominant condensing
tion of MBL clouds under decoupled conditions.                   species for the growth of pre-CCN particles. Potential pre-
                                                                 cursors of the secondary organics are volatile organic com-
                                                                 pounds from the ocean biological activities and those pro-
                                                                 duced by the air–sea interfacial oxidation. The properties of
1   Introduction                                                 aerosols from the ENA were also studied using long-term ob-
                                                                 servations at the Mace Head Atmospheric Research Station
Remote marine low cloud systems have a large spatial cov-        located on the west coast of Ireland (O’Dowd et al., 2004;
erage and are particularly susceptible to aerosol perturba-      Ovadnevaite et al., 2014; Yoon et al., 2007). These studies
tions because of their relatively low optical thickness and      show that a major driver of the seasonal variation of midlati-
low background cloud condensation nuclei (CCN) concen-           tude marine aerosol is biological activity because the major-
trations. The response of low cloud systems to changes in        ity of the aerosol mass, both inorganic sea salt and organic
aerosols is a major source of uncertainty in simulations of      matter, was linked to bubble-mediated aerosol production.
climate change (Bony and Dufresne, 2005; Wyant et al.,           The organic fraction was also linked to organic matter con-
2006; Turner et al., 2007; Carslaw et al., 2013). One ma-        centrated at the ocean surface resulting from plankton bloom
jor contribution to this large uncertainty derives from the      (Behrenfeld et al., 2019; Ovadnevaite et al., 2014).
poor understanding of the properties and processes of ma-           While previous studies have greatly advanced our un-
rine aerosols under natural conditions and the perturbation      derstanding of MBL aerosol properties and processes, they
by anthropogenic emissions. The processes that control CCN       are mostly based on measurements at ground and sea level,
population in the marine boundary layer (MBL) have been          whereas the vertical profiles of aerosol properties are needed
examined by a number of studies. These processes include         to understand some of the key processes that drive CCN
entrainment of free troposphere aerosols (Raes, 1995; Clarke     populations in the MBL, including long-range transport of
et al., 2013), new particle formation (NPF) (Bates et al.,       continental emissions, entrainment of free tropospheric (FT)
1998; O’Dowd et al., 2010), production of sea spray aerosols     air, and the interactions between aerosols and clouds. Air-
(O’Dowd et al., 2004; Russell et al., 2010; Prather et al.,      borne measurements were carried out during several field
2013; Quinn et al., 2017), condensational growth of Aitken-      campaigns in the 1990s, including the North Atlantic Re-
mode particles (Sanchez et al., 2018; Zheng et al., 2018,        gional Experiment (NARE) (Parrish et al., 1998), the At-
2020a), interstitial particle scavenging by cloud droplets       lantic Stratocumulus Transition Experiment (ASTEX) (Al-
(Pierce et al., 2015), and the removal of CCN by coalescence     brecht et al., 1995), the Marine Aerosol and Gas Exchange
scavenging (Wood et al., 2012, 2017). In addition, synop-        (MAGE) campaign (Huebert et al., 1996) that organized the
tic conditions also strongly influence entrainment and coa-      chemical experiment within ASTEX, and the Aerosol Char-
lescence scavenging and therefore the population of MBL          acterization Experiment (ACE-2) (Raes et al., 2000). The
aerosols (Bates et al., 2000; Wood et al., 2015, 2017).          emphasis of NARE was mostly on ozone chemistry, and
   The eastern North Atlantic (ENA) is a region of persis-       ASTEX was focused on the transition of marine stratocu-
tent but diverse subtropical MBL clouds (Wood et al., 2015;      mulus clouds. During ACE-2, the variation of aerosol size
Rémillard and Tselioudis, 2015). The origins of the aerosols     distribution and chemical composition was examined dur-
arriving at the ENA are diverse, varying from clean marine       ing three Lagrangian experiments over periods of ∼ 30 h
air masses to those that are strongly influenced by conti-       as air masses advected over the North Atlantic (Johnson et
nental emissions (O’Dowd and Smith, 1993; Wood et al.,           al., 2000). These experiments show that the production of
2015; China et al., 2017; Zawadowicz et al., 2021). Zheng et     sea salt particles at elevated wind speeds leads to an in-
al. (2018) examined MBL aerosol in the ENA using 3 years         crease in accumulation-mode particle concentration (Hoell
of measurements (2015–2017) at the US Department of En-          et al., 2000). The reduction of the Aitken-mode particle con-
ergy Atmospheric Radiation Measurement (ARM) site on             centration is attributed to collision with cloud droplets and
Graciosa Island in the Azores, Portugal. In the ENA, MBL         accumulation-mode particles (Johnson et al., 2000). Dilution
aerosol concentrations in different size ranges exhibit strong   by entrainment, in particular when the depth of the MBL in-
seasonal variations. For example, larger accumulation-mode       creases as the air mass moves over a warmer ocean, is the

Atmos. Chem. Phys., 21, 11079–11098, 2021                                        https://doi.org/10.5194/acp-21-11079-2021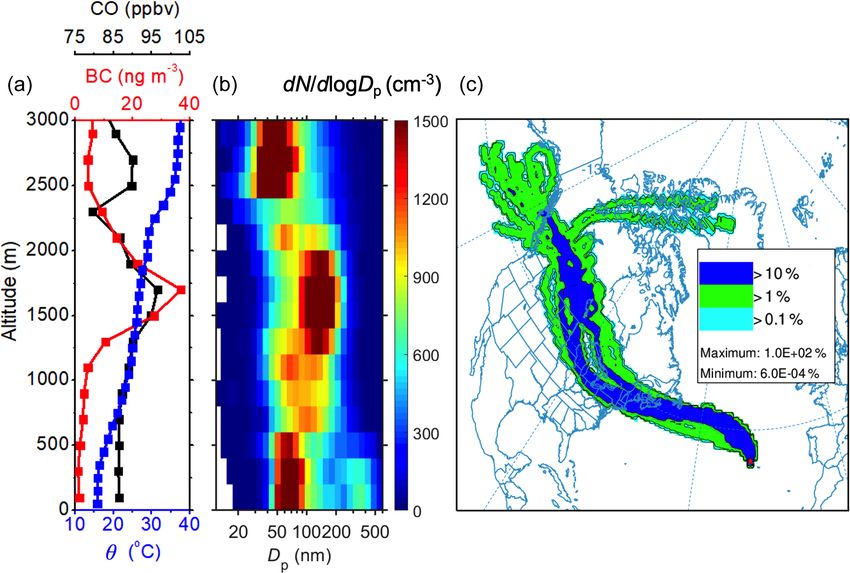
Y. Wang et al.: Trace gas and aerosol properties in the eastern North Atlantic                                               11081

main reason for a general reduction in the aerosol concentra-       tween the MBL and FT is often clearly defined by an abrupt
tion.                                                               increase in the potential temperature with altitude (i.e., tem-
   In this study, we present comprehensive airborne measure-        perature inversion). When the inversion is not obvious, liq-
ments of aerosols and trace gases in both summer and win-           uid water content (LWC) and water vapor mixing ratio (w)
ter seasons during the Aerosol and Cloud Experiments in             profiles are used to help identify the cloud top and define
the Eastern North Atlantic (ACE-ENA) campaign (Wang et              the MBL height (rapid increase in LWC or decrease in w).
al., 2021). The large number of the flights provides statisti-      The water vapor mixing ratio is calculated from the ambi-
cally robust characterization of the vertical profiles of aerosol   ent temperature and dew point measured on board the G-1.
properties and allows for understanding of the aerosol prop-        The mixing ratios of CO and O3 were measured by trace
erties under natural conditions (i.e., aerosols mostly pro-         gas monitors (Los Gatos Research, Inc., N2 O/COR-23r and
duced by natural processes) and those strongly influenced           Thermo Scientific model 49i, respectively). The aerosol par-
by anthropogenic emissions. Key processes that control the          ticles were sampled using an isokinetic inlet that has a 50 %
population of CCN in the MBL are investigated by examin-            upper cutoff size of 5 µm (Schmid et al., 2014) and were sub-
ing the vertical profiles of aerosol properties and their vari-     sequently dried with a Nafion tube. Aerosol size distributions
ations between the seasons. The impact of synoptic condi-           from 10 to ∼ 600 nm were measured by a fast-integrated mo-
tions on MBL structure and the vertical profiles of the aerosol     bility spectrometer (FIMS) (Wang et al., 2018). The total
populations are examined, and the implications for studying         number concentration of particles larger than 10 nm in diam-
aerosol–cloud interactions using ground-based aerosol mea-          eter (N>10 ) was measured by a condensation particle counter
surements are discussed.                                            (CPC 3772, TSI Inc.). Another CPC (CPC 3010, TSI Inc.,
                                                                    modified to achieve a lower cutoff size of 10 nm) was op-
                                                                    erated downstream of a thermal denuder operated at 300 ◦ C
2   Measurement overview                                            (Fierz et al., 2007), which allows volatility-based separation
                                                                    by exploiting the higher volatility of organics and sulfates
During the ACE-ENA campaign, the ARM Aerial Facility                versus sea salt and refractory black carbon (BC) (Clarke et
Gulfstream-1 (G-1) research aircraft was deployed in the            al., 2013). The volatile particle number fraction (fvol ) is de-
Azores, Portugal, as part of two intense operation periods          rived as 1 – N>10,TD /N>10 , where N>10,TD represents the
(IOPs) during summer 2017 (June to July, summer IOP) and            number concentration of thermally denuded aerosols mea-
winter 2018 (January to February, winter IOP). The G-1 air-         sured by the modified CPC 3010.
craft was stationed at the Lajes airport on Terceira Island, and       BC mass concentration was characterized by a single-
a total of 39 flights (20 in summer and 19 in winter) were          particle soot photometer (SP2, DMT Inc., Longmont, CO).
conducted. The dates and durations of the flights are summa-        A high-resolution time-of-flight aerosol mass spectrometer
rized in Fig. 1. The deployments during both seasons allow          (HR-ToF-AMS) (Jayne et al., 2000; DeCarlo et al., 2006;
for the examination of key aerosol and cloud processes un-          Zawadowicz et al., 2021) and a particle-into-liquid sampler
der a variety of representative meteorological and cloud con-       (PILS) coupled with offline ion chromatography (Orsini et
ditions. Each flight consisted of four to six vertical profiles     al., 2003; Sullivan et al., 2019) were deployed to charac-
(excluding those leaving and arriving at the Lajes airport),        terize sub-micrometer non-refractory aerosol composition.
providing the aerosol and trace gas properties as a function        Both the HR-ToF-AMS and the PILS were deployed down-
of altitude. The flights also included horizontal legs near the     stream of an impactor with a cutoff size of 1 µm. Cloud
surface of the ocean (∼ 100 m a.g.l.), just below cloud base,       LWC is calculated by integrating the droplet size distribu-
within the cloud, at cloud top, and above clouds in the lower       tion measured by a fast-cloud droplet probe (FCDP, SPEC
FT. To maximize the synergy between the G-1 and ground              Inc., Boulder CO) and validated by a multi-element water
measurements at the ARM ENA observatory on Graciosa Is-             content system (WCM-2000, SEI Inc., Tolland, CT). To min-
land (39◦ 30 500 N 28◦ 00 5100 W), most of the flights were con-    imize artifacts due to droplet shattering on the aerosol sam-
ducted within 50 km of the ENA observatory. The geographi-          pling inlet, we exclude aerosol measurements inside clouds
cal location of the Azores and the flight track of a representa-    (i.e., LWC > 10−3 g m−3 ) from our analysis. In addition,
tive research flight are shown in Fig. 2. The aerosol and trace     only measurements collected at least 5 km away from Gra-
gas properties presented here are based on the measurements         ciosa Island and Terceira Island are included in the analysis
in the MBL and lower FT (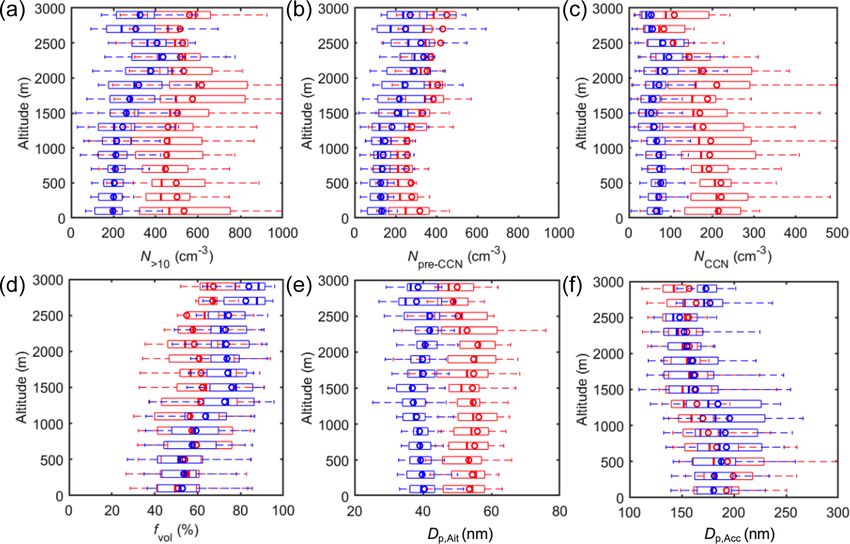
11082                                         Y. Wang et al.: Trace gas and aerosol properties in the eastern North Atlantic

Figure 1. Date and time periods of research flights during summer (a) and winter (b) IOPs of the ACE-ENA campaign.

Figure 2. (a) The geographical location of the ACE-ENA campaign. (b) An example of a representative flight pattern on 25 January 2018.
The G-1 flew an L-shaped pattern consisting of along-wind legs upwind of Graciosa Island and cross-wind legs over the ocean. Maps are
obtained from © Google Maps.

3     Results and discussion                                         impact on the vertical profiles of trace gases and aerosols,
                                                                     we calculated the 10 d back trajectories of air masses ar-
3.1    Air mass origins                                              riving at three altitudes (500, 1500, and 3000 m) above the
                                                                     ENA site during the G-1 flight days using the Hybrid Single-
The vertical profiles of potential temperature and LWC show          Particle Lagrangian Integrated Trajectory (HYSPLIT) ver-
that the MBL heights during the summer and winter IOPs               sion 4 model (Stein et al., 2015). The back trajectories were
are 1220 ± 450 and 1640 ± 480 m (mean ± standard devi-               simulated with a time step of 6 h using the National Cen-
ation), respectively, indicating a strong seasonal variation.        ter for Environmental Prediction (NCEP) Global Data As-
The shallower MBL during summer is due to the presence               similation System (GDAS) meteorological data as input. A
of a stronger Azores high-pressure system that favors MBL            cluster analysis of the trajectories was then performed (Ab-
low cloud occurrence through enhanced synoptic-scale sub-            dalmogith and Harrison, 2005) for each IOP and arriving al-
sidence, lower tropospheric stability, and increased low-level       titude (i.e., 500, 1500, or 3000 m) (Fig. 3). Based on these
relative humidity. To understand the air mass origin and its         solutions, the air masses are classified into three main clus-

Atmos. Chem. Phys., 21, 11079–11098, 2021                                             https://doi.org/10.5194/acp-21-11079-2021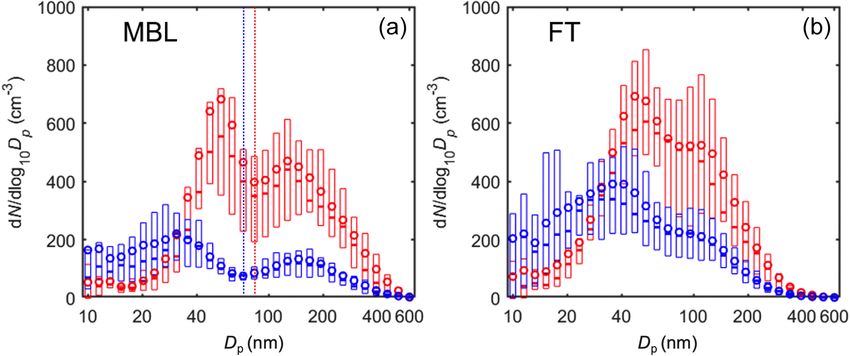
Y. Wang et al.: Trace gas and aerosol properties in the eastern North Atlantic 11083
Table 1. Instrumentation deployed during the ACE-ENA that are used for data analysis in this study. All measurements were made at a
frequency of 1 Hz except for the HR-ToF-AMS, PILS, and thermal denuder.
Instrument Measurement
Condensation particle counter (CPC) Total aerosol concentration >10 nm
Fast-integrated mobility spectrometer (FIMS) Aerosol size distribution, 0.01 to 0.5 µm
Fast-cloud droplet probe (FCDP) Cloud particle size distribution 2 to 50 µm
High-resolution time-of-flight aerosol mass spectrometer (HR-ToF-AMS) Non-refractory aerosol composition
Multi-element water content system (WCM) Liquid water content
Particle in liquid sampler (PILS) Water-soluble aerosol composition
Single-particle soot photometer (SP2) Soot spectrometry
Trace gas monitors Concentrations of CO and O3
Thermal denuder Sampling of non-volatile component of aerosol particles
Ultrafine condensation particle counter (CPC) Total aerosol concentration >3 nm
ters of different originating locations: (1) North America, (2) tration of OH is higher during the summer months, leading
the recirculating flow around the Azores high, and (3) the to a lower CO mixing ratio (Novelli et al., 1998). The ver-
Arctic. This classification is consistent with previous studies tical trends of CO also differ between summer and winter.
of the air mass origins over the ENA (O’Dowd and Smith, The average CO mixing ratio during wintertime decreases
1993; Zheng et al., 2018). Among the three clusters, the Arc- with increasing altitude, from 110 ppbv near the ocean sur-
tic cluster has the lowest frequency of occurrence. A large face to 100 ppbv at an altitude of 3000 m. The temperature
fraction of the air masses arriving at 1500 m over the ENA of the land surface is substantially colder than that of the
site (i.e., lower FT) originated from North America, suggest- ocean during winter; therefore, continental outflow tends to
ing a strong influence of continental emissions. Nearly half stabilize the lower atmosphere, limiting vertical mixing to
of the air masses arriving at the ENA MBL during the sum- the lowest portion of the atmosphere. Because the major CO
mer had circulated around the Azores high over the ocean for sources over continents are near the surface, the ENA CO
more than 10 d. Air mass trajectories during the summertime mixing ratio during winter decreases with increasing altitude
show relatively weaker vertical motion, whereas most of the as a result of the weaker impact of continental emissions aloft
wintertime air masses arriving at all three altitudes over the (Holloway et al., 2000). In addition, a higher OH concentra-
ENA site originated from above 3000 m 10 d before, suggest- tion and thus a higher CO sink in the FT also contributes to
ing that the wintertime air masses arriving at the ENA are less the vertical trend (Spivakovsky et al., 1990). The CO mix-
influenced by anthropogenic emissions near the surface. ing ratio exhibits an opposite vertical trend during summer,
increasing from 76 ppbv near the ocean surface to 85 ppbv
3.2 Vertical profiles of trace gas mixing ratios at an altitude of 3000 m. This reverse of the vertical trend is
due to stronger influences of biomass burning and pollution
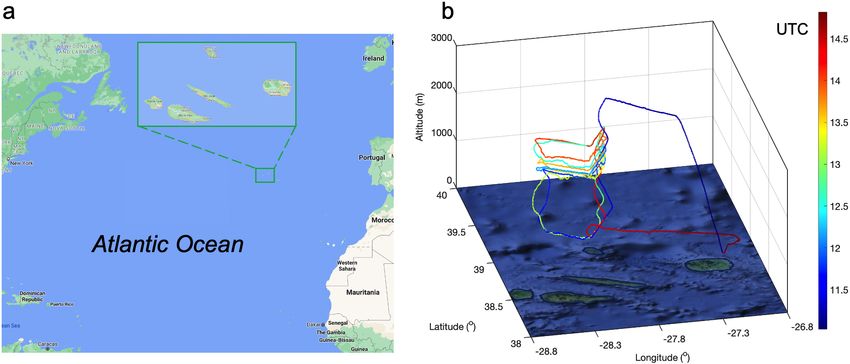
Mixing ratios of water vapor, CO, and O3 measured on board from North America (Honrath et al., 2004). In North Amer-
the G-1 aircraft are grouped into 200 m altitude bins, and ica, biomass burning is more frequent and its emissions are
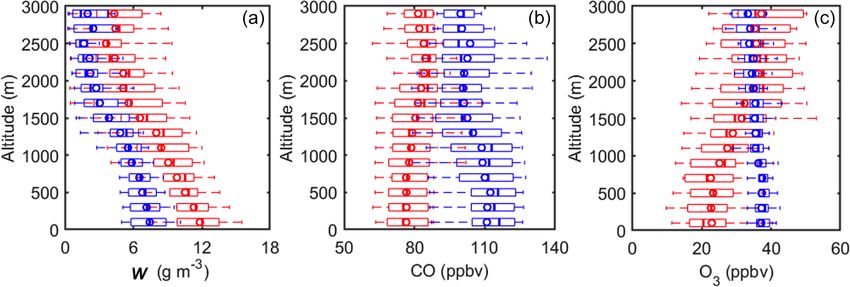
their statistics are shown as a function of altitude in Fig. 4 stronger during summertime. A large fraction of the biomass
for both the summer (red) and winter (blue) IOPs. The ver- burning emissions is lofted into the FT (Zheng et al., 2020b).
tical profiles indicate a strong seasonal variation. Due to the In addition, due to the warmer land surface temperature com-
lower ambient temperature and thus the lower saturation va- pared to that of the ocean, the lower atmosphere is destabi-
por pressure, the average water vapor concentration during lized and continental outflow is often lifted above the MBL
winter is significantly lower than that during summer (by 2– as it is transported over the Atlantic Ocean.
5 g m−3 ). The CO mixing ratio during winter (>100 ppbv) Both biomass burning and anthropogenic pollution gener-
is higher than that during the summertime (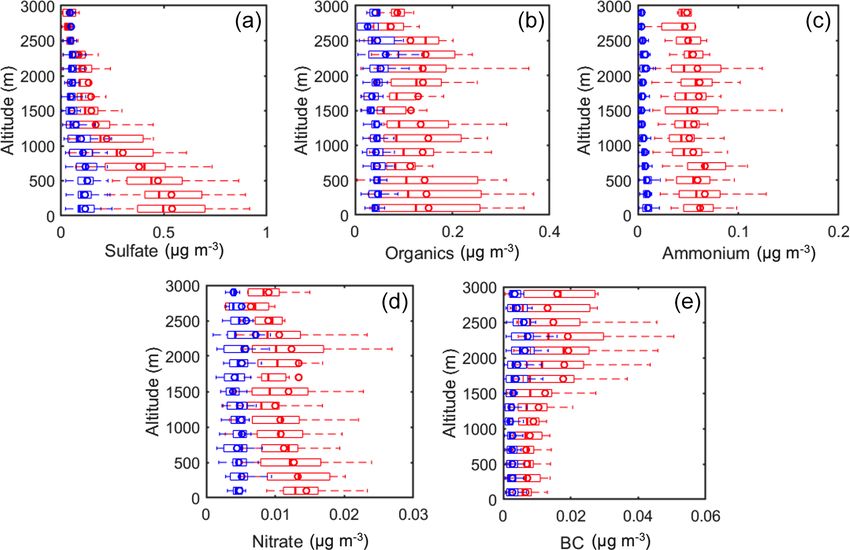
11084                                            Y. Wang et al.: Trace gas and aerosol properties in the eastern North Atlantic

Figure 3. Cluster analysis of 10 d back trajectories arriving at 500, 1500, and 3000 m above the ENA site during the summer (a)–(c) and
winter (d)–(f) IOP. The average 10 d back trajectories of the three clusters are represented by red, green, and blue lines, and the associated
numbers denote the occurrence percentages of the clusters.

Figure 4. Vertical profiles of (a) water vapor mixing ratio (w), (b) carbon monoxide mixing ratio (CO), and (c) ozone mixing ratio (O3 ) over
the ENA site during the summer IOP (red) and winter IOP (blue). The mixing ratios are normalized to standard temperature and pressure
(273.15 K and 101.325 kPa; STP). The line and circle markers represent the median and mean concentrations, and the edges of the box
indicate the 25th and 75th percentiles, respectively.

FT during summer (R 2 = 0.63) due to the long-range trans-               meteorological conditions (Jaeglé et al., 2017), which were
port of continental emissions (Fig. S1). The correlation co-             not encountered during ACE-ENA. As the signature of such
efficient is substantially lower during winter (R 2 = 0.23), re-         stratospheric air is elevated O3 with low CO levels, the trans-
vealing that the transport of CO and O3 may be decoupled                 port of stratosphere air leads to a negative O3 and CO corre-
during winter due to a weaker impact of pollution events.                lation (Parrish et al., 1998), which was also not observed in
This observation generally agrees with the data collected                the lower FT over the ENA (Fig. S1b).
during the NARE campaign over the North Atlantic region,
where anthropogenic pollution leads to a positive correla-
tion between O3 and CO (Parrish et al., 1998). The presence
of O3 of stratospheric origin in the lower FT is unlikely, as
the transport of O3 from the stratosphere is generally associ-
ated with a rapid and significant increase in O3 under special

Atmos. Chem. Phys., 21, 11079–11098, 2021                                                  https://doi.org/10.5194/acp-21-11079-2021
Y. Wang et al.: Trace gas and aerosol properties in the eastern North Atlantic                                             11085

3.3     Aerosol properties and processes over the ENA             that during winter in the MBL (Fig. 6e), The vertical profiles
                                                                  of accumulation-mode diameters (Dp,Acc ) are similar for the
3.3.1    Vertical profiles of aerosol properties                  two seasons, expect at altitudes between 500 and 1500 m
                                                                  (i.e., the upper MBL), where mean Dp,Acc is larger during
The average dry aerosol size distributions within the MBL         winter (200 nm) than summer (170 nm).
are bimodal with a clear Hoppel minimum for both sea-                Figure 7 shows the vertical profiles of the mass concentra-
sons (Fig. 5a). The Hoppel minimum represents an average          tions of non-refractory species measured by HR-ToF-AMS
particle size at which particles become CCN. Although the         and BC mass concentration measured by SP2 for both sea-
Hoppel minimum shows some variation from day to day, its          sons. Sulfate, organics, and ammonium constitute almost
value is relatively constant during the same flight day. To       99 % of the non-refractory sub-micrometer aerosol mass,
facilitate the discussion of aerosol processes that influence     whereas nitrate concentration is negligible. The sulfate con-
the MBL CCN population, we define pre-CCN as particles            centration maximizes near the ocean surface, reaching ap-
with diameters smaller than the Hoppel minimum (i.e., par-        proximately 0.5 µg m−3 during the summer. The decrease in
ticles that are too small to form cloud droplets under typi-      sulfate with increasing altitude indicates a surface source.
cal conditions in the MBL). CCN are defined as the parti-         The organics, ammonium, and nitrate mass concentrations
cles with diameters larger than the Hoppel minimum. There-        show elevated values near the surface (i.e., below ∼ 1000 m)
fore, both nucleation- and Aitken-mode particles belong to        and in the lower FT (i.e., between 1500 and 2500 m). BC
the pre-CCN. During ACE-ENA, since the Aitken-mode par-           mass concentration increases with altitude and peaks around
ticles often dominated the pre-CCN population, the concen-        2200 m in the lower FT, indicating that the major source of
trations of pre-CCN (Npre-CCN ) and CCN (NCCN ) are close         BC is long-range transport in the FT. All species show higher
to the concentrations of Aitken and accumulation modes, re-       concentrations during the summer season.
spectively, and they are used interchangeably in this study. In
this study, Npre-CCN and NCCN are derived by integrating the      3.3.2   Differences between MBL and FT aerosols
aerosol size distributions below and above the Hoppel min-
imum that was determined for each flight. Compared to the         The vertical gradients of Npre-CCN and NCCN shown in
CCN concentrations measured by a CCN counter at fixed su-         Fig. 6 suggest that the entrainment of FT air may impact the
persaturations, the derived NCCN based on the Hoppel min-         aerosol properties in the MBL. During summer, at an alti-
imum takes into consideration the variation of the supersat-      tude of around 2000 m, the mean NCCN and mBC are substan-
uration relevant to MBL cloud formation and is therefore a        tially higher than the corresponding median values (Figs. 6c
more realistic representation of the CCN concentration.           and 7e), indicating occasional abnormally high NCCN and
   Figure 6 shows the vertical profiles of particle number con-   mBC in the lower FT. Given the much lower mBC in the MBL,
centrations normalized to standard temperature and pressure       the abnormally high NCCN and mBC are attributed to long-
(STP, 273.15 K and 101.325 kPa; Fig. 6a–c), mean particle         range transport of continental emissions. In addition, nitrate,
diameter of Aitken and accumulation modes (Fig. 6e–f), and        organics, and ammonium (Fig. 7) also show a local maxi-
the number fraction of volatile particles (Fig. 6d). During       mum in a similar altitude range (i.e., 1500 to 2500 m), consis-
both the summer and winter IOPs, the total aerosol num-           tent with the influence of continental emissions. Both urban
ber concentration (N>10 ) in the FT is higher than that in the    pollution and biomass burning in North America likely con-
MBL (Fig. 6a), largely due to the elevated Npre-CCN (Fig. 6b)     tribute to the long-range-transported aerosol layers, which
in the FT. In contrast, NCCN in the FT (e.g., at an altitude      will be discussed further in Sect. 3.4. The influence of the
of 2000–3000 m) is about the same as or even slightly lower       plumes is also evident from the comparison of the verti-
than that in the MBL during both summer and winter sea-           cal profiles with those under background conditions. In this
sons (Fig. 6c). It is worth noting that there are some vertical   study, we define background conditions (i.e., with minimum
variations of NCCN within the MBL because the MBL in the          influence from continental emissions) as those when mBC is
ENA is often decoupled (see Sect. 3.5.2). Particle number         less than 5 ng m−3 . The vertical profiles of the aerosol prop-
concentrations exhibit strong seasonal variations, and on av-     erties under the background conditions are shown in Figs. S2
erage, NCCN , Npre-CCN , and N>10 are higher in summer than       and S3. Once the influence from continental plumes is ex-
winter at all altitudes sampled. The average number fraction      cluded, the average NCCN in the FT during the summer shows
of volatile particles (fvol ) increases from ∼ 50 % near the      a significant decrease. As a result, NCCN under the back-
ocean surface to ∼ 60 % and ∼ 75 % near the top of the MBL        ground condition (NCCN,bg ) in the FT becomes substantially
(i.e., ∼ 1500 m) during summer and winter, respectively. The      lower than that in the MBL. For the aerosol chemical com-
value of fvol remains relatively constant in the lower FT         position, both sulfate and organic mass concentrations at al-
(Fig. 6d). Free tropospheric fvol is higher in the winter, con-   titudes between 1500 and 2500 m are substantially reduced
sistent with less influence of long-range-transported aerosols    when the measurements are limited to those with mBC less
as discussed below. The mean Aitken-mode particle size            than 5 ng m−3 (Fig. S3a and b). This indicates that sulfate, or-
(Dp,Ait ) during summer is approximately 20 nm larger than        ganics, and BC coexist in the long-range-transported aerosol

https://doi.org/10.5194/acp-21-11079-2021                                       Atmos. Chem. Phys., 21, 11079–11098, 2021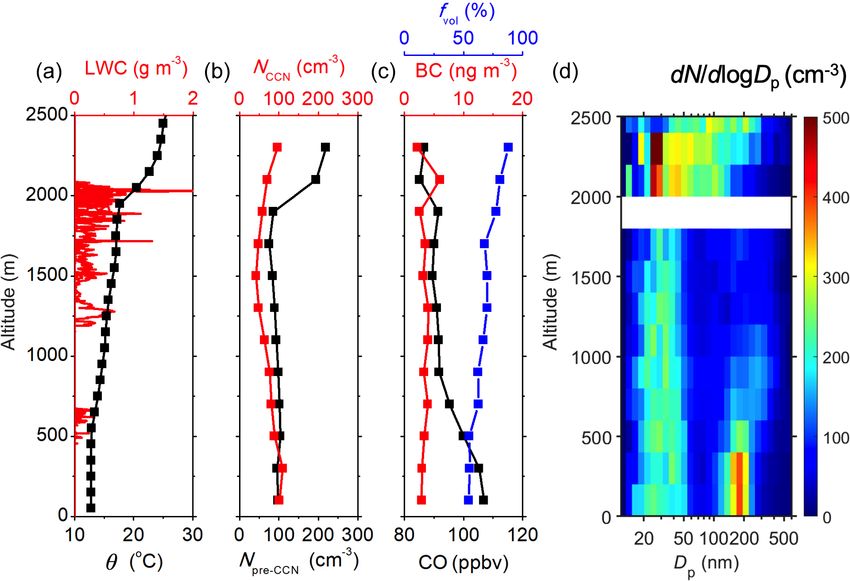
11086                                           Y. Wang et al.: Trace gas and aerosol properties in the eastern North Atlantic

Figure 5. Aerosol size distributions measured by the FIMS on board the G-1 aircraft within (a) the MBL and (b) lower FT during the
summer IOP (red) and winter IOP (blue). The line and circle markers represent the median and mean of the size distribution, and the edges
of the box indicate the 25th and 75th percentiles, respectively. The dotted lines in panel (a) show the Hoppel minimum for the averaged size
distributions in the MBL.

layers. For the winter IOP, NCCN only exhibits a minor peak             3.3.3    Growth of pre-CCN into CCN size range
at the altitude of around 2200 m and there is little differ-
ence between NCCN and NCCN,bg in the lower FT, suggesting
a relatively weak influence from the long-range-transported             Once pre-CCN are entrained into the MBL, they can grow
plumes over the ENA. This is consistent with the 10 d back              and reach CCN-active sizes through condensation (Yoon et
trajectories showing that, during winter, air masses arriving           al., 2007; Sanchez et al., 2018; Zheng et al., 2018, 2020a).
at the lower FT in the ENA mostly descended from higher                 Therefore, the entrainment of FT Aitken-mode aerosol rep-
altitudes (Fig. 3). As MBL aerosol in the ENA is continu-               resents an indirect source of MBL CCN in the ENA. It has
ally being modified by air entrained from the FT, these verti-          long been recognized that sulfates produced from dimethyl
cal profiles indicate that except for occasional periods during         sulfide (DMS) oxidation are major species for the con-
summer when long-range-transported plumes are present, the              densational growth of pre-CCN in remote marine environ-
entrainment of FT air does not serve as a direct source of              ments. Methanesulfonic acid (MSA), another product of
CCN in the MBL. Instead, the entrainment of FT air dilutes              DMS oxidation, may also participate in particle condensa-
and acts to reduce MBL CCN concentrations. We note that                 tional growth (Kerminen et al., 1997; Ayers and Gillett, 2000;
aerosols under the background conditions during ACE-ENA                 Karl et al., 2011; Willis et al., 2016; Hodshire et al., 2019).
are likely influenced by diluted and aged continental plumes.           Using measurements during ACE-ENA, Zheng et al. (2020a)
Therefore, NCCN under natural conditions (i.e., during the              show that secondary organics contribute substantially to pre-
pre-industrial era) is expected to be even lower, possibly              CCN condensational growth and thus the formation of CCN
leading to a more pronounced difference in NCCN between                 in the remote marine environments, consistent with some
the lower FT and the MBL.                                               early studies (Meskhidze and Nenes, 2006; Facchini et al.,
   In contrast, during both seasons, Npre-CCN in the FT is sub-         2008; Wurl et al., 2011; Dall’Osto et al., 2012; Willis et al.,
stantially higher than that in the MBL, leading to an increas-          2017; Mungall et al., 2017; Brüggemann et al., 2018). The
ing N>10 with altitude from the MBL to the lower FT. There-             higher MBL NCCN during summer is due in part to the higher
fore, entrainment of FT air increases MBL pre-CCN con-                  particle growth rate as a result of stronger oceanic volatile or-
centrations and total particle number concentrations in the             ganic compound (VOC) emission (Zawadowicz et al., 2021).
MBL. Compared to NCCN , the vertical profiles of Npre-CCN,bg               Another mechanism for the formation of CCN within the
are very similar to those of Npre-CCN , implying that, on av-           MBL is the activation of Aitken-mode particles in a stronger
erage, continental emissions have a relatively weaker im-               than average updraft, which causes a higher peak supersatu-
pact on Npre-CCN . This is consistent with the picture that             ration (Kaufman and Tanré, 1994). These Aitken-mode par-
aged aerosols in long-range-transported continental plumes              ticles would otherwise remain in the interstitial air of clouds.
are dominated by accumulation-mode particles (Zheng et al.,             Once activated, sulfate and organics can be produced through
2020b) and a substantial fraction of Aitken-mode particles              aqueous chemistry inside droplets. Unless these droplets are
in the FT is produced by NPF in the outflow of convective               removed by precipitation, they become CCN upon evapora-
and frontal clouds, followed by the coagulation and conden-             tion outside the clouds and readily participate in subsequent
sational growth (Clarke et al., 1998; Andreae et al., 2018;             cloud formation. The effect of this mechanism on the MBL
Williamson et al., 2019; McCoy et al., 2020) .                          CCN budget is difficult to evaluate with measurements only
                                                                        and will be a subject of future studies. The vertical profile of

Atmos. Chem. Phys., 21, 11079–11098, 2021                                                 https://doi.org/10.5194/acp-21-11079-2021
Y. Wang et al.: Trace gas and aerosol properties in the eastern North Atlantic 11087 Figure 6. Vertical profiles showing the (a) concentration of particles larger than 10 nm (N>10 ), (b) concentration of Aitken-mode aerosols or aerosols too small to form cloud droplets (Npre-CCN ), (c) concentration of accumulation-mode aerosols or CCN (NCCN ), (d) aerosol volatile fraction (fvol ), (e) average size of Aitken-mode aerosol (Dp,Ait ), and (f) average size of accumulation-mode aerosol (Dp,Acc ) over the ENA site during the summer IOP (red) and winter IOP (blue). The concentrations are normalized to standard temperature and pressure (273.15 K and 101.325 kPa; STP). The line and circle markers represent the median and mean of the data, and the edges of the box indicate the 25th and 75th percentiles, respectively. Figure 7. Vertical profiles of the mass concentrations of (a) sulfate, (b) organics, (c) ammonium, (d) nitrate, and (e) black carbon (BC) in the ENA during the summer IOP (red) and winter IOP (blue). BC is measured by the SP2, and the rest of the compositions are measured by the HR-ToF-AMS. The line and circle markers represent the median and mean of the data, and the edges of the box indicate the 25th and 75th percentiles, respectively. The concentrations are normalized to standard temperature and pressure (273.15 K and 101.325 kPa; STP). https://doi.org/10.5194/acp-21-11079-2021 Atmos. Chem. Phys., 21, 11079–11098, 2021
11088                                        Y. Wang et al.: Trace gas and aerosol properties in the eastern North Atlantic

sulfate mass concentration indicates a surface source, con-       lantic show that the aerosol organics are similar to those ob-
sistent with the picture that over the open ocean, most sub-      served during primary marine organic “plume” events (Ovad-
micron sulfate is derived from DMS through both gas-phase         nevaite et al., 2011), and the mass fingerprints and H : C and
and in-cloud oxidation (Hegg and Hobbs, 1981; Gurciullo et        O : C features were consistent with organics originating from
al., 1999; Ovadnevaite et al., 2014; McCoy et al., 2015). The     primary marine sources. Ocean emitted VOCs can also lead
higher MBL sulfate mass concentration during the summer           to formation of secondary organic aerosol as discussed in the
season is a result of stronger DMS emission (Zawadowicz           previous section. The seasonal trend of ammonium is con-
et al., 2021) and higher oxidant (e.g., OH) concentrations.       sistent with the contribution from marine sources shown by
During summer, nearly half of the air masses arriving in the      previous isotopic analysis (Jickells et al., 2003).
ENA MBL had been circulating around the Azores high over
open ocean for more than 10 d, indicating that Aitken-mode        3.3.5   Seasonal variation
aerosols have extended time to grow by condensation and in-
cloud processes.                                                  NCCN , Npre-CCN , and N>10 are higher in the summer than the
                                                                  winter at all altitudes (Fig. 6a–c). The higher NCCN in the FT
3.3.4   Contribution from marine primary aerosols                 during summer is to a large degree due to more frequent oc-
                                                                  currence of long-range-transported continental plumes from
For both seasons, fvol is largely altitude-independent in the     North America. It is important to note that FT NCCN,bg is
lower FT, and it deceases nearly linearly from the top of the     consistently higher during the summer (Fig. S2). This higher
MBL to the ocean surface (Fig. 6d). Due to the lower existing     background is likely due to the greater influence of diluted
condensation sink and higher radiation intensity, NPF often       continental emissions, as evidenced by the slightly higher
occurs in the FT (Clarke et al., 1998). Sulfuric acid is recog-   mBC,bg in the FT during summer. The seasonal variation of
nized to be the major component of these freshly formed par-      the FT Npre-CCN is likely due to stronger NPF during summer
ticles, while ammonia, amines, and biogenic VOCs may also         as a result of the higher DMS emissions over the open ocean
participate in the particle formation process (Dunne et al.,      (Clarke et al., 1998; Williamson et al., 2019). The higher
2016). The newly formed particles can subsequently grow           Npre-CCN and NCCN in the FT contribute to the elevated val-
to Aitken-mode size through coagulation and condensation.         ues in the MBL during the summer through entrainment. The
These particles can represent a large fraction of the FT par-     higher MBL NCCN during summer is also partially due to the
ticle number and are volatile at 300 ◦ C, leading to a rela-      increased growth rate of nucleation- and Aitken-mode parti-
tively higher fvol in the FT. The volatile fraction in the FT     cles as a result of stronger oceanic VOC emission (Zawadow-
is lower during summer (Fig. 6d) due to the stronger influ-       icz et al., 2021; Zheng et al., 2020b). Stronger precipitation
ence of long-range-transported continental plumes that con-       and thus coalescence scavenging of CCN can also contribute
sist of refractory aerosol components (i.e., BC). This is also    to the seasonal variation of NCCN in the MBL.
supported by the comparable FT fvol values for both sea-             The spectral shape of submicron aerosol size distributions
sons under background conditions (Fig. S2). The decrease          shows a strong variability between seasons and between the
in fvol from the top of the MBL towards the ocean surface         MBL and FT (Fig. 5). A clear separation between the Aitken
is attributed to sea spray aerosol emitted from the ocean,        and accumulation modes by a Hoppel minimum is evident
which contributes to the MBL aerosol population (Pirjola et       in the MBL. What stands out in the wintertime aerosol size
al., 2000) and is mostly non-volatile (Rasmussen et al., 2017;    distribution is the larger proportion of particles below 20 nm,
Bates et al., 2012). One can notice the elevated Npre-CCN and     potentially resulting from more NPF events due to low exist-
NCCN values near the ocean surface (Fig. 6b and c), which         ing surface area concentrations. A recent study showed that
is mainly due to the cloud scavenging that reduces Npre-CCN       over the ENA, NPF takes place in the upper part of the decou-
and NCCN values in the upper MBL. The ocean is unlikely a         pled MBL following the passage of cold fronts when open-
source of Aitken-mode aerosols because NPF near the ocean         cell convection and scattered cumulus clouds frequently oc-
surface is rare due to the large condensation and coagulation     cur (Zheng et al., 2021). The NPF is due to the combina-
sinks (Pirjola et al., 2000).                                     tion of low existing aerosol surface area, cold air temper-
   Enhanced organic mass concentration was observed in the        ature, availability of reactive gases, and high actinic fluxes
MBL during summer (Fig. 7b). Comparison of the vertical           in the clear regions between scattered cumulus clouds. The
profiles of mBC and organic mass concentration indicates          larger fraction of particles below 20 nm in the MBL during
that long-range-transported continental emissions have a mi-      the winter is attributed, at least partially, to the more fre-
nor contribution to the organics in the MBL during the sum-       quent passage of cold fronts over the ENA and NPF in the
mer, suggesting a dominant surface source of the organics.        upper MBL (Kolstad et al., 2009). These newly formed par-
The enhanced organic mass concentration is attributed to          ticles can continuously grow into the Aitken mode and con-
both primary marine aerosol and secondary organic aerosol         tribute to the CCN in the MBL (Zheng et al., 2018, 2020a).
formed from oceanic VOCs. Previous long-term HR-ToF-              The mean Aitken-mode particle size (Dp,Ait ) during sum-
AMS measurements at Mace Head station in the North At-            mer is approximately 20 nm larger than that during winter

Atmos. Chem. Phys., 21, 11079–11098, 2021                                         https://doi.org/10.5194/acp-21-11079-2021
Y. Wang et al.: Trace gas and aerosol properties in the eastern North Atlantic 11089
dX
in the MBL (Figs. 5, and 6e), likely due to a combination change in concentration X due to the entrainment dt ent is
of the following two reasons. First, faster Aitken-mode par- given by
ticle growth is expected given stronger summertime emis-
sions of ocean biogenic precursors. Second, both stronger dX FX we
wintertime convective activities and low CCN concentration = = (XFT − XMBL ) . (4)
dt ent zi zi
lead to higher supersaturation, which allows the activation
of smaller particles, leading to a smaller Hoppel minimum Taking into account the seasonal variation of the average
size and thus smaller Dp,Ait . The vertical profiles of Dp,Acc MBL height (i.e., ∼ 1200 and ∼ 1600 m for summer and
in the two seasons are similar except at altitudes between winter, respectively), we estimate the particle concentrations
500 and 1500 m, where Dp,Acc is substantially larger dur- above the MBL as the averages between altitudes of 1600
ing the winter (200 nm) compared to the summer (170 nm). and 2200 m during summer and 2000 to 2600 m during win-
The larger Dp,Acc during winter is attributed to the forma- ter. Particle concentrations inside the MBL are averaged from
tion of large accumulation-mode particles by evaporating 400 to 1000 m for both seasons (Table 3).
drizzle (see Sect. 3.5.2 for further discussion). The aver- The rate of N>10 change due to FT entrainment mixing
age size distributions in the MBL and FT during both IOPs (i.e., dNdt>10 ) is estimated as 40 cm−3 d−1 and 53 cm−3 d−1
are fitted with lognormal size distributions, and the Aitken- ent
and accumulation-mode diameters and concentrations, along for the summer and winter, respectively. The total source of
with the geometric standard deviations, are listed in Table 2. particle number is balanced by total loss under steady-state
The contribution of FT entrainment to MBL particle con- conditions. The major particle number sinks in the MBL are
centrations is estimated from the entrainment velocity and intermodal coagulation (i.e., coagulation of Aitken and accu-
the difference in the average particle concentrations between mulation mode), in-cloud coagulation of interstitial aerosol,
the lower FT and MBL. The entrainment flux FX is calcu- and in-cloud coalescence scavenging of CCN (Zheng et al.,
lated as 2018). Using the long-term data collected at the ENA site,
Zheng et al. (2018) estimated the sink for summer and win-
FX = we (XFT − XMBL ) , (1) ter seasons as 59 and 53 cm−3 d−1 , respectively. The esti-
mated dNdt>10 suggests that the FT entrainment represents
ent
where we is the entrainment velocity, and XFT and XMBL are the dominant source of particle number in the MBL for both
the average of property X in the lower FT and MBL, respec- seasons. The rate of N>10 change due to FT entrainment
tively. The value of we can be estimated from the dynamics dN
mixing is dominated by pre-CCN (i.e., pre−CCN dt ) and the
of the MBL height zi (Caldwell et al., 2005; Russell et al., ent
1998). The time variation of zi is described by contribution from CCN (i.e., dNdtCCN ) is essentially negli-
ent
∂zi gible (Table 3). It is worth noting that whereas the pre-CCN
+ V h · ∇zi = we − ws , (2) concentration in the MBL is lower during the winter sea-
∂t dN
son, pre−CCN
dt is higher than that during the summer. The
where ws is the large-scale subsidence rate, V h is the hori- ent
dN
zontal wind vector, and V h · ∇zi represents the variation of combination of higher pre−CCNdt and lower concentration
ent
boundary layer height due to the horizontal advection. As- suggests more efficient removal of MBL pre-CCN in winter,
suming that steady-state conditions for boundary layer height which is likely due to the following two reasons. First, the di-
(i.e., ∂zi /∂t = 0), we have ameters of pre-CCN particles during winter are smaller than
during summer, leading to a higher coagulation coefficient
we = ws + V h · ∇zi . (3) with larger particles (i.e., CCN and droplets). Higher con-
centrations of sea salt particles, as a result of stronger winds,
In the 40◦ (north and south) latitude range (i.e., the latitude of may also contribute to higher coagulation rates during winter
the ENA site), the average lower tropospheric subsidence rate (Zheng et al., 2018). Second, abnormally high updraft veloc-
(700 hPa) during low cloud conditions is around 8 mm s−1 ities may be more frequent due to more convective activity
(McCoy et al., 2017). Assuming lower tropospheric diver- during the winter, therefore growing more pre-CCN into the
gence is constant with height (consistent with previous anal- CCN size range through aqueous-phase reactions.
yses; Wood et al., 2009), the mean subsidence rates at the top
of the MBL (typically ∼ 1.5 km) will be around 4 mm s−1 . 3.4 Long-range transport of continental aerosols
The advection term V h · ∇zi is more difficult to estimate in
general. For subtropical eastern ocean regions (e.g., SE Pa- As shown earlier, aerosol layers with elevated NCCN and mBC
cific, NE Pacific), the advection term is roughly about 1/3 of were observed above the MBL in the ENA during the sum-
ws (Wood and Bretherton, 2004). Assuming this relationship mer IOP. These aerosol layers may strongly influence the
also applies in the ENA, we estimate the entrainment veloc- aerosol properties in the region. The back trajectories of the
ity at the top of the MBL using Eq. (3) as ∼ 5 mm s−1 . The air masses arriving at the altitudes of the observed aerosol
https://doi.org/10.5194/acp-21-11079-2021 Atmos. Chem. Phys., 21, 11079–11098, 202111090 Y. Wang et al.: Trace gas and aerosol properties in the eastern North Atlantic
Table 2. The fitting parameters of average aerosol size distributions for the Aitken mode and accumulation mode during the summer IOP and
winter IOP in the MBL and FT. The particle concentrations are normalized to standard temperature and pressure (273.15 K and 101.325 kPa;
STP).
Location IOP Dp,Ait NAit σAit Dp,Acc NAcc σAcc
(nm) (cm−3 ) (nm) (cm−3 )
MBL Summer 50.9 267.7 1.53 171.5 196.5 1.56
Winter 30.5 134.8 1.77 157.5 67.4 1.64
FT Summer 49.8 344.0 1.69 134.4 168.1 1.55
Winter 31.3 349.2 2.43 136.7 26.9 1.38
Table 3. Average particle concentrations in the MBL and lower FT, tributed to the long-range transport of biomass burning emis-
as well as the change rates of MBL particle number concentrations sions and anthropogenic pollution from North America. Air
due to the entrainment from FT. The particle concentrations and masses arriving from the continental US, western Atlantic,
change rates are normalized to standard temperature and pressure and northern North America exhibited elevated CO and O3
(273.15 K and 101.325 kPa; STP). concentrations. When the long-range-transported plume was
dominated by North American pollution with a minimum
Season Parameters Concentrations (cm−3 ) (dX/dt)|ent biomass burning influence, the slopes of the linear fit be-
MBLa Lower FTb (cm−3 d−1 ) tween O3 and CO (d[O3 ] / d[CO]) ranged from 0.81 to 1.28,
N>10 466 577 40
and the correlation coefficients (R 2 ) ranged from 0.53 to
Summer Npre-CCN 263 384 43 0.83. During biomass-burning-dominated events, the slopes
NCCN 203 193 −3 were between 0.4 and 0.9, and the value of R 2 was reduced to
0.4 to 0.5 (Honrath et al., 2004). The value of d[O3 ] / d[CO]
N>10 208 406 53
observed in the lower FT during the summer IOP of ACE-
Winter Npre-CCN 134 318 49
NCCN 74 88 4 ENA is 0.79 (Fig. S1a), which is close to or within the
ranges previously observed during anthropogenic pollution
a Particle concentrations inside the MBL are averaged from 400 to 1000 m for both
and biomass burning events. The correlation coefficient for
seasons. b Particle concentrations in lower FT are averages between altitudes of 1600
and 2200 m during summer and 2000 to 2600 m during winter. this study is 0.63, which is within the range of R 2 when air
masses observed at the Pico mountaintop station were domi-
nated by North America pollution.
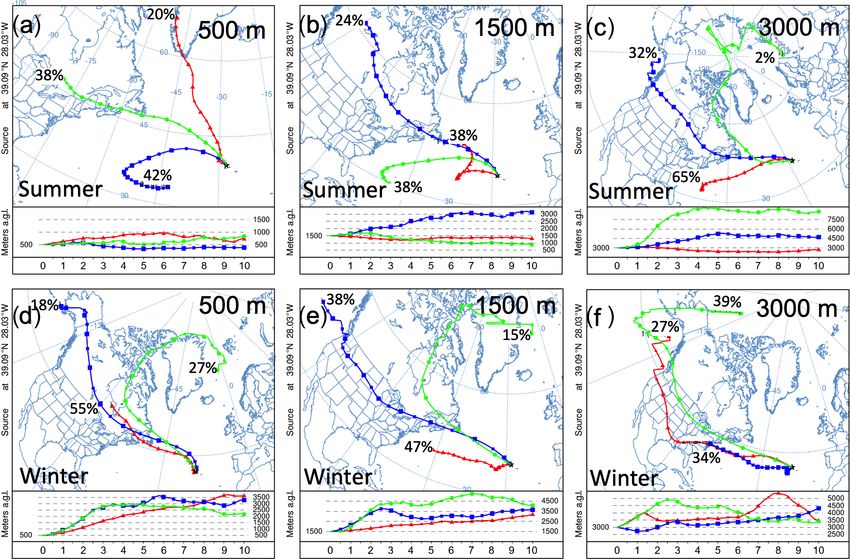
layers are examined to understand their origins. One exam- The composition of FT aerosol layers provides addi-
ple is on 29 June 2017 (Fig. 8), when an aerosol layer was tional insight into the source of the long-range-transported
observed at altitudes between 1300 and 2000 m. On this day, aerosols. There are relatively strong correlations among the
the vertical profile of potential temperature shows an MBL mass concentrations of BC, sulfate, and organics in the FT
height of 400 m. The aerosol layer exhibited elevated con- aerosol layers compared to those in the MBL (Fig. S6), con-
centrations of accumulation-mode particles (modal diameter sistent with previous measurements of summertime aerosols
of ∼ 120 nm). An increased BC mass concentration and CO at the Pico mountaintop station, which show that the FT
mixing ratio were also observed in the layer. A frequency aerosols are generally internal mixtures, including soot and
analysis of hourly 10 d back trajectories shows that a large sulfate coated by organic matter (China et al., 2017). Dur-
fraction of air masses arriving on 29 June had traveled over ing ACE-ENA, on average the sulfate mass fraction between
the northern United States, likely bringing anthropogenic 1600 and 2600 m (i.e., the altitude range of FT aerosol layers
pollution and biomass burning aerosols to the ENA. Taking during the summer IOP) outside the background conditions
into account the transport time of an air mass from North (mBC >5 ng m−3 ) is about 35 %. For the two aerosol layers
America to the ENA site (generally 3 to 6 d), we generated a observed on 29 June and 18 July, the aerosol sulfate mass
fire emission map from 23 to 26 June (Fig. S4), which sug- fractions are 38 % and 30 %, respectively. Typically, fresh
gests relatively strong biomass burning emissions along the biomass burning particles are >90 % carbonaceous material
air mass trajectories over the North America. A similar case and the sulfate mass fraction is very low (Reid et al., 2005).
of long-range transport on 18 July 2017 is also illustrated in As biomass burning particles age in the atmosphere, the sul-
Fig. S5. fate mass fraction could increase as a result of condensation
Previous ground observations at the Pico mountaintop sta- of secondary sulfate and/or coagulation with particles with
tion showed frequent elevations of summertime CO and O3 a higher sulfate fraction. However, the air mass trajectories
concentrations (Honrath et al., 2004; China et al., 2017). (e.g., in the cases of 29 June and 18 July 2017) show that the
Based on air mass back trajectories, these events were at- aerosol layers were above the MBL over the Atlantic Ocean
Atmos. Chem. Phys., 21, 11079–11098, 2021 https://doi.org/10.5194/acp-21-11079-2021Y. Wang et al.: Trace gas and aerosol properties in the eastern North Atlantic 11091
Figure 8. A long-range transport event observed during the research flight on 29 June 2017. (a) Vertical profiles of potential temperature
(θ ), black carbon (BC) mass concentration, and carbon monoxide (CO) mixing ratio. (b) Vertical contour of aerosol size distributions as
a function of altitude measured by the FIMS. (c) Frequency analysis of hourly back trajectories arriving at the ENA site on 29 June 2017
generated by HYSPLIT. The frequency is the sum of the number of trajectories that passed through each grid cell divided by the total number
of trajectories analyzed. The CO mixing ratio, BC concentration, and size distributions are normalized to standard temperature and pressure
(273.15 K and 101.325 kPa; STP).
before arriving at the ENA, and hence it is unlikely that the the North American continent. On average, continental pollu-
sulfate in the aerosol layers derived from oxidation of DMS tion represents a major, and potentially the dominant, source
emitted from the ocean. In addition, the sulfate in the aerosol of the aerosol mass in the layers observed in the lower FT
layers was fully neutralized, in contrast to the typical acidic over the ENA.
sulfate observed in the MBL aerosols (Zawadowicz et al.,
2021; Zheng et al., 2020a). These pieces of evidence indicate 3.5 Aerosol properties under different synoptic
that the sulfate in the aerosol layers originated from continen- conditions
tal instead of oceanic emissions.
The sulfate mass fraction (∼ 35 %) in these FT aerosol 3.5.1 Classification of synoptic conditions
layers is also substantially higher than that of aged biomass
The synoptic condition strongly influences the structure of
burning plumes elsewhere. For example, previous FT aerosol
the MBL and thus aerosol properties. The Azores consis-
sampled at the Pico mountaintop station under the impact
tently lie in an area of substantial variability in synoptic con-
of the long-range transport of the North America biomass
figuration, thermodynamic environment, and cloud proper-
burning plumes had an average sulfate fraction of around
ties. The ENA site is under a strong influence from the North
16.3 % (Dzepina et al., 2015). Holanda et al. (2020) sam-
Atlantic high-pressure system (Azores high) and is periodi-
pled long-range-transported African biomass burning in the
cally subject to frontal passages (Rémillard et al., 2012). The
FT offshore near the Brazilian coast of the Atlantic Ocean
synoptic conditions for the 39 flight days during ACE-ENA
and found that sulfate represented 16 % of the submicron
are classified as Azores high, pre-front, front, post-front, or
aerosol mass. Furthermore, the mass concentration of potas-
unclassified conditions following the method described in
sium measured by PILS, a tracer of biomass burning aerosol
Mechem et al. (2018). The classification of the synoptic con-
(Andreae, 1983; Sciare et al., 2008), shows no correlation
ditions is based on the reanalysis fields of geopotential height
with organic mass loading for the measurements within the
at 500 hPa pressure levels (Gelaro et al., 2017). The 6-hourly
altitude range of the aerosol layers during the summer (i.e.,
reanalysis products are examined to judge the category of
from 1600 to 2600 m) (Fig. S7). Although the back trajec-
the synoptic conditions. This classification process is fur-
tories suggest a contribution of biomass burning, the above
ther combined with the archived surface weather maps ob-
evidence indicates that biomass burning aerosols are likely
tained from the National Meteorological Service of Germany
mixed with anthropogenic pollution as they travel through
(Deutscher Wetterdienst – DWD; http://www2.wetter3.de/
https://doi.org/10.5194/acp-21-11079-2021 Atmos. Chem. Phys., 21, 11079–11098, 202111092 Y. Wang et al.: Trace gas and aerosol properties in the eastern North Atlantic
index_en.html, last access: 17 July 2021). The fractions of
different synoptic conditions during all 39 flight days are
38.5 % for the Azores high, 23.1 % for pre-front, 25.6 %
for post-front, and 12.8 % for unclassified conditions. The
fractions of the synoptic conditions in each IOP are further
shown in Table 4. No flight day was classified as front be-
cause no research flight was conducted on a day of a frontal
passage due to logistical challenges. Under the Azores high,
a strong inversion is often present at the top of the boundary
layer, and the MBL is often shallower and more likely to be
well-mixed, while under the pre-front, front, and post-front
conditions, strong convective activities often lead to deeper
boundary layers. As the MBL deepens, the turbulence pro-
duced from surface heating and cloud-top radiative cooling
becomes insufficient to maintain a well-mixed layer. Conse- Figure 9. Vertical profiles of parameters under the synoptic condi-
quently, the MBL begins to “decouple” into a surface mixed tion of Azores high on 8 July 2017. (a) Potential temperature (θ )
layer and an upper decoupled layer (Wood and Bretherton, and liquid water content (LWC). (b) Npre-CCN and NCCN . (c) Con-
2004; Bretherton et al., 2010). Earlier studies show that the centrations of carbon monoxide (CO) and black carbon (BC), as
boundary layer over the ENA tends to be decoupled much of well as the aerosol volatile fraction (fv ). (d) Vertical contour of
the time (Rémillard et al., 2012). Another study found that aerosol size distributions as a function of altitude. Size distribu-
only 14 % of the soundings over Graciosa were well-mixed tions between 800 and 1200 m are not shown due to the interference
(Ghate et al., 2015). of cloud droplet shattering. The CO mixing ratio, BC concentra-
tion, particle concentrations, and size distributions are normalized
to standard temperature and pressure (273.15 K and 101.325 kPa;
3.5.2 Case analysis of aerosol characteristics under STP).
different synoptic conditions
Azores high and well-mixed boundary layer high Aitken-mode concentration due to NPF and long-range-
transported continental emissions.
Figure 9 shows the vertical profiles of meteorological param-
eters, CO mixing ratio, and aerosol properties measured on Pre-front and post-front conditions: decoupled
8 July, an example of Azores high conditions. On this day, the boundary layer
potential temperature and LWC indicate a well-mixed MBL
with shallow clouds below a strong temperature inversion at Figure 10 shows an example of vertical profiles of meteo-
around 1000 m. Inside the MBL, the bimodal aerosol size rological parameters, CO mixing ratio, and aerosol proper-
distribution shows a clear Hoppel minimum, which is a result ties when the MBL is decoupled. The measurements were
of cloud processing (Hoppel et al., 1994). The aerosol size carried out on 8 February 2018, when the front and associ-
distribution was largely uniform at different altitudes within ated cloud band were located north of the Azores (i.e., pre-
the MBL. The aerosol in the lower FT showed a layered front condition). The vertical profile of potential temperature
structure, with properties clearly different from that in the indicates a deep decoupled MBL that consisted of the sur-
MBL, demonstrating the heterogeneity within the FT under face mixed layer below 500 m and the upper decoupled layer
a stable atmospheric structure controlled by the Azores high. from 500 to 1900 m. A thin layer of stratus was observed
An elevated concentration of Aitken-mode particles with near the top of the surface mixed layer, and cumulus clouds
mode diameter of ∼ 35 nm was observed at altitudes rang- were observed in the upper decoupled layer (Fig. 10a). In-
ing from 1600 to 2400 m. The elevated Aitken-mode con- side the surface mixed layer, the aerosol size distribution is
centration (i.e., Npre-CCN , ∼ 900 cm−3 ) also coincides with bimodal and independent of altitude. In contrast, the aerosol
an increased volatile fraction (i.e., up to ∼ 80 %) and low size distribution varied with altitude inside the upper decou-
NCCN and mBC , suggesting that Aitken-mode particles de- pled layer. NCCN decreased with increasing altitude and ex-
rive from NPF in the FT over the open ocean when the exist- hibits a significantly lower value at the cloud level as a re-
ing accumulation-mode particle concentration is low (Clarke sult of coalescence scavenging by the cumulus clouds. Simi-
et al., 1998; Williamson et al., 2019). An aerosol layer with lar features are also evident from the averages of the vertical
elevated mBC (∼ 25 ng m−3 ) was observed above 2300 m. profiles during the IOPs (Fig. 6c). The lower NCCN in the up-
This layer exhibits a higher CO mixing ratio and mBC and per decoupled layer where the cumulus clouds form indicates
is attributed to long-range-transported continental emissions. that surface measurements overestimate the concentration of
The gradual change in CO mixing ratio and mBC at altitudes CCN that are relevant for cumulus cloud formation when
above 1500 m also suggests mixing between the layers of the MBL is decoupled. Npre-CCN also exhibits a decreasing
Atmos. Chem. Phys., 21, 11079–11098, 2021 https://doi.org/10.5194/acp-21-11079-2021You can also read