Lava flow hazard map of Piton de la Fournaise volcano - NHESS
←
→
Page content transcription
If your browser does not render page correctly, please read the page content below
Nat. Hazards Earth Syst. Sci., 21, 2355–2377, 2021
https://doi.org/10.5194/nhess-21-2355-2021
© Author(s) 2021. This work is distributed under
the Creative Commons Attribution 4.0 License.

Lava flow hazard map of Piton de la Fournaise volcano
Magdalena Oryaëlle Chevrel1 , Massimiliano Favalli2 , Nicolas Villeneuve3,4,5 , Andrew J. L. Harris1 ,
Alessandro Fornaciai2 , Nicole Richter3,5,6 , Allan Derrien3,5 , Patrice Boissier3,5 , Andrea Di Muro3,5 , and
Aline Peltier3,5
1 Laboratoire  Magmas et Volcans (LMV), Université Clermont Auvergne, CNRS, IRD,
OPGC, 63000 Clermont-Ferrand, France
2 Istituto Nazionale di Geofisica e Vulcanologia (INGV), Via Battisti, 53, 56125 Pisa, Italy
3 Institut de Physique du Globe de Paris (IPGP), Université de Paris, CNRS, 75005 Paris, France
4 Laboratoire Géosciences Réunion (LGSR), Université de La Réunion, 97744 Saint-Denis, France
5 Observatoire Volcanologique du Piton de la Fournaise (OVPF), Institut de Physique du Globe de Paris,

97418 La Plaine des Cafres, France
6 Helmholtz Centre Potsdam, German Research Centre for Geosciences (GFZ), Telegrafenberg, 14473 Potsdam, Germany

Correspondence: Magdalena Oryaëlle Chevrel (oryaelle.chevrel@ird.fr)

Received: 27 November 2020 – Discussion started: 11 December 2020
Revised: 14 June 2021 – Accepted: 28 June 2021 – Published: 9 August 2021

Abstract. Piton de la Fournaise, situated on La Réunion is-         lava flow hazard occurrence in inhabited areas is deemed to
land (France), is one of the most active hot spot basaltic          be very low (< 0.1 %), it may be underestimated as our study
shield volcanoes worldwide, experiencing at least two erup-         is only based on post-18th century records and neglects older
tions per year since the establishment of the volcanological        events. We also provide a series of lava flow hazard maps
observatory in 1979. Eruptions are typically fissure-fed and        inside the Enclos, computed on a multi-temporal (i.e., regu-
form extensive lava flow fields. About 95 % of some ∼ 250           larly updated) topography. Although hazard distribution re-
historical events (since the first confidently dated eruption in    mains broadly the same over time, some changes are noticed
1708) have occurred inside an uninhabited horseshoe-shaped          throughout the analyzed periods due to improved digital ele-
caldera (hereafter referred to as the Enclos), which is open        vation model (DEM) resolution, the high frequency of erup-
to the ocean on its eastern side. Rarely (12 times since the        tions that constantly modifies the topography, and the lava
18th century), fissures have opened outside of the Enclos,          flow dimensional characteristics and paths. The lava flow
where housing units, population centers, and infrastructure         hazard map for Piton de la Fournaise presented here is re-
are at risk. In such a situation, lava flow hazard maps are a       liable and trustworthy for long-term hazard assessment and
useful way of visualizing lava flow inundation probabilities        land use planning and management. Specific hazard maps
over large areas. Here, we present the up-to-date lava flow         for short-term hazard assessment (e.g., for responding to vol-
hazard map for Piton de la Fournaise based on (i) vent distri-      canic crises) or considering the cycles of activity at the vol-
bution, (ii) lava flow recurrence times, (iii) statistics of lava   cano and different event scenarios (i.e., events fed by dif-
flow lengths, and (iv) simulations of lava flow paths using         ferent combinations of temporally evolving superficial and
the DOWNFLOW stochastic numerical model. The map of                 deep sources) are required for further assessment of affected
the entire volcano highlights the spatial distribution probabil-    areas in the future – especially by atypical but potentially
ity of future lava flow invasion for the medium to long term        extremely hazardous large-volume eruptions. At such an ac-
(years to decades). It shows that the most probable location        tive site, our method supports the need for regular updates of
for future lava flow is within the Enclos (where there are ar-      DEMs and associated lava flow hazard maps if we are to be
eas with up to 12 % probability), a location visited by more        effective in keeping up to date with mitigation of the associ-
than 100 000 visitors every year. Outside of the Enclos, prob-      ated risks.
abilities reach 0.5 % along the active rift zones. Although

Published by Copernicus Publications on behalf of the European Geosciences Union.
2356                                           M. O. Chevrel et al.: Lava flow hazard map of Piton de la Fournaise volcano

1   Introduction                                                   tion of a robust empirical approach to hazard mapping and
                                                                   planning. Currently this database includes

Lava flow hazard maps represent the probability of inun-             i. an exhaustive lava flow inventory based on detailed
dation by a lava flow per unit area. Because such maps                  mapping over the period 1931–2019 (Derrien, 2019;
show areas that are the most probable to be affected by                 Staudacher et al., 2016; OVPF database) coupled with
lava, it is a fundamental tool in lava flow hazard mitigation           lava flow dating (Albert et al., 2020) that allows esti-
and in guiding eruption response management. Lava flow                  mation of eruption and associated lava flow recurrence
hazard maps for basaltic volcanic centers have been previ-              times;
ously produced for several highly active volcanoes includ-
                                                                    ii. three high-spatial-resolution (25 to 1 m) digital eleva-
ing Mount Etna in Italy (Favalli et al., 2005, 2011; Del Ne-
                                                                        tion models (DEMs) acquired in 1997, 2010, and 2016
gro et al., 2013), Nyiragongo in the Democratic Republic
                                                                        (Arab-Sedze et al., 2014; Bretar et al., 2013; Derrien,
of Congo (Chirico et al., 2009; Favalli et al., 2009b), and
                                                                        2019);
Mount Cameroon in Cameroon (Bonne et al., 2008; Favalli
et al., 2012). They have also been produced for most ocean          iii. a large database for vent distribution to allow robust
island basaltic shields including Mauna Loa and Kı̄lauea on              calculation of the probability density function of future
the island of Hawaii (Kauahikaua et al., 1998; Rowland et                vent opening (Favalli et al., 2009a).
al., 2005); Lanzarote in the Canaries, Spain (Felpeto et al.,
2001); Pico in the Azores, Portugal (Cappello et al., 2015);          At Piton de la Fournaise, the impact of lava flow haz-
Fogo in Cape Verde (Richter et al., 2016); and Karthala in         ard has previously been studied by Villeneuve (2000) and
the Grande Comore (Mossoux et al., 2019). Having been ac-          Davoine and Saint-Marc (2016), and an initial lava flow haz-
tive with an eruption every 9 months since the beginning of        ard map was published in a national report in 2012 (Di
the 20th century (Michon et al., 2013), producing such a map       Muro et al., 2012). This map is also mentioned in Nave et
for Piton de la Fournaise (La Réunion, France) is a particu-       al. (2016). However, the hazard map was drafted based on a
larly pressing need. At the same time, the wealth of data for      topography acquired in 1997, and between the publication of
eruptive events at Piton de la Fournaise means that we can         the national report in 2012 and the end of 2019, 18 eruptions
use this location as a case study to further test, develop, and    occurred, resurfacing approximately 19 km2 of land. Thus,
evolve methods for effective lava flow hazard map prepara-         regular reassessments of lava flow hazard at Piton de la Four-
tion at frequently active effusive centers.                        naise are needed to allow regular updates of maps in this
   Following widespread damage due to lava ingress into the        highly active environment where topography is changing an-
town of Piton Sainte-Rose in 1977, a volcano observatory,          nually due to emplacement of new lava flow units. Mapping
the Observatoire Volcanologique du Piton de la Fournaise           also needs to be flexible and reactive to the changing hazard
(OVPF) managed by the Institut de Physique du Globe de             situation as new vents and vent distributions become estab-
Paris (IPGP), was established on Piton de la Fournaise in          lished (Favalli et al., 2009a). The style (channelized versus
1979. The objective was to install and maintain, in opera-         tube-fed flow), magnitude (total volume erupted), and inten-
tional conditions, an adequate monitoring network to ensure        sity (peak effusion rates) of effusive activity will also evolve
surveillance of the volcano, thereby improving hazard miti-        to influence areas and lengths attained by lava flow fields
gation. Today, the permanent monitoring network run by the         (Harris and Rowland, 2001; Keszthelyi and Self, 1998; Row-
OVPF is one of the densest in the world, comprising more           land et al., 2005; Walker, 1973).
than 100 stations including seismometers, tiltmeters, exten-          To build a hazard map in such a dynamic environment we
someters, GNSS receivers, gas monitoring stations, cameras,        employed the DOWNFLOW code of Favalli et al. (2005),
and weather stations. This network allows the OVPF to an-          this being a stochastic model that allows quick, computation-
ticipate, to detect eruption onset, and to provide early warn-     ally efficient, and flexible estimation of the most probable ar-
ing to authorities so that they can organize implementation of     eas to be covered by lava flows (e.g., Favalli et al., 2009b,
the nationally mandated response plan to be followed by civil      2011; Richter et al., 2016). To apply DOWNFLOW, we need
protection (the “ORSEC-DSO plan”), a plan which includes           to calibrate it by obtaining the best-fit parameters to repro-
provision for evacuation of volcano visitors and resident pop-     duce the area of lava flow coverage for selected flows. Build-
ulations if needed (Peltier et al., 2018, 2020). However, effec-   ing a hazard map also involves calculation of the lava flow
tive hazard management also requires preparation of hazard         temporal recurrence intervals as well as vent distributions
maps to guide mitigation measures and actions (Pallister et        (Favalli et al., 2009a). We here describe this methodology,
al., 2019). In this regard, an exhaustive database for eruptive    step-by-step and present the resulting up-to-date lava flow
events has been built by the OVPF through their response to        hazard map for Piton de la Fournaise. Additionally, we com-
77 eruptions between 1979 and 2019, all of which have been         pare three hazard maps derived from three DEMs acquired in
geophysically, petrographically, and physically mapped and         1997, 2010, and 2016 to assess and discuss the effectiveness
measured. The existence of such a database allows applica-         of this method and the evolution of the hazard maps result-

Nat. Hazards Earth Syst. Sci., 21, 2355–2377, 2021                                https://doi.org/10.5194/nhess-21-2355-2021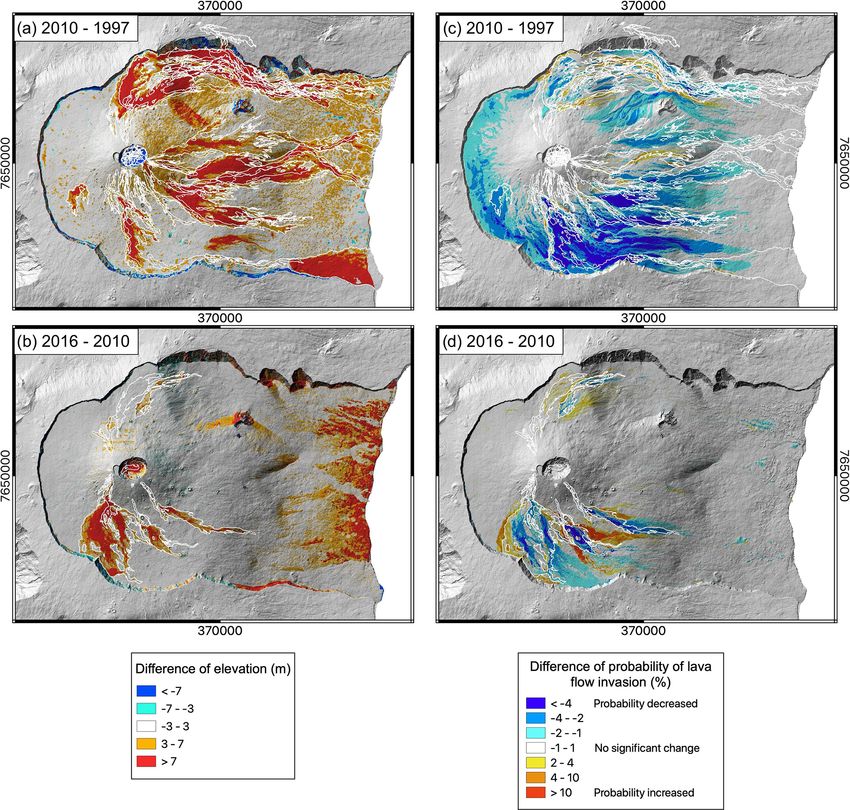
M. O. Chevrel et al.: Lava flow hazard map of Piton de la Fournaise volcano 2357
ing from changes in the topography as expressed in the up- Walker, 1988), eruptions at Piton de la Fournaise are pro-
dated DEMs, as will be a common issue at frequently active duced by dike or sill propagation following preferential paths
basaltic volcanoes. First, though, we present the geological leading to the concentration of eruptive fissures within, tan-
setting and eruptive activity at Piton de la Fournaise so as to gential to, or radially around the summit caldera and along
define the hazard and risk scenarios for this case type exam- the main rift zones (Bachèlery, 1981). At Piton de la Four-
ple. naise, there are three rift zones: the southeast rift zone
(SERZ), the northeast rift zone (NERZ), and the 120◦ N rift
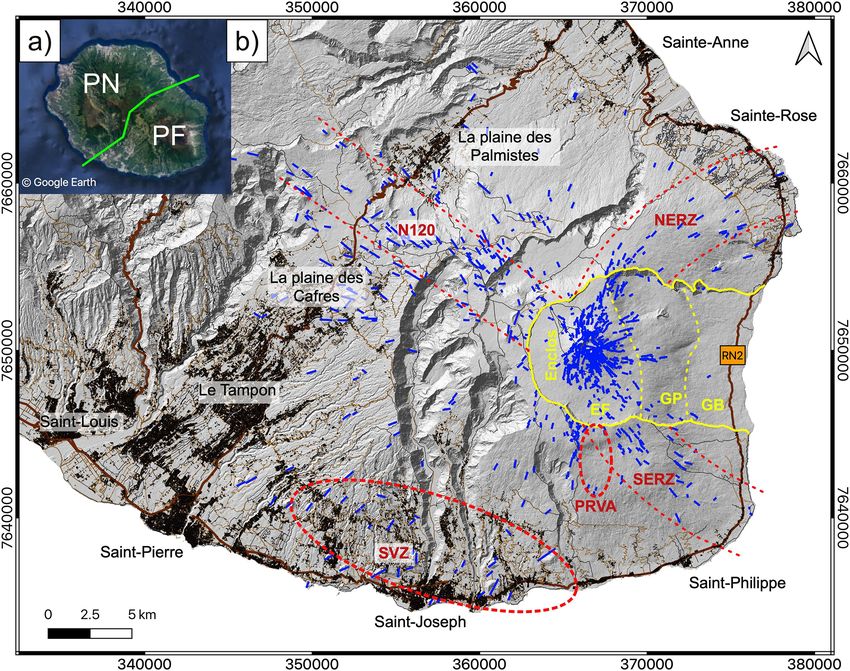
1.1 Geological setting zone (N120; Fig. 1b). These rift zones are the preferential
zones for opening of eruptive fractures and, consequently,
La Réunion island is located in the western Indian Ocean, are locations where effusive activity is primarily initiated (cf.
around 700 km east of Madagascar and 180 km southwest of Dvorak and Dzurisin, 1993). Two other zones with a high
Mauritius. The island is composed of two large shield volca- concentration of eruptive fissures have also been identified
noes (Fig. 1a): Piton des Neiges, which is dormant, and Piton (Michon et al., 2015), these being the South Volcanic Zone
de la Fournaise, which is one of the most active volcanoes in (SVZ) and the Puy Raymond Volcanic Alignment (PRVA;
the world (Peltier et al., 2009; Roult et al., 2012). The Piton Fig. 1b).
de la Fournaise edifice is marked by a large horseshoe-shaped Eruptions are mainly effusive and fed by en echelon fissure
caldera, referred to hereafter by its local name “the Enclos” sets, with each fissure being a few meters to a few hundred
(French for “enclosure”). The Enclos is an 8 km wide struc- meters long. Activity at the fissures is Hawaiian to Strombo-
ture, which is open to the ocean to the east and is surrounded lian in style to feed lava flows that can extend all the way to
by cliffs of up to 100 m high to the west, north, and south the ocean. Lava flows tend to be channel-fed to feed exten-
(Fig. 1b). This structure contains any active lava flow to the sive compound lava flow fields, but tubes can form during
Enclos limits, with the west-to-east slope guiding flows to- longer-lived eruptions (Coppola et al., 2017; Harris et al.,
wards the ocean. Although it is commonly accepted that the 2019; Rhéty et al., 2017; Soldati et al., 2018). Lava com-
Enclos is the most recent collapse structure at Piton de la position is usually transitional, ranging from aphyric basalt
Fournaise, its mechanisms of formation and respective ages to oceanite and midalkaline basalt (Albarède et al., 1997;
are still debated. While it may have been formed by a se- Lénat et al., 2012), with eruption temperatures in the range
ries of collapses and successive landslides (Bachèlery 1981; of 1150–1190 ◦ C (e.g., Boivin and Bachèlery, 2009; Rhéty
Merle et al., 2010; Michon and Saint-Ange, 2008; Merle and et al., 2017; Di Muro et al., 2014). Lavas thus have a rela-
Lénat, 2003), it may also be the result of only landslides tively low viscosity of the order of 102 –104 Pa s upon erup-
(Duffield et al., 1982; Gillot et al., 1994; Oehler et al., 2004, tion (Harris et al., 2016; Kolzenburg et al., 2018; Rhéty et al.,
2008). The upper part of the Enclos, whose western plateau 2017; Soldati et al., 2018; Villeneuve et al., 2008).
is located at > 1800–1700 m a.s.l., is recognized here as the Most effusive eruptions at Piton de la Fournaise occur
caldera sensu stricto (Michon and Saint-Ange, 2008) and is within the Enclos. This is part of La Réunion National Park
named the Enclos Fouqué (EF) (Fig. 1b). It is a relatively and is uninhabited. However, being a major tourist attrac-
flat plateau in the middle of which an asymmetric terminal tion, the Enclos does receive more than 100 000 visitors per
shield has been built to reach an altitude of 2632 m a.s.l. and year. As a result, the hiking trails in and access roads to
with slopes of between 15◦ (on the northern flank) and 30◦ the Enclos can receive heavy pedestrian and vehicular traf-
(on the eastern flank). The summit of the terminal shield is fic, whereby 129 000 hikers accessed the summit in 2011
marked by a 1.1 × 0.8 km caldera (“Cratère Dolomieu”) that (Derrien et al., 2018). The Enclos also hosts the island belt
has been formed by recurrent collapses, with the last col- road (national road RN2) which crosses the Grand Brûlé for
lapse occurring in April 2007 (Michon et al., 2009; Stau- a length of 9.5 km from north to south and is located at a
dacher et al., 2009; Derrien et al., 2020). To the west, Cratère distance of 800 m inland from the coast and at an altitude
Dolomieu is edged with a smaller (0.38 × 0.23 km) crater of 130–70 m a.s.l. (Fig. 1b). Being the only east coast line
(“Cratère Bory”). The eastern part of the Enclos, i.e., be- of communication, if cut it severely impedes travel between
low 1800 m a.s.l., is divided into two areas (most probably communities in the south and the north of the island (Har-
formed by successive landslides; Michon and Saint-Ange, ris and Villeneuve, 2018a). This road had an average traffic
2008) where the slopes are very steep (> 30◦ ), a zone here- usage of more than 4500 vehicles per day in 2014 (INSEE,
after named “Grandes Pentes” (French for “steep slopes”) 2014).
and a flatter (< 10◦ slopes) coastal area, hereafter named Based on an analysis of records available since the
“Grand Brûlé” (French for “widely burned”; Fig. 1b). first observations of activity in 1640, Villeneuve and
Bachèlery (2006) estimated that 95 % of the historic erup-
1.2 Effusive activity and risk tions have occurred in the Enclos Fouqué caldera (above
1800 m a.s.l.). These are so-called “proximal” eruptions as
As observed on most basaltic shield volcanoes (Dvorak et they are proximal to the terminal shield. Fissures and asso-
al., 1983; MacDonald et al., 1983; Tilling and Dvorak, 1993; ciated lava flows produced by these proximal eruptions may
https://doi.org/10.5194/nhess-21-2355-2021 Nat. Hazards Earth Syst. Sci., 21, 2355–2377, 2021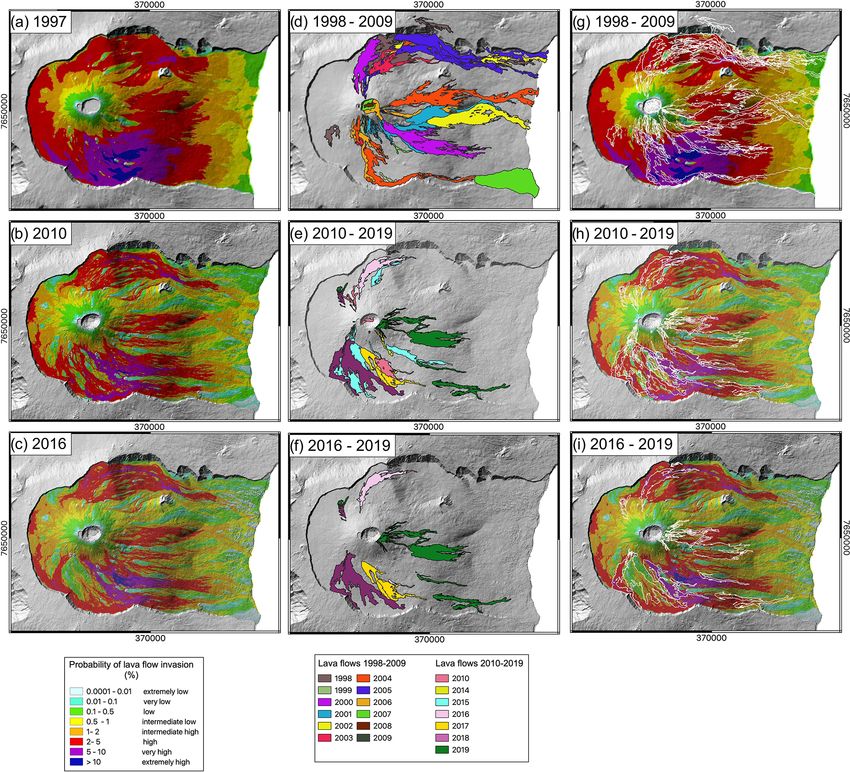
2358                                               M. O. Chevrel et al.: Lava flow hazard map of Piton de la Fournaise volcano

Figure 1. (a) La Réunion island (© Google Earth), where the green line delineates the two volcanoes: Piton des Neiges (PN) to the northwest
and Piton de la Fournaise (PF) to the southeast. (b) General map of Piton de la Fournaise showing the eruptive fissures as mapped up to the end
of 2019 (blue lines) and the buildings (in black) with the main municipalities, main roads (in brown – RN2 is the national road), and touristic
trails (thin black lines). The three main rift zones (120◦ N, N120; northeast, NERZ; and southeast, SERZ) and the two volcanic zones (Puy
Raymond Volcanic Alignment, PRVA; South Volcanic Zone, SVZ) are delineated by the dashed red lines as suggested in Bachèlery (1981)
and Michon et al. (2015). The yellow contour outlines the Enclos depression that is separated into three regions by the dashed yellow lines:
the Enclos Fouqué (EF), the steep slopes “Grandes Pentes” (GP), and the eastern lower part “Grand Brûlé” (GB). The dashed yellow line
between EF and GP is situated at 1800–1700 m a.s.l., while the one between GP and GB is around 500 m a.s.l. The background is the hill
shade of the lidar DEM from the Institut national de l’information géographique et forestière (IGN) – released in 2010, and coordinates are
within system WGS84-UTM 40S. Buildings, roads, and trails are from BD TOPO® IGN.

cut hiking trails and generate a risk for the visitors (Derrien           (Fig. 1b). They can also open in the inhabited highlands
et al., 2018) and necessitate evacuation and prohibition of               of the volcano, where there are the towns of La Plaine des
access to the Enclos (Peltier et al., 2020). To ensure effec-             Cafres and La Plaine des Palmistes (Fig. 1b). For example,
tive closure of the Enclos, a 2 m high gate located at the                the eruption of April 1977, which was the first Hors Enc-
head of the trail that descends a steep, narrow scallop in                los eruption since 1800, caused evacuation of Piton Sainte-
the Enclos cliff and allows hikers to access the Enclos via               Rose, entirely burnt or damaged parts of 26 buildings (in-
the Pas de Bellecombe-Jacob is physically closed. Fissures                cluding houses, a church, the police station, and a gas sta-
may also open on lower parts of the Enclos, in the Grandes                tion), and buried part of the Sainte-Rose municipality (Ki-
Pentes, or in the Grand Brûlé, i.e., below 1800 m a.s.l, and              effer et al., 1977; Vaxelaire, 2012). A second Hors Enclos
are called “low-flank” or “distal” eruptions. Eruptions out-              eruption in March 1986 caused around EUR 400 000 of dam-
side of the Enclos, called Hors Enclos eruptions – “hors”                 age to houses, household contents, agriculture, roads, and
being French for “outside”, are high risk for inhabitants as              utilities in the municipality of Saint-Philippe (Bertile, 1987;
fissures can open in or above inhabited areas near the coast,             Morin, 2012). In 1998, a third eruption occurred outside of
such as above the villages of Sainte-Rose and Saint-Philippe              the Enclos, with lava moving down steep slopes above the

Nat. Hazards Earth Syst. Sci., 21, 2355–2377, 2021                                         https://doi.org/10.5194/nhess-21-2355-2021
M. O. Chevrel et al.: Lava flow hazard map of Piton de la Fournaise volcano                                                 2359

village of Bois Blanc, but flow fronts stopped before reach-      2     Methods and data
ing the inhabited areas (Villeneuve and Bachèlery, 2006).
                                                                  2.1    Digital elevation models
1.3   Cycles of effusive activity
                                                                  Given the sensitivity of lava flow paths to topography (Favalli
At Piton de la Fournaise, spatiotemporal cycles of erup-          et al., 2005), for a target where the topography changes so
tive activity can be defined with typical periods of 1 year       often, as is the case at Piton de la Fournaise, using a fre-
to slightly more than a decade. According to Peltier et           quently updated digital elevation model (DEM) is essential
al. (2009), Got et al. (2013) and Derrien (2019), cycles are      for short-term lava flow hazard assessment. In this study we
driven by superficial processes being controlled by the evolu-    used the most recent DEMs to build the volcano hazard map.
tion of the shallow (< 2.5 km below the summit) stress field.     However, because we have three DEMs produced at differ-
A cycle typically starts with one or a few summit eruptions,      ent times we can also build and compare three hazard maps
followed by one or a few proximal eruptions (with vents           of the Enclos area for three different time periods between
opening on the terminal shield or at its base). A cycle may       1997 and 2016. The first DEM was obtained for the whole is-
then end with a large-volume, distal (“low flank”) eruption       land as derived from structure-from-motion analysis of aerial
in the Grande Pentes or Grand Brûlé area, as was the case in      photographs (i.e., application of stereophotogrammetry) ac-
2007, or with an Hors Enclos eruption, as was the case for the    quired during the 1997 campaign of the National Geographic
cycle that ended in 1977. In addition to these superficial cy-    Institute (IGN, which since 2012 has been named the Na-
cles, lava composition seems to be affected by cyclic changes     tional Institute of Geographic and Forest Information). This
in the “fertility” of the source magma as observed since 1930,    DEM has a 25 m horizontal resolution and is available on a
the date since which petrology of the volcanic products has       local projection (Gauss–Laborde Réunion) where elevations
been well documented (Vlastélic et al., 2018). These deep-        are based on the ellipsoid (Villeneuve, 2000). The second
source-related cycles are typically of longer duration (20–       DEM was acquired during 2008–2009 by the IGN via air-
30 years) than superficial cycles. They are characterized by a    borne light intensity detection and ranging (lidar) and has
continuous increase in source fertility until reaching a max-     a 5 m horizontal resolution over the whole island and 1 m
imum. This peak is followed by a continuous decrease in           near the coast. The vertical resolution is 0.05 to 0.1 m (Arab-
source fertility until a minimum is reached, which marks the      Sedze et al., 2014). This DEM was released in 2010 and was
end of a cycle and the beginning of a new one (Vlastélic et       resampled at a 5 m resolution across the entire island. It is
al., 2018). High-volume distal eruptions associated with pit      hereafter referred to as the “2010 lidar DEM from IGN”. Fi-
crater collapse (cf. Walker, 1988), as in 1931–1935, 1961,        nally, a most recent DEM was obtained in April 2016 from
1986, and 2007, have happened at the three-quarter stage of       optical Pléiades satellite images acquired in stereo triplet
a compositionally defined (“deep-seated”) cycle, i.e., just af-   mode and processed by the French Centre National d’Etudes
ter the peak of source fertility (Derrien, 2019).                 Spatiales using their S2P restitution code (de Franchis et al.,
   The average volume of lava emitted per eruption between        2014). This DEM is restricted to the Enclos, which is where
1970 and 2007 was about 10 × 106 m3 (Peltier et al., 2009).       all topographic changes took place between 2009 and 2016.
In 2007, when the activity was punctuated by a low-elevation      Although the horizontal resolution was 50 cm, it was resam-
(590 m a.s.l.) flank event in the Enclos, 140 to 240 × 106 m3     pled to 5 m for our study.
of lava was erupted in 30 d (Derrien, 2019; Roult et al., 2012;
Staudacher et al., 2009). Historically the 2007 event was,        2.2    Lava flow recurrence time
volumetrically, the largest single effusive event witnessed at
Piton de la Fournaise. Through the end of 2019, the March–        As a first step in building our lava flow hazard map we need
April 2007 eruption was followed by a further 25 “typi-           to estimate lava flow recurrence times on the volcano flanks.
cal” eruptions, each with a volume on average of 5 × 10⁶ m3       To do this we prepared a complete, exhaustive, and statisti-
and being fed from vents at higher (> 1700 m a.s.l.) altitudes    cally robust eruption inventory. For Piton de la Fournaise, the
(OVPF reports ISSN 2610-5101). The activity cycles show           inventory of all historical eruptions starts at the beginning of
that eruptive fissures are more likely to open at lower alti-     the 18th century with the first confidently dated eruption of
tudes and outside of the Enclos towards the end of superficial    1708 and can be built using the detailed chronologies in Mi-
cycles, and particularly voluminous effusive events may be        chon et al. (2013), Morandi et al. (2016), and Villeneuve and
expected just after the peak in a deep-seated cycle. However,     Bachèlery (2006). By compiling these studies and convolv-
such atypical low-flank and high-volume events are difficult      ing them with the record maintained since establishment of
to predict and can therefore be of high risk.                     the OVPF (Peltier et al., 2009; Roult et al., 2012; Vlastélic et
                                                                  al., 2018) as well as recent OVPF reports (ISSN 2610-5101),
                                                                  we estimate that Piton de la Fournaise had about 250 eruptive
                                                                  events over a period of 3 centuries. This inventory is given in
                                                                  Table S1 in the Supplement.

https://doi.org/10.5194/nhess-21-2355-2021                                Nat. Hazards Earth Syst. Sci., 21, 2355–2377, 2021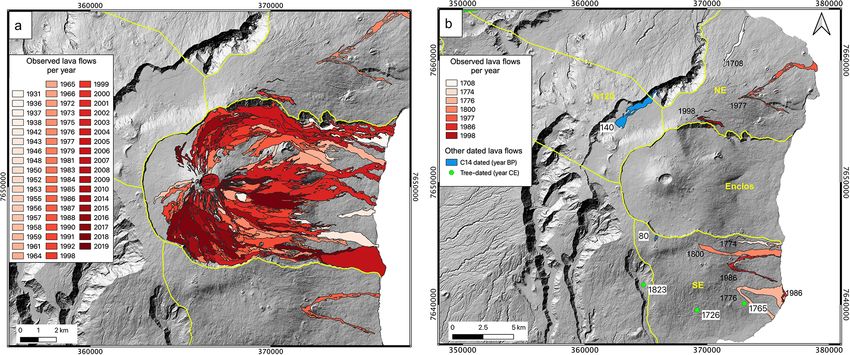
2360                                            M. O. Chevrel et al.: Lava flow hazard map of Piton de la Fournaise volcano

   To produce the lava flow hazard map, we need to account          mond lava flow (Vergniolle and Bachèlery, 1982); and three
for recurrence of individual lava flow fields and not the num-      other flows were dated at 1726, 1765, and 1823 by measur-
ber of eruptive events. This is because an eruptive event may       ing the base diameter of pioneer trees (Albert et al., 2020).
produce several lava flow fields that can be located several        On the northeast flank, we counted five flows that were all
kilometers apart. Therefore, an individual lava flow field is       witnessed (one in 1708, three in 1977, and one in 1998).
counted as a discrete entity and entered into the database          Within the less active N120 rift zone, the number of historical
when it is either temporally or spatially separated from an-        eruptions is not large. According to Morandi et al. (2016), 11
other flow field. Note that in the case of a fissure opening per-   tephra or lava flow deposits can be dated since 2920 ± 30 BP,
pendicular to the slope, the lava may erupt uniformly along         but only one lava flow has been dated after 1708 (Fig. 2b,
the fissure to feed several lava flow units simultaneously to       Tables 1 and S1). This eruption (named Piton Rampe 14)
form a flow field of many lava fingers (Harris and Neri, 2002;      was dated by 14 C at 140 ± 90 BP (Vergniolle and Bachèlery,
Kilburn and Lopes, 1991, 1988). In such a setting we counted        1982; Morandi et al., 2016). Another recent eruption is also
only the main, longest flow and do not consider all fingers         suggested from some poorly characterized (lapilli) deposits
that comprise the compound lava flow field in the database          close to the Trous Blancs area at 145 ± 30 BP (Morandi et
(cf. Walker, 1973). In the case where there is a pause in the       al., 2016), but no lava flow has been identified associated
eruption, and new flows are emitted in a second phase of ac-        with this event. However, if we consider the single lava flow
tivity, the main flow produced after the hiatus is also counted.    at Piton Rampe 14 since 140 ± 90 BP or the 11 eruptions
Finally, if an eruption simultaneously feeds lava flows at          since 2920 ± 30 BP, the eruption recurrence time does not
multiple, spatially distinct locations, each lava flow site is      vary significantly, being one every 263 years or one every
counted as a separate unit. Following this counting strategy,       209 years for the two periods, respectively. We therefore
one eruption may therefore be associated with several lava          assume just one eruption over our 311-year period (1708–
flows. From the creation of the OVPF (i.e., late-1979) until        2019) of records for the N120 rift zone.
the end of 2019, a period when the volcano has been contin-             Overall, this inventory represents a minimum bound on
uously monitored so that the inventory can be trusted to be         eruptive activity because it is possible that other eruptions
100 % complete, the volcano erupted 77 times, within which          and lava flows were not observed or have not yet been iden-
we can identify 128 distinct lava flows (Table S1). This trans-     tified in the geological record and dated. The minimum re-
lates to around 1.7 lava flows per eruption.                        currence of Hors Enclos lava flows since 1708 is therefore
   Given the fact that lava flows are more frequent in the En-      estimated at one every 21 years (Table 1). The relative occur-
clos than beyond its limit, we need to count the number of          rence probability is thus calculated by normalizing the num-
lava flows inside the Enclos based on a different period than       ber of lava flows per year within each region over the given
for flows outside of the Enclos. For this, we divided the vol-      period. The resulting relative probability of occurrence dur-
cano into five regions. The first region was the Enclos, and re-    ing the next eruption for a lava flow is 97.8 % inside the En-
gions 2 to 4 covered the Hors Enclos, which was sub-divided         clos and 2.2 % outside of the Enclos. Beyond the Enclos rel-
into three regions: the northeast flank (NE), southeast flank       ative probability can be divided into 1.4 %, 0.7 %, and 0.2 %
(SE), and the highlands along the 120◦ N rift zone (N120).          for the southeast, northeast, and N120 rift zones, respectively
The fifth region included the rest of Piton de la Fournaise.        (Table 1).
Inside the Enclos, we consider a time period since 1931, this
being the date since which a continuous record and reliable         2.3   Probability of vent opening
mapping have been possible (Derrien, 2019). Until the end
of 2019, this involved a total of 193 individual lava flows         DOWNFLOW has been previously applied to produce lava
(Fig. 2a, Tables 1 and S1). The recurrence time of lava flows       flow hazard maps at Mount Etna (Favalli et al., 2009c, 2011),
within the Enclos is therefore estimated to be one every 5 to       Nyiragongo (Chirico et al., 2009; Favalli et al., 2009b),
6 months for the 1931–2019 period. Over this period, only           Mount Cameroon (Favalli et al., 2012), and Fogo (Richter et
three eruptions occurred outside of the Enclos, and six lava        al., 2016). We here follow the same methodology developed
flows were counted for these three events (three in 1977,           since (Favalli et al., 2009c) and assume that future vents are
two in 1986, and one in 1998). To calculate the recurrence          more likely to open in areas where previous vents cluster. The
time of Hors Enclos lava flows, six is a rather small num-          probability of future vent opening is therefore determined on
ber of cases if we are to ensure good statistical representa-       the basis of location of historical vents but must be scaled to
tion. We therefore increased the time period to extend back         the lava flow recurrence probability within each region un-
to 1708. Over the 1708–2019 period, 15 lava flows were reg-         der the general assumption that the characteristics of future
istered outside of the Enclos (Fig. 2b, Tables 1 and S1). Nine      eruptions will be similar to those of past eruptions.
lava flows occurred on the southeast flank of the volcano.             Our inventory of vents for Piton de la Fournaise (Ta-
Of these, five were witnessed by inhabitants (in 1774, 1776,        ble 2, Fig. 3a) is based on the mapped scoria cone distri-
1800, and two in 1986); one was dated at 80 ± 35 BP using           bution (Davoine and Saint-Marc, 2016; Michon et al., 2015;
14 C dating on the carbon in the soil below the Piton Ray-          Di Muro et al., 2012; Villeneuve and Bachèlery, 2006) and

Nat. Hazards Earth Syst. Sci., 21, 2355–2377, 2021                                 https://doi.org/10.5194/nhess-21-2355-2021
M. O. Chevrel et al.: Lava flow hazard map of Piton de la Fournaise volcano                                                                                             2361

Figure 2. Maps of the lava flows considered in this study. (a) Lava flows inside the Enclos from 1931 (date from which the lava flow mapping
has been well recorded) up to the end of 2019 from pale to dark red (see Derrien, 2019). (b) Lava flows outside the Enclos from 1708 until
the end of 2019, including (i) observed flows (pale orange to red) (see Michon et al., 2015), (ii) non-observed but mapped and dated lava
flows (in blue; numbers indicate the year before present – BP – for 14 C-dated flows; see Vergniolle and Bachèlery, 1982), and (iii) tree-dated
lava flows (these are not mapped, but the dating location is represented by the green dots, and associated numbers indicate the calendar year
for flows; Albert et al., 2020). The yellow lines represent the limits between the regions we consider. The background is the hill shade of the
lidar DEM from IGN – released in 2010.

Table 1. Number of lava flows and statistics of recurrence and relative occurrence probability (see Table S1 for inventory).

          Region                            No. of lava        Time intervald         Recurrence time          No. of lava flows         Relative occurrence
                                                 flows                (years)                 (years)           per year (yr−1 )             probability (%)
          Summit craters                              47                      88                       1.9                     0.53                          23.8
          Enclos without cratersa                    146                      88                       0.6                     1.66                          73.9
          Inside Enclosb                             193                              0.5 (5.5 months)                         2.19                          97.8
          SE                                             9                   290                     32.2                      0.03                            1.4
          NE                                             5                   311                     62.2                      0.02                            0.7
          N120                                           1                   209                    209.0                     0.005                            0.2
          Hors Enclosc                                 15                                            20.7                      0.05                            2.2
          Total                                      208                                                                         2.2                        100.0
        a Enclos includes the Enclos Fouqué, Grandes Pentes, and Grand Brûlé, except the summit craters area. b Inside Enclos includes the whole Enclos with the
        summit craters. Lava flows are counted from 1931 up to the end of 2019. c Lava flows outside Enclos are divided by region south of the caldera (SE), north
        (NE), and along the 120◦ N rift zone (N120) (see Fig. 2). d Time interval corresponds to the time between the oldest considered dated lava flow up to the end
        of 2019.

is here updated with all new vents formed between 2015                                    only one lava flow formed. This therefore also results in a
and the end of 2019 (Fig. 3a). We counted any scoria cone                                 higher number of vents than lava flows (Table 3). Conversely
that is morphologically definable and included undated sco-                               in the summit craters, we were not able to properly locate
ria cones. This method implies that the number of vents over                              all vents due to burial by subsequent activity, but we could
the entire volcano is much higher (726; Table 2) than that                                map and count the number of flows. This, thus, resulted in an
of the number of lava flows considered (208; Table 1). In-                                underestimation of number of vents and a higher number of
side the Enclos, for the period post-1931 (Table 3), we did                               lava flows than vents in this area.
not consider undated scoria cones, but, in some places, we                                   The vent density distribution (number of vents per unit
counted more than one scoria cone along a fissure, although                               area) was then obtained by applying a symmetric Gaussian

https://doi.org/10.5194/nhess-21-2355-2021                                                          Nat. Hazards Earth Syst. Sci., 21, 2355–2377, 2021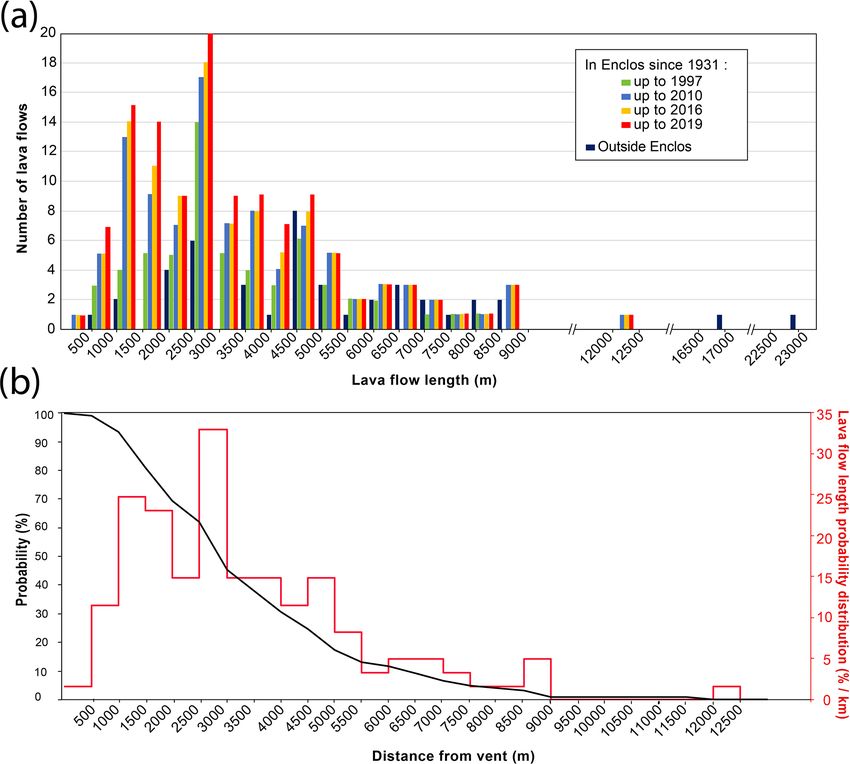
2362 M. O. Chevrel et al.: Lava flow hazard map of Piton de la Fournaise volcano
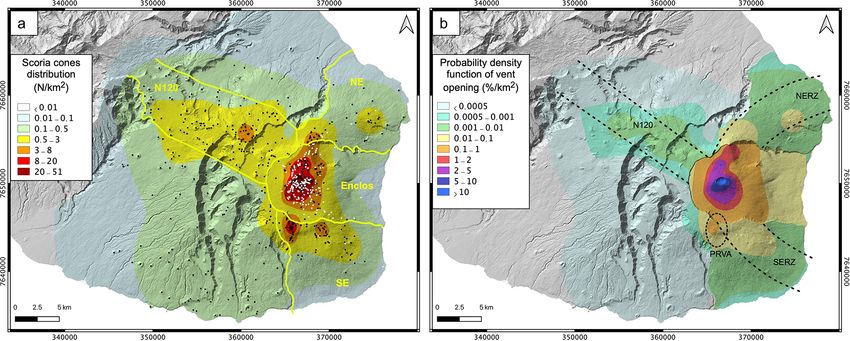
Figure 3. (a) Distribution and density (in number km−2 ) of scoria cones (black and white dots) on Piton de la Fournaise based on available
inventory (OVPF database). In black are scoria cones older than 1931, and in white are the vents from 1931 to the end of 2019. In total
there are 726 vents. The yellow lines represent the limits between the regions we considered to estimate probability of vent opening and to
compute the hazard maps: the Enclos, southeast (SE), northeast (NE), and 120◦ N (N120) rift zones. (b) Probability density function of vent
opening (in % km−2 ). The dashed lines outline the rift zones to 120◦ N (N120), to the northeast (NERZ), and to the southeast (SERZ) as
well as the Puy Raymond volcanic alignment (PRVA) (Bachèlery, 1981; Michon et al., 2015). The background is the hill shade of the lidar
DEM from IGN – released in 2010.
Table 2. Scoria cone distribution divided by regions. from 8 vents km−2 in the Enclos Fouqué caldera to 3 and
0.5 vents km−2 in the Grandes Pentes and the Grand Brûlé,
Region No. of Fraction of respectively. Outside of the Enclos, vent densities range from
vents vents (%) 0.01 to 8 vents km−2 in the rift zones, with a highest concen-
Summit craters 27 3.7 tration of up to 21 vents km−2 within the PRVA (as already
Enclos without cratersa 300 41.3 noted by Michon et al., 2015).
We find that, of the 726 mapped vents, 45 % (327) are
Inside Enclosb 327 45.0 within the Enclos, while 55 % (399) are outside of the En-
SE 98 13.5 clos. For the Hors Enclos vents, 20 % (142) are in the N120
NE 49 6.7 rift zone, 13 % (98) are on the southeast flank, 7 % (49) are
N120 142 19.6 on the northeast flank, and 15 % (110) are elsewhere on the
Rest of the volcano 110 15.2 volcano flanks (Table 2). These distributions of vents per re-
Hors Enclosc 399 55.0 gion differ significantly from the lava flow relative occur-
rence probability per region (Table 1). For example, while
Total 726 100 the N120 rift zone accounts for 20 % of the total number of
a Enclos includes the Enclos Fouqué, Grandes Pentes, and Grand vents (Table 2), only 0.2 % of the lava flows recorded since
Brûlé except the summit craters area. b Inside Enclos includes 1708 have occurred in this region (Table 1). Instead, within
the whole Enclos with the summit craters. Lava flows are
counted from 1931 up to the end of 2019. c Lava flows outside the Enclos, where ∼ 98 % of the lava flows have been em-
Enclos are divided by region south of the caldera (SE), north placed (Table 1), we count only 45 % of the total number
(NE), and along the 120◦ N rift zone (N120) (see Fig. 2).
of vents (Table 2). This difference is mainly due to the pe-
riod of time required for cones located in the various regions
to disappear. In the Enclos, resurfacing processes and land-
smoothing kernel to the map of vent locations (Bowman and scape changes, such as fissure opening, building of new sco-
Azzalini, 2003; Favalli et al., 2012; Richter et al., 2016) ria cones over old ones, and burial by lava flows, occur at
with a bandwidth that is a function of the local vent den- much higher rates than beyond the Enclos. Therefore, the
sity. The vent density distribution is presented in Fig. 3a. lifespan of scoria cones (vents) within the Enclos is consid-
Within the Enclos, the highest vent concentration is located erably shorter than that of scoria cones outside of the caldera,
to the southeast of the summit crater, where the density is where ∼ 66 % of the Enclos has been resurfaced at least once
up to 51 vents km−2 . To the east, the concentration decreases since 1931. Moreover, the selected time period (1708–2019)
Nat. Hazards Earth Syst. Sci., 21, 2355–2377, 2021 https://doi.org/10.5194/nhess-21-2355-2021M. O. Chevrel et al.: Lava flow hazard map of Piton de la Fournaise volcano 2363
Table 3. Lava flow relative occurrence probability and scoria cone distribution within Enclos for the 1931–1997, 1931–2010, 1931–2016,
and 1931–2019 periods.
Region No. of lava Time Recurrence No. of lava flows Relative No. of Fraction
flows interval time per year occurrence scoria of scoria
(years) (years) (yr−1 ) probability (%) cones cones (%)
From 1931 up to 1997
Summit craters 31 66 2.1 0.5 28.4 3 3.4
Enclos without craters 78 66 0.8 1.2 71.6 85 96.6
Total 109 1.7 100.0 88 100
From 1931 up to 2010
Summit craters 46 79 1.7 0.6 27.1 9 5.8
Enclos without craters 124 79 0.6 1.6 72.9 146 94.2
Total 170 2.2 100.0 155 100
From 1931 up to 2016
Summit craters 47 85 1.8 0.6 26.1 10 6.1
Enclos without craters 133 85 0.6 1.6 74.2 154 93.9
Total 180 2.1 100.00 164 100
From 1931 up to 2019
Summit craters 47 88 1.9 0.5 24.4 10 5.4
Enclos without craters 146 88 0.6 1.7 75.6 176 94.6
Total 193 2.2 100.0 186 100
does not cover the full variability in eruption location and 2.4 DOWNFLOW model calibration
activity cycles documented by geological studies (Morandi
et al., 2016, and references therein), where (in the geologic Lava flows are gravitational flows that follow approximately
past) eruptions outside of the Enclos have, at times, been the steepest descent path defined by the underlying topogra-
much more frequent than during the last 300 years. For this phy (Harris, 2013). DOWNFLOW is a numerical code that
reason, the sum of probability density function for future vent computes a number (N ) of steepest descent paths from a
opening within a given region of the volcano was set equal to given point over a DEM that is modified by randomly ap-
the relative occurrence probability of lava flow in that region, plying a vertical perturbation in the range of ±1h at every
while the spatial distribution for future vent opening within pixel (Favalli et al., 2005). By iteration over N runs, the code
each region follows the vent distribution itself. computes whether a pixel is “hit” by a lava path or not. The
The resulting map of the probability density function of result of a simulation represents the probabilistic estimation
vent opening per unit area is given in Fig. 3b. The high- of the lava flow inundation area for the given 1h, N, and
est probabilities exceed 10 % km−2 , with a maximum of DEM combination, regardless of the lava properties. Thus,
24 % km−2 in the Dolomieu crater and across the prox- before applying DOWNFLOW to a given case, the key in-
imal area of the terminal shield, while moderate val- put parameters 1h and N need to be defined for the volcano
ues are obtained across the Grandes Pentes and in the and DEM in question (Favalli et al., 2005, 2012; Richter et
Grand Brûlé (0.01 % km−2 –0.5 % km−2 and 0.003 % km−2 – al., 2016). Calibrating DOWNFLOW therefore consists of
0.01 % km−2 , respectively). The northeast and southeast rift finding the parameters 1h and N for a given DEM that are
zones also have low to moderate values (0.003 % km−2 – able to best fit the model-generated and actual lava flow ar-
0.5 % km−2 ), while the N120 rift zone has a value of less than eas (Favalli et al., 2005). To do this at Piton de la Fournaise,
0.003 % km−2 . For the rest of the volcano the probability of ranges of 1h (0 to 5 m) and N (100 to 10 000) were applied
vent opening is very low, being less than 0.0001 % km−2 . to selected lava flows. For each DEM, the lava flows were
However, we note an area of relatively high values (up to selected if they occurred on the unmodified DEM (i.e., the
0.5 % km−2 ) located at the PRVA (Fig. 3b). underlying topography is known). DOWNFLOW then com-
putes the array of steepest descent paths out to the limit of
the DEM, which, in our case, is the coast, but does not allow
computation of lava flow lengths. Therefore, for the calibra-
tion exercise, the simulations were cut at the actual length
https://doi.org/10.5194/nhess-21-2355-2021 Nat. Hazards Earth Syst. Sci., 21, 2355–2377, 20212364 M. O. Chevrel et al.: Lava flow hazard map of Piton de la Fournaise volcano
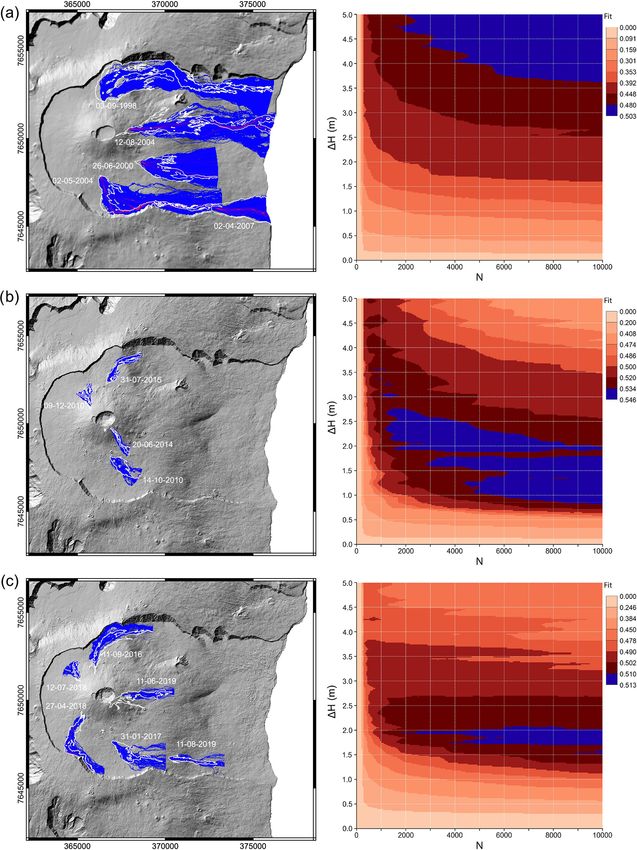
of the flow under consideration (Fig. 4). Following Favalli et rheologically possible (Rowland et al., 2004; Wright et al.,
al. (2009b) and Richter et al. (2016), the best-fit parameters 2008). Here, at Piton de la Fournaise no clear relationship
can be found by comparing the actual, mapped lava flow area was found between lava flow length and vent elevation. Due
(AR ) with that generated by the simulation (AS ): to the great changes in slope within the Enclos (< 3◦ in the
Enclos Fouqué to 35◦ in the Grandes Pentes area and then
AS ∩ AR < 10◦ at the coast) and the presence of deep valleys on the
µ= . (1)
AS ∪ AR volcano flanks, no clear relation was found between MOR
Under this condition, µ is a measure of the “goodness of and lava flow length. It was not possible to find a clear rela-
fit” between simulated and actual parameters, where if µ = 1 tionship between effusion rate and lava flow runout lengths
then the two areas coincide perfectly, and if µ → 0 then the as calculated with the FLOWGO model because each slope
simulation becomes increasingly unrealistic. Best-fit param- condition or changes between different conditions change the
eters are usually obtained for µ ∼= 0.5 (Tarquini and Favalli, relationship. However, given the high number of lava flows,
2011). Proietti et al. (2009) and Spataro et al. (2004) evolve it was instead possible to compute the probability that a pixel
this approach slightly by considering a fitting function of at a given distance from the vent will be “hit” by lava from
√ the lava flow length frequency distribution of the historical
e1 = µ. This yields the same results but gives numerical
values closer to one. flows. To generate this probability function, we measured
We performed three calibrations, one for each of the three the long axis (as a proxy for the length) of all counted lava
available DEMs (Fig. 4). In total, we ran 70 000 simulations. flows (Fig. S1). Inside the Enclos, the lava flow length distri-
For the calibration based on the 1997 DEM, which has a res- bution frequency is obtained for all the mapped flows from
olution of 25 m, we selected the five flows that were erupted 1931 until 1997, 2010, and 2016 as well as until the end
between 1998 and 2007 and obtained a best fit of µ = 0.50 of 2019 (Fig. 5a). For the Hors Enclos lava flows, we ex-
for N > 6000 and 1h > 4 m. For the calibration based on the tended the database to all flow units that have been mapped
2010 and 2016 DEMs, which were both set at 5 m pixel reso- by Bachèlery and Chevallier (1982), even if they are not
lution, we considered four and six flows between 2010–2015 dated. This gave us a total of 43 lava flows to work with (see
and 2016–2019, respectively (all emplaced on the unmodi- also Di Muro et al., 2012; Principe et al., 2016; Figs. 5a and
fied topography). The best fit was obtained at µ = 0.54 and S1). For each time period, the number of lava flows reach-
µ = 0.51, respectively, for N > 5000 and 1h of around 2 m ing a given length was then converted into a lava flow length
(Fig. 4). Note that the difference in DEM resolution (25 m probability distribution in terms of % km−1 . From this prob-
for 1997 and 5 m for 2010 and 2016) implies that the random ability distribution, the probability that a point at any given
noise in elevation (1h) is applied on a different spatial fre- downslope distance from a vent will be reached by lava can
quency. On a given topography, the higher the pixel size, the be calculated (Fig. 5b).
greater the amount of random noise that needs to be applied.
2.6 Building probabilistic lava flow hazard maps
This means that for lower resolutions we expect that the best
fit will be obtained for higher values of 1h. The calibration A lava flow hazard map gives the probability, at each point,
parameters chosen to run DOWNFLOW and build the hazard of inundation by the lava upon the occurrence of the next ef-
maps were thus N = 10 000 for all DEMs but 1h = 5 m for fusive eruption from any given point (Rowland et al., 2005;
the 1997 DEM and 1h = 2 m for the 2010 and 2016 DEMs. Wright et al., 2008). To produce our hazard map, DOWN-
FLOW was thus run at each vent point in a grid of com-
2.5 Lava flow length
putational vents with a 100 m cell size. For the whole of
To properly evaluate the probability of lava flow inundation, the Piton de la Fournaise edifice, this represents a total of
an estimate of expected lava flow lengths is required. Sev- 126 000 vents and simulations, of which 12 000 were inside
eral methods exist to estimate the most likely length of a lava the Enclos. The resulting database of simulations provides an
flow. At Etna, Favalli et al. (2005) observed a linear rela- inundation matrix (or mask) in which each cell is assigned
tionship between the altitude of the main vent and the maxi- probability Pij , where Pij = 1 if pixel i is hit by the sim-
mum possible length of the associated flow. Another method ulation of a lava flow originating from vent location j , and
is based on the empirical relationship between the average ef- Pij = 0 otherwise (irrespective of the distance between j and
fusion rate during an eruption (i.e., mean output rate, MOR: i). The hazard at any pixel i, with a given size (1x; 1y),
total volume erupted divided by the duration of the erup- is defined as the total probability Hi that pixel i may be in-
tion; Harris et al., 2007) and the length of the flow (Walker, undated by lava originating at any possible vent location j
1973). Alternatively, expected cooling-limited flow lengths (Favalli et al., 2012):
X
can be calculated using a thermo-rheological model, such Hi = ρ 1x1y · Pij · PLij . (2)
j Vj
as FLOWGO (Harris and Rowland, 2001). This approach
uses theoretical flow cooling and crystallization properties This sum extends over all possible vent locations j with the
to estimate the point at which forward motion is no longer coordinates xj and yj , and ρVj is the probability density
Nat. Hazards Earth Syst. Sci., 21, 2355–2377, 2021 https://doi.org/10.5194/nhess-21-2355-2021M. O. Chevrel et al.: Lava flow hazard map of Piton de la Fournaise volcano 2365 Figure 4. DOWNFLOW calibration for a selected set of lava flows for the three time periods: (a) in the 25 m resolution 1997 DEM, (b) in the 2010 lidar DEM, (c) in the 2016 DEM produced from Pléiades. To the left, the maps show the lava flow contours in white and the best DOWNFLOW simulations in blue. To the right, the best-fit distribution over the 1h − N space is shown (best-fit parameter range is in dark red and blue). https://doi.org/10.5194/nhess-21-2355-2021 Nat. Hazards Earth Syst. Sci., 21, 2355–2377, 2021
2366                                               M. O. Chevrel et al.: Lava flow hazard map of Piton de la Fournaise volcano

Figure 5. (a) Frequency distribution of the lava flow length (by steps of 500 m) at Piton de la Fournaise (La Réunion) for lava flows within
the Enclos from 1931 up to 1997, 2010, 2016, and 2019 and for all mapped flows outside the Enclos. (b) Probability for a lava flow to reach
a given distance (black line) and the corresponding lava flow length probability distribution (red line) for the 1931–2019 period as a function
of distance from the vent.

function of a vent opening at location j , as shown for the               for the rest of the volcano, we considered the length of
whole edifice in Fig. 3b. In addition, PLij is the probabil-              the flow units mapped by Bachèlery and Chevallier (1982)
ity that a lava flow originating from vent j will reach pixel i           (Figs. 5, S1). This is then convolved with the probability
along the calculated flow path (black curve in Fig. 5b). Using            density function of vent opening from all the historical vents
this methodology, we produced a hazard map for the entire                 presented in Fig. 3b following Eq. (2). To build the succes-
volcano plus three hazard maps for the Enclos area: one for               sive hazard maps of the Enclos, we take the appropriate data
each of the three DEMs (that is for 1931–1997, 1931–2010,                 set from the time of DEM generation back to 1931 (Table 3).
and 1931–2016).                                                           The data set includes (i) lava flow length probability distribu-
   To be as up to date as possible, the hazard map for the                tion (PLij ) extracted from the lava flow length measurements
entire volcano was derived using a combination of the 2016                (Fig. 5), (ii) the probability of future vent opening (ρVj ) as
DEM for the Enclos area and the 2010 DEM for the rest of                  based on the vent distribution and the corresponding recur-
the volcano (Fig. 6). We can assemble these two DEMs be-                  rence time of lava flows, and (iii) the DOWNFLOW mask
cause the 2010 DEM will not have been affected by topo-                   (Pij ) derived from the calibration values (N and 1h) tailored
graphic change outside of the Enclos as there were no Hors                for each case (Fig. 4).
Enclos eruptions between 2010 and 2016. We run DOWN-
FLOW using the best-fit parameters as determined for the
2016–2019 period (Fig. 4c). In the Enclos, the lava flow
length distribution was determined over 1931–2019, while

Nat. Hazards Earth Syst. Sci., 21, 2355–2377, 2021                                         https://doi.org/10.5194/nhess-21-2355-2021
M. O. Chevrel et al.: Lava flow hazard map of Piton de la Fournaise volcano 2367
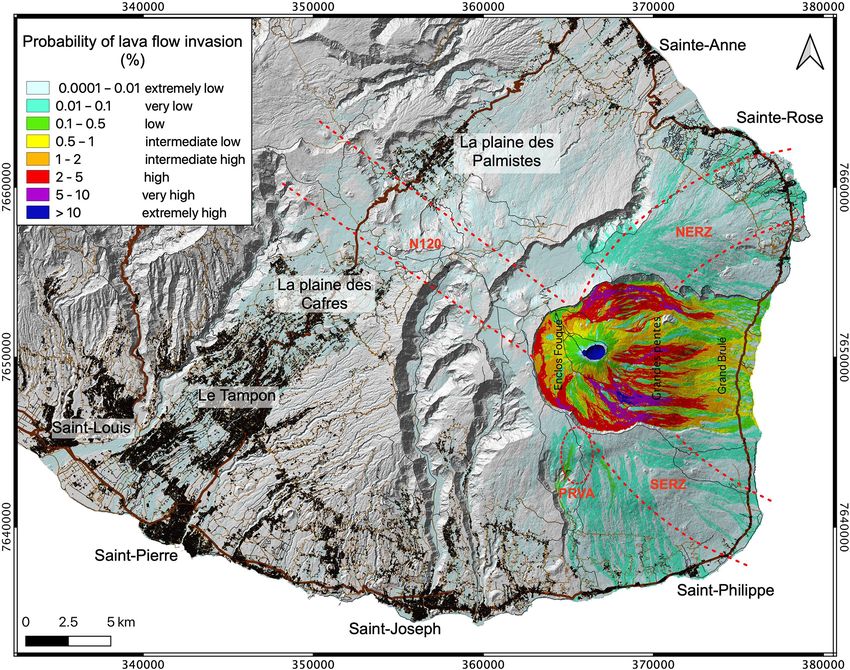
Figure 6. Lava flow hazard map of Piton de la Fournaise. Probability of lava flow invasion is given as percentages and is color-coded from
extremely low (< 0.01 %) to extremely high (> 10 %). The buildings are represented as black polygons, the main roads are in brown (in bold
is the RN2 national road), and touristic trails are the thin black lines (data from BD TOPO® IGN). The dashed red lines outline the rift zones
to 120◦ N (N120), to the northeast (NERZ), and to the southeast (SERZ) as well as the Puy Raymond volcanic alignment (PRVA) (Bachèlery,
1981; Michon et al., 2015). The background is the hill shade of the lidar DEM from IGN – released in 2010.
3 Hazard maps 0.5 %). We note that there is a relatively high probability (of
up to 2 %) that flows will cut the belt road in some places.
3.1 Hazard map for the entire volcano The highest probability of lava flow inundation outside of
the Enclos is up to 0.5 % and is on the southeast and north-
east flanks of the volcano as well as in the PRVA (Fig. 6).
Our lava flow hazard map for Piton de la Fournaise is pre- The less active N120 rift zone has a very low but still non-
sented in Fig. 6. The map clearly shows that the highest prob- negligible probability of lava flow invasion (< 0.01 %). Al-
ability of lava flow inundation for the next eruption at Piton though the probability of vent opening is higher at greater al-
de la Fournaise is located within the Enclos. This high prob- titudes (Fig. 3), the lava flow length is usually longer outside
ability of lava flow invasion in the Enclos is due to the high of the Enclos than inside (Fig. 5). This implies that outside
frequency of eruptions in this area in comparison to the rest of the Enclos the probability of lava flow inundation remains
of the volcano. The probability of lava inundation is calcu- the same as distance increases from the vent, while inside the
lated to be high (> 1 %) for about half (47 %) of the Enclos Enclos it reduces with distance from the vent (n.b., lava flow
area. The probability of lava flow invasion reaches an ex- length distribution peaks are at around 3000 m; Fig. 5). This
tremely high value (12 %) at the summit craters and in some means that outside of the Enclos the probability distribution
places within the Enclos Fouqué area and across parts of the for lava flow inundation seems to depend mostly on vent lo-
Grandes Pentes. In the Grand Brûlé area, the probability is
calculated as being intermediate (up to 2 %) to low (0.1 %–
https://doi.org/10.5194/nhess-21-2355-2021 Nat. Hazards Earth Syst. Sci., 21, 2355–2377, 20212368 M. O. Chevrel et al.: Lava flow hazard map of Piton de la Fournaise volcano
cation and the flow path, as influenced by local topography (Fig. 8c). One of the main differences in the spatial distri-
rather than distance from the vent. bution of lava flow probability between the 2010 and 2016
hazard maps is located to the south of the terminal shield,
3.2 Evolution of the hazard map within the Enclos where the August 2015 lava flow field was emplaced (see
Fig. 7). This lava flow field has a volume of 35.5 × 10⁶ m3
The data set used to build the three hazard maps is presented and an average thickness of 8.5 m (OVPF database; Fig. 8d)
in Table 3 and shows that the number of scoria cones in- and affected the probability calculation by lowering the value
creased from 88 for 1931–1997 to 186 by 2019, and the num- in this area. However, although on the 2016 hazard map the
ber of lava flows emitted almost doubled from 111 for the probability of lava flow invasion was estimated to be low,
period 1931–1997 to 195 for the period 1931–2019. The per- the 2018 lava flows were emplaced exactly there. This high-
centage of vents in the summit craters versus those forming lights the important effect of vent opening probabilities that
in the rest of the Enclos increased from 3.4 % for the pe- remains high in this region and may overcome the effect of
riod 1931–1997 to 5.8 % for the period 1931–2010 and then topography changes in determining flow paths.
was roughly the same between 2010 and 2019 (Table 3). The
probability of lava flow in the summit craters (Table 3) there-
fore decreased from 27.9 % in 1997 to 24.1 % in 2019, re- 4 Discussion
flecting that eruptions within the craters became rarer over
the analyzed period, being non-existent between 2014 and According to Calder et al. (2015), uncertainties in hazard
2019. maps are mainly related to three issues:
The spatial distribution of lava flow inundation probabil-
(i) the incompleteness and bias of the geological
ity for the three considered periods (1931–1977, 1931–2010,
record and the extent to which it represents pos-
and 1931–2019) is presented in Fig. 7. The lava flow proba-
sible future outcomes; (ii) the fact that analyses
bility inside the summit craters is not represented in Fig. 7 be-
based on empirical models rely on a priori knowl-
cause lava emitted from a vent opening in the summit crater
edge of the events; and (iii) the ability of complex
will become entrapped in the pit and will not be free to flow
computational models to adequately represent the
down the slopes of the Enclos. Therefore, we did not per-
full complexity of the natural phenomena.
form simulations from the summit pit crater area. The three
maps present some common features as well as changes over Our hazard maps presented here in Figs. 6 and 7 have been
time. The increasing DEM resolution from 2010, where there produced from available historical and geological records of
was a decrease in pixel size from 25 m in 1997 to 5 m in when and where past lava inundation has occurred at Piton
2010, improves the sharpness of the maps. This causes the de la Fournaise as well as vent location and lava flow length.
high-probability areas (red to purple and blue in Fig. 7) to The quality and detail of these records improve with time and
be smaller in size in the 2010 and 2016 maps than in the are better inside the Enclos than outside. The maps are based
1997 map. On the three hazard maps, the highest probabili- on stochastic simulations of lava flow paths using DOWN-
ties (2 % to > 10 %) of lava flow inundation are concentrated FLOW, the reliability of which depends on the quality and
above 1800–1700 m a.s.l. (i.e., in the Enclos Fouqué caldera), up-to-dateness of our topographic model (DEM). This is an
with the highest values located to the southeast of the termi- issue at frequently active effusive centers, where emplace-
nal cone, along the continuation of SERZ inside the Enclos, ment of new lava units causes the topography to be in a state
and bordering the south wall of the Enclos (Fig. 7). Between of near-constant change. Here we thus discuss the validation
1997 and 2010, this high-probability area to the southeast of of the hazard maps, the uncertainties related to their interpre-
the terminal cone slightly decreases in terms of probability tation, and the extent to which they are adequate in assessing
values and size. In contrast, in the 2016 hazard map this area risk associated with future eruptions.
has higher values of up to 12 % and is spread over a larger
area than in 2010. 4.1 Validating hazard mapping with recent eruptions
In Fig. 8, we give the difference in topography (panels a
and c) and in hazard probability (panels c and d) between the In Fig. 7, we compare the three maps of the Enclos created
hazard maps. We note that, on the 2010–1997 map (Fig. 8a), for each time period with emplacement location of subse-
the noise is partly due to a difference in acquisition meth- quent lava flows. We see that most lava flows occurred in the
ods (lidar versus photogrammetry), and on the 2016–2010 high-probability zone (> 2%, red zone; Fig. 7g, h, i). How-
map the positive elevation difference near the cost is due to ever, a majority of the flows did not necessarily extend into
vegetation that has not been removed from the 2016 DEM the very-high-probability zones (> 5 %, purple to blue). On
(Fig. 8b). The improved DEM resolution between 1997 and the 1997 hazard map, we note that the longest flows that
2010 has a direct effect on the spatial distribution of prob- reached the coast and the 2007 flow field were emplaced in
ability, resulting in an overall decrease in the probabilities low-probability zones (< 1 %, yellow–green; Fig. 7g). Be-
and reduction in the area of coverage of high probabilities cause our hazard maps are computed with a database in
Nat. Hazards Earth Syst. Sci., 21, 2355–2377, 2021 https://doi.org/10.5194/nhess-21-2355-2021You can also read