Light-Off in Plasmon-Mediated Photocatalysis - Chalmers ...
←
→
Page content transcription
If your browser does not render page correctly, please read the page content below
Light-Off in Plasmon-Mediated Photocatalysis

Downloaded from: https://research.chalmers.se, 2021-12-24 16:27 UTC

     Citation for the original published paper (version of record):
     Tiburski, C., Boje, A., Nilsson, S. et al (2021)
     Light-Off in Plasmon-Mediated Photocatalysis
     ACS Nano, 15(7): 11535-11542
     http://dx.doi.org/10.1021/acsnano.1c01537

N.B. When citing this work, cite the original published paper.

research.chalmers.se offers the possibility of retrieving research publications produced at Chalmers University of Technology.
It covers all kind of research output: articles, dissertations, conference papers, reports etc. since 2004.
research.chalmers.se is administrated and maintained by Chalmers Library

                                           (article starts on next page)
Article
www.acsnano.org
Light-Off in Plasmon-Mediated Photocatalysis
Christopher Tiburski, Astrid Boje, Sara Nilsson, Zafer Say, Joachim Fritzsche, Henrik Ström,
Anders Hellman, and Christoph Langhammer*
Cite This: ACS Nano 2021, 15, 11535−11542 Read Online
ACCESS Metrics & More Article Recommendations *
sı Supporting Information
See https://pubs.acs.org/sharingguidelines for options on how to legitimately share published articles.
ABSTRACT: In plasmon-mediated photocatalysis it is of critical importance to
Downloaded via CHALMERS UNIV OF TECHNOLOGY on July 29, 2021 at 11:46:51 (UTC).
differentiate light-induced catalytic reaction rate enhancement channels, which
include near-field effects, direct hot carrier injection, and photothermal catalyst
heating. In particular, the discrimination of photothermal and hot electron
channels is experimentally challenging, and their role is under keen debate. Here
we demonstrate using the example of CO oxidation over nanofabricated neat Pd
and Au50Pd50 alloy catalysts, how photothermal rate enhancement differs by up to
3 orders of magnitude for the same photon flux, and how this effect is controlled
solely by the position of catalyst operation along the light-off curve measured in
the dark. This highlights that small fluctuations in reactor temperature or temperature gradients across a sample may
dramatically impact global and local photothermal rate enhancement, respectively, and thus control both the balance between
different rate enhancement mechanisms and the way strategies to efficiently distinguish between them should be devised.
KEYWORDS: nanoalloys, heterogeneous catalysis, plasmonics, photothermal, CO oxidation, gold−palladium, photocatalysis
P lasmon-mediated photocatalysis has seen rapid develop-
ment since the seminal publications more than a decade
ago.1−9 It builds on the excitation of the localized
surface plasmon resonance (LSPR) in metal nanoparticles and
the fact that, in this way, optical cross sections many times
form due to (i) nonuniform metal nanoparticle distributions,
(ii) inhomogeneous illumination intensity, (iii) 3D nano- or
mesoporous support materials with complex and anisotropic
heat transport properties, and (iv) attenuation/absorption of
irradiated photons inside such a support material. These effects
larger than the particle size can be achieved.10 Mechanistically, have been identified as important and pinpointed as
the LSPR phenomenon may influence a chemical process on a inadequately addressed in the literature.14,18
metal nanoparticle surface in three distinctly different ways, A further important factor in this context is the fact that the
which, in principle, may manifest themselves individually or in reaction rate of a thermally activated catalytic reaction does not
concert: (i) photothermal heat generation, (ii) optical near- depend linearly on temperature. In the kinetic regime, when
field enhancement, and (iii) direct hot-charge carrier the rate is relatively low, its temperature dependence can be
generation in the metal and their injection into surface- described by the Arrhenius equation, which states that the rate
adsorbed reactant species.11−13 Ever since the hot-carrier constant is defined by k = A exp(−Ea/RT), where A is the pre-
mechanism was first proposed, one of the most important and exponential factor, Ea the molar activation energy, R the gas
critical questions has been how to distinguish it from the constant, and T temperature. As a first key aspect, this means
photothermal one. As a consequence, being able to that the reaction rate increases exponentially with temperature.
appropriately answer this question has developed into a key Consequently, in a photothermal process, provided the
effort in the field, spurred significantly by a recent controversy reaction is taking place in the kinetically limited regime, the
on data interpretation in key studies,13−18 and discussions of rate is expected to exhibit an exponential dependence on the
experimental procedures for distinguishing photothermal from illumination power.20 Therefore, the most widespread
approach to distinguish between photothermal and direct
hot-carrier reaction enhancement processes.19,20
hot-carrier mediated reaction mechanisms has been to study a
Focusing on the photothermal mechanism, we remind
reaction at increasing photon flux and investigate whether this
ourselves that upon decay of an LSPR in a metal nanoparticle,
the excited electrons will relax via electron−phonon coupling
within picoseconds, unless steered otherwise.21,22 In other Received: February 19, 2021
words, the electronic excitation is transferred into heat via Accepted: June 15, 2021
coupling to the phonon bath of the nanoparticle, which further Published: June 22, 2021
dissipates the heat to the nanoparticle surrounding and
support, and reaches thermal equilibrium on the 10−100 ps
time scale.18,21 As a consequence, temperature gradients may
© 2021 The Authors. Published by
American Chemical Society https://doi.org/10.1021/acsnano.1c01537
11535 ACS Nano 2021, 15, 11535−11542
ACS Nano www.acsnano.org Article
dependence is linear or exponentialan approach that has
been identified as problematic and to yield ambiguous
results.20 The main reason for this ambiguity is that in
corresponding studies only limited ranges of photon flux
variation have been used since actually implementing the
required several orders of magnitude difference in photon flux
would require the use of very high-power light sources and/or
the use of ultrasensitive detection techniques at very low
reaction rates.
As a second key aspect, we note that in a real system the
increase of the reaction rate cannot continue to infinity, since,
at a certain point, diffusion limitations and mass transport
gradients will start to dominate the process. This leads to a
slowing down, and eventually a complete halt, of the rate
increase, once the system is operated entirely in the mass
transport limited regime. In thermal catalysis, this behavior is
captured in a so-called light-off curve, which typically is a plot
of the reaction rate (or conversion) as a function of
temperature. As the key implication here, the photothermal
enhancement will be strongly dependent on where on the light-
off curve the catalyst finds itself during the experiment. In
other words, the same photon flux can lead to rate
enhancements that differ by several orders of magnitude,
depending on the starting temperature of the catalyst.
Consequently, for example, small fluctuations in reactor
temperature, as well as temperature gradients across a sample,
may have a dramatic impact on the (local) photothermal rate
enhancement and the balance between the three potential
plasmonic rate enhancement mechanisms when they take place
in concert. Surprisingly, however, this aspect is rarely addressed
in the debate on enhancement mechanisms in plasmon-
mediated catalysis and the corresponding discussion of
experimental strategies to efficiently distinguish between them.
In response, we report here a study that explicitly
demonstrates the importance and potential magnitude of this
effect on the example of carbon monoxide (CO) oxidation
over two-dimensional (2D) nanofabricated Pd and Pd50Au50
alloy model catalysts. We have chosen these specific systems
because they by design effectively eliminate 3D temperature Figure 1. Pd and Au50Pd50 sample characterization. (a) The alloy
gradients within the catalyst material due to their 2D nature nanoparticle array is manufactured by subsequently evaporating a
and because alloying Pd with Au constitutes an efficient way to thin Au and Pd film through a nanofabricated mask, with
alter the light-off behavior of the reaction,23,24 while, as we thicknesses tailored to yield the targeted alloy composition.
demonstrate, essentially not altering light absorption, and thus Subsequently, alloy formation is induced by annealing the sample
at 500 °C for 24h in 4% H2 in Ar carrier gas.26 (b) SEM images of
the photothermal properties of the system. annealed neat Pd (left) and Au50Pd50 alloy (right) nanodisk arrays.
(c) HAADF-STEM image of an Au50Pd50 alloy nanodisk, depicted
RESULTS AND DISCUSSION together with both an elemental line scan and a TEM-EDS map of
Sample Characterization. For our study, we have the Pd and Au constituents. The line scan confirms the
nanofabricated large-area arrays of Pd and Pd50Au50 alloy homogeneous distribution of both elements across the particle.
nanoparticles by hole-mask colloidal lithography25,26 onto 18 (d) XPS spectra of a neat Pd and an Au50Pd50 alloy nanoparticle
mm × 9 mm fused silica substrates (Figure 1a and b). The array taken before catalysis experiments for the Pd 3d (left) and
Au 4f (right) peak regions, revealing a surface composition of 46 at
resulting Pd and Pd50Au50 nanoparticles have a disk shape with % Au and 54 at % Pd for the alloy, as well as some degree of PdO
an average diameter of 113 and 132 nm and a height of 38 and and PdO2 formation (Figures S1 and S2) corroborated also by
28 nm, respectively (see Methods for details). Transmission SEM imaging (Figure S3).
electron microscopy−energy dispersive X-ray analysis (TEM-
EDX) reveals homogeneous and uniform alloy formation
across the Pd50Au50 particles (Figure 1c).26 X-ray photo- type reactor with an integrated “glass pocket”, as reported by
electron spectroscopy (XPS) furthermore reveals a surface Fredriksson et al.27,28 This pocket minimizes dilution of
composition of 46 at % Au and 54 at % Pd, which is in good reaction products and thereby enables quadrupole mass
agreement with the targeted value, and due to the surface spectrometric (QMS) analysis of reaction products from our
sensitivity of XPS, again also confirms homogeneous alloy nanofabricated 2D samples (Figure S4). The CO oxidation
formation (Figure 1d). experiments were conducted with a total gas flow rate of 200
CO Oxidation in the Dark. For the catalysis experiments, mL/min, which introduces a flow rate of 2.4 mL/min through
we have utilized an externally heated quartz-tube plug-flow- the pocket, in a gas mixture of O2 and CO in Ar carrier at a
11536 https://doi.org/10.1021/acsnano.1c01537
ACS Nano 2021, 15, 11535−11542
ACS Nano                                                         www.acsnano.org                                                                  Article

                                                  CCO                           an Au top layer to be most thermodynamically favorable,
constant relative CO concentration αCO =        CCO + CO2
                                                            = 0.2 and
                                                                                followed by a perfectly mixed Pd−Au surface. However, in
a total reactant concentration of 10%. During the experiment,                   reality a blend of configurations is likely to coexist on the alloy
the sample temperature in the dark (i.e., without illumination)                 catalyst, with local reactivity depending on the presence of Au
was increased in ∼10 °C steps from ∼150 to ∼325 °C (Figure                      and Pd atoms at the surface. Next, we calculated the
S5). Temperature control was implemented by setting a                           adsorption energies of CO and oxygen on the three chosen
constant power output of the heating system, that is, without                   surface configurations and found reduced binding energies for
using an active feedback loop. This is important since an active                the systems with Au atoms in the top layer (Table S3). Then,
feedback system would reduce the heating power supplied                         we predicted the transition state energies for CO oxidation
during illumination to compensate for the light-induced                         using the scaling relation derived by Falsig et al.,29 indicating a
heating of the sample. To ensure a constant temperature at                      reduced activation energy with increasing presence of Au
each temperature step, we instead equilibrated the system for                   atoms on the surface (Table S3).These weaker binding
150 min (Figure S5). By then extracting the CO conversion at                    energies and reduced barriers with increasing Au fraction are
the end of each temperature step, we constructed the light-off                   consistent with previous first-principles calculations of the
curves for neat Pd and the Au50Pd50 alloy system in the dark                    PdAu alloy system.30
(Figure 2). In the low temperature regime, where the reaction                      First-Principles Informed Microkinetic Modeling. To
                                                                                now investigate the impact of these different energetics on the
                                                                                expected light-off behavior of the catalyst, we modeled the
                                                                                pocket reactor used in the experiments as a continuously
                                                                                stirred tank reactor (CSTR) with residence time and
                                                                                conditions chosen to match the experimental setup (details
                                                                                in the Kinetics section of the SI and Table S4). Specifically, we
                                                                                tested the energetics obtained for each modeled surface
                                                                                configuration and estimated the unknown exact number of
                                                                                active sites in the experiment to match the experimentally
                                                                                observed maximal conversion for each system. The corre-
                                                                                spondingly obtained results for the neat Pd surface reproduce
                                                                                the measured conversion profile very well (Figure 2). For the
                                                                                alloy system, we obtained the best agreement with the
Figure 2. Pd and Au50Pd50 light-off curves in the dark. The light-off             experiment for the most thermodynamically favorable model
curves for an array of neat Pd and Au50Pd50 alloy nanoparticles                 surface (i.e., the surface with an Au top layer), which showed
were obtained using a gas flow rate of 200 mL/min in a gas                       reduced surface concentrations of reactants and correspond-
mixture of O2 and CO in Ar carrier at a constant relative CO                    ingly lower conversion. Smoother conversion profiles, lacking a
concentration αCO = 0.2 and a total reactant concentration of 10%,              sharp light-off point, were obtained for the model systems with
by increasing sample temperature in the dark in ∼10 °C steps from               Au atoms in the top surface layer due to the reduced kinetic
∼150 to ∼325 °C (see also Figure S5). The solid lines show the
                                                                                barriers in these systems. This suggests that both reduced
conversion predictions for a CSTR model (see the Kinetics section
of the SI) using the same conditions as in the experiment (Table                binding energies and reaction barriers for the alloy system,
S4), i.e., a residence time of 4.5 s and inlet pressure of 1 atm. The           consistent with gold atoms near the surface, explain the
Pd catalyst model was a Pd(111) surface and the Au50Pd50 model                  differences in the magnitude and shape of the conversion
was a mixed PdAu surface with an Au top layer (see Tables S1 and                profiles observed for the neat Pd and Au50Pd50 systems. Taken
S2). The number of active sites in each model system was chosen                 together, the first-principles calculations and kinetic modeling
to match the maximum experimentally observed conversion since                   results thus provide a qualitative rationalization for the
the exact number of sites in the experiment is unknown.                         observed conversion profiles based on the respective
                                                                                energetics. However, we also highlight that they do not
is slow enough not to be limited by mass transport, the                         explicitly describe the likely dynamic surface restructuring
reaction rate is kinetically limited. Upon further temperature                  taking place in the real catalyst (to do so a more complex
increase, the system reaches and passes through a transient                     model would be required, which is beyond the scope of this
regime, where a transition from kinetically controlled to mass                  work) and thus do not mean that a continuous Au top layer is
transport-controlled conditions takes place. This yields the                    formed. Rather, they should be interpreted as that an Au-rich
typical S-like light-off curve for both systems. However, as the                 surface is formed and the reason for the experimentally
key result we highlight that the transition to mass-transport                   observed differences between the pure Pd and the Au50Pd50
control occurs at lower temperature for the neat Pd catalyst                    light-off curves.
compared to the Pd50Au50 system and that conversion for the                        CO Oxidation under Illumination. Having established
latter is generally significantly reduced.                                       the CO oxidation reaction on our two catalyst model systems
   In a first analysis step to rationalize the differing light-off                 in the dark, we now assess their interaction with visible light.
behavior observed between Pd and Au50Pd50 in Figure 2, we                       Specifically, we carried out finite-difference time-domain
conducted first-principles informed microkinetic modeling.                       (FDTD) simulations of the absorption efficiency of a AuxPd1−x
Specifically, since the exact surface structure of the alloy used                alloy nanodisk with its composition, x, varied in steps of 10 at
in the experiment is unknown and the surface may undergo                        % from neat Pd to Au50Pd50, using dielectric functions
rearrangement in the presence of adsorbates, we studied three                   calculated from first-principles as the input (Figure 3a).31 In
simplified configurations with DFT (details in the first-                          good agreement with our previous results assessing extinction
principles and kinetics calculations section of the SI and                      efficiencies,31 increasing the Au content in the alloy shifts the
structures in Tables S1 and S2) and found a configuration with                   LSPR absorption peak to lower photon energies. Furthermore,
                                                                        11537                                         https://doi.org/10.1021/acsnano.1c01537
                                                                                                                             ACS Nano 2021, 15, 11535−11542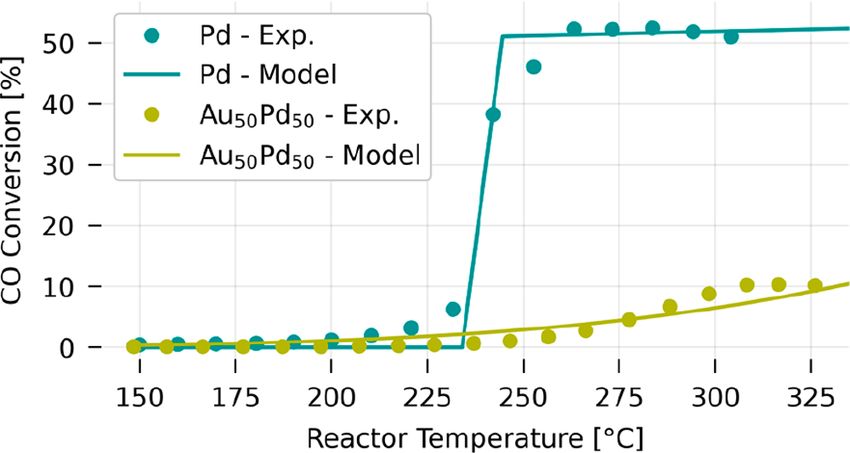
ACS Nano www.acsnano.org Article
Turning now to assessing the impact of visible light
illumination on our two model catalyst systems during
reaction, we carried out an experiment where we measured
the reaction rate of the two systems in the dark and under
illumination of a mercury xenon arc light source at constant
output irradiance of 6.8 W/cm2 for five selected temperatures
(150, 170, 190, 210, 220 °C) along the light-off curve (cf.
Figure 2). As the main result, we find a clear rate enhancement
under illumination for both catalyst systems, which strongly
depends on the catalyst temperature in the dark, with the
dependence being distinctly nonlinear and significantly lower
for the Au50Pd50 alloy (Figure 4a). Further quantification of
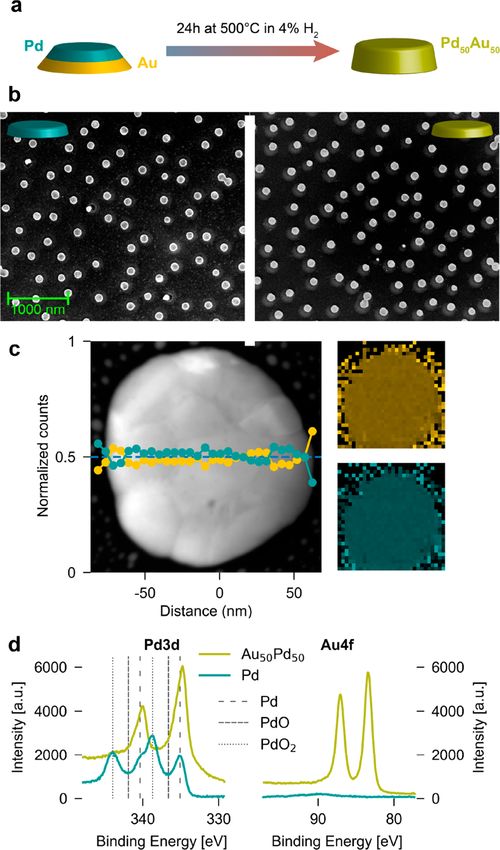
Figure 3. Light absorption efficiency in Pd and AuPd alloy
nanodisks. (a) Absorption efficiency (absorption cross-section/
nanodisk projected area) spectra for a nanodisk comprised of neat
Pd and a AuxPd100−x alloy with its composition varied in x = 10 at
% steps up to a composition of Au50Pd50. The spectra were
obtained by FDTD simulations for a single nanodisk located on a
fused silica substrate and by using the dielectric functions from the
work of Rahm et al. as input.31 The gray line plotted in the
background depicts the emission spectrum of the light source used
for the photocatalysis experiments described below and confirms
excellent overlap with the absorption spectra. (b) Corresponding
experimentally measured absorption efficiency spectra for quasi-
random arrays of neat Pd and PdAu alloy nanodisks with
composition varied in 10 at % steps up to a composition of
Au50Pd50. The experimental data are scaled to the FDTD data (for
unscaled spectra, see Figure S6). (c) Integrated absorption
efficiencies calculated from the spectra depicted in a and b for
the spectral range from 1.37 to 3.55 eV. The total absorbed energy
varies only by around 12%, which very likely results in a similar Figure 4. Light-induced reaction rate enhancement for constant
photon-induced temperature increase of the nanostructures upon irradiance at different catalyst temperatures. (a) The CO
illumination, irrespective of their composition. conversion in the dark and upon illumination for neat Pd (blue)
and Au50Pd50 (yellow) measured in a constant flow of CO and O2
C
and as the key point here, the overall appearance of the peak, in Ar carrier gas with a relative CO concentration, αCO = C +COC ,
CO O2
i.e., the full-width-at-half-maximum that is proportional to the of 0.2 and at five different dark temperatures ranging from ∼150 to
LSPR dephasing time,21,22 remains very similar throughout the ∼220 °C. (b) The enhancement of the reaction rate due to
entire composition range. Nanofabricating arrays of Pd and constant-irradiance illumination of the two model catalysts at five
AuxPd1−x alloy nanoparticles across the same compositional different temperatures in the dark. The black lines constitute error
range, and experimentally measuring their absorption bars that depict the standard deviation from three repetitions.
efficiencies (defined as absorption cross section/nanodisk Note the strong dependence of the rate enhancement on catalyst
dark temperature, and the significant difference of this effect
projected area derived from SEM image analysis) using an between neat Pd and the Au50Pd50 alloy system.
integrating sphere detector,10,32 reveals good agreement with
the simulations (Figure 3b) and further corroborates the
similar total absorption efficiencies of neat Pd and its alloys the enhancement effect, defined as
ICO2,illuminated − ICO2,dark
× 100,
with Au up to 50 at %. This last point becomes even more clear ICO2,dark
when plotting the integrated absorption efficiencies for Pd and reveals that for neat Pd at 220 °C the reaction rate is enhanced
its alloys as obtained both from the FDTD simulations and the by ∼1500% upon illumination, whereas the enhancement is
experimental data (Figure 3c). Specifically, this analysis shows only ∼50% at 150 °C (Figure 4b). For the Au50Pd50 system the
that the overall light absorption of an array of Pd and Au50Pd50 overall trend is similar, however, at 150 °C the light-induced
alloy nanoparticles is similar and, therefore, is expected to yield rate enhancement is only 3% and at 220 °C it is 110%, which is
a similar photothermal heating effect due to light absorption, more than a factor 10 lower compared to neat Pd.
while at the same time having significantly different catalytic It is now interesting to discuss these findings from a number
properties in the dark. of different perspectives. First of all, from a purely plasmonics
11538 https://doi.org/10.1021/acsnano.1c01537
ACS Nano 2021, 15, 11535−11542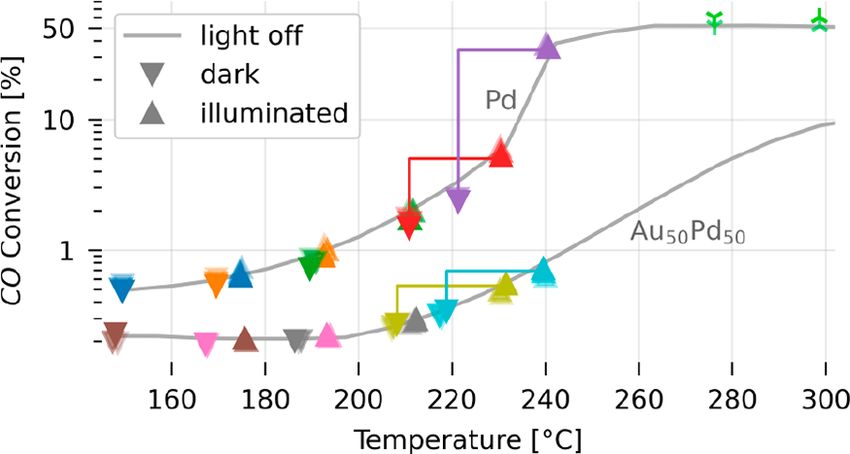
ACS Nano www.acsnano.org Article
point of view, this result may appear surprising because it is Au50Pd50 alloy is solely the consequence of its intrinsically
generally well-established that Au is a “better” plasmonic metal lower catalytic activity in the dark at the present conditions.
than Pd.22,33 Hence, one could intuitively expect that adding These observations are further corroborated by the fact that we
Au to Pd would boost the plasmon-mediated catalytic actually observe a slightly reduced light-induced sample
properties.34 Interestingly, however, we observe the opposite. temperature increase for higher reactor temperatures from
Second, as we have shown (cf. Figure 3), the integrated the thermocouple reading for both samples (from ∼26 to ∼20
absorption efficiency of the Pd and Au50Pd50 systems is very °CFigure S8), while we see that the light-induced reaction
similar, which implies that any (photothermal) enhancement rate enhancement is increased. As a final remark, we also note
effects would be similar as well. Clearly, also this scenario is in that the thermal equilibration between the catalyst nano-
stark contrast to our experimental results. particles and the support is very efficient even for the used
To nevertheless understand our findings, we first remind fused silica support and that, therefore, thermal gradients
ourselves of the light-off curves measured for both model between the particles and the support can be neglected.35
catalysts in the dark. They revealed a significantly lower
thermal rate for the Au50Pd50 alloy compared to neat Pd for CONCLUSIONS
constant temperature (cf. Figure 2). Second, we extract the CO In conclusion, we have shown that the photothermal reaction
conversion for each of the five reactor temperatures in the dark rate enhancement on nanofabricated Pd and Au50Pd50 alloy
and under illumination (Figure S7), together with the model catalysts during the catalytic oxidation of CO strongly
corresponding illumination-induced sample temperature in- depends on the catalyst temperature in the dark, and is solely
crease measured with a thermocouple that touches the side of mediated by its light-off curve. Specifically, we have found that
the sample (Figure S4b), which are on the order of 25 °C the photothermal rate enhancement for the Pd system varies
(Figure S8). Plotting the correspondingly obtained CO over 3 orders of magnitude at constant irradiance, depending
conversion for each temperature step under illumination on the position of the catalyst on the light-off curve.
(▲) and in the dark (▼) versus temperature, and in the Simultaneously, we have identified that photothermal rate
same graph as the light-off curve previously measured in the enhancements for the Au50Pd50 alloy system are significantly
dark (cf. Figure 2), we make the following key observations lower, despite very similar integrated optical absorption
(Figure 5): (i) light-induced rate enhancement is strongly efficiency and thus light-induced temperature increase. As
the reason we identified the overall lower catalytic activity of
the alloy system compared to neat Pd, and the consequently
significantly different light-off curve of the reaction in the dark.
To explain this different catalytic behavior, we conducted first-
principles informed microkinetic modeling showing that the
lower activity of Au50Pd50 is caused by reduced binding
energies of CO and oxygen, which leads to low surface
coverages of both reactants, hindering the kinetic activity
despite a corresponding reduction in the activation energy.
As the key implications of the above results, we highlight
that understanding the light-off curve of a catalyst is critical
when assessing any plasmon-mediated photocatalysis effects.
Figure 5. CO conversion in the dark and under illumination. CO Thus, as explicitly demonstrated here, a catalyst’s sensitivity
conversion for five temperature steps under illumination (▲) and toward a photothermal rate enhancement mechanism may vary
in the dark (▼) plotted versus temperature and in the same graph by multiple orders of magnitude at constant irradiance,
as the light-off curve previously measured in the dark
(calibrationcf. Figure 2). The semitransparent markers repre-
depending solely on the systems position along the light-off
sent repeated measurements. The colored lines indicate the shift of curve. Consequently, when more realistic three-dimensional
the catalyst along the light-off curve upon illumination. Also shown catalyst systems are considered, locally, the catalyst may be
are two data points obtained in the full mass transport limited operated at different positions along a light-off curve due to (i)
regime in a separate measurement under illumination ( ) and in temperature gradients across the material, (ii) attenuation of
the dark ( ), which reveal that in that limit no light-induced the photon flux within the sample, or (iii) locally varying mass
conversion enhancement is observed, as expected (see Figure S9 transport limitations within a porous support. This, in turn,
for raw data). means that locally the balance between reaction enhancement
mechanisms may be very different, further complicating
dependent on the reactor temperature; (ii) the light-induced discrimination between them. Finally, our results also highlight
enhancement is significantly smaller for the Au50Pd50 catalyst the importance of light-off characterization in plasmon-
compared to neat Pd, irrespective of reactor temperature; (iii) mediated catalysis when designing experimental strategies for
the CO conversion values measured upon illumination align discriminating rate enhancement mechanisms since the
almost perfectly with CO conversion values of the light-off photothermal channel can be dramatically suppressed or
curve measured in the dark for both catalysts, irrespective of enhanced, depending on the position along the light-off
the reactor temperature; (iv) at high temperature, in the fully curve. Therefore, it should be carefully selected and optimized
mass-transport limited regime, we do not observe any light- for each specific catalyst and reaction system.
induced rate enhancement. Altogether, this clearly shows that
it is the position along the light-off curve, determined by the METHODS
set reactor temperature, which dictates the observed photo- Nanofabrication. All samples were fabricated using hole−mask
thermal reaction rate enhancement. Furthermore, it demon- colloidal lithography36,37 on either fused silica for catalysis experi-
strates that the apparent significantly lower photoactivity of the ments and spectrophotometry, on oxidized silicon for SEM imaging,
11539 https://doi.org/10.1021/acsnano.1c01537
ACS Nano 2021, 15, 11535−11542
ACS Nano                                                          www.acsnano.org                                                                     Article

or on TEM windows38 for TEM-EDS measurements. For the                                Scanning Electron Microscopy. A Zeiss Supra 55 was used to
nanofabrication steps the following instrumentation was used: spin-               record the SEM images with the in-lens system and an acceleration
coating (Suss, LabSpin6), oxygen ion etching (Plasmatherm,                        voltage of 15 kV at a working distance of at least 5 mm.
BatchTop m/95), electron beam evaporation (Lesker, PVD 225).                         Transmission Electron Microscopy. For the STEM images and
To create the hole-mask, we used a 0.2 wt % a 140 nm sulfate latex                the elemental EDS maps a FEI Titan 80−300 equipped with an INCA
bead solution (molecular probes by life technologies) in deionized                X-sight detector (Oxford Instruments) was used. It was operated at
water. The nanodisks were annealed in a flow reactor for 24 h at 500               300 kV and lateral resolution was 5 nm for which the spectra were
°C in (4 ± 0.12) % H2 in Ar carrier gas at a flow rate of 200 mL/min               acquired. The acquisition time was 5 s for each spectrum, and the
to induce alloy formation. The annealing process leads further to a               sample holder was tilted about 20° toward the detector to increase X-
slight change in dimensions (Figure S10).                                         ray signal. The background was corrected for and the peaks fitted
    Plug-Flow Reactor with “Pocket”. The (photo)catalysis experi-                 standard-less using the FEI TIA software version 4.3.
ments were carried out in a plug-flow type reactor (X1, Insplorion AB,                First-Principles Calculations. Periodic density functional theory
Göteborg, Sweden) equipped with a custom-made pocket reactor as                  calculations were used to find relaxed geometries and energies for
reported by Fredriksson et al. (Figure S4).27,28 Gas composition in               Pd(111) and three PdAu alloy surfaces. Calculations were performed
and flow rate through the reactor is controlled by mass flow                        on 2 × 2 × 3 unit cells using VASP,41,42 with the revised PBE43
controllers (Bronkhorst Low-ΔP). The reactor is heated by a resistive             generalized gradient approximation and projector augmented wave
heating coil and connected to a quadrupole mass spectrometer                      method.44 An energy cutoff of 450 eV was used for the plane wave
(Pfeiffer, GSD 320). Two type-K thermocouples are inserted in the                  basis set. The three PdAu surfaces comprised a perfect mix of Pd and
reactor to monitor (i) the temperature of the gas upstream of the                 Au atoms on the lower layers with (i) a perfectly mixed top layer, (ii)
pocket and (ii) the actual temperature of the sample. The latter                  an Au top layer and Pd second layer, and (iii) a Pd top layer and Au
thermocouple is spring-loaded to ensure good contact with the side of             second layer. Binding energies were calculated for CO and O on each
the sample inside the pocket. The thermocouple is placed in the light             surface and the gas molecules were relaxed in a 10 × 10 × 10 Å3 box.
path and therefore experiences a constant temperature increase upon               More information is given in the first-principles and kinetics
illumination, which, however, is on the order of 1 °C or less (Figure             calculations section of the SI, with structures in Tables S1 and S2,
                                                                                  and energies in Figure S13 and Table S3.
S11) and the same for all experiments and catalysts. Furthermore, this
                                                                                     Microkinetic Model. Modeled surface kinetics included CO
heating of the thermocouple does not impact the temperature control
                                                                                  adsorption, O2 dissociative adsorption, and irreversible CO oxidation
of the reactor since the temperature reading is not used in a feed-back
                                                                                  to form CO2. CO2 desorption was assumed to be instantaneous and
loop manner. The reactor has an optical port perpendicular to the
                                                                                  irreversible. CO and O2 desorption were assumed to be in
flow direction to enable illumination by a 1000 W mercury xenon arc
                                                                                  thermodynamic equilibrium with the respective adsorption steps.
light source (Newport 6295NS in a 66921 housing), which is                        The binding energies from the DFT calculations were used as the
equipped with a liquid optical IR filter (Newport 6123NS).                         reaction energies for adsorption and to predict the activation energies
    Before the photocatalysis experiments, the samples were activated             for CO oxidation on each surface using the scaling relation developed
by a treatment of 60 min 6% O2, followed by 30 min 3% H2, and                     by Falsig and co-workers29 (Table S3). CO oxidation was modeled as
finally 60 min 6% O2 in Ar carrier gas with a constant flow of 200 mL/              a Langmuir−Hinshelwood reaction, with a prefactor from transition
min at 500 °C. The activation was followed by a cooling period of 5h              state theory. The free energies were computed in the harmonic limit
to 150 °C in Ar. Then, 1.5 h prior to the first temperature step or                for adsorbates and the ideal gas approximation for gases. The pocket
temperature ramp, CO and O2 were introduced simultaneously.                       reactor was modeled as a continuously stirred tank reactor with
    The used gases were CO (10% (±2 rel %) in Ar), O2 (99.9992%                   surface-based kinetics. The system of differential equations describing
purity), H2 (4% (±2 rel %) in Ar), and Ar (99.9999% purity) as the                the surface kinetics and flow was solved in Python using the SciPy
carrier gas.                                                                      LSODA integrator45 and the BDF method, with relative and absolute
    FDTD Simulations. Lumericals FDTD solution version 8.21.2088                  tolerances of 1 × 10⁻⁸ and 1 × 10⁻¹⁰, respectively. More details and a
was utilized to calculate the optical absorption spectra presented in             discussion of model choices are provided in the Kinetics section of the
Figure 3. A single disk was placed on a SiO2 support with a refractive            SI, Table S4, and Figures S14 and S15.
index of 1.46.39 The dielectric function for Pd and the AuxPd100−x
alloys with x = 10, 12, 30, 40, 50 were taken from Rahm et al.31 The              ASSOCIATED CONTENT
disk diameter (Figure S10) used in the simulations was derived from
SEM images by analyzing at least 350 particles from different sample               *
                                                                                  sı Supporting Information

positions and averaging their individual diameters. The particle itself           The Supporting Information is available free of charge at
was modeled as a tapered cylinder (angle of 5°) with rounded edges                https://pubs.acs.org/doi/10.1021/acsnano.1c01537.
(4 nm bottom and 6 nm top rounding). The used disk height was                           XPS spectrum of Pd 3d of Pd and Au50Pd50, XPS
calculated by assuming the conservation of volume from the
                                                                                        spectrum of Pd 3d and Au 4f prior CO oxidation, SEM
unannealed to the annealed particle (Figure S10). The linearly
polarized plane wave light source was introduced via a total-field/                      images of the samples, schematic of the experimental
scattered field source.                                                                  setup, raw data of light-off curves, absorption efficiency
    X-ray Photoelectron Spectroscopy. XPS measurements were                             spectra and integrated absorption efficiency for different
performed with a PHI 5000 (Physical Electronics). The photo-                            alloy compositions, CO2 ion current in the dark and
excitation was done with a monochromatized Kα-line of an Al source                      under illumination, temperature difference in the dark
operated at 50 W. The energy step width was 0.1 eV, and the pass                        and under illumination of the sample at different
energy was 55 eV. The base pressure was always lower than 2.0 ×                         temperature steps, CO2 ion current in the dark and
10−6 Pa. All spectra were corrected by setting the adventitious C-1s                    under illumination in the mass transport limited regime,
peak of the C−C bond to 284.8 eV. To ensure that this correction is                     mean diameter and height of samples after annealing,
physically meaningful, the Fermi level alignment was checked as                         temperature increase upon illumination, transmission
suggested by Greczynski and Hultman.40 For quantitative analysis
                                                                                        spectrum of empty glass pocket and intensity profile of
relative sensitivity factors from PHI MultiPak’s database for Au and
Pd of 417.021 and 341.244, respectively, were employed.
                                                                                        lamp, explanation of first-principle calculations, side view
    Spectrophotometry. The optical absorption spectra were                              of relaxed CO and O adsorbates for different surface
obtained with a Cary 5000 spectrophotometer (Varian) equipped                           configurations, top view of relaxed CO and O adsorbates
with a DRA2500 integrating sphere accessory. The spectra were                           for different surface configurations, binding energies of
recorded from 250 to 2500 nm with a step width of 1 nm.                                 CO and O calculated by DFT, electronic and free
                                                                          11540                                           https://doi.org/10.1021/acsnano.1c01537
                                                                                                                                 ACS Nano 2021, 15, 11535−11542
ACS Nano www.acsnano.org Article
energies calculated by DFT, explanation of considered (8) Nitzan, A.; Brus, L. E. Theoretical-Model for Enhanced
CO oxidation kinetics, predicted conversion for different Photochemistry on Rough Surfaces. J. Chem. Phys. 1981, 75, 2205−
model systems, steady-state surface coverage as a 2214.
function of temperature for different model systems (9) Brus, L. Noble Metal Nanocrystals: Plasmon Electron Transfer
Photochemistry and Single-Molecule Raman Spectroscopy. Acc.
(PDF) Chem. Res. 2008, 41, 1742−1749.
(10) Langhammer, C.; Kasemo, B.; Zoric, I. Absorption and
AUTHOR INFORMATION Scattering of Light by Pt, Pd, Ag, and Au Nanodisks: Absolute Cross
Corresponding Author Sections and Branching Ratios. J. Chem. Phys. 2007, 126, 194702.
(11) Baffou, G.; Quidant, R. Nanoplasmonics for Chemistry. Chem.
Christoph Langhammer − Department of Physics, Chalmers
Soc. Rev. 2014, 43, 3898−3907.
University of Technology, 412 96 Göteborg, Sweden; (12) Seemala, B.; Therrien, A. J.; Lou, M.; Li, K.; Finzel, J. P.; Qi, J.;
orcid.org/0000-0003-2180-1379; Email: clangham@ Nordlander, P.; Christopher, P. Plasmon-Mediated Catalytic O2
chalmers.se Dissociation on Ag Nanostructures: Hot Electrons or near Fields?
ACS Energy Letters 2019, 4, 1803−1809.
Authors (13) Dubi, Y.; Sivan, Y. Hot″ Electrons in Metallic Nanostructures-
Christopher Tiburski − Department of Physics, Chalmers Non-Thermal Carriers or Heating? Light: Sci. Appl. 2019, 8, 89.
University of Technology, 412 96 Göteborg, Sweden (14) Dubi, Y.; Un, I. W.; Sivan, Y. Thermal Effects − An Alternative
Astrid Boje − Department of Physics, Chalmers University of Mechanism for Plasmon-Assisted Photocatalysis. Chemical Science
Technology, 412 96 Göteborg, Sweden; orcid.org/0000- 2020, 11, 5017−5027.
0002-2487-0276 (15) Sivan, Y.; Baraban, J.; Un, I. W.; Dubi, Y. Comment on
Sara Nilsson − Department of Physics, Chalmers University of ″Quantifying Hot Carrier and Thermal Contributions in Plasmonic
Technology, 412 96 Göteborg, Sweden Photocatalysis″. Science 2019, 364, eaaw9367.
Zafer Say − Department of Physics, Chalmers University of (16) Jain, P. K. Comment on “Thermal Effects − An Alternative
Technology, 412 96 Göteborg, Sweden Mechanism for Plasmon-Assisted Photocatalysis” by Y. Dubi, I. W. Un
and Y. Sivan, Chemical Science, 2020, 11, 5017. Chemical Science
Joachim Fritzsche − Department of Physics, Chalmers 2020, 11, 9022−9023.
University of Technology, 412 96 Göteborg, Sweden (17) Dubi, Y.; Un, I. W.; Sivan, Y. Reply to the ‘Comment on
Henrik Ström − Department of Mechanics and Maritime “Thermal Effects−An Alternative Mechanism for Plasmon-Assisted
Sciences, Chalmers University of Technology, 412 96 Photocatalysis”’ by P. Jain, Chemical Science, 2020, 11, DOI:
Göteborg, Sweden; orcid.org/0000-0002-8581-5174 10.1039/D0SC02914A. Chem. Sci. 2020, 11, 9024−9025.
Anders Hellman − Department of Physics, Chalmers (18) Jain, P. K. Taking the Heat Off of Plasmonic Chemistry. J. Phys.
University of Technology, 412 96 Göteborg, Sweden; Chem. C 2019, 123, 24347−24351.
orcid.org/0000-0002-1821-159X (19) Sivan, Y.; Baraban, J. H.; Dubi, Y. Experimental Practices
Required to Isolate Thermal Effects in Plasmonic Photo-Catalysis:
Complete contact information is available at: Lessons from Recent Experiments. OSA Continuum 2020, 3, 483−
https://pubs.acs.org/10.1021/acsnano.1c01537 497.
(20) Baffou, G.; Bordacchini, I.; Baldi, A.; Quidant, R. Simple
Notes Experimental Procedures to Distinguish Photothermal from Hot-
The authors declare no competing financial interest. Carrier Processes in Plasmonics. Light: Sci. Appl. 2020, 9, 108.
(21) Bauer, M.; Marienfeld, A.; Aeschlimann, M. Hot Electron
ACKNOWLEDGMENTS Lifetimes in Metals Probed by Time-Resolved Two-Photon Photo-
emission. Prog. Surf. Sci. 2015, 90, 319−376.
This work was funded by the Knut and Alice Wallenberg
(22) Zoric, I.; Zäch, M.; Kasemo, B.; Langhammer, C. Gold,
Foundation projects 2016.0210 and 2015.0055. Part of this Platinum, and Aluminum Nanodisk Plasmons: Material Independ-
work was carried out at the MC2 cleanroom facility and at the ence, Subradiance, and Damping Mechanisms. ACS Nano 2011, 5,
Chalmers Materials Analysis Laboratory (CMAL). 2535−2546.
(23) Venezia, A. M.; Liotta, L. F.; Pantaleo, G.; La Parola, V.;
REFERENCES Deganello, G.; Beck, A.; Koppany, Z.; Frey, K.; Horvath, D.; Guczi, L.
(1) Christopher, P.; Xin, H.; Linic, S. Visible-Light-Enhanced Activity of SiO2 Supported Gold-Palladium Catalysts in CO
Catalytic Oxidation Reactions on Plasmonic Silver Nanostructures. Oxidation. Appl. Catal., A 2003, 251, 359−368.
Nat. Chem. 2011, 3, 467−472. (24) Gao, F.; Goodman, D. W. Pd−Au Bimetallic Catalysts:
(2) Linic, S.; Aslam, U.; Boerigter, C.; Morabito, M. Photochemical Understanding Alloy Effects from Planar Models and (Supported)
Transformations on Plasmonic Metal Nanoparticles. Nat. Mater. Nanoparticles. Chem. Soc. Rev. 2012, 41, 8009−8020.
2015, 14, 567−576. (25) Fredriksson, H.; Alaverdyan, Y.; Dmitriev, A.; Langhammer, C.;
(3) Mukherjee, S.; Libisch, F.; Large, N.; Neumann, O.; Brown, L. Sutherland, D. S.; Zaech, M.; Kasemo, B. Hole-Mask Colloidal
V.; Cheng, J.; Lassiter, J. B.; Carter, E. A.; Nordlander, P.; Halas, N. J. Lithography. Adv. Mater. 2007, 19, 4297−4302.
Hot Electrons Do the Impossible: Plasmon-Induced Dissociation of (26) Nugroho, F. A. A.; Iandolo, B.; Wagner, J. B.; Langhammer, C.
H2 on Au. Nano Lett. 2013, 13, 240−247. Bottom-Up Nanofabrication of Supported Noble Metal Alloy
(4) Hou, W.; Cronin, S. B. A Review of Surface Plasmon Resonance- Nanoparticle Arrays for Plasmonics. ACS Nano 2016, 10, 2871−2879.
Enhanced Photocatalysis. Adv. Funct. Mater. 2013, 23, 1612−1619. (27) Fredriksson, H. O. A.; Larsson Langhammer, E. M.;
(5) Kale, M. J.; Avanesian, T.; Christopher, P. Direct Photocatalysis Niemantsverdriet, J. W. Reduction of Cu-Promoted Fe Model
by Plasmonic Nanostructures. ACS Catal. 2014, 4, 116−128. Catalysts Studied by in Situ Indirect Nanoplasmonic Sensing and X-
(6) Smith, J. G.; Faucheaux, J. A.; Jain, P. K. Plasmon Resonances for Ray Photoelectron Spectroscopy. J. Phys. Chem. C 2015, 119, 4085−
Solar Energy Harvesting: A Mechanistic Outlook. Nano Today 2015, 4094.
10, 67−80. (28) Bu, Y.; Niemantsverdriet, J. W. H.; Fredriksson, H. O. A. Cu
(7) Tian, Y.; Tatsuma, T. Plasmon-Induced Photoelectrochemistry Model Catalyst Dynamics and CO Oxidation Kinetics Studied by
at Metal Nanoparticles Supported on Nanoporous TiO2. Chem. Simultaneous in Situ UV−Vis and Mass Spectroscopy. ACS Catal.
Commun. 2004, 1810−1811. 2016, 6, 2867−2876.
11541 https://doi.org/10.1021/acsnano.1c01537
ACS Nano 2021, 15, 11535−11542ACS Nano www.acsnano.org Article
(29) Falsig, H.; Hvolbaek, B.; Kristensen, I. S.; Jiang, T.; Bligaard, T.;
Christensen, C. H.; Norskov, J. K. Trends in the Catalytic CO
Oxidation Activity of Nanoparticles. Angew. Chem., Int. Ed. 2008, 47,
4835−4839.
(30) Zhang, J.; Jin, H.; Sullivan, M. B.; Lim, F. C.; Wu, P. Study of
Pd-Au Bimetallic Catalysts for CO Oxidation Reaction by DFT
Calculations. Phys. Chem. Chem. Phys. 2009, 11, 1441−1446.
(31) Rahm, J. M.; Tiburski, C.; Rossi, T. P.; Nugroho, F. A. A.;
Nilsson, S.; Langhammer, C.; Erhart, P. A Library of Late Transition
Metal Alloy Dielectric Functions for Nanophotonic Applications. Adv.
Funct. Mater. 2020, 30, 2002122.
(32) Langhammer, C.; Schwind, M.; Kasemo, B.; Zorić, I. Localized
Surface Plasmon Resonances in Aluminum Nanodisks. Nano Lett.
2008, 8, 1461−1471.
(33) Langhammer, C.; Yuan, Z.; Zoric, I.; Kasemo, B. Plasmonic
Properties of Supported Pt and Pd Nanostructures. Nano Lett. 2006,
6, 833−838.
(34) Sytwu, K.; Vadai, M.; Dionne, J. A. Bimetallic Nanostructures:
Combining Plasmonic and Catalytic Metals for Photocatalysis.
Advances in Physics: X 2019, 4, 1619480.
(35) Zhdanov, V. P.; Zorić, I.; Kasemo, B. Plasmonics: Heat
Transfer between Metal Nanoparticles and Supporting Nanolayers.
Phys. E 2012, 46, 113−118.
(36) Fredriksson, H.; Alaverdyan, Y.; Dmitriev, A.; Langhammer, C.;
Sutherland, D. S.; Zaech, M.; Kasemo, B. Hole-Mask Colloidal
Lithography. Adv. Mater. 2007, 19, 4297−4302.
(37) Nugroho, F. A. A.; Iandolo, B.; Wagner, J. B.; Langhammer, C.
Bottom-Up Nanofabrication of Supported Noble Metal Alloy
Nanoparticle Arrays for Plasmonics. ACS Nano 2016, 10, 2871−2879.
(38) Grant, A. W.; Hu, Q. H.; Kasemo, B. Transmission Electron
Microscopy ’Windows’ for Nanofabricated Structures. Nanotechnology
2004, 15, 1175−1181.
(39) Palik, E. D. Handbook of Optical Constants of Solids; Academic
press: Orlando, 1998; Vol. 3.
(40) Greczynski, G.; Hultman, L. X-Ray Photoelectron Spectrosco-
py: Towards Reliable Binding Energy Referencing. Prog. Mater. Sci.
2020, 107, 100591.
(41) Kresse, G.; Hafner, J. ab initio Molecular Dynamics for Open-
Shell Transition Metals. Phys. Rev. B: Condens. Matter Mater. Phys.
1993, 48, 13115−13118.
(42) Kresse, G.; Furthmuller, J. Efficiency of ab-Initio Total Energy
Calculations for Metals and Semiconductors Using a Plane-Wave
Basis Set. Comput. Mater. Sci. 1996, 6, 15−50.
(43) Hammer, B.; Hansen, L. B.; Norskov, J. K. Improved
Adsorption Energetics within Density-Functional Theory Using
Revised Perdew-Burke-Ernzerhof Functionals. Phys. Rev. B: Condens.
Matter Mater. Phys. 1999, 59, 7413−7421.
(44) Blochl, P. E. Projector Augmented-Wave Method. Phys. Rev. B:
Condens. Matter Mater. Phys. 1994, 50, 17953−17979.
(45) Petzold, L. Automatic Selection of Methods for Solving Stiff
and Nonstiff Systems of Ordinary Differential-Equations. Siam Journal
on Scientific and Statistical Computing 1983, 4, 136−148.
11542 https://doi.org/10.1021/acsnano.1c01537
ACS Nano 2021, 15, 11535−11542You can also read