Measuring the Flex Life of Conductive Yarns in Narrow Fabric
←
→
Page content transcription
If your browser does not render page correctly, please read the page content below
micromachines

Article
Measuring the Flex Life of Conductive Yarns in Narrow Fabric
Paula Veske * , Frederick Bossuyt, Filip Thielemans and Jan Vanfleteren

                                         Centre for Microsystems Technology (CMST), Interuniversity Microelectronics Centre (IMEC), Ghent University,
                                         9000 Ghent, Belgium
                                         * Correspondence: paula.veske@ugent.be

                                         Abstract: Due to constant advancements in materials research, conductive textile-based materials
                                         have been used increasingly in textile-based wearables. However, due to the rigidity of electronics or
                                         the need for their encapsulation, conductive textile materials, such as conductive yarns, tend to break
                                         faster around transition areas than other parts of e-textile systems. Thus, the current work aims to
                                         find the limits of two conductive yarns woven into a narrow fabric at the electronics encapsulation
                                         transition point. The tests consisted of repeated bending and mechanical stress, and were conducted
                                         using a testing machine built from off-the-shelf components. The electronics were encapsulated with
                                         an injection-moulded potting compound. In addition to identifying the most reliable conductive yarn
                                         and soft–rigid transition materials, the results examined the failure process during the bending tests,
                                         including continuous electrical measurements.

                                         Keywords: wearables; e-textiles; electronics; testing; reliability

                                         1. Introduction
                                               Electronic textiles (e-textiles) have gained increasing traction since the late 20th cen-
                                         tury [1–4]. Mann (1996) [3] discussed the advantages of his wearable computer in 1996 and
Citation: Veske, P.; Bossuyt, F.;
                                         Farringdon et al. (1999) [1] developed a wearable sensor jacket using advanced knitting
Thielemans, F.; Vanfleteren, J.
                                         techniques to form fabric stretch sensors and measure upper limb and body movement.
Measuring the Flex Life of
                                         Conductive yarns are an essential part of e-textile applications [5,6]. Nevertheless, integrated
Conductive Yarns in Narrow Fabric.       electronics often create high-stress areas at the electronics encapsulation–textiles transition
Micromachines 2023, 14, 781.             points [7–9]. For example, de Vries and Cherenack (2014) [7] used conductive yarns (Elek-
https://doi.org/10.3390/                 trisola litze wires) woven into polyester fabric to connect LEDs that were mounted to the
mi14040781                               yarns with isotropic conducting adhesive. The sample underwent cyclic bending, and
                                         the authors concluded that the transition area between the LEDs’ connection to the yarns
Academic Editors: Yang Wei,
                                         (soft–rigid transition area, see more in Figure 1a) was the clear location of failure.
Theodore Hughes-Riley and Stephen
                                               Thus, measuring conductive yarns’ or textiles’ abilities to withstand repeated bending
P. Morgan
                                         is essential. Contrary to domestic washing tests, bending tests help to identify the exact
Received: 27 February 2023               moment(s) at which conductive yarns break, thus helping to compare their durability more
Revised: 24 March 2023                   accurately and under uniform conditions. In this study, the final application for this type of
Accepted: 29 March 2023                  e-textile system is technical and functional work wear worn in extreme conditions. The
Published: 30 March 2023                 conditions include high-temperature stress and elevated humidity levels. Thus, durability,
                                         reliability and electrical stability are highly important and essential.
                                               This work presents two different conductive yarns woven into polyester-based nar-
Copyright: © 2023 by the authors.
                                         row fabric and a bending testing method together with a self-assembled tester machine
Licensee MDPI, Basel, Switzerland.
                                         constructed from off-the-shelf components. The conductive yarns (commercially available,
This article is an open access article   from Bekaert) were woven into narrow fabric in six rows with a pitch of 1.27 mm to create
distributed under the terms and          a bus system for I2 C communication. A non-functional PCB (printed circuit board) was
conditions of the Creative Commons       encapsulated with potting material on the narrow fabric, creating rigid–soft (encapsulation–
Attribution (CC BY) license (https://    textile) transition areas and accumulated stress for the conductive yarns (Figure 1a). Several
creativecommons.org/licenses/by/         material stacks around the rigid–soft transition area were also designed and developed to
4.0/).                                   reach the highest durability for e-textile systems.

Micromachines 2023, 14, 781. https://doi.org/10.3390/mi14040781                                     https://www.mdpi.com/journal/micromachines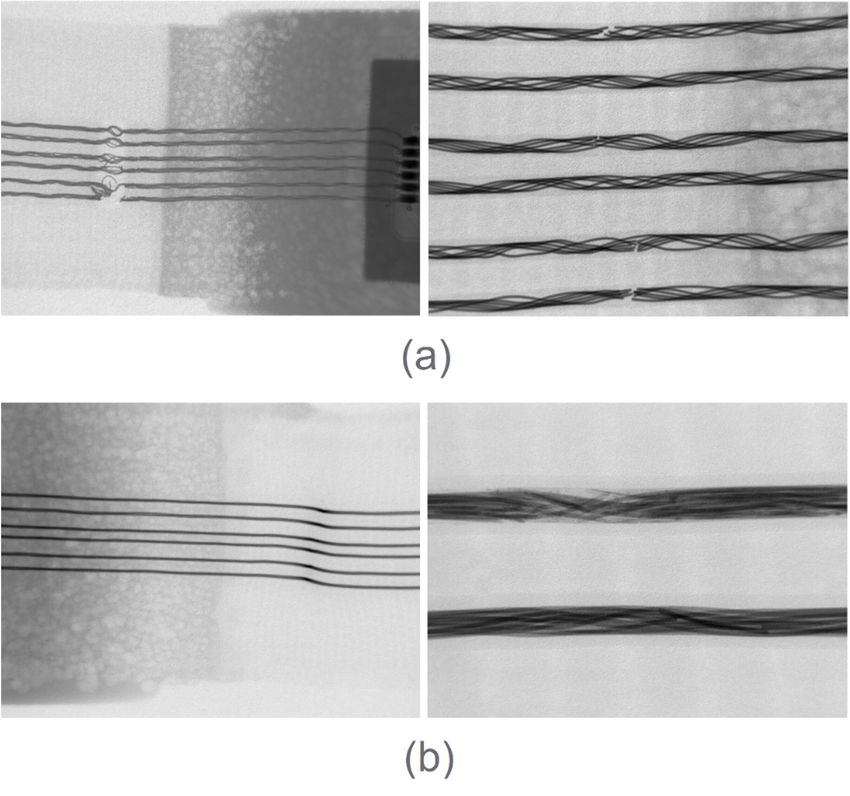
2.    How the encapsulation material and its transition would influence the yarns;
                              3.    If and how additional transition materials could help the durability of the system.
                                   The results included an analysis of the continuous electrical measurements through
                              the conductive yarns during the tests. A comparison of the durability results was per-
                              formed mainly between yarn compositions, filament types, encapsulation and soft–rigid
Micromachines 2023, 14, 781                                                                                     2 of 11
                              transition areas. Moreover, the effects of the encapsulation material’s design and pro-
                              cessing, together with additional transition material stacks, are discussed.

                               Figure1.1. (a)
                              Figure       (a) Sample
                                               Sample with
                                                      with encapsulation;
                                                           encapsulation;red
                                                                           redmarkings
                                                                              markingshighlight
                                                                                        highlightthe
                                                                                                  thesoft–rigid
                                                                                                      soft–rigidtransition/high-stress
                                                                                                                 transition/high-stress
                               areas.(b)
                              areas.  (b)Sample
                                            Samplewith
                                                   withadditional
                                                         additionaltransition
                                                                    transitionmaterial.
                                                                              material.

                                    The mainand
                               2. Materials   goals of this work were to identify:
                                                Methods
                              1.    How   and whenwere
                                    The materials   the two  conductive
                                                         divided         yarns
                                                                  into two       would break
                                                                           categories:         during
                                                                                         testing      repeated
                                                                                                 samples       bending
                                                                                                         and testing   stress;
                                                                                                                     machine.
                              2.The methods
                                    How the explain
                                             encapsulation   material
                                                      the testing      andinitsmore
                                                                  process       transition
                                                                                     detail.would influence the yarns;
                              3.    If and how additional transition materials could help the durability of the system.
                                   The results included an analysis of the continuous electrical measurements through the
                              conductive yarns during the tests. A comparison of the durability results was performed
                              mainly between yarn compositions, filament types, encapsulation and soft–rigid transition
                              areas. Moreover, the effects of the encapsulation material’s design and processing, together
                              with additional transition material stacks, are discussed.

                              2. Materials and Methods
                                  The materials were divided into two categories: testing samples and testing machine.
                              The methods explain the testing process in more detail.

                              2.1. Samples
                                  The testing samples were based on a white narrow fabric into which conductive yarns
                              were woven. The narrow fabric’s total width was 30 mm. The yarns integrated into the
                              narrow fabric were commercially supplied by Bekaert and their listed application areas
Micromachines 2023, 14, 781                                                                                                   3 of 11

                                     included data and energy transfer, and use in antennas, sensors or other purposes. The
                                     yarns were integrated into the narrow fabric in 6 rows with a pitch of 1.27 mm to create
                                     a communication bus for the I2 C (Inter-Integrated Circuit) communication protocol. Two
                                     different yarns were tested during this work, as shown in Table 1. Elongation and tensile
                                     strength information were taken from the supplier’s datasheets.

                                     Table 1. Overview of conductive yarns used in tests.

                 Characteristic                                        Yarn 1                                 Yarn 2
               Yarn construction                         6 twisted filaments with PE core              14 twisted filaments
               Filament diameter                                     0.075 mm                               0.063 mm
              Conductive material                       Ni-plated Cu (Nickel-plated copper)            Cu-plated steel yarn
                                                          PTFE (Polytetrafluoroethylene);
        Coating material and thickness                                                                    PTFE; 0.16 mm
                                                                      0.12 mm
                Outer diameter                                        0.60 mm                                0.68 mm
              Tensile strength (N)                                       100                                    >27
                Elongation (%)                                           3.02                                 0.5–1.5
              Average resistance                                    0.8 ohm/m                              0.99 ohm/m

                                           A CO2 laser was used to create an opening in the yarn for an electrical connection
                                     with electronics. A rigid PCB (printed circuit board) was glued onto the narrow fabric and
                                     connected to the conductive yarns by soldering.
                                           The integrated electronics were encapsulated with a polyurethane-based flexible
                                     potting compound (Peters ELPECAST® VU 4443/92 WR-NV) via the low-pressure injection-
                                     moulding process. The potting material was mixed together from two parts. The mixed
                                     material was then degassed in a vacuum chamber and injected into the PTFE mould. After
                                     injection, the material was cured at 100 degrees for 4 h. The encapsulation was designed to
                                     have a smooth transition from thick to thin. The PTFE mould was structured in a way that,
                                     at the electronics’ position, the potting material was 8 mm thick and at the transition point
                                     from the potting material to the textile, the thickness was 1.5 mm. The different thicknesses
                                     were smoothly brought together with a slope—see more in Figures 1a and 2b. However, the
                                     difference in the encapsulation material and textile flexibility properties created transition
                                     points with higher mechanical stress. The encapsulated sample and highlighted stress areas
                                     are shown in Figure 1a.
                                           The integrated conductive yarns in the white narrow fabric and the encapsulation tran-
                                     sition area were tested and with additional transition material by wrapping it around the
                                     narrow fabric (see Figure 1b). The material was TPU (thermoplastic polyurethane—Bemis
                                     3914, 100 µm) laminated knit fabric (68% microfibre polyamide and 32% elastane). The lami-
                                     nated fabric was wrapped around the narrow fabric and laminated before encapsulating the
                                     electronics with potting compound. The fabric did not cover any interconnection points, such
                                     as the solder contact points, as they were all encapsulated by the black potting compound.
                                           A complete overview of the sample set-ups is provided in Table 2. The first sample
                                     set included narrow fabric with integrated Yarn 1 (Table 1), together with electronics and
                                     their potting encapsulation. There was no additional transition material added. Sample set
                                     2 was the same, but Yarn 2 (Table 1) was integrated into the narrow fabric instead of Yarn 1.
                                     Sample sets 3 and 4 corresponded to sample sets 1 and 2, but there was additional transition
                                     material (mentioned in the previous paragraph) added to the potting encapsulation edges.
                                           The conductive yarn endings on each side were stripped from the PTFE (polyte-
                                     trafluoroethylene) cover to form the connection to the read-out system through ADC
                                     (analogue-to-digital converter). On one side, the conductive yarn endings were coupled
                                     and soldered to create 3 loops (Figure 2d top side). On the other side, the conductive yarn
                                     endings were soldered on an interposer PCB with female pins (Figure 2c,d). The female
                                     pins led to the ADC board and further on to the Arduino Uno connection. One end of the
                                     yarn loop was soldered to the power connection and the other end to the signal connections.
                                     See more about the testing method and the read-out system in Section 2.3.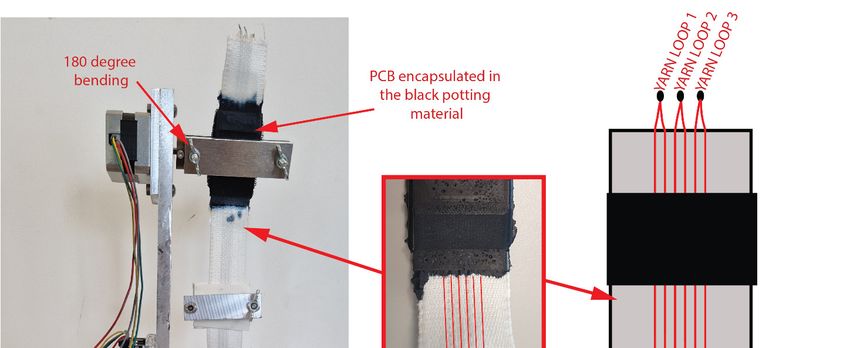
1a, 1b, 1c, 1d Yarn 1 Polyurethane-based potting compound -
2a, 2b, 2c, 2d Yarn 2 Polyurethane-based potting compound -
Laminated knit fabric wrapped
3a, 3b, 3c, 3d Yarn 1 Polyurethane-based potting compound
around narrow fabric
Micromachines 2023, 14, 781 Laminated knit fabric wrapped
4 of 11
4a, 4b, 4c, 4d Yarn 2 Polyurethane-based potting compound
around narrow fabric
Figure 2.
Figure Testing set-up
2. Testing set-up with
with the
the motor
motoratatthe
thetop
topleft
leftside
sideand
andwhere
where thethe
180-degree
180-degree rotation alsoalso
rotation
takes place. (a) Machine set-up highlighting where the 180-degree bending takes
takes place. (a) Machine set-up highlighting where the 180-degree bending takes place, where the place, where the PCB
PCB is placed
is placed onwoven
on the the wovenribbon ribbon andencapsulated
and then then encapsulated in thepotting
in the black black potting compound,
compound, the soft–
the soft–rigid
rigid transition
transition area
area and theand the connection
connection between between
the ADC andthe ADC
sample. and
(b)sample.
Close-up(b) Close-up
photo photo of the
of the soft–rigid
soft–rigid transition
transition area (from thearea (fromcompound
potting the pottingto compound
the white narrowto thefabric)
whitealso
narrow fabric) the
highlighting alsoconductive
highlighting
the conductive
yarns woven into yarns wovennarrow
the white into the white
fabric (innarrow
red). (c)fabric
Close-up(in red).
photo(c)of Close-up photobetween
the connection of the connec-
the
tion
ADCbetween
and thethe ADC (d)
sample. andTechnical
the sample. (d) Technical
drawing drawing
of the sample of the
set-up for sample set-up
the bending forlight-grey
test: the bending
test:
part light-grey part represents
represents narrow fabric, rednarrow fabric, red
lines represent lines represent
conductive yarns wovenconductive
into theyarns
ribbon, woven
black into
part the
ribbon,
represents the encapsulation/potting and green parts represent the ADC connection to the ribbon.connec-
black part represents the encapsulation/potting and green parts represent the ADC
tion to the ribbon.
Table 2. Sample sets’ set-up.
Sample Nrs in Set Yarn Encapsulation Material Additional Transition Material(s)
1a, 1b, 1c, 1d Yarn 1 Polyurethane-based potting compound -
2a, 2b, 2c, 2d Yarn 2 Polyurethane-based potting compound -
Laminated knit fabric wrapped around
3a, 3b, 3c, 3d Yarn 1 Polyurethane-based potting compound
narrow fabric
Laminated knit fabric wrapped around
4a, 4b, 4c, 4d Yarn 2 Polyurethane-based potting compound
narrow fabric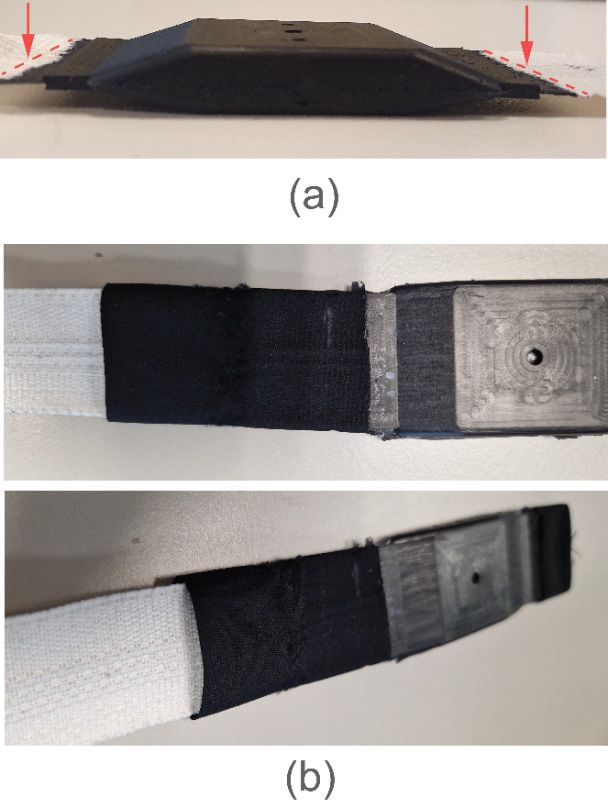
Micromachines 2023, 14, 781                                                                                           5 of 11

                              2.2. Machine
                                   The tester was developed using off-the-shelf components and a specially milled frame
                              (Figure 2). The fixed part of the machine consisted of:
                              •   A stepper motor Nema 17;
                              •   An Arduino UNO microcontroller together with a Motorshield V2 board;
                              •   An Adafruit ADC1115 (analogue-to-digital converter) together with male 90-degree
                                  pins;
                              •   The stepper motor was attached to the top and connected to the Arduino UNO/Motorshield
                                  V2 board.
                                  The connections between the Motorshield and Arduino board did not allow the
                              connection of the sample to the microcontroller. Thus, the ADC board was connected in
                              between to read out the data. The male pins on the ADC board allowed the easy connection
                              and disconnection of the sample to the machine.

                              2.3. Testing Method
                                    A sample with a weighted clamp (100 g) was attached from the (black) encapsulated
                              part to the motor and flexed 180 degrees. As the yarns were coupled together, one ending
                              of the loop received power input and the other end was used to read the output. During
                              the test, the samples were flexed 180 degrees for 100,000 cycles or until the voltage of at
                              least two yarn loops (readings) dropped and was not regained for 10 s. The ten-second time
                              period still allowed the yarns to regain some stable connection, but if it was not possible,
                              the yarn/sample was considered failed.
                                    The ADC was used to convert analogue signals to digital signals to read every voltage
                              value measured, not only if the signal was there or not. If the yarn was damaged in between,
                              it would be indicated by the voltage drop. The data read-out included the voltage of the
                              yarns (V), the number of cycles performed and the time (s). There was one bending cycle in
                              one second (60 measurements per minute), and one voltage/resistance measurement was
                              taken during that time.
                                    The data transmission was read out and saved using PuTTY (an open-source terminal
                              emulator) through the serial port [10]. The data were logged in a CSV (comma-separated
                              values) file that was easily usable for analysis.
                                    However, resistance rise is often a more desired measurement for failure analysis.
                              Resistance can be measured using Ohm’s law by first defining the current (I).
                                    The original resistance of a yarn (RY ) loop was 1.2 Ω. The voltage input was always
                              5 V and the original voltage output (Vout ) was always 4.95 V. Thus, the voltage loss (Vloss )
                              at the start was always 50 mV. Based on this, the current was calculated:

                                                                  Vloss   50 mV
                                                             I=         =       = 41 mA                                  (1)
                                                                   RY     1.2 Ω

                                   When the resistance of the yarns stays within 10% of the load resistance, the current
                              stays stable and it can be assumed to be the same. To calculate the load resistance (RL ), the
                              following formula can be used:

                                                                  Vout            4.95 V
                                                      RL = RY ×         = 1.2 Ω ×        = 120 Ω                         (2)
                                                                  Vloss           0.05 V

                                   Thus, if RY changes to be over 12 Ω, then the current will also change. When yarn
                              resistance changes to be over 12 Ω during the tests (voltage drops), the resistance should
                              be calculated accordingly:
                                                                    (5 V − Vout ) × RL
                                                               Ry =                                                   (3)
                                                                           Vout
                                   Thus, the resistance of the yarn loops can be also plotted during failure analysis
                              (Figure 3).
resistance changes to be over 12 Ω during the tests (voltage drops), the resistance should
be calculated accordingly:
(5 V − Vout ) × RL
Ry = (3)
Vout
Micromachines 2023, 14, 781 6 of 11
Thus, the resistance of the yarn loops can be also plotted during failure analysis (Fig-
ure 3).
Figure 3. Results of Yarn 1 from sample set 1 (Ni-plated copper yarn) with the red dotted line
Figure 3. Results of Yarn 1 from sample set 1 (Ni-plated copper yarn) with the red dotted line high-
highlighting the failure points. The figure visualises the whole test of one of the samples to provide
lighting the failure points. The figure visualises the whole test of one of the samples to provide an
an understanding
understanding of how
of how the the resistance
resistance changed
changed over
over during
during the the
test.test.
3. Results
3. Results
As mentioned earlier, samples were flexed 180 degrees for 100,000 cycles or until the
As mentioned
voltage earlier, samples
dropped (resistance rose) inwere
at leastflexed
two180
yarndegrees for 10
loops for 100,000
s overcycles
the setorlimit
untilafter
the
voltage dropped (resistance rose) in at least two yarn loops for 10 s over
bending. Failure points were based on the final needs of the work wear application and its the set limit after
bending.
read-out Failure points
electronics. were based
Voltages belowon3.5theV orfinal needs ofrises
resistance the to
work wear were
50 ohms application and
considered
its read-out electronics. Voltages below 3.5 V or resistance
failure points (shown with red dotted lines in Figures 3 and 4a). rises to 50 ohms were consid-
ered failure
Firstly, points
it was (shown
observed with
howred dotted
earlier lines in Figures
resistance 3 and
rises were 4a). back to the original
reduced
Firstly, it was
measurements observed
(Figure how earlier
3 between resistance
20,000–30,000 rises were
cycles). The reduced back to thewere
stable connections original
lost
measurements (Figure
due to the filaments 3 between
breaking 20,000–30,000
during the bending cycles).
tests. The stable itconnections
However, were lost
was still possible for
due to the filaments breaking during the bending tests. However, it was
the yarn to regain some connection with other filaments, which also resulted in a regain of still possible for
the yarnoutput.
voltage to regain some connection
Resistance increaseswith
in sizeotherandfilaments,
persistencewhich
when also resultedbreak.
filaments in a regain
It was
of
observed that yarn with a larger number of filaments (Yarn 2) tended to regain itsbreak.
voltage output. Resistance increases in size and persistence when filaments originalIt
was observed more,
conductivity that yarn
was with
moreastable
largerandnumber
startedof to
filaments (Yarn
break later. 2) tended
Thus, highertonumbers
regain itsof
filaments together with lower sensitivity to plastic deformation under the bending of the
base material (steel or copper) support stable connections for longer.
Moreover, the copper-plated steel yarn’s (Yarn 2) durability was considerably better
than that of the Ni-plated copper yarn (Yarn 1). The resistance rise was lower and more
stable, indicating how steel and a larger number of filaments provide much better durability
than nickel-plated copper yarns. Additionally, when one yarn loop broke during the tests,
the second failure appeared quite quickly (for Yarn 1).
Figure 4 shows an overview of the results showing the average resistance of the sample
sets for each 10,000 cycle set. The greatest deviation in data was observed for sample sets 2
and 3 as only one sample out of four in each case showed failing measurements towards
the end of the test. In sample set 1, all the samples failed between 16,000 and 41,000 cycles.
In sample set 4, none of the samples failed and they stayed stable until the end of the test.cycles and then it rose by 3 ohms. The sudden increase in resistance was less obvious in
sample sets 2 and 4 with Yarn 2; however, it was observed in sample set 2 (Figure 4b) at
90,000 cycles.
It was observed that additional transition material helped to increase the bending
durability significantly (Figure 4b,d). While sample sets 2 and 3 still contained one sample
Micromachines 2023, 14, 781 with failure measurements, overall, the samples remained relatively stable. In sample 7 ofset
11
4, no samples showed failure measurements at any time.
Figure 4.
Figure Overview of
4. Overview of the
the results
results displaying
displaying the
the average
averageresistance
resistance of
ofeach
each10,000
10,000(*10,000)
(*10,000)cycle
cycleset.
set.
(a) Sample set
set 11 with
withYarn
Yarn1.1.(b)(b)Sample
Sampleset
set2 2with
withYarn 2. 2.
Yarn (c)(c)
Sample setset
Sample 3 with Yarn
3 with 1. (d)
Yarn Sample
1. (d) set
Sample
set 4 with
4 with YarnYarn
2. 2.
The resistance rise tended to start gradually and then rise more drastically after some
time. For example, in sample set 1 (Figure 4a), the resistance in yarn loop 3 was steady until
50,000 cycles and then it jumped by 450 ohms, indicating that the yarn had broken. Similarly,
in sample set 3 (Figure 4c), the resistance in yarn loop 2 was steady until 70,000 cycles and
then it rose by 3 ohms. The sudden increase in resistance was less obvious in sample sets 2
and 4 with Yarn 2; however, it was observed in sample set 2 (Figure 4b) at 90,000 cycles.
It was observed that additional transition material helped to increase the bending
durability significantly (Figure 4b,d). While sample sets 2 and 3 still contained one sample
with failure measurements, overall, the samples remained relatively stable. In sample set 4,
no samples showed failure measurements at any time.
4. Discussion
In this work, two conductive yarns that were woven into narrow fabric were tested
for repeated bending at the soft–rigid electronics encapsulation transition position. The
failure points were decided based on the needs of the read-out electronics of the e-textile
system. The application of the tested e-textile samples was to finally integrate them into
work wear used in extreme conditions, such as high temperature and humidity levels. The
e-textile system must, therefore, be highly durable, reliable and electrically stable.
Thus, this paper focused on three research questions:
1. How and when the two conductive yarns would break during repeated bending stress;
2. How the encapsulation material and transition from it would influence the yarns;
3. If and how additional transition materials could help the durability of the system.
The conductive yarns’ durability to repeated bending. Both conductive yarns were
woven into polyester-based narrow fabric. In each sample, the ribbon was 30 mm wide and
the pitch between the yarns was 1.27 mm. This work did not examine how different narrow
fabric widths and/or the pitch of the conductive yarns influenced the final durability.narrow fabric widths and/or the pitch of the conductive yarns influenced the final dura-
bility. However, while the integration of the yarns in the fabric was exactly the same in
either case, the stiffness of the yarns was very different. The drapability of the narrow
fabric with Yarn 1 was considerably better than that of the fabric with Yarn 2 (Figure 5).
While the filaments of Yarn 2 were steel-based, which also influenced the stiffness of the
Micromachines 2023, 14, 781 8 of 11
overall ribbon, this aspect may have impacted the final durability results in at least two
ways:
• A stiffer fabric is more difficult to process as it pushes the rigid electronics and en-
However, while the
capsulation integration
away from theof the yarns
fabric in theprocessing,
during fabric was exactly the same in influencing
thus significantly either case,
the stiffness of the yarns
the final integration; was very different. The drapability of the narrow fabric with Yarn
1•wasRestricting
considerably better than that of the fabric with Yarn 2 (Figure 5). While
the movement of the fabric during bending, thus creating a larger the filaments
bend-
of Yarn 2 were steel-based, which also
ing radius and protecting the yarns. influenced the stiffness of the overall ribbon, this
aspect may have impacted the final durability results in at least two ways:
The composition of the yarns also differed. Yarn 2 with steel performed better than
• A stiffer fabric is more difficult to process as it pushes the rigid electronics and encap-
the mainly copper-based yarn (Yarn 1). However, based on the supplier’s datasheet, the
sulation away from the fabric during processing, thus significantly influencing the
tensile strength and elongation percentage were lower for Yarn 2. This would suggest that,
final integration;
in the current bending test, these characteristics mattered less. In the current test, the time
• Restricting the movement of the fabric during bending, thus creating a larger bending
spent under stress was very short and repeated many times, as opposed to a single long
radius and protecting the yarns.
stress test.
Figure5.5.Top:
Figure Top:Narrow
Narrowfabric
fabricwith
with66rows
rowsofofYarn
Yarn1.1.Bottom:
Bottom:Narrow
Narrowfabric
fabricwith
with66rows
rowsof
ofYarn
Yarn2.2.
Thecomposition
The best-performing samples
of the werediffered.
yarns also found inYarn
sample setssteel
2 with 2 and 4 with Yarn
performed 2. Along
better than
with
the the material’s
mainly structure,
copper-based yarnYarn
(Yarn1 1).
hadHowever,
fewer filaments than
based on theYarn 2, which
supplier’s also seemed
datasheet, the
to have
tensile an influence
strength on durability
and elongation (Figurewere
percentage 6). Moreover, the PTFE
lower for Yarn 2. Thiscoating
would was 0.04that,
suggest mm
in the current bending test, these characteristics mattered less. In the current test, the time
spent under stress was very short and repeated many times, as opposed to a single long
stress test.
The best-performing samples were found in sample sets 2 and 4 with Yarn 2. Along
with the material’s structure, Yarn 1 had fewer filaments than Yarn 2, which also seemed to
have an influence on durability (Figure 6). Moreover, the PTFE coating was 0.04 mm thicker
and the filaments were thinner in Yarn 2 than those in Yarn 1 (Table 1). A thinner conductive
material has also been seen to be beneficial in previous works, especially around the soft–
rigid transition area [11–14]. X-ray inspection also showed how the filaments of Yarn 1
tended to break completely, while only some Yarn 2 filaments broke entirely, leading to the
conclusion that Yarn 2 had higher durability to repeated bending, even at the soft–rigid
transition area.
While sample sets 2 (with Yarn 2 without additional transition) and 3 (with Yarn 1
with additional transition) exhibited improved results compared with sample set 1, the
standard deviation showed high variability. From both sample sets, one sample out of
four failed towards the end of the testing (70,000–90,000 cycles) and created a large gap
with the results for the other samples. Thus, this indicates the possibility of failure after
60,000 cycles (see more in Figure 4).
The more drastic resistance rise patterns were seen in sample sets 1 and 3 with Yarn
1, which could also be explained by the thinner PTFE coating and fewer and thicker
filaments. However, as mentioned before, the influence of the steel material is quite clear
in Yarn 2’s higher performance. The drastic resistance rise also indicated the completeMicromachines 2023, 14, x 9 of 11
thicker and the filaments were thinner in Yarn 2 than those in Yarn 1 (Table 1). A thinner
Micromachines 2023, 14, 781 9 of 11
conductive material has also been seen to be beneficial in previous works, especially
around the soft–rigid transition area [11–14]. X-ray inspection also showed how the fila-
ments of Yarn 1 tended to break completely, while only some Yarn 2 filaments broke en-
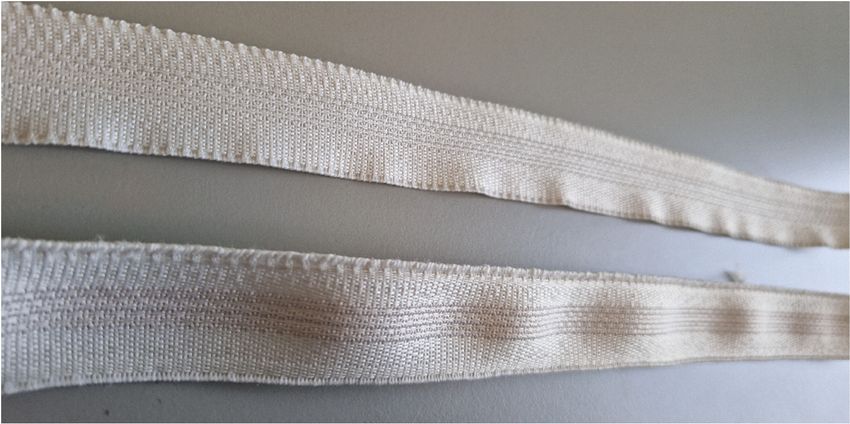
breakage of thetoyarn,
tirely, leading as also seenthat
the conclusion in Figure
Yarn 2 6a,
hadwhile indurability
higher Yarn 2 (Figure 6b), only
to repeated some
bending,
filaments
even at theseemed to break.
soft–rigid transition area.
Figure6.6.X-ray
Figure X-rayinspection
inspectionphotos
photosafter
afterbending
bendingtests.
tests.(a)
(a)Yarn
Yarn11after
afterbending
bendingtests.
tests.(b)
(b)Yarn
Yarn22after
after
bending tests.
bending tests.
The
Whileeffects
sampleof the
setselectronics
2 (with Yarnencapsulation material and
2 without additional methods.
transition) andThe encapsula-
3 (with Yarn 1
tion material was a polyurethane-based potting compound mixed from two parts. The
with additional transition) exhibited improved results compared with sample set 1, the
material’s shore hardness was rated between 55 and 65 (similar to a pencil eraser’s softness).
standard deviation showed high variability. From both sample sets, one sample out of
The mixture was also degassed in a vacuum chamber prior to use. However, the pressure
four failed towards the end of the testing (70,000–90,000 cycles) and created a large gap
produced by the pump was not high enough and the degassing process was either too
with the results for the other samples. Thus, this indicates the possibility of failure after
long (the material curing process already started) or some air bubbles were left in the
60,000 cycles (see more in Figure 4).
material. Air bubbles being left in the material made it more porous and may have been
The more drastic resistance rise patterns were seen in sample sets 1 and 3 with Yarn
an important factor in the final outcome as well. For example, the higher porosity of the
1, which could also be explained by the thinner PTFE coating and fewer and thicker fila-
potting compound could have caused the transition of the thinner potting compound area
ments. However, as mentioned before, the influence of the steel material is quite clear in
to break more easily, thus causing insufficient protection and a rough transition around the
Yarn 2’s higher performance. The drastic resistance rise also indicated the complete break-
soft–rigid materials transition. Moreover, the thicker and thinner encapsulation moulding
age of the yarn, as also seen in Figure 6a, while in Yarn 2 (Figure 6b), only some filaments
areas differed by around 6 mm. Although the transition from thicker to thinner areas was
designedtowith
seemed break.
a smooth slope (see Figure 1a), the large cap could have also affected the
overall durabilityof
The effects ofthe
the electronics
conductive encapsulation
yarns. material and methods. The encapsula-
tion The
material was a polyurethane-based
encapsulation potting compound
material’s higher rigidness compared withmixedthefrom two
textile wasparts.
clearThe
by
material’s shore hardness was rated between 55 and 65 (similar to a pencil
testing sample sets 1 and 3 (without additional transition materials, Figure 4a,b). Yarn eraser’s soft-
1
ness). The
started mixture
to break more was also degassed
immediately in a vacuum
(around chamber
20,000 cycles) andprior to use.resistance
the yarn’s However,rosethe
pressure produced
drastically, showing theby the pumpbreakage
complete was not high
of theenough andYarn
filaments. the 2degassing
had moreprocess wasbut
durability, ei-
ther too long (the material curing process already started) or some air bubbles
the sudden, more extreme resistance change was still seen, showing how some filaments were left in
were breaking.
Overall, it can be concluded that the smooth and softer transition from the encapsula-
tion to the yarns/textile cannot be underestimated. It is essential to focus on the materialMicromachines 2023, 14, 781 10 of 11
characteristics, together with the processing results. The transition points at the soft–rigid
transition area and within the encapsulation area need to be designed with high awareness.
The effects of the additional transition materials and methods. Due to the higher
rigidness of the encapsulation material, some softer additional material stacks were added
to the transition area (Figure 1b).
It was clear that the durability under constant bending was improved with that
addition (Figure 4c,d). The resistance rise was less abrupt or lacking at all (sample set 4).
Thus, the added material stack contributed significantly to increasing the reliability and
durability of the current e-textile system.
General overview. The results indicated that both the conductive yarns’ material
and construction affected their reliability and durability. The steel-based yarn with a
higher number of filaments, thinner filaments, no core and thicker PTFE coating seemed to
have considerably higher durability. Moreover, the encapsulation material characteristics,
together with the final outcome after processing, could have also influenced the soft–rigid
transition areas due to the porosity of the material. The overall thickness design of the
moulded encapsulation may have also contributed to the final durability.
The present results are significant in at least two major aspects. These outcomes
confirm the high need for a soft and smooth transition from rigid to soft materials. The
additional transition material stack added between the moulded encapsulation and textile
had a major influence on the final durability and reliability of the samples (Figure 4c,d). Ad-
ditionally, the results showed how a high encapsulation level could still be achieved locally
for e-textiles. The current e-textile system stack is intended to be used in extreme working
conditions where the reliability of the electronics is essential. Thus, the encapsulation of
the functional elements tends to be higher than usual, leading to more extreme soft–rigid
transition points on the textile. However, this work demonstrates that the transition areas
can be improved immensely by introducing soft material stacks in these crucial areas.
5. Conclusions
This work introduced a bending tester aimed to determine conductive yarns’ breaking
points, focusing on the rigid–soft transition points between the yarns and the electronics’
encapsulation. The tool presents an opportunity to test for proof-of-concept without
ordering expensive machines and tests. The testing method was used to bend two different
conductive yarns woven into a narrow fabric. The results show how the two yarns degraded
differently and at what point they started to degrade.
Overall, this study demonstrated that the local encapsulation of electronics on textiles
can be achieved with a high level of quality. In order to achieve high durability levels,
smooth and soft transitions between rigid and soft materials are crucial. The tests also
demonstrated that narrow fabric stacks with softer transition areas (from rigid encapsula-
tion) are key to improving durability. Additionally, the composition, number of filaments,
thickness and encapsulation greatly affect the reliability of conductive yarns.
Future work will include alternative testing features, such as a slower or faster bending
cycle or a different weight clamp. Additionally, different potting compounds with softer
shore hardness levels and different moulding designs may be examined. Moreover, twisting
(similar to a crumple test) could be investigated to further understand the mechanical stress
influences in e-textile systems.
Author Contributions: Conceptualization, P.V., F.T. and F.B.; methodology, P.V. and F.B.; software,
P.V. and F.B.; validation, P.V. and F.B.; formal analysis, P.V., F.B. and J.V.; investigation, P.V. and F.B.;
resources, P.V. and F.B.; data curation, P.V.; writing—original draft preparation, P.V.; writing—review
and editing, P.V., F.T., F.B. and J.V.; visualization, P.V.; supervision, F.B. and J.V. All authors have read
and agreed to the published version of the manuscript.
Funding: This research received no external funding.
Data Availability Statement: Not applicable.Micromachines 2023, 14, 781 11 of 11
Conflicts of Interest: The authors declare no conflict of interest.
References
1. Farringdon, J.; Moore, A.J.; Tilbury, N.; Church, J.; Biemond, P.D. Wearable sensor badge and sensor jacket for context awareness.
In Proceedings of the Digest of Papers. Third International Symposium on Wearable Computers, San Francisco, CA, USA, 18–19
October 1999.
2. Mann, S. “Smart clothing”: Wearable multimedia computing and “personal imaging” to restore the technological balance between
people and their environments. In Proceedings of the Fourth ACM International Conference on Multimedia, Ottowa, ON, Canada,
3–6 June 1997; Association for Computing Machinery: Boston, MA, USA, 1997; pp. 163–174.
3. Mann, S. Smart clothing: The shift to wearable computing. Commun. ACM 1996, 39, 23–24. [CrossRef]
4. Mann, S. Smart clothing: The wearable computer and wearcam. Pers. Technol. 1997, 1, 21–27. [CrossRef]
5. De Pasquale, G.; Mura, A. Accelerated lifetime tests on e-textiles: Design and fabrication of multifunctional test bench. J. Ind. Text.
2018, 47, 1925–1943. [CrossRef]
6. Zaman, S.U.; Tao, X.; Cochrane, C.; Koncar, V. Wash Analyses of Flexible and Wearable Printed Circuits for E-Textiles and Their
Prediction of Damages. Electronics 2021, 10, 1362. [CrossRef]
7. de Vries, H.; Cherenack, K.H. Endurance behavior of conductive yarns. Microelectron. Reliab. 2014, 54, 327–330. [CrossRef]
8. Zysset, C.; Cherenack, K.; Kinkeldei, T.; Tröster, G. Weaving integrated circuits into textiles. In International Symposium on Wearable
Computers (ISWC) 2010; IEEE: Seoul, South Korea, 2010.
9. Cherenack, K.; Pieterson, L.V. Smart textiles: Challenges and opportunities. J. Appl. Phys. 2012, 112, 091301. [CrossRef]
10. Bolton, W. Chapter 4-I/O Processing. In Programmable Logic Controllers, 6th ed.; Bolton, W., Ed.; Newnes: Boston, MA, USA, 2015;
pp. 79–113.
11. Gonzalez, M.; Axisa, F.; Bulcke, M.V.; Brosteaux, D.; Vandevelde, B.; Vanfleteren, J. Design of metal interconnects for stretchable
electronic circuits. Microelectron. Reliab. 2008, 48, 825–832. [CrossRef]
12. Sivaramakrishnan, K.; Theodore, N.D.; Moulder, J.F.; Alford, T.L. The role of copper in ZnO/Cu/ZnO thin films for flexible
electronics. J. Appl. Phys. 2009, 106, 063510. [CrossRef]
13. Schischke, K.; Nissen, N.F.; Schneider-Ramelow, M. Flexible, stretchable, conformal electronics, and smart textiles: Environmental
life cycle considerations for emerging applications. MRS Commun. 2019, 10, 69–82. [CrossRef]
14. Koshi, T.; Nomura, K.-I.; Yoshida, M. Measurement and analysis on failure lifetime of serpentine interconnects for e-textiles under
cyclic large deformation. Flex. Print. Electron. 2021, 6, 025003. [CrossRef]
Disclaimer/Publisher’s Note: The statements, opinions and data contained in all publications are solely those of the individual
author(s) and contributor(s) and not of MDPI and/or the editor(s). MDPI and/or the editor(s) disclaim responsibility for any injury to
people or property resulting from any ideas, methods, instructions or products referred to in the content.You can also read