Nimbus cm2 Pulse BAND: Erythrocyte De-aggregation. Influencing Zeta Potential of Cell Membrane for Improved Gas Exchange - Nimbus Performance
←
→
Page content transcription
If your browser does not render page correctly, please read the page content below
JM Global Research

Nimbus cm2 Pulse BAND:
Erythrocyte De-aggregation.
Influencing Zeta Potential of Cell
Membrane for Improved Gas
Exchange.
Dale C. Gledhill, Gregory Anderson D.P.M. and Kade T. Huntsman, M.D.

Researchers Note: The basis and foundation of the science, principles and physiological assumptions
cited herein are based upon the research articles, medical studies found at the conclusion of this paper
and the data gathered as part of this research study.

© Copyright 2018, Dale C. Gledhill. All rights reserved.
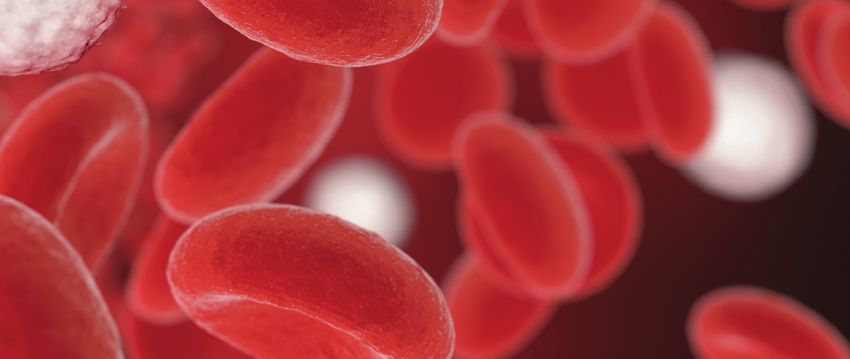
The erythrocyte, commonly referenced as a red blood cell (RBC), is by far the most
common formed element in the human body. A single drop of blood contains millions
of erythrocytes. The primary medically accepted functions of an erythrocyte is gas
exchange[1], to pick up inhaled oxygen molecules from the lungs and transport it to
the body’s tissues, and to pick up carbon dioxide waste at the tissues and transport it
to the lungs for exhalation. This article describes the physiological requirement and
need for free-suspended RBCs. A method to improve disaggregation of RBCs and the
potential impact RBC separation may have an impact on health and particularly athletic
performance.
ABSTRACT
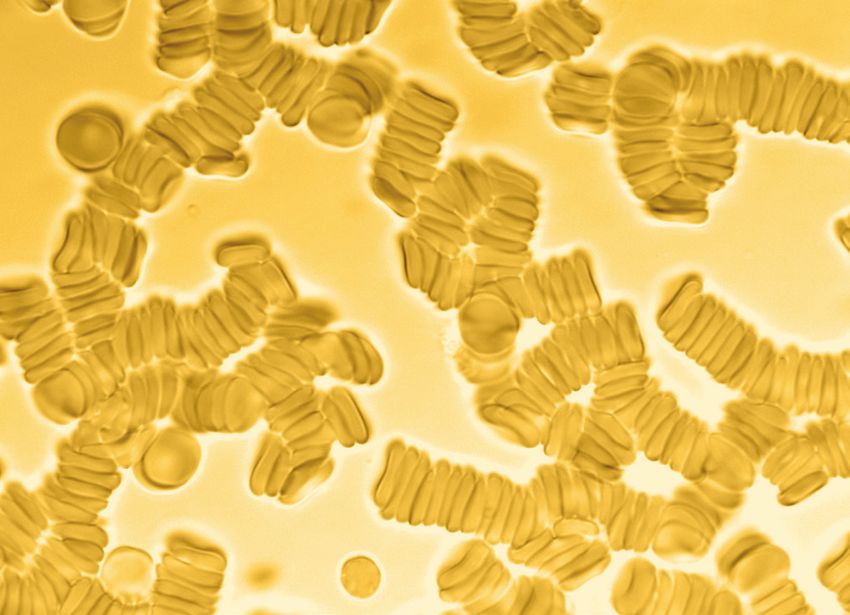
Rouleaux RBC
Background: Aggregated and/or Rouleaux stacked RBCs
may have a direct impact upon health in general.
• Aggregated erythrocytes are defined a physiological
phenomenon that takes places in normal blood under
low-flow conditions or at stasis. The presence or increased
concentrations of acute phase proteins, particularly
fibrinogen, results in enhanced erythrocyte aggregation.
Surface properties of erythrocytes, such as surface Free-Suspended RBC
[2]
charge density or membrane zeta potential strongly
influence the extent and time course of aggregation. In
addition, only limited research has been pursued to access
the potential influence on health and performance.
• Rouleaux erythrocytes are stacks or linear aggregations[3]
of red blood cells (RBCs) which form partially because
of the unique discoid shape of the cells. The flat surface
of the RBCs provides a large surface area to make contact with and attract each
other primarily due to dissimilar membrane zeta potential[4]; thus forming a
rouleaux. This event often occurs when the plasma protein concentration is high,
which also increases the ESR erythrocyte sedimentation rate,. This is a non-specific
2
© Copyright 2018, Dale C. Gledhill. All rights reserved.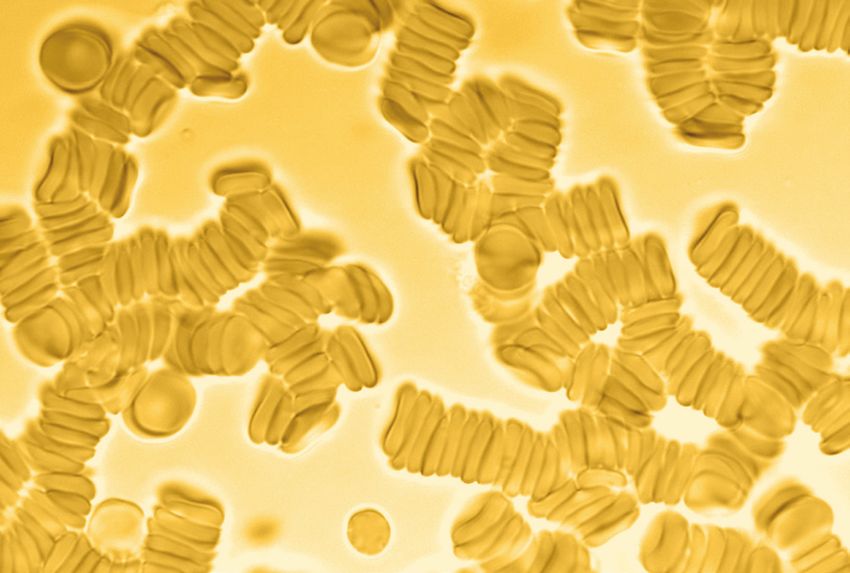
indicator of the presence of disease, a
        common factor in diet deficiencies and
        highly prevalent under inflammatory
        conditions.
      • Conversely, the presence of RBC
        aggregation and rouleaux is a potential
        cause[5] of disease because of the
        restrictive flow of blood throughout the
        body because capillaries can only accept
        free flowing singular and independent
        red blood cells. The aggregations, also
        known as “clumping”, can form as
        an allergic reaction or a response to
        elevated fibrinogens effecting the cell membrane zeta potential.
      • Free flow into micro-capillaries is dependent upon shear force when these
        conditions are present[6].

    Aim: To describe and demonstrate the rationale for assisting     Free flow into
    the human body’s ability to separate RBCs and a method to
    assess the short and long term impact on athletic performance.   micro-capillaries
                                                                     is dependent upon
    Method: Fifty highly skilled athletes participating in           shear force when
    sanctioned college athletics provided a live blood smear where
                                                                     these conditions
    a visual RBC condition was photographed and documented.
    The recipient was then provided a Nimbus cm2 Pulse BAND[7],      are present.
    a small wrist device that generates a dynamic toroidal .030
    gauss magnetic pulse. Each recipient was asked to wear the
    device for a minimum of 8 hours per day. At a minimum of 21 days and a maximum
    of 30 days, the recipients then provided a second live blood smear and again it was
    photographically documented. The pre and post recipient smear photographs were
    then visually compared and contrasted. In addition, an unstructured open ended
    questions was posed regarding any personal physiological changes after the second
    blood sample was obtained. There was no compensation provided to the athlete and the
    testing program was under the supervision of the athletic training department.

    Conclusion: This article describes the strategies, rationale, efforts and outcomes from
    the evidence-based test as performed on the 50 selected athletes. The outcomes, as
    demonstrated by visual documentation and interview, demonstrate the effectiveness
    of a low intensity dynamic toroidal magnetic pulse on RBCs and initial physiological
    effect. Study outcome warrants further research in creating additional methods of
    measuring improved[8] performance in athletes with free-suspended RBCs or absence

3
    © Copyright 2018, Dale C. Gledhill. All rights reserved.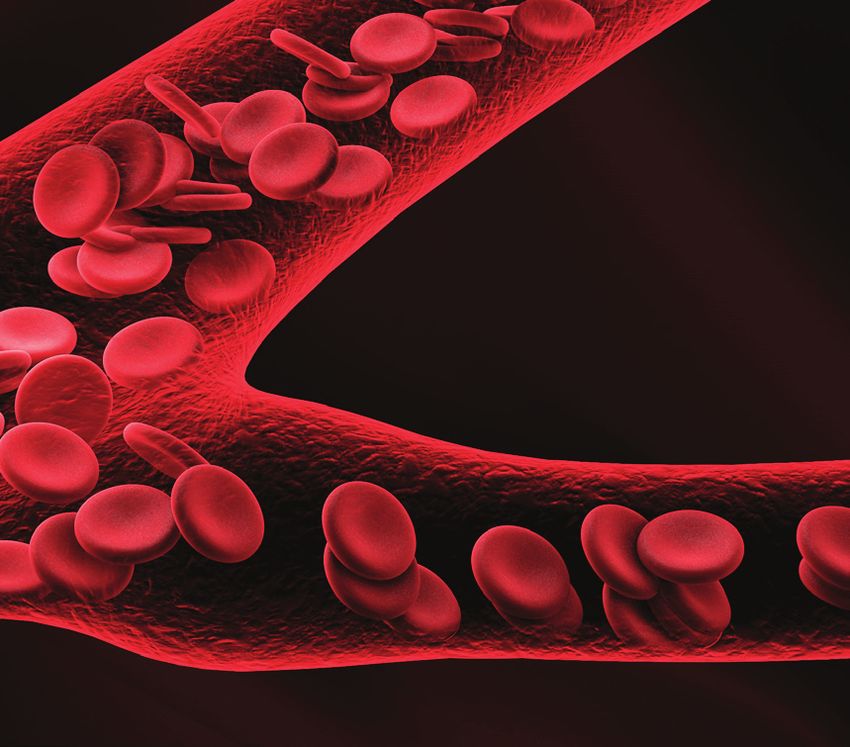
of aggregation or rouleaux, a common condition of athletes under intense physical
    training and performance demands.

    Background
    The erythrocyte, commonly known as a red blood cell (RBC), is by far the most
    common formed element in the human body[9]. The primary functions of erythrocytes
    are to accept oxygen rich hemoglobin from the lungs and transport it to the body’s
    tissues, organs, brain etc and to pick up carbon dioxide waste at the tissues and
    transport it to the lungs for exhalation. Mature, circulating erythrocytes have few
    internal cellular structural components. Lacking mitochondria, for example, they
    rely solely on anaerobic respiration. This means that
    they do not utilize any of the oxygen they are
    transporting, so they can deliver it all to the
    tissues, further demonstrating their potential
    impact. They also lack endoplasmic
    reticula and do not synthesize proteins.
    Erythrocytes do, however, contain some
    structural proteins that help the blood
    cells maintain their unique structure and
    enable them to change their shape to squeeze
    through capillaries for oxygen delivery and
    waste deletion at a controlled pace for optimal
    efficiency.

    Erythrocytes are biconcave discs with very shallow
    centers. This shape optimizes the ratio of surface area to volume, facilitating gas
    exchange. It also enables flexibility[10] to fold and bend as they move through narrow
    capillaries. Erythrocytes are plump at their periphery and very thin in the center.
    Since they lack most organelles, there is more interior space for the presence of the
    hemoglobin molecules to maximize the transport of gases. The biconcave shape also
    provides a greater surface area across which gas exchange can occur, relative to its
    volume; a sphere of a similar diameter would have a lower surface area-to-volume ratio.
    This unique shape, additionally demonstrates the intended efficiency of erythrocyte gas
    exchange.

    The numeric count and physiological condition of the erythrocyte will impact the
    transport of gases, both oxygen and carbon dioxide. Athletic performance can be
    limited or enhanced and dependent upon the count and condition of the erythrocyte.
    Referencing the University of Minnesota School of Medicine, “What do normal red
    blood cells look like[11] (in a live blood smear)? First, the cells are nicely spread across
    the field. They are sometimes touching or even slightly overlapping, but they’re not all

4
    © Copyright 2018, Dale C. Gledhill. All rights reserved.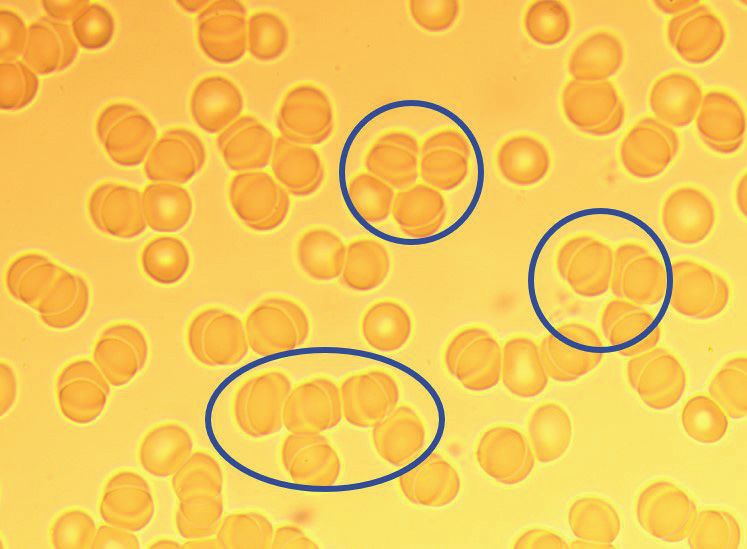
piled up on top of each other. There are occasional small empty spaces, but there are not
    vast barren areas the size of several red cells”. The reference to a “normal” erythrocyte
    clearly describes a free suspended erythrocyte with circumferal exposure allowing for
    maximum surface area to uptake and dispose oxygen and carbon dioxide.
    In the capillaries, the oxygen carried by the erythrocytes can diffuse into the plasma
    and then through the capillary walls to reach the cells[12], whereas some of the carbon
    dioxide produced by the cells as a waste product diffuses into the capillaries to be picked
    up by the erythrocytes. Capillary beds are extremely narrow by design, slowing the
    movement of the erythrocytes and providing maximum opportunity for gas exchange to
    occur. The capillary diameter can be so minute that erythrocytes may have to fold in on
    themselves to make their way through.
    By design, their structural proteins are
    flexible, allowing them to bend to a
    surprising degree, then reshape when
    they enter a wider vessel.

    Each iron ion in the erythrocyte can
    bind to one oxygen molecule. Each
    hemoglobin molecule can transport
    four oxygen molecules. An individual
    erythrocyte may contain about 300
    million hemoglobin molecules, and therefore can bind to and transport up to 1.2 billion
    oxygen molecules. An adult male is estimated to have 33 trillion RBCs within his
    circulatory system[13].

                                                               Changes in the quantity or separation of
                                                               RBCs can have significant effects on the
                                                               body’s ability to effectively deliver oxygen
                                                               to tissues. In addition, gas exchange of
                                                               oxygen (O2) and carbon dioxide (CO2) by
                                                               erythrocytes can be affected by ineffective
                                                               hemopoiesis as well as aggregation. A
                                                               balance of these conditions impact
                                                               erythrocyte gas exchange capabilities and
                                                               therefore performance.

    Erythrocyte Creation: When hypoxemia or a low concentration of oxygen exists,
    fibroblasts within the kidney secrete EPO, thereby increasing erythrocyte production
    intending to restore oxygen levels with increased erythrocytes. Operating in a negative
    response loop, as oxygen saturation rises, EPO secretion falls[14], thereby maintaining

5
    © Copyright 2018, Dale C. Gledhill. All rights reserved.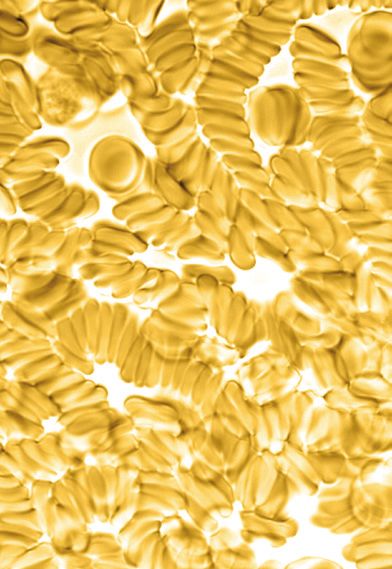
homeostasis. As an example, populations dwelling at
    Improving gas exchange            high elevations, with inherently lower levels of oxygen
    efficiency seems a                in the atmosphere, naturally maintain a hematocrit
                                      higher than people living at sea level. Consequently,
    promising method of
                                      people traveling to high elevations may experience
    developing a safe and             symptoms of hypoxemia, such as fatigue, headache, and
    effective method of               shortness of breath, for a few days after their arrival.
                                      As previously discussed, in response to the hypoxemia,
    improved athletic and             the kidneys secrete EPO to step up the production of
    cognitive performance.            erythrocytes until homeostasis is achieved once again.
                                      Although staggering to consider, marrow can produce
                                      up to 2 million cells per second to attempt homeostasis
    of the fragile 120 day lifecycle of erythrocytes. This erythrocyte capacity, unless
                                    [15]

    manipulated by artificially doping, is maintained naturally by hematopoiesis. Therefore,
    improving gas exchange efficiency
    seems a promising method of                             Rouleaux Formation
    developing a safe and effective
    method of improved athletic and
    cognitive performance.

    Rouleaux Formation:
    Erythrocytes often stack like a
    roll of coins, forming a rouleaux.
    When rouleaux formation is truly
    present in blood, it is often caused
    by an increase in cathodal proteins,
    such as immunoglobulins and
    fibrinogen. Red blood cells are                     Aggultination Formation
    thought to form rouleaux because
    they have decreased or imbalanced
    negative charge (altered zeta
    potential) on the membrane of the
    erythrocyte, primarily a factor of
    high levels of fibrinogen. This can be
    a common finding in the blood of
    healthy individuals, athletes or the
    compromised. Rouleaux can also be
    a marker[16] of underlying disease,
    especially those with an autoimuume
    disorder. Fibrinogen, thought to be the one of the main causes of altered RBC zeta
    potential is a β-2 globulin, a reactantant value increase associated with inflammation.
    In athletes that are involved with intense training and extended physical performance,

6
    © Copyright 2018, Dale C. Gledhill. All rights reserved.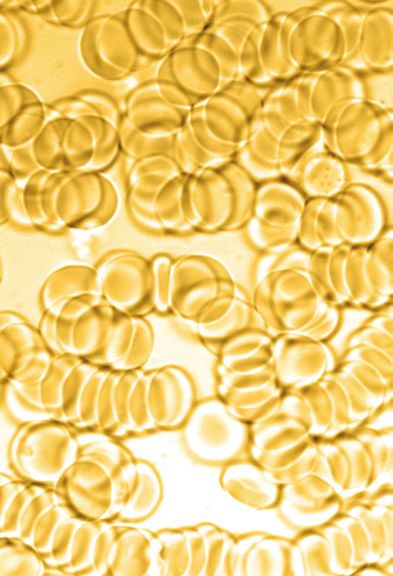
potential for inflammation associated with these activities commonly produce added
    proteins in the blood, creating rouleaux.

    Agglutination versus rouleaux formation:
    Agglutination can be distinguished from rouleaux by their characteristic appearance
    on blood smears, wherein agglutination forms three-dimensional clusters, whereas
    rouleaux forms stacks. This condition can also be caused by reduced zeta potential
    of a RBC and from many of the same conditions as detailed in the rouleaux section
    previously cited.

    Blood Doping Dangers: The performance value of a high erythrocyte count has
    been brought to the forefront of the medical community by the abuse, attempts and
    achievements of professional and amateur athlete’s effort to enhance performance
    by manipulating hematopoiesis. Blood doping has been
    achieved by either infusing ones own red blood cells or        Blood doping is
    by administering the drug erythropoietin to artificially
    increase red blood cell mass. Blood doping has shown           associated with risks
    to improve an athlete’s ability to perform in a maximal        that can be serious
    endurance exercise. Blood doping has also shown to reduce
    physiologic strain during exercise in the heat and altitude.
                                                                   and impair athletic
    Conversely, blood doping is associated with risks that can     performance.
    be serious and impair athletic performance. These known
    risks are exacerbated by lack of medical supervision, as
    well as the imbalance created by dehydration and blood pressure. The medical risks
    associated with blood doping[17] has been documented from many carefully controlled
    research studies. The position of the American College of Sports Medicine is “that
    any blood doping procedure used in an attempt to improve athletic performance is
    unethical, unfair, and exposes the athlete to unwarranted and potentially serious health
    risks”. The researchers involved in this study do not condone doping or any other
    dangerous manipulative or chemical performance enhancements.

    Study Premise
    The research committee conducting the study has extensively reviewed the literature
    from PubMed, Science Direct and multiple data bases that address erythrocyte
    conditions, cause and effect, and potential effects on gas exchange based upon such
    conditions. [see attached studies] This search yielded over 100 studies or articles
    addressing the potential implications of erythrocyte condition as it relates to gas
    exchange and therefore health and performance. The vast research supported the
    committee’s hypothesis that regardless of a the physiological cause, if the zeta potential
    of an erythrocyte (RBC) could be restored to a “like charge”, then Coulomb’s law[18], or

7
    © Copyright 2018, Dale C. Gledhill. All rights reserved.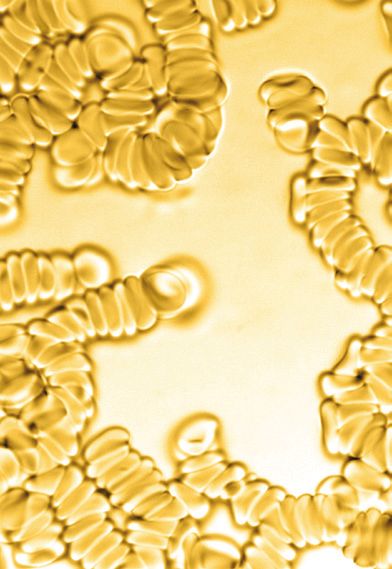
Coulomb’s inverse-square law, of physics would induce
    disaggregation or separation of erythrocytes. Coulomb’s
    law states, “electrically charged particles will repel or
    attract each other. The force of the interaction between
    the charges is attractive if the charges have opposite
    signs and repulsive if like-signed.” In summary and
    premise;

           Can a device assist the body in naturally separating
           erythrocytes and safely free suspend single RBCs
           in plasma to allow for maximum surface area for
           optimum gas exchange, and to access capillaries capable of only single cell mass,
           therefore safely improving physiological and athletic performance?

    Test Device Delivering cm2
    The Nimbus cm2 Pulse BAND is a wrist worn device that emits a unique toroidal
    magnetic pulse that has shown via blood tests to influence the zeta potential of a
    erythrocyte. The pulse is a dynamic toroidal .030 gauss magnetic pulse. The BAND
    is designed to be worn between 8 and 12 hours per 24 hour cycle. The device emits a
    micro pulse for seven minutes and then rests for twenty-three. The science of the cm2
    Pulse BAND foundation is upon the scientific principle of Faraday’s law of induction
    and Lenz’s law, which are basic laws of electromagnetism, predicting how a magnetic
    field will interact and produce a current in the receiving conductor. It is similar to the
    common technology being used today with wireless charging systems. In this case, an
    erythrocyte is the receiving conductor upon which the dynamic field has been induced.
    This is the phenomenon called electromagnetic induction. It is the fundamental
    operating principle of all transformers and equally applies as designed, for influencing
    erythrocyte membrane charge.

    Study Method
    The athletic training department from a select Division One collegiate school selected
    50 of their top female and male athletes to participate in this investigative research
    study. Participants were from the following programs: football, basketball, cross country,
    volleyball and soccer. The research team was provided the athlete list and was unable to
    accept or deny any of the recipients. The following was the research protocol for testing
    of each athlete:
     1. Blood draw area cleaned and disinfected.
     2. Single lance to obtain a one-drop specimen direct to a glass slide.
     3. Specimen covered with cover slide and 1 drop of oil applied on top of slide for ease
         of scanning slide under a light field microscope.

8
    © Copyright 2018, Dale C. Gledhill. All rights reserved.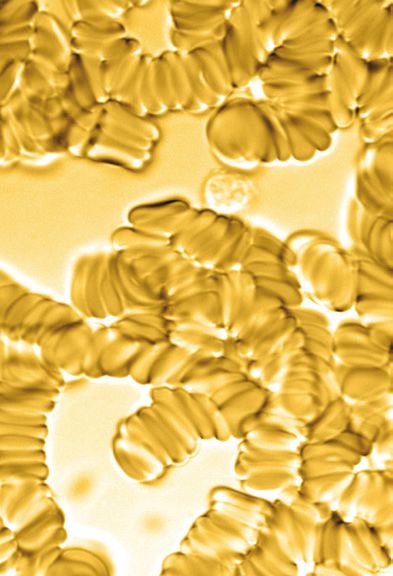
4.  Specimen viewed 1,000 magnification. Olympus cx41 light field scope.
     5.  Specimen scanned for predominant erythrocyte condition
     6.  Photo of predominant condition documented.
     7.  Recipient issued a Nimbus cm2 BAND and provided operational instructions.
     8.  Recipient requested to use the BAND daily for a minimum 8 hours per day.
     9.  Recipient was then retested after a minimum of 14 days of BAND use, utilizing the
         same specimen acquisition protocol and documentation.
     10. Recipient was asked three exit questions after second blood test.
     11. The recipient was allowed to keep the BAND and no further contact has been
         initiated at the time of this writing.
     12. There is additional new athlete testing with the same protocol as of the time of this
         writing. Ongoing and additional testing results and data forthcoming in a follow-
         up study to be published in 2019.

    Follow-up Testing Statistics
    Initial blood test and a BAND was issued to a total of
    50 recipients. Of this treatment group, the following
    statistical information of this group is as follows:
      • 40 recipients returned for a follow-up blood test.
      • 1 recipient damaged the BAND and had not used
        the technology.
      • 11 recipients were unable to return for their
        follow-up blood test.
      • 1 recipient had not used the band within four days
        of the second test.
    For qualifying purposes, the actual sample size of those that stated they met the test
    criteria is thirty eight (38) total recipients.

    Follow-up Blood Smear Results
    All conditions of blood
    sampling were identical
    between the pre and post
    events. When each study
    recipient’s initial blood
    smear was compared
    visually side by side via a
    high resolution photo with
    the identical post BAND
    blood smear photo, the
    following observations

9
    © Copyright 2018, Dale C. Gledhill. All rights reserved.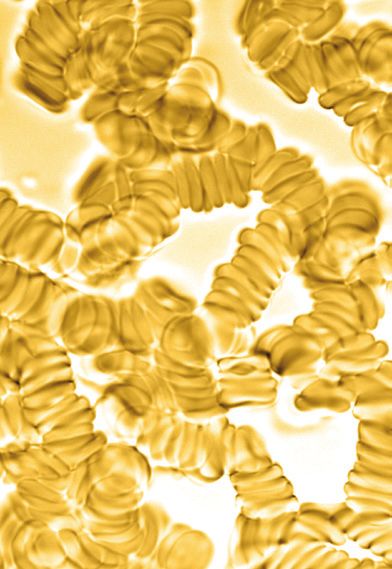
became discernible and measurable:
      • 38 of 38 compliant users showed distinguishable visual erythrocyte separation.
      • 3 of 38 showed only fair separation or absence of rouleaux or aggregation.
      • 35 of 38 showed clear measurable and distinguishable separation or absence of
        rouleaux or aggregation.
      • 0 of 38 showed no noticeable change in erythrocyte appearance.
      • 35 of 38 showed results of a text book description and documentation on healthy
        erythrocytes within a body.

     Follow-up Open Ended Interview Results
     Immediately upon completion of the second blood smear specimen, each recipient was
     privately queried with the following open ended questions:
      • How often did you wear the
         BAND?
      • How many hours per day
         on average did you wear the
         BAND?
      • Have you noticed any changes
         since using the BAND?

     The following indicators were
     conveyed. Although anecdotal,
     the feedback was not controlled
     and the information gleaned is
     deemed genuine and unfiltered.
     The following outlines a complete
     feedback summary regarding question 3:

       • 13 of the 38 recipients or 34% stated they had felt no noticeable difference within the
         first two weeks of use.
       • 25 of the 38 recipients or 66% stated they experienced at least one or more of the
         following; improved energy, improved sleep, faster recovery and extended endurance
         in the first two weeks of use.
       • Improved energy and sleep were the two most frequent comments.
       • 0 of 38 expressed a negative side effect.

10
     © Copyright 2018, Dale C. Gledhill. All rights reserved.
Discussion
To the best of our knowledge, this is the first investigative study intended to understand
potential performance effects of separated or free suspended erythrocytes as defined
by hematology as normal or healthy condition or RBCs. For years the athletic
performance world has been plagued by the dangerous practice of blood doping in
an effort to improve gas exchange, therefore improved aerobic endurance, recovery
and performance. This practice has been deemed dangerous, unethical and banned
by most sports federations. Therefore, one is left to query is there a safe method of
improving erythrocyte gas exchange[19] by assisting the body’s natural ability to return
and maintain blood conditions that one would consider as, “healthy and normal blood”.
It is indisputable the impact RBCs have on gas exchange, therefore performance. Based
upon the initial testing outlined herein and positive health and performance impact,
further study and research is warranted.
This study has limitations. Firstly, it did not have control over the amount of active
BAND use time by each athlete. Verification was based only upon verbal confirmation.
Secondly, further study will be required to determine the optimal amount of time
required for erythrocyte separation. Thirdly, the long term benefits are still yet to be
determined. Fourth, the perceived or actual physiological changes are not quantifiable
at this stage, although visual improvements were significant and consistent enough to
warrant additional investigation.
The researcher notes that the improved levels of recovery, energy and sleep exceeded
expectations and validated the research hypothesis. Additional research and data will
be forthcoming.
Conclusion
This initial study was initiated after years of similar findings from hundreds of random
samples under similar testing parameters. This structured environment and study
confirmed to the research team with actual visual data that demonstrated that changing
erythrocyte zeta potential will improve RBC separation. Furthermore, the post test
feedback interview confirmed that an athletic and performance benefit, primarily
improved energy and endurance is directly affected with improved gas exchange, the
result of separated or non aggregated RBCs.
11
© Copyright 2018, Dale C. Gledhill. All rights reserved.Blood Sample Data
Before 1 After Before 2 After
Before 3 After Before 4 After
Before 5 After Before 6 After
12
© Copyright 2018, Dale C. Gledhill. All rights reserved.Before 7 After Before 8 After
Before 9 After Before 10 After
Before 11 After Before 14 After
13
© Copyright 2018, Dale C. Gledhill. All rights reserved.Before 15 After Before 16 After
Before 17 After Before 18 After
Limited Use
Before 20 After Before 21 After
14
© Copyright 2018, Dale C. Gledhill. All rights reserved.Before 22 After Before 24 After
Before 25 After Before 26 After
Before 27 After Before 28 After
15
© Copyright 2018, Dale C. Gledhill. All rights reserved.Before 30 After Before 31 After
Before 32 After Before 33 After
Before 34 After Before 35 After
16
© Copyright 2018, Dale C. Gledhill. All rights reserved.Before 37 After Before 38 After
Before 39 After Before 41 After
Before 43 After Before 44 After
17
© Copyright 2018, Dale C. Gledhill. All rights reserved.Before 45 After Before 46 After
Did not use.
Before 47 After Before 49 After
18
© Copyright 2018, Dale C. Gledhill. All rights reserved.References
1. Dean L., Bethesda (MD): National Center for Biotechnology Information (US); 2005., Blood
Groups and Red Cell Antigens
2. https://www.ncbi.nlm.nih.gov/pubmed/6487760, Aggregation and disaggregation of red blood cells,
Skalak R.
3. http://www.bloodjournal.org/content/bloodjournal/107/11/4205.
4. Electrical properties of the red blood cell membrane and immunohematological investigation,
https://www.ncbi.nlm.nih.gov/pmc/articles/PMC3415751/.
5. https://library.med.utah.edu/WebPath/HEMEHTML/HEME007.html
6. Haemodynamic shear stress activates a K+current in vascular endothelial cells, Søren-Peter Olesen,
David Claphamt, & Peter Davies.
7. Nimbus Performance, cm2, white paper, Dale C Gledhill.
8. Effects of incomplete pulmonary gas exchange on VO2 max,S. K. Powers, J. Lawler,J. ,. Dempsey, S.
Dodd,G. Landry.
9. Red Blood Cells, S Peter Klinken, The International Journal of Biochemistry& Cell Biology, Voulme
34, Issue 12, Decemeber 2002, Pages 1513-1518.
10. Transport Of Oxygen in Muscle, Beatrice A. Wittenberg and Jonathon B. Wittenberg.
11. What Do Normal Red Blood Cells Look Like, May 7, 2009, Hematopathology.
12. The minimum energy of bending as a possible explanation of the biconcave shape of the human red
blood cell*, P.B.Canham.
13. How Many Hemoglobin Proteins are there in a Single Red Blood Cell?, Dhaval Bhatt, MSc in
Biotechnology.
14. Regulation of Erythroprotein Production, WolfgangJelkmann, J Physiol, 2011 Mar 15, 589.
15. Measurement of Red Cell Lifespan and Aging, Robert S. Franco, Transfusion Medicine and
Hemotherapy, 2012 Oct; 39(5) 302-307.
16. The Plasma Protein Fibrinogen Stabilize Clusters of Red Blood Cells in Microcapillary Flows. M.
Brust, O. Aouane, M. Thiébaud, D. Flormann, C. Verdier, L. Kaestner, M. W. Laschke, H. Selmi, A.
Benyoussef, T. Podgorski, G. Coupier, C. Misbah, and C. Wagner.
19
© Copyright 2018, Dale C. Gledhill. All rights reserved.17. The Dangers of Blood Doping, Health24.com, January 2103, Amy Froneman.
18. The Physics Hypertextbook, Coulombs Law, Glenn Elert.
19. Siggaard, O; Garby L (1973). “The Bohr Effect and the Haldane Effect”. Scandinavian Journal of
Clinical and Laboratory Investigation.
20
© Copyright 2018, Dale C. Gledhill. All rights reserved.The following studies and articles were used to generate the research study
premise as well as the supporting science regarding the physiological
impact of separated erythrocytes.
The following premises and information from the following studies and articles have
been considered as part of the research prior, during and post test.
1. Blood Journal, 1 June 2006 Volume 107, Number 11, Cornell College of Medicine: Rouleaux
Formation
2. Campbell T.W. 2004. Mammalian hematology: Laboratory animals and miscellaneous species. In:
Thrall M.A. (Ed.)
3. Veterinary Hematology and Clinical Chemistry. Lippincott Williams and Wilkins, Philadelphia, PA,
pp. 211-224. Canham P.B. 1970
4. The minimum energy of bending as a possible explanation of the biconcave shape of the human red
blood cell. J. Theor. Biol. 26(1): 61-81. Everds N. 2006.
5. Hematology of the laboratory mouse. in: Fox J., Barthold S., Davisson M., Newcomer C., Quimby F.,
Smith A. (Eds.).
6. The Mouse in Biomedical Research, 2nd edition, Vol. III. Normative Biology, Husbandry and
Models. Elsevier Academic Press, San Diego, CA, pp. 133-170. Kinoti G.K. 1973.
7. Observations on the blood of a tropical bat, Otomops martiensseni. East African Wildlife Journal
11(2): 129-134. Kostelecka-Myrcha A. 1966.
8. Hemoglobin, erythrocytes and hematocrit in the blood of some microtidae under laboratory
conditions. Bull. Acad. Pol. Sci. Biol. 14(5): 343-349. Kostelecka-Myrcha A. 1967.
9. Variation of morpho-physiological indices of blood in Clethrionomys glareolus (Schreber, 1780).
Acta Theriol. 12: 191-222. Kostelecka-Myrcha A. 2002.
10. The ratio of amount of haemoglobin to total surface area of erythrocytes in mammals. Acta Theriol.
47(1): 209-220. Mohandas N., Gallagher P.G. 2008.
11. Red cell membrane: past, present, and future. Blood 112: 3939. Mokken F.C., Kedaria M., Henny
C.P., Hardeman M.R., Gelb A.W. 1992.
12. The clinical importance of erythrocyte deformability, a hemorrheological parameter. Ann. Hematol.
64(3): 113-122. Vayo H.W. 1983.
13. Some red blood cell geometry. Can. J. Physiol. Pharmacol. 61(6): 646-649. Waugh R.E., Sarelius I.H.
1996.
21
© Copyright 2018, Dale C. Gledhill. All rights reserved.14. Effects of lost surface area on red blood cells and red blood cell survival in mice. Am. J. Physiol. Cell
Physiol. 271: C1847-C1852. Wołk E. 1970.
15. Erythrocytes, haemoglobin and haematocrit in the postnatal development of the root vole. Acta
Theriol. 15: 283-293. Wołk E. 1974.
16. Variations in the hematological parameters of shrews. Acta Theriol. 19: 315-346. Wołk E. 1983.
17. Blood doping and its detection, Wolfgang Jelkmann and Carsten Lundby
18. Blood 2011 118:2395-2404; doi: https://doi.org/10.1182/blood-2011-02-303271
19. The hematology of the free-ranging European bison. Acta Theriol. 28: 73-82. Wołk E. 1985.
20. Hematology of a hibernating rodent - the northern birch mouse. Acta Theriol. 30: 337-348.
Yamaguchi K., Jürgens K.D., Bartels H., Piiper J. 1987.
21. Oxygen transfer properties and dimensions of red blood cells in high-altitude camelids, dromedary
camel and goat. J. Comp. Physiol. B 157(1): 1-9.C
22. hanges of RBC aggregation in oxygenation-deoxygenation: pH dependency and cell morphology,
Iwona Cicha,1 Yoji Suzuki,1 Norihiko Tateishi,2 and Nobuji Maeda1 1
23. Department of Physiology, School of Medicine, Ehime University, and 2 Department of Medical
Informatics, Ehime University Hospital, Ehime 791-0295, Japan Submitted 26 November 2002;
accepted in final form 17 February 2003
24. Stoltz, J.F. et al.: Experimental approach to rouleau formation. Comparison of three methods.
Biorheology Suppl. 1: 221-6 (1984)
25. Robinson S, Edwards HT, Dill DB. New records in human power. Science1937;85:409–10.
26. Ekblom B, Hermansen L. Cardiac output in athletes. J Appl Physiol1968;25:619–25.
27. Costill DL, Thomason H, Roberts E. Fractional utilization of the aerobic capacity during distance
running. Med Sci Sports1973;5:248–52.
28. Farrell PA, Wilmore JH, Coyle EE, et al. Plasma lactate accumulation and distance running
performance. Med Sci Sports1979;11:338–44.
29. Rowell LB. Human circulation regulation during physical stress. New York: Oxford University
Press, 1986:1–416.
30. Saltin B, Strange S. Maximal oxygen uptake: “old” and “new” arguments for a cardiovascular
limitation. Med Sci Sports Exerc 1992;24:30–7.
31. Åstrand P-O. Experimental studies on physical working capacity in relation to sex and age.
22
© Copyright 2018, Dale C. Gledhill. All rights reserved.Copenhagen: Ejnar Muksgaard, 1952.
32. Åstrand P-O, Rodahl K. Textbook of work physiology. New York: McGraw-Hill Book Company,
1977.
33. Kanstrup I, Ekblom B. Blood volume and hemoglobin concentration as determinants of maximal
aerobic power. Med Sci Sports Exerc1984;16:256–62.
34. Ekblom B, Goldberg AN, Gullbring B. Response to exercise after blood loss and reinfusion. J Appl
Physiol1972;33:175–80.
35. Ekblom B, Wilson G, Åstrand P-O. Central circulation during exercise after venesection and
reinfusion of red blood cells. J Appl Physiol1976;40:379–83.
36. Berglund B, Hemmingsson P. Effect of reinfusion of autologous blood on exercise performance in
cross-country skiers. Int J Sports Med1987;8:231–3.
37. Sawka MN, Joyner MJ, Miles DS, et al. American College of Sports Medicine position stand: the use
of blood doping as an ergogenic aid. Med Sci Sports Exerc1996;28:i–viii.
38. Berglund B, Hemmingsson P, Birgegard G. Detection of autologous blood transfusions in cross-
country skiers. Int J Sports Med1987;8:66–70.
39. Joyner MJ. News brief: altitude training, erythropoietin, and blood doping. Exerc Sport Sci
Rev2002;3:97–8.
40. Ekblom B, Berglund B. Effect of erythropoietin administration on maximal aerobic power. Scand J
Med Sci Sports1991;1:88–93.
41. Stray-Gundersen J, Chapman RF, Levine BD. “Living high-training low” altitude training improves
sea level performance in male and female elite runners. J Appl Physiol 2001;91:1113–20.
42. Lowe GDO, Lee AJ, Rumley A, Price JF, Fowkes FGR. Blood Viscosity and Risk of Cardiovascular
Events: the Edinburgh Artery Study. British Journal of Haematology. 1997;96:168–173.
43. Dintenfass L. Blood-pressure and Blood Viscosity in Coronary Heart-Disease. Lancet. 1978;2:993–
994.
44. Letcher RL, Chien S, Pickering TG, Seally JE, Laragh JH. Direct Relationship Between Blood
Pressure and Blood Viscosity in Normal and Hypertensive Subjects; Role of Fb and Concentration.
Am. J. Med. 1981;7:1195–1202.
45. Chien S. Blood Rheology in Myocardial Infarction and Hypertension. Biorheology. 1986;23:633–
653
46. Chabanel A, Schachter D, Chien S. Increased Rigidity of Red Cell Membrane in Young
Spontaneously Hypertensive Rats. Hypertension. 1987;10(6):603–607.
23
© Copyright 2018, Dale C. Gledhill. All rights reserved.47. Chabanel A, Chien S. Blood Viscosity as a Factor in Human Hypertension. In: Laragh JH, Brenner
BM, editors. Hypertension Phatophysiology, Diagnosis and Management. Raven Press; New York:
1990. pp. 329–337
48. London M. The Role of Blood Rheology in Regulating Blood Pressure. Clinical Hemorheology and
Microcirculation. 1997;17:93–106.
49. Cicco G, Pirrelli A. Red Blood Cell (RBC) Deformability, RBC Aggregability and Tissue
Oxygenation in Hypertension. Clinical Hemorheology and Microcirculation. 1999;21:169–177.
50. Meiselman HJ. Hemorheologic Alterations in Hypertension: Chicken or Egg? Clinical
Hemorheology and Microcirculation. 1999;2:195–200.
51. Lund-Johansen P. The Hemodynamics of Hypertension. In: Robertson JIS, editor. Handbook of
Hypertension. Elsevier; Amsterdam: 1983. pp. 151–173.
52. Lominadze D, Joshua IG, Schuschke DA. Blood Flow Shear Rates in Arterioles of Spontaneously
Hypertensive Rats at Early and Established Stages of Hypertension. Clinical and Experimental
Hypertension. 2001;23(4):317–328.
53. Kurose I, Wolf R, Cerwinka W, Granger DN. Microvascular Responses to Ischemia/Reperfusion in
Normotensive and Hypertensive Rats. Hypertension. 1999;34:212–216.
54. Zilliacus KW. Intravascular Erythrocyte Aggregation and the Sedimentation Reaction in Local
Inflammation in the Tissues. Acta Med. Scand. 1951;140:149–151.
55. Mchedlishvili G. Investigation of the Mechanism of Capillary Stasis; Proceedings of the Institute of
Physiology; Georgian Academy of Sciences. 1953.pp. 279–292.
56. Bloch EH. Microscopic Observations of the Circulating Blood in the Bulbar Conjunctiva in Man in
Health and Disease. Ergebn. Anat. Entwicklungsgesch. 1956;35:1–98.
57. Knisely MH. Intravascular Erythrocyte Aggregation. In: Renkin EM, Michel CC, editors. Handbook
of Physiology. Vol. 3. American Physiological Society; Bethesda: 1965. pp. 2249–2292. Sect. 2
(Circulation).
58. Gustafsson L, Appelgren L, Myvold HE. Effects of Increased Plasma Viscosity and Red Blood Cell
Aggregation on Blood Viscosity in vivo. Am. J. Physiol. 1981;241 Heart Circ. Physiol. 10:H513–
H518.
59. Gustafsson L, Appelgren L, Myvold HE. Blood Flow and in vivo Apparent Viscosity in Working
and Non-working Skeletal Muscle of the Dog After High and Low Molecular Weight Dextran.
Circulation Research. 1981;48:465–469.
60. Maspers M, Bjornberg J, Mellender S. Relation Between Capillary Pressure and Vascular Tone
Over the Range from Maximum Dilatation to Maximum Constriction in Cat Skeletal Muscle. Acta.
24
© Copyright 2018, Dale C. Gledhill. All rights reserved.Physiol. Scand. 1990;140:575–592.
61. Vicaut E, Hou X, Decuypere L, Taccoen A, Duvelleroy M. Red Blood Cell Aggregation and
Microcirculation in Rat Cremaster Muscle. Inter. J. Microcirc. Clin. Exp. 1994;14:14–21.
62. Cabel M, Meiselman HJ, Popel AS, Johnson PC. Contribution of Red Cell Aggregation to Venous
Vascular Resistance in Skeletal Muscle. Am. J. Physiol. 1997;272 Heart Circ. Physiol. 41:H1020–
H1032.
63. Mchedlishvili G, Gobejishvili L, Mamaladze A, Momtselidze N, Varazashvili M. Microcirculatory
Stasis Induced by Hemorheological Disorders: Further Evidence. Microcirculation. 1999;6:97–106.
64. Letcher RL, Chien S, Pickering TG, Laragh JH. Elevated Blood Viscosity in Patients with Borderline
Essential Hypertension. Hypertension. 1983;5:757–762.
65. Zannad F, Stoltz J-F. Blood Rheology in Arterial Hypertension. Journal of Hypertension.
1992;10(suppl 5):S69–S78.
66. Lominadze D, Joshua IG, Schuschke DA. Increased Erythrocyte Aggregation in Spontaneously
Hypertensive Rats. Am. J. Hypertens. 1998;11:784–789.
67. Chen C-M, Schachter D. Elevation of Plasma Immunoglobulin A in the Spontaneously
Hypertensive Rat. Hypertension. 1993;21:731–738.
68. Lip GJH, Beevers DG. Abnormalities of Rheology and Coagulation in Hypertension. Journal of
Human Hypertension. 1994;8(9):693–702.
69. Weng X, Cloutier G, Beaulieu R, Roederer GO. Influence of Acute-phase Proteins on Erythrocyte
Aggregation. Am. J. Physiol. 1996;271 Heart Circ. Physiol. 40:H2346–H2352.
70. Chien S, Jan KM. Ultrastructural Basis of the Mechanism of Rouleaux ormation. Microvascular
Research. 1973;5:155–166.
71. Chien S. Biophysical Behavior of Red Cells in Suspensions. In: Surgenor DM, editor. The Red Blood
Cell. Vol. 2. Academic press; New York: 1975. pp. 1031–1133. chapter 26.
72. Armstrong JK, Meiselman HJ, Fisher TC. Evidence Against Macromolecular “bridging” as the
Mechanism of Red Cell Aggregation Induced by Nonionic Polymers. Biorheology. 1999;36(4–
5):433–437
73. Evans E, Needham D. Attraction Between Lipid Bilayer Membranes in Concentrated Solutions of
Nonadsorbing Polymers: Comparison of Mean-field
74. Theory with Measurements of Adhesion Energy. Macromolecules. 1988;21:1822–1831.
75. Barnes G, Frieden E. Ceruloplasmin Receptors of Erythrocytes. Biochemical and Biophysical
Research Communications. 1984;125(10):157–162.
25
© Copyright 2018, Dale C. Gledhill. All rights reserved.76. Lominadze D, Dean WL. Involvement of Fibrinogen Specific Binding in Erythrocyte Aggregation.
FEBS Letters. 2002 In press.
77. Blankenship KA, Dawson CB, Aronoff GR, Dean WL. Tyrosin Phosphorylation of Human Platelet
Plasma Membrane Ca2+ -ATPase in Hypertension. Hypertension. 2000;35:103–107.
78. Lominadze D, Kuchukhidze G, Momtselidze N, Aloeva M, Shakarishvili R, Mchedlishvili G,
Joshua IG, Schuschke DA. Alteration of Erythrocyte Aggregability During Hypertension. FASEB J.
2000;14(4):A672. Abstract.
79. Shiga T, Maeda N, Kon K. Erythrocyte Rheology. Critical Reviews in Oncology-Hematology.
1990;10(1):9–48.
80. Stamatoglou SC, Ge RC, Mills G, Butters TD, Zaidi F, Hughes RC. Identification of a Novel
Glycoprotein (AGp110) Involved in Interactions of Rat Liver Parenchymal Cells with Fibronectin.
Journal of Cell Biology. 1990;111(5 Pt 1):211–2127.
81. Piccardoni P, Sideri R, Manarini S, Piccoli A, Martelli N, de Gaetano G, Cerletti C, Evangelista V.
Platelet/Polymorphonuclear Leukocyte Adhesion: A New Role for SRC Kinases in Mac-1 Adhesive
Function Triggered by P-Selectin. Blood. 2001;98(1):108–116.
82. Huang CR in: Biorheology. 1987;24(6):795-801. Thixotropic properties of whole blood from healthy
human subjects.
83. Samsel RW, Perelson AS.: Biophys J. 1982 Feb;37(2):493-514. Kinetics of rouleau formation. I. A
mass action approach with geometric features.
84. Samsel RW, Perelson AS in: Biophys J. 1984 Apr;45(4):805-24. Kinetics of rouleau formation. II.
Reversible reactions.
85. Stoltz JF, Gaillard S, Paulus F, Henri O, Dixneuf P.: Biorheology Suppl. 1984;1:221-6. Experimental
approach to rouleau formation. Comparison of three methods.
86. Fabry TL.: Blood. 1987 Nov;70(5):1572-6. Mechanism of erythrocyte aggregation and
sedimentation.
87. http://bloodjournal.hematologylibrary.org/cgi/content/full/107/11/4205
88. http://www.biophysj.org/cgi/content/full/78/5/2470
89. Cabel, M., H. J. Meiselman, A. S. Popel, and P. C. Johnson. 1997. Contribution of red blood cell
aggregation to venous vascular resistance in skeletal muscle. Am. J. Physiol. 272:H1020 –H1032.
90. Chen, S., G. Barshtein, B. Gavish, Y. Mahler, and S. Yedgar. 1994. Monitoring of red blood cell
aggregability in a flow-chamber by computerized image analysis. Clin. Hemorheol. 14:497–508.
91. Chen, S., B. Gavish, S. Zhang, Y. Mahler, and S. Yedgar. 1995. Monitoring of aggregate morphology
26
© Copyright 2018, Dale C. Gledhill. All rights reserved.under flow by computerized image analysis. Biorheology. 32:487– 496.
92. Chien, S. 1987. Physiological and pathophysiological significance of hemorheology. In Clinical
Hemorheology. S. Chien, J. Dormandy, E. Ernst, and A. Martrai, editors. Martinus Nijhoff,
Amsterdam. 125.
93. Das, B., G. Enden, and A. S. Popel. 1997. Stratified multiphase model for blood flow in a venular
bifurcation. Ann. Biomed. Eng. 25:135–153.
94. Jones, J. G. 1990. New aspect of red cell aggregation. J. R. Soc. Med. 83:663– 664.
95. Kernic, D., A. W. L. Jay, S. Rowlands, and L. Skibo. 1973. Experiments on rouleau formation. Can. J.
Physiol. Pharmacol. 51:690 – 699.
96. Knisely, M. H., E. H. Bloch, T. S. Eliot, and L. Warner. 1947. Sludged blood. Science. 106:431– 441.
97. Ponder, E. 1924. On sedimentation and rouleaux formation. Q. J. Exp. Physiol. 16:173–194.
98. Ponder, E. 1947. Sedimentation: blood. In Medical Physics. Year Book Publishers, Chicago. 1408
–1415.
99. Samsel, R. W., and A. S. Perelson. 1982. Kinetics of rouleau formation. I. A mass action approach
with geometric features. Biophys. J. 37: 493–514.
100. Samsel, R. W., and A. S. Perelson. 1982. Kinetics of rouleau formation. I. A mass action approach
with geometric features. Biophys. J. 37: 493–514.
101. Shiga, T., K. Imaizumi, N. Harada, and M. Sekiya. 1983. Kinetics of rouleaux formation using TV
image analyzer. I. Human erythrocytes. Am. J. Physiol. 245:H252–H258.
102. Smoluchowski, M. V. 1917. Veruch einer mathematischen theorie der koagulationkinetik kolloider
losungen. Z. Phys. Chem. 192:129 –168.
103. Stoltz, J. F., and M. Donner. 1987. Hemorheology
27
© Copyright 2018, Dale C. Gledhill. All rights reserved.You can also read