PERCEPTION OF NIGERIAN DÙNDÚN TALKING DRUM PERFORMANCES AS SPEECH-LIKE VS. MUSIC-LIKE: THE ROLE OF FAMILIARITY AND ACOUSTIC CUES - MPG.PURE
←
→
Page content transcription
If your browser does not render page correctly, please read the page content below
ORIGINAL RESEARCH
                                                                                                                                             published: 20 May 2021
                                                                                                                                    doi: 10.3389/fpsyg.2021.652673

                                            Perception of Nigerian Dùndún
                                            Talking Drum Performances as
                                            Speech-Like vs. Music-Like: The
                                            Role of Familiarity and Acoustic Cues
                                            Cecilia Durojaye 1,2* † , Lauren Fink 1,3† , Tina Roeske 1 , Melanie Wald-Fuhrmann 1,3 and
                                            Pauline Larrouy-Maestri 3,4
                                            1
                                             Department of Music, Max Planck Institute for Empirical Aesthetics, Frankfurt am Main, Germany, 2 Department
                                            of Psychology, Arizona State University, Tempe, AZ, United States, 3 Max Planck-NYU, Center for Language, Music,
                                            and Emotion, Frankfurt am Main, Germany, 4 Neuroscience Department, Max Planck Institute for Empirical Aesthetics,
                                            Frankfurt am Main, Germany

                         Edited by:
                  Laura McPherson,          It seems trivial to identify sound sequences as music or speech, particularly when the
    Dartmouth College, United States
                                            sequences come from different sound sources, such as an orchestra and a human
                       Reviewed by:
                                            voice. Can we also easily distinguish these categories when the sequence comes from
                  Elizabeth Margulis,
   Princeton University, United States      the same sound source? On the basis of which acoustic features? We investigated
                   Aaron Carter-Enyi,       these questions by examining listeners’ classification of sound sequences performed
   Morehouse College, United States
                                            by an instrument intertwining both speech and music: the dùndún talking drum. The
                   *Correspondence:
                      Cecilia Durojaye
                                            dùndún is commonly used in south-west Nigeria as a musical instrument but is also
                    cdurojay@asu.edu        perfectly fit for linguistic usage in what has been described as speech surrogates in
     † These   authors have contributed     Africa. One hundred seven participants from diverse geographical locations (15 different
                    equally to this work
                                            mother tongues represented) took part in an online experiment. Fifty-one participants
                   Specialty section:       reported being familiar with the dùndún talking drum, 55% of those being speakers of
         This article was submitted to      Yorùbá. During the experiment, participants listened to 30 dùndún samples of about
                  Language Sciences,
                                            7s long, performed either as music or Yorùbá speech surrogate (n = 15 each) by a
               a section of the journal
               Frontiers in Psychology      professional musician, and were asked to classify each sample as music or speech-
         Received: 12 January 2021          like. The classification task revealed the ability of the listeners to identify the samples as
           Accepted: 21 April 2021          intended by the performer, particularly when they were familiar with the dùndún, though
           Published: 20 May 2021
                                            even unfamiliar participants performed above chance. A logistic regression predicting
                            Citation:
        Durojaye C, Fink L, Roeske T,       participants’ classification of the samples from several acoustic features confirmed the
              Wald-Fuhrmann M and           perceptual relevance of intensity, pitch, timbre, and timing measures and their interaction
 Larrouy-Maestri P (2021) Perception
                                            with listener familiarity. In all, this study provides empirical evidence supporting the
    of Nigerian Dùndún Talking Drum
   Performances as Speech-Like vs.          discriminating role of acoustic features and the modulatory role of familiarity in teasing
   Music-Like: The Role of Familiarity      apart speech and music.
                  and Acoustic Cues.
          Front. Psychol. 12:652673.        Keywords: speech surrogacy, Yorùbá, categorization, amplitude modulation spectrum, pitch, intensity, timbre,
    doi: 10.3389/fpsyg.2021.652673          timing

Frontiers in Psychology | www.frontiersin.org                                     1                                           May 2021 | Volume 12 | Article 652673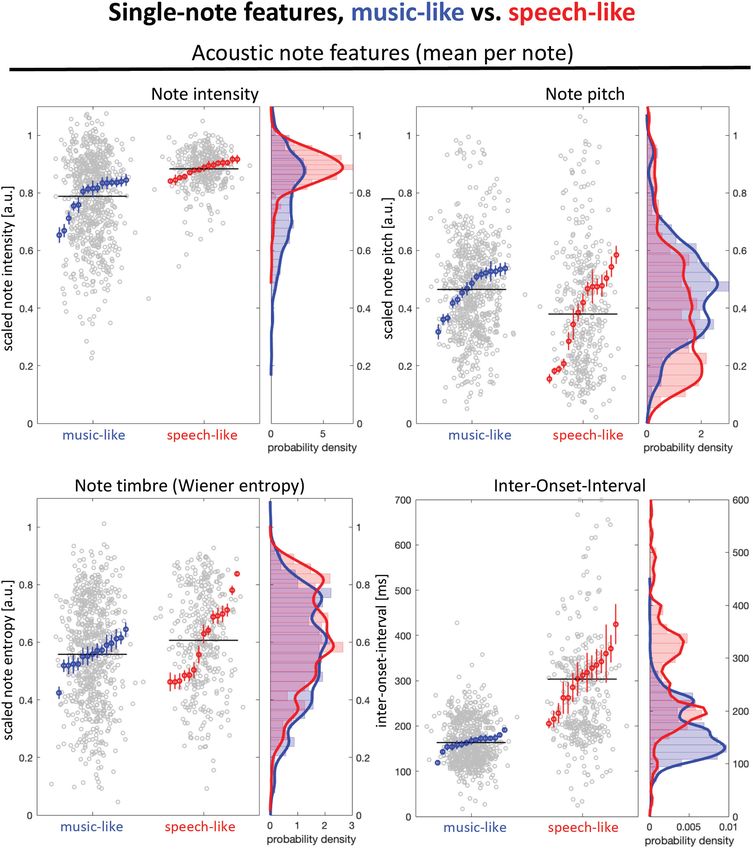
Durojaye et al.                                                                                                             Talking Drum Perception

INTRODUCTION                                                                et al., 2013) are altered as a function of listener familiarity with
                                                                            a stimulus type. Regarding pitch, Weidema et al. (2016) showed
When we turn on the radio it seems trivial to determine                     that the same contours are perceived differently depending on the
whether what we are hearing is music or someone speaking.                   context in which they are embedded, with better discrimination
Sound sequences can generally be described in terms of                      in music than speech context. These studies highlight that the role
pitch, timbre, and timing (e.g., Kraus et al., 2009); acoustical            of specific acoustic features in shaping perceptual categorization
differences have been shown between sequences associated with               may, in part, be driven by previous exposure.
music and language domains. For instance, speech typically                      Acoustically, sound sequences from music and language
comprises many gliding tones and more variation in pitch                    domains can be defined in several ways, with summary statistics
trajectory than (Western) music (Patel, 2008), with a temporal              (i.e., mean), as reported earlier, but also in terms of changes over
modulation spectrum peaking around 5 Hz, approximating the                  time. In the case of pitch, for example, speech and music are
syllable rate (Ding et al., 2017). On the other hand, music is              rarely monotonous. In speech, the intonation or pitch direction
characterized by discrete pitches sustained for longer durations            (e.g., utterances interpreted as statements or questions, Bolinger,
(Zatorre and Baum, 2012), and a temporal modulation spectrum                1986; Ladd, 2008), the pitch accent (e.g., Ladd et al., 1999),
peaking around 2 Hz, approximating the average beat rate                    or the prosodic patterns (e.g., Bänziger and Scherer, 2005;
(Ding et al., 2017). However, note that such studies often                  Kraljic and Brennan, 2005; Dilley and McAuley, 2008), play a
examine material that has different sound sources, such as the              considerable role in carrying paralinguistic information, such as
human voice vs. musical instruments, which might enhance the                the emotional state (Banse and Scherer, 1996) or the intention
distinctive characteristics of the sequences associated with each of        (Hellbernd and Sammler, 2016) of the speaker. Additionally,
the two categories.                                                         pitch contrasts and thus changes of pitch over time additionally
    When coming from the same source (e.g., the vocal                       carry lexical information in tonal languages (Yip, 2002; Carter-
instrument), music and language categories can show a certain               Ényì and Carter-Ényì, 2016). In music, changes of pitch over
overlap. For instance, certain types of speech are considered               time also provide crucial information that allow listeners to
more musical than others (e.g., child-directed speech, rhymes,              recognize, evaluate, and enjoy a musical performance. There exist
poetry), while certain types of vocal music are considered speech-          different musical (cultural) systems that define pitch movements,
like (e.g., rap). To better understand the ambiguity of vocal               with specific scales and rules (Krumhansl, 1979; Lerdahl and
stimuli, Merrill and Larrouy-Maestri (2017) presented several               Jackendoff, 1983; Cross, 2001; Ringer, 2002; Thompson, 2013),
versions of Arnold Schoenberg’s Pierrot lunaire—a piece notable             but some features such as the presence of small intervals
for its use of sprechstimme or “speech-song” (Stadlen, 1981)—to             or descending melodies are present in different cultures (e.g.,
vocal experts and found a large variety in the description of the           Huron, 2001) and have been described as statistical universals
material, from very spoken-like to very sung-like. Interestingly,           for music (Savage et al., 2015). Besides the relevance of pitch
the same exact material can be interpreted as either song or                changes over time (in addition to mean pitch), a large range
speech. A phenomenon called the speech-to-song illusion has                 of literature in the music and language domains supports the
been reported by Deutsch et al. (2008, 2011): A spoken sentence             perceptual relevance of changes in other dimensions such as
can be perceived as sung after several repetitions. In other words,         timbre, intensity, or duration. It is thus important to explore
the same acoustic contents can be perceived as belonging to                 acoustic features that take into account dynamics (rather than
two distinct categories, which makes it difficult to identify clear         means) not only with regard to pitch, but also more broadly in
boundaries between speech and music, even in a culture in which             the dimensions of timing, timbre, and intensity.
the idea of contrasting categories is widely accepted (see Brown,               In this study, we further examine speech-music specificities by
2000 for a gradual view of music-language). Further, it has been            employing an instrument intertwining language and music: the
shown that categorization, in the context of the speech-to-song             dùndún talking drum. The dùndún is commonly used in south-
illusion task, changes when the material is difficult to pronounce          west Nigeria as a musical instrument. The dùndún of the Yorùbá
(Margulis et al., 2015) or to understand (Jaisin et al., 2016), which       is played by people of all ages, though mostly men, and in a variety
supports the role of listeners’ familiarity or prior knowledge in           of sacred and secular cultural contexts (Durojaye, 2020). It is
stimulus categorization (Vanden Bosch der Nederlanden et al.,               used to play musical rhythms without semantic information but
2015) and suggests a potential downside of using vocal stimuli,             also to communicate announcements, warnings, prayer, jokes,
which are highly familiar to listeners.                                     proverbs, or poetry (Sotunsa, 2009). While a dùndún ensemble
    In the present study, we focus on the perceptual categorization         consists of drums of varying sizes and functions, we focus here
of non-vocal material into speech-like vs. music-like, as                   on the ìyá ìlù dùndún—the lead drum in the ensemble—usually
well as the role of familiarity in shaping these categories.                performing the role of “talker” during performance, imitating
Familiarity/culture effects on the perception of speech and music           Yorùbá, which is a tonal language, in what has been described as
are well-described (Palmer and Krumhansl, 1987; Morrison and                speech surrogacy (Durojaye et al., in review; McPherson, 2018).
Demorest, 2009; Perrachione et al., 2011; Bregman and Creel,                Villepastour, in her analysis of bàtá drums—a very close relative
2014; Sharma et al., 2020). With respect to timbre, familiar                of the dùndún—argues for the interdependence of speech tone
sound sources are recognized more quickly than unfamiliar ones              and music and highlights the significance of relative pitch and
(Siedenburg and McAdams, 2016). In the time domain, both                    rhythm in the surrogacy system of the dùndún (Villepastour,
rhythm (Hannon et al., 2012) and meter perception (Kalender                 2010, 2014).

Frontiers in Psychology | www.frontiersin.org                           2                                      May 2021 | Volume 12 | Article 652673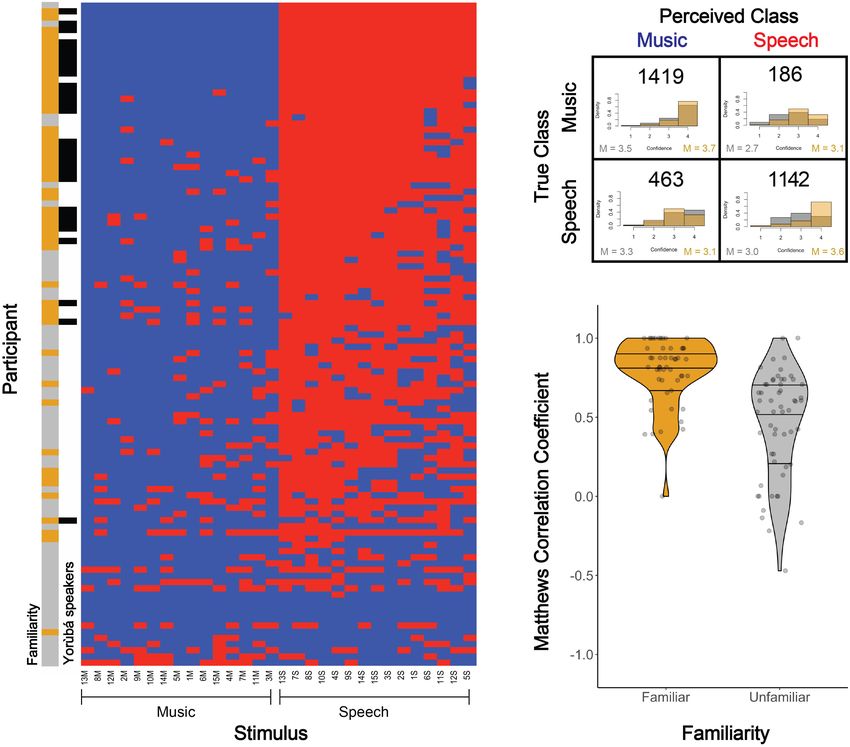
Durojaye et al.                                                                                                                                Talking Drum Perception

  FIGURE 1 | Transcription of a Yorùbá proverb played on the dùndún (stimulus 6S in our corpus). The dots placed on the three horizontal lines represent a schematic
  depiction of the pitch changes (high, medium, or low) as the phrase written underneath would be spoken in the Yorùbá language. The phrase translates to “Public or
  private, there is no place the God cannot see, public or private.” Though the phrase would typically be spoken without the repetition at the end, when played on the
  dùndún the proverb is elaborated by repetition of the first phrase (gray shaded areas), as repetition is often a means to provide context and remove ambiguity in
  meaning (Stern, 1957; Arewa and Adekola, 1980).

    The Yorùbá language uses three relative tone levels: Low                           MATERIALS AND METHODS
(grave accent), Middle (usually left unmarked), and High
(acute accent). The tone levels are vital to distinguish the                           The experimental procedure was in accordance with guidelines
meaning of words (Carter-Ényì and Carter-Ényì, 2016). Like                             ethically approved by the Ethics Council of the Max Planck
the language, the drum also consistently employs three relative                        Society. Participants provided informed consent before
tone levels. The dùndún is a waisted (hourglass shaped), double-                       proceeding with the study.
headed membrane drum, with gut or leather cords securing
the skins around the wooden frame of the drum. The cords                               Participants
are manipulated with one hand, while the other strikes the top                         One hundred and seven participants (36 self-reported as females,
membrane with a curved stick. Pressure on the cords changes                            71 as males, aged from 18 to 75 years old, M = 39.22,
the pitch of the drum, allowing for a full octave range and                            SD = 15.06) were recruited via the research participant database
effects like glissandi (Blades, 1992; Euba, 1990). For the drum                        of the Max Planck Institute for Empirical Aesthetics and
to produce the lowest pitch, minimal pressure is applied on                            via personal contacts. From various geographical locations
the cords; the more the pressure, the higher the frequency.                            (15 different mother tongues were represented), fifty-one
Thus, the drum can manipulate tone levels and contours, as in                          participants reported being familiar with the dùndún talking
Yorùbá language. This imitation is confirmed by recent acoustical                      drum (i.e., they knew about the dùndún prior to the survey).
analyses of mono or disyllabic words performed on the drum                             Of these 51 participants, 28 (55%) were speakers of Yorùbá.
which demonstrated that the three Yorùbá tones (Low, Middle,                           Participants declared to have normal hearing ability and
and High) are produced on a global level with three measurably                         reported various musical training levels. Participants received no
different fundamental frequencies (Akinbo, 2019). The technique                        financial compensation.
of representing syllables can take many forms such as (1) using
one drum stroke for each syllable (as for a single tone level and                      Material
vowel elisions); (2) many strokes for one syllable; (3) one drum                       Thirty-six dùndún samples were created from performances
stroke for two or more syllables; (4) one drum stroke for a syllable                   by one professional dùndún musician from Ibadan, South-
with many speech tone levels as would be the case for some glides,                     West Nigeria. The performer (male) is a native Yorùbá and
or assimilations (see also, Euba, 1990; Villepastour, 2010, for bàtá                   fluent English speaker with more than 25 years of experience
drums). A transcription of dùndún “talking” is provided as an                          playing the drum. Performances were recorded at a local music
example in Figure 1.                                                                   studio with a SHURE SM57 dynamic microphone directed at
    In the experiment outlined below, we seek to identify acoustic                     the face of the drum, at a 3-inch distance, sampling at 44.1
features associated with the perception of speech-like vs. music-                      kHz. Note that clicks and environmental noise can be heard in
like dùndún performances and the potential role of familiarity                         some recordings.
in such classification. To do so, we first compared speech-like                           Half of the performances were music-like material consisting
vs. music-like dùndún performances with regard to different                            of Yorùbá àlùjó rhythms (literally dance drumming); the other
acoustic features related to pitch, intensity, timbre, and timing.                     half were speech-like material, composed of Yorùbá proverbs
Second, we presented the same samples to familiar and unfamiliar                       and oríkì (poetry). The performer was first asked to use the
listeners and examined their ability to classify the performances                      drum to say different phrases (“talk”), after which he was
as intended by the performer, as well as their confidence in the                       asked to “drum” (the equivalent of music). All instructions
classification. Finally, a statistical model was created to quantify                   were given in the Yorùbá language. Note that in Yorùbá
the role of listener familiarity and acoustic features of dùndún                       dùndún performances, when drummers say they “talk” with
performance, in predicting listeners’ perception of dùndún as                          the drum, they refer to the performance of oríkì, proverbs,
speech-like vs. music-like.                                                            or the signal mode of the drum. Similarly, when they talk

Frontiers in Psychology | www.frontiersin.org                                      3                                             May 2021 | Volume 12 | Article 652673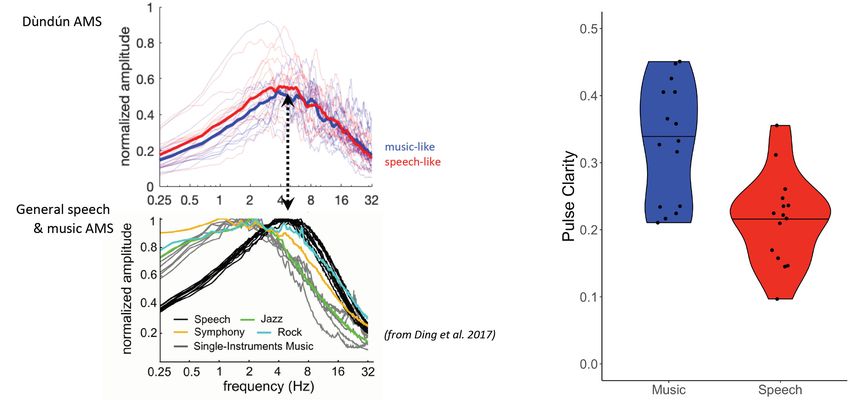
Durojaye et al.                                                                                                            Talking Drum Perception

about “drumming” or “playing music” (for those who use                    had failed, we manually outlined note onsets with custom-
the English term), they are making a reference to àlùjó.                  written MATLAB code.
These categories were confirmed by the performer after the
task. Also note that dance rhythms, proverbs, and poetry                  Acoustic Measures of Interest
are used for any occasion (e.g., weddings, burials, religious             First, we computed the amplitude modulation spectra of the
events). In the current performances, the “talking” contents              recordings, following the procedure of Ding et al. (2017),
covered various themes, such as a praise to a deity, prayers,             with MATLAB code kindly provided by Nai Ding. In brief,
vilification, and admonition.                                             we extracted the sound envelope in narrow frequency bands
    To confirm that the performances clearly represented the              (corresponding to frequency bands used by the human cochlea),
category of speech or music, all recordings were presented to             then, following a re-scaling procedure, we calculated the root
three independent professional dùndún drummers located in                 mean square of the Discrete Fourier Transform of each
Nigeria and South Africa. The judges were asked to categorize             frequency band and binned over frequencies. High frequencies
the performances according to whether they represented speech             in the amplitude modulation spectrum correspond to fast
or music. Like the performer, they used the terms àlùjó, oríkì,           modulations of intensity, low frequencies to slow modulations
owe (proverbs), in their responses. The 30 samples on which the           (for details, see Ding et al., 2017). We then calculated the
judges unanimously agreed to represent speech (n = 15) or music           peak frequency in the spectrum (i.e., the frequency exhibiting
(n = 15) were selected. The duration of the samples ranged from           the greatest amplitude modulation), for each recording. To
5 to 10 s (M = 7.37 s, SD = 1.1 s). All recordings can be accessed        further analyze differences in timing, we also computed the
at:        https://edmond.mpdl.mpg.de/imeji/collection/ovmWl7             inter-onset interval (IOI, in ms) between notes, the two-interval
rLtIiGSv1v.                                                               ratio: interval1/(interval1+interval2), and the pulse clarity. The
                                                                          first measure corresponds to the timing at the note level and
Procedure                                                                 the second to the change in timing between consecutive time
                                                                          intervals. A short interval preceding a long interval would result
The task was implemented as an online experiment in
                                                                          in a ratio < 0.5, a short interval following a longer one has a
Unipark Enterprise Feedback Suite (QuestBack GmbH, Cologne,
                                                                          ratio > 0.5, and an isochronous rhythm of two similar intervals
Germany). Prior to the classification task, a brief presentation of
                                                                          has a ratio of 0.5. Pulse clarity, a measure that estimates the
the dùndún was given (origin, uses, description, picture) without
                                                                          temporal regularity of events in the signal (Lartillot et al., 2008),
sound examples. The aim was to provide a basic knowledge
                                                                          was calculated using all recommended default parameters of the
for those who reported being unfamiliar with the drum or
                                                                          mirpulseclarity function from the music information retrieval
the potential use of this instrument as speech surrogates. To
                                                                          toolbox v.1.7.2 (i.e., using a frame length of 5 s, a hop factor of
determine participants’ familiarity with the dùndún, we asked
                                                                          10%, and the maximum value of the autocorrelation curve to
if they knew about the dùndún prior to the survey. Participants
                                                                          define clarity). Pulse clarity ranges between 0 (no clear pulse) and
were instructed to listen to each excerpt and to indicate whether
                                                                          1 (perfectly regular pulse).
it was best described as “speech-like” or “music-like.” For each
                                                                              Besides these time-related measures, we selected various
excerpt, the forced choice identification was followed by a
                                                                          features typically used to describe auditory signals: pitch,
confidence rating on a 4 point-scale (1 = not confident, 4 = very
                                                                          intensity, and timbre measures. At the note level and between
confident). The order of stimuli and response pattern (speech-
                                                                          consecutive notes, for each stimulus, we calculated: pitch height,
like button as the first or the second option) was randomized for
                                                                          intensity, and Wiener entropy (timbre, the maximum value is
each participant.
                                                                          a pure sine tone). Scaling was performed within recording,
                                                                          on the millisecond-wise acoustic features between the 0.5 and
Acoustic Analyses                                                         99.5th percentiles (instead of between minimum and maximum)
The analysis of acoustic features was carried out                         to exclude outliers. Amplitude envelope and Wiener entropy
in MATLAB 2018b (The MathWorks, Inc., Natick,                             were extracted from the audio in 10 ms time windows and
Massachusetts, United States).                                            steps of 1 ms using the MATLAB package Sound Analysis for
                                                                          MATLAB (by Sigal Saar). The pitch function from MATLAB
Segmentation                                                              Audio Toolbox (The MathWorks Inc., 2020) was used for
Segmentation of single notes was performed semi-automatically             pitch extraction. For pitch, intensity, and timbre measures
on each recording’s amplitude envelope, using an adaptive                 (as well as IOI and ratio), we also calculated the probability
threshold. First, amplitude envelopes were slightly smoothed              densities for each group of stimuli (music-like and speech-like).
with a Hodrick-Prescott (HP) filter (coefficient = 50). Then,             Additionally, we computed the average of each feature, across
the adaptive segmentation threshold was created by applying a             each stimulus, resulting in the following final measures: mean
stronger HP filter to the amplitude envelope (coefficient = #107 ).       pitch, mean intensity, and mean timbre; as well as average
The difference between the slightly smoothed amplitude envelope           of absolute differences between consecutive tones (leading
and the adaptive filter provided robust segmentation in most              to mean intensity change, mean timbre change, and mean
recordings. We visually inspected the segmented waveforms                 pitch change measures). Note that scaled values (0–1) were
and sonograms while listening to the audio to validate                    used to compute the measures capturing changes between
segmentation. In cases where the automated segmentation                   consecutive notes.

Frontiers in Psychology | www.frontiersin.org                         4                                       May 2021 | Volume 12 | Article 652673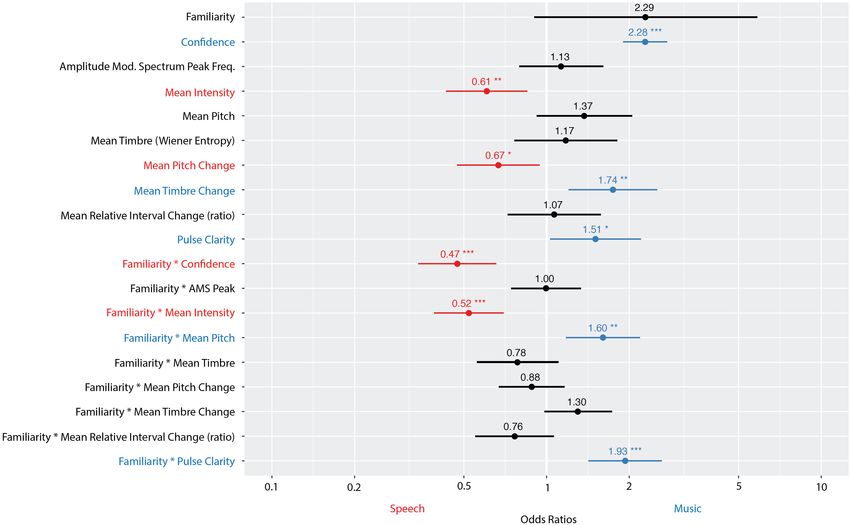
Durojaye et al.                                                                                                           Talking Drum Perception

Behavioral Analyses                                                       amplitude difference between adjacent notes (VIF = 8.27) were
Participants’ Classification of Stimuli                                   removed. Correlations between means of all acoustic features
Participants’ responses on the task can be summarized using a 2           are provided in Supplementary Figure 1. Note that inter-onset
× 2 contingency table, or confusion matrix M:                             interval has a high correlation with intensity [r(28) = 0.63,
                                                                          p < 0.001] and intensity difference [r(28) = −0.82, p < 0.001],
                         M = TP FN
                               h       i
                                                                          and that intensity and intensity difference have a high correlation
                                 FP TN                                    with each other [r(28) = −0.71, p < 0.001].
where we arbitrarily define music as positive and speech as
negative, such that true positives (TP) represent music intended
by the performer and classified by the listener, while true               RESULTS
negatives (TN) represent speech intended by the performer and
similarly classified by listener. TPs (music) and TNs (speech)            Acoustic Properties of Dùndún
represent correct classifications. False positives (FP) designate         Performances
instances of intended speech perceived as music, while false              We first investigated whether the amplitude modulation
negatives (FN) indicate cases of intended music perceived as              spectrum (AMS) systematically differs between speech-like and
speech.
h + i Perfect classification is thus defined as 0 FPs and FNs:            music-like dùndún stimuli, as the AMS has previously been
  n 0                                                                     shown to distinguish between speech (around 4–6 Hz) and
  0 n−
        . Accuracy on the task is defined as the number of correct
classifications, divided by the total number of observations:             different kinds of Western music (around 2 Hz). As illustrated
                                                                          in Figure 2A and confirmed via t-test, however, the AMS of the
                                        TP + TN                           two types of stimuli did not significantly differ [t (27.93) = 1.60,
                    accuracy =
                                   TP + TN + FP + FN                      p = 0.120, d = 0.59]; both peaked around 5 Hz, which corresponds
                                                                          to the previously established amplitude modulation rate typical
However, accuracy has been shown to be biased if the classes are
                                                                          of speech (Ding et al., 2017; Figure 2A, bottom panel). In terms
unbalanced (e.g., if there would be more instances of perceived
speech than music). Therefore, as widely used and recommended,            of pulse clarity, we find a significant difference between the
we computed Matthews Correlation Coefficient (MCC):                       two stimulus categories, with a greater pulse clarity (i.e., greater
                                                                          temporal regularity) in the music-like stimuli, t (26.14) = 4.03,
  MCC = √
                               TP × TN − FP × FN                          p < 0.001, d = 1.47 (Figure 2B).
                  (TP + FP) × (TP + FN) × (TN + FP) × (TN + FN)               In addition to the AMS measure, we examined four types of
                                                                          features (see section “Materials and Methods” for description of
MCC is robust to unbalanced datasets, and has been shown to               all measures) that could capture differences between music- and
be a more reliable measure than accuracy (Chicco and Jurman,              speech-like stimuli: intensity, pitch, timbre, and timing. Figure 3
2020). It is a measure of classification performance across all           illustrates each measure at the note level (mean for each stimulus
classes that takes into account the size of each class. MCC ranges        and their distribution). As reported in Table 1, we observed
between -1 and 1, with 0 indicating chance performance, 1 perfect         significant differences for intensity and timing, with higher
performance, and -1 perfect misclassification. As is common               intensity level (Figure 3A) and longer IOI (Figure 3D) in the
practice with MCC, in the case of 0 in the denominator, we set            speech-like recordings. Figure 4 illustrates each measure at the
the denominator to 1.                                                     consecutive note level (mean of differences between consecutive
                                                                          notes for each stimulus and their distribution). Besides being
Statistical Analyses
                                                                          louder, consecutive notes also varied less in intensity in the
Statistical analyses were conducted in R Core Team (2013).
                                                                          speech-like stimuli (Figure 4A), in line with the distribution
To compare acoustic measures between speech- and music-
                                                                          depicted in Figure 3A, with a narrower range for the speech-like
like dùndún recordings, we performed independent, two-tailed
                                                                          stimuli. Also, we observed that near-isochrony is very common in
t-tests. For measures relative to changes between consecutive
                                                                          both speech- and music-like excerpts (Figure 4D). However, in
notes, absolute (rather than signed) differences were used. At an
                                                                          music-like ones, intervals tend to speed up (the second interval
alpha of 0.05, the threshold p-value after correcting for multiple
                                                                          in an isochronous pair being a little shorter, moving the near-
comparisons (10 t-tests) was p = 0.005. Cohen’s d is used to report
                                                                          isochronous peak slightly right) while slowing down in speech-
effect sizes and was calculated in R using the cohen.d function in
                                                                          like ones (near-isochronous peak moved slightly left). Some very
the effsize package (Torchiano, 2020).
                                                                          high and very low ratios (due to a short interval next to a long
    To predict participants’ perception of the stimuli as music- or
                                                                          one) become apparent in the wider spread of speech-like data,
speech-like, a generalized linear mixed effects logistic regression
                                                                          in the top right scatter plot, and in the peaks of the probability
model was fit via maximum likelihood using the Laplace
                                                                          density plot, marked by arrowheads.
approximation method, with bound optimization by quadratic
approximation, implemented using the glmer function from the
lme4 package (Bates et al., 2015). Acoustic variables were centered       Listeners’ Classification of Dùndún
and scaled before being entered into the model. Multicollinearity         Performances
was checked using variance inflation factors (VIFs). Some                 As can be seen in Figure 5A, participants clearly separated
predictors had a VIF > 5 and, therefore, required removal from            the stimuli into two distinct speech vs. music categories
the model. Specifically, inter-onset-interval (VIF = 5.90) and            that largely aligned with the intention of the performer. We

Frontiers in Psychology | www.frontiersin.org                         5                                      May 2021 | Volume 12 | Article 652673
Durojaye et al. Talking Drum Perception
FIGURE 2 | (A) Amplitude modulation spectra of the dùndún performances (top panel). Thin lines are for AMS of individual recordings, thick lines represent the mean
for 15 music (blue) and 15 speech-like (red) stimuli. Bottom panel shows AMS for speech and music corpora from Ding et al. (2017) for comparison. Dashed arrow
illustrates that dùndún recordings peak at higher modulation rates than most Western music, namely rates that are typical for speech (black line) but also occur in
rock music (teal line). The lower panel in A is reprinted from Neuroscience and Biobehavioral Reviews, 81, Nai Ding, Aniruddh D. Patel, Lin Chen, Henry Butler,
Cheng Luo, David Poeppel, Temporal modulations in speech and music, 7, Copyright Elsevier Ltd. (2017), with permission from Elsevier. (B) Violin plots representing
the pulse clarity of the music (blue) and speech-like (red) stimuli. The black horizontal line indicates the median of both distributions. Black dots represent pulse clarity
for individual stimuli.
observed that only four participants categorized every sample speech). Within the speech category, 13S was most clearly
as music (solid blue rows near the bottom of the plot), perceived as speech, while 5S was most often confused for
whereas the large majority showed few confusions. Twelve music. Readers can access all stimuli online (link in section
participants exhibited perfect classification (top rows). In the “Materials and Methods”).
figure, within the speech and music categories, stimuli (columns) A confusion matrix for perceived vs. intended music and
are sorted by the number of errors made per stimulus speech-like performances is plotted in Figure 5B. Overall, the
(i.e., the left-most column, stimulus 13M, was least often average accuracy of participants on the task was 66%. The
confused for speech, while 3M was most often confused for average rate people perceived speech when the performance
was intended to be music was 12%, while the average rate
at which people perceived music when it was intended to be
speech was 29%. Collectively, these latter two rates indicate
TABLE 1 | Output of the independent t-tests carried out for the four types of
acoustic features (Intensity, Pitch, Timbre, and Timing) between music- and
that participants were more likely to perceive speech as music
speech-like stimuli. than music as speech. The illustration of confidence ratings
(underlying histograms in Figure 5B, with ratings from 1 to
Intensity Pitch Timbre Timing 4) showed similar patterns, with moderately high confidence
Mean for note t(18.18) = −5.37 t(20.61) = 2.06 t(18.84) = −1.38 t(16.18) = −8.53 even in the case of false classifications. Note, however, that
level the listeners who were unfamiliar (gray) with the dùndún
p < 0.001 p = 0.052 p = 0.185 p < 0.001 seem to be least confident when they perceive the stimulus
d = −1.96 d = 0.75 d = −0.50 d = −3.12 to be speech (right column in confusion matrix). Confidence
Mean change t(26.32) = 8.95 t(17.53) = −0.75 t(27.60) = 4.09 t(15.74) = 2.17 means for unfamiliar (gray) and familiar (gold) participants
for consecutive are displayed in the lower left and right corners of each
notes
quadrant, respectively.
p < 0.001 p = 0.465 p < 0.001 p = 0.046
Given the imbalance in perceiving speech vs. music, and
d = 3.27 d = −0.27) d = 1.49 d = 0.79
the statistical properties outlined in the methods, our main
For the four types of comparisons, measures consisted of the mean of all notes metric of interest for participants’ classifications of the stimuli
(Figure 2) and the mean of the absolute difference between all consecutive notes
was the Matthews Correlation Coefficient (MCC). An MCC
(Figure 3). Note that the threshold p-value (for an alpha of 0.05) after correcting
for multiple comparisons was p = 0.005. Thicker frames highlight the measures of 1 indicates perfect classification, 0 chance, and -1 perfect
significantly differing after correction. misclassification. Participants’ average MCC was 0.61 (±0.33).
Frontiers in Psychology | www.frontiersin.org 6 May 2021 | Volume 12 | Article 652673Durojaye et al. Talking Drum Perception
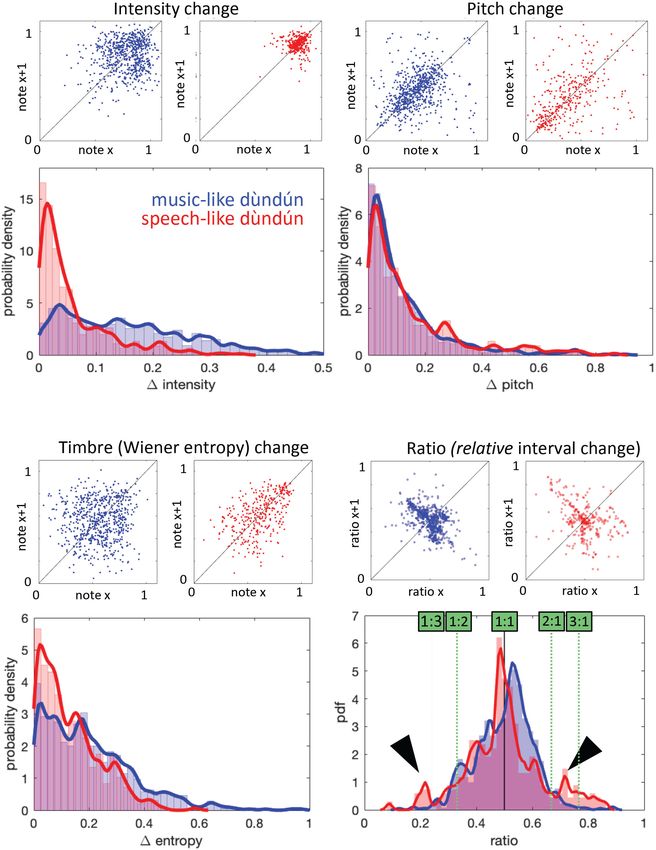
FIGURE 3 | Acoustic measures computed at the note level for music-like (blue) and speech-like (red) dùndún performances. (A) Mean intensity, (B) Mean pitch, and
(C) Mean timbre (Wiener entropy) (D) Mean inter onset intervals (IOI). Left panels show mean note values for 15 speech- and music-like pieces each in gray, with
mean and SEM per piece in color. Right panels show the respective probability densities.
Participants who were familiar1 with the dùndún exhibited unfamiliar with the dùndún [Welch’s independent two-tailed,
a significantly higher MCC, compared to those who were t-test: t (93.08) = 6.12, p < 0.001, Cohen’s d = 1.16, 1MCC = 0.33];
see Figure 5C; N.B. each participants’ familiarity (gold = familiar;
1 gray = unfamiliar) is plotted in the left color bar of Figure 5A).
We ran an additional t-test comparing the MCC of the subset of familiar
participants who did not speak Yorùbá to those unfamiliar and still found a large, Nonetheless, familiarity is not required to perform the task,
significant effect of familiarity, t (58.74) = 3.18, p = 0.002, d = 1.16, 1MCC = 0.211. as unfamiliar participants still exhibited an average MCC
Frontiers in Psychology | www.frontiersin.org 7 May 2021 | Volume 12 | Article 652673Durojaye et al. Talking Drum Perception FIGURE 4 | Acoustic measures computed at the level of consecutive notes for music-like (blue) and speech-like (red) dùndún performances. All measures are scaled from 0 to 1. (A) Mean intensity change: The top panel shows, for each pair of consecutive notes, the intensity of the pair’s first note on the x-axis, and of the second note on the y-axis. The diagonal line indicates where note pairs with two similar note intensities would fall. The bottom panel shows the probability density of intensity differences. (B,C) are the Mean pitch change and Mean timbre change, illustrated following the same logic as (A). (D) Similar illustration for change in IOIs, as measured by ratio = interval1 / (interval1+interval2). In the probability density plot (bottom), green boxes and dashed lines mark interval ratios in terms of “interval1: interval2,” an alternative way to describe interval ratios, commonly used in music theory. Frontiers in Psychology | www.frontiersin.org 8 May 2021 | Volume 12 | Article 652673
Durojaye et al.                                                                                                                                     Talking Drum Perception

  FIGURE 5 | Participants’ classification of music vs. speech-like dùndún performances. (A) Each participant’s (vertical axis) judgment of each stimulus (horizontal
  axis) as music (blue) or speech (red). Participant performance is sorted descending from least to most errors. Columns are sorted from left to right, within each
  category (speech and music), from least to most errors per stimulus. The color bar to the left of the plot indicates whether each participant was familiar (golden) or
  unfamiliar (gray) with the dùndún and whether they spoke Yorùbá (black) or not (white). (B) Confusion matrix for perceived vs. intended stimulus classes, with
  histograms of participants’ confidence ratings (1–4) for each response type (i.e., quadrant), grouped by familiarity (gold = familiar; gray = unfamiliar). Confidence
  rating densities were computed within each response type (quadrant) for each familiarity group separately. Means for unfamiliar (gray) and familiar (gold) groups are
  displayed in the lower left and right corners of each quadrant, respectively. (C) Violin plots and underlying data points indicating the Matthews Correlation Coefficient
  (MCC) for each participant, separated according to those who were familiar with the dùndún (golden) vs. unfamiliar (gray). The bottom and top horizontal black lines
  in each distribution represent the 25th and 75th percentiles, the middle line represents the median. An MCC of 1 indicates perfect classification; 0 represents
  chance, and -1 perfect misclassification.

of 0.46, well above chance (0), t (55) = 10.10, p < 0.001,                                logistic regression model. The binary dependent variable was
d = 1.35.                                                                                 participants’ perception (speech = 0, music = 1). On the stimulus
                                                                                          level, fixed effects included all measures reported in Figures 2–
                                                                                          4, except intensity difference and inter-onset-interval, which had
Predictors of Listeners’ Perception of                                                    to be excluded due to high correlation with intensity and each
Speech vs. Music                                                                          other (see section “Materials and Methods”). Since we observed
In an effort to understand which acoustic features were most                              an effect of familiarity on the classification performance index,
relevant in participants’ perception of the dùndún excerpts                               with better classification for listeners who were familiar with
as music vs. speech-like, we built a linear mixed effects                                 the dùndún, we included familiarity as a fixed effect and in

Frontiers in Psychology | www.frontiersin.org                                         9                                              May 2021 | Volume 12 | Article 652673
Durojaye et al. Talking Drum Perception FIGURE 6 | Odds ratios, with confidence interval (CI), for each fixed effect in a logistic regression model predicting participants’ perception of stimuli as music-like (1) or speech-like (0). The vertical line at 1 indicates no effect (i.e., any fixed effect predictor whose odds ratio CI overlaps 1 does not significantly predict participants’ perception). Fixed effects with an odds ratio 1 (blue) indicate that a high value on that feature leads to the perception of music. The significance of each fixed effect is indicated with stars (***p < 0.001, **p < 0.01, and *p < 0.05). Number of observations: 3,210. Familiarity was a binary predictor (0 = no; 1 = yes); confidence ranged from 0 to 3; all other variables were continuous. interaction with all acoustic measures. Confidence ratings were confident were more likely to classify the stimulus as music. These also entered as fixed effects. Random intercepts were included for confidence/familiarity results are in line with the general trends participants and stimuli. presented in Figure 5B. Figure 6 shows the odds ratios and confidence intervals for each fixed effect in the model. Fixed effects with an odds ratio 1 (blue) indicate that a high value on that feature leads to the perception of music. Overall, In this study, we used an instrument capable of speech surrogacy the model had a prediction accuracy of 85% and an MCC of 0.70. to explore the boundaries between speech and music. While The model explained a significant proportion of variance in the several instruments such as trumpets (Kaminski, 2008), flutes data, with a marginal R2 of 0.46 (amount of variance explained (Moore and Meyer, 2014), xylophones (Strand, 2009; Zemp and by fixed effects alone) and a conditional R2 of 0.65 (amount of Soro, 2010; McPherson, 2018), and whistling (Stern, 1957) can variance explained by fixed and random effects). produce speech surrogates, we focussed here on the dùndún Greater pulse clarity predicted perception of music. At the talking drum to examine listeners’ perception of music and note level, greater mean intensity predicted speech. In terms of speech and, more specifically, the role of acoustic features in changes between notes, greater changes in pitch predicted speech, distinguishing these two categories. To do so, we recorded expert while greater changes in timbre predicted music. However, dùndún performances, which have the advantage of being able to mean intensity, pitch and pulse clarity all interacted with create both musical and speech-like stimuli without requiring the participants’ familiarity (same direction of the overall effects human voice (highly familiar to all listeners). Acoustic measures but enhanced magnitude). Additionally, confidence predicted relative to pitch, timbre, intensity, and timing were used to the categorization “music-like,” and interacted with familiarity, describe the stimuli and we measured listeners’ ability to classify such that those familiar and confident were more likely to each performance into two pre-defined categories intended by the classify a given stimulus as speech, while those not familiar and performer: speech- or music-like. Frontiers in Psychology | www.frontiersin.org 10 May 2021 | Volume 12 | Article 652673
Durojaye et al.                                                                                                               Talking Drum Perception

   Participants could accurately classify the dùndún                          et al., 2020). In the current study, peaks stand around 5 Hz
performances in the category intended by the performer,                       for both music and speech-like dùndún. Though some musical
with an unsurprising bias toward the music-like category, given               styles have been shown to also peak around 5 Hz (e.g., rock),
that drums are more commonly associated with music than                       this rate is consistent with the modulation rate of speech
speech. Listeners who were familiar with the instrument seem                  (Ding et al., 2017). However, while Ding et al. (2017) analyzed
to have a clearer representation of what is grouped into speech               a variety of Indo-European languages (American and British
or music categories, as visible by their better classification                English, French, German, Swedish, Dutch, Danish, Norwegian;
performance. Such results could be driven by the fact that slightly           exception: Chinese), they did not include any Niger-Congo
over half of the familiar participants also reported speaking                 languages, such as Yorùbá, and only included Western types
Yorùbá, though the familiarity effect remained even when                      of music, which limits the generalizability of their findings.
Yorùbá-speaking participants were removed from the analysis.                  Here we extend Ding et al.’s AMS analysis to non-Western
In any case, if familiarity (broadly defined) or Yorùbá fluency               stimuli (dùndún) and show that its peak closely resembles
sharpens the categories, it is not required to perform the task,              that of speech. Future work might extend the AMS analyses
as shown by the above chance level MCC and relatively high                    to spoken Yorùbá and compare with that of the dùndún
confidence for participants who were not familiar with the                    to better understand the findings about the temporal aspect
instrument. Such results suggest the relevance of commonly                    reported here. Note also that, while mean IOI was significantly
recognized acoustic cues that shape each category but become                  different between the two types of stimuli, it unfortunately
fine-tuned through repeated exposure.                                         could not be included into our statistical model (like the
   In the current study, we asked broadly about listeners’                    mean intensity change measure), as it had high correlation
familiarity and thus are not able to disentangle what exactly                 with other features (Supplementary Figure 1). Thus, it could
underlies the familiarity effect. Teasing apart perceptual vs.                well be the case that participants are using IOI (as well
cultural vs. linguistic familiarity might all be of interest in future        as intensity changes) in their classification. This issue could
research. Additionally, manipulation of familiarity, via priming              be addressed by systematically manipulating IOI, as well as
or additional explicit information about the dùndún, might allow              mean intensity and intensity change, to tease apart their
one to quantify the amount and type of previous exposure                      perceptual relevance.
that affects the classification. Further, exploration of listeners’               Regarding the dynamic aspect of timing, the present study
perception of dùndún performances with less constrained answer                focused mainly on consecutive notes or intervals, though we did
types might reveal other categories that could include both music             include a measure of pulse clarity. Our pulse clarity metric was
and speech-like performances or less strong boundaries between                related to maxima in the autocorrelation function of our stimuli
these two culturally shaped categories (Brown, 2000).                         (i.e., periodic repetitions), but our measure set could also be
   The model proposed to examine the predictors of participants’              extended to perceived beat and/or meter (e.g., Tomic and Janata,
classification revealed that participants relied on several                   2008; London et al., 2017) or the detection of repeated patterns
features. Pulse clarity, mean note intensity, and mean timbre                 (e.g., via recurrence quantification analysis Fukino et al., 2016 or
change between consecutive notes were significant predictors.                 multi-fractal analysis Roeske et al., 2018). The analysis/evaluation
Additionally, familiarity seemed to amplify the effects of                    of longer stimuli would allow for application of a more extensive
pulse clarity and intensity in predicting music vs. speech,                   set of timing measures to investigate their role in speech vs.
respectively. These perceptual results are in line with those                 music distinction. Also, though our stimulus set is novel in that
we find to distinguish acoustically between the two different                 it consists of speech-like and music-like performances on the
stimulus categories. However, we also observed that features                  dùndún from the same performer, it is also limited in scope.
which did not significantly differ between the speech and                     Future studies might consider developing larger corpora with
music recordings nonetheless contributed significantly to                     more examples of speech-like and music-like material from
the perceptual model. Specifically, mean pitch did not differ                 multiple performers. In addition, future research might also more
acoustically between the two types of stimuli performed by the                closely consider the relationship between measures like IOI,
musician, though it interacted with familiarity in predicting                 perceived beat and meter, and AMS. Though IOI, AMS, and
the perception of music. Similarly, mean pitch change between                 perceived pulse / meter all have previously reported preferred
consecutive notes did not significantly differ acoustically but               temporal ranges, which broadly seem to align with each other
was associated with the perception of the stimuli as speech.                  (e.g., Fraisse, 1963; Parncutt, 1994; Farbood et al., 2013; Gotham,
In the future, the nature of the music and speech categories                  2015; Ding et al., 2017), it is likely that IOI, AMS, and perceived
(that are slightly modulated by the familiarity of the listeners)             pulse / meter do not form a trivial and/or consistent relationship
could be clarified by means of psychophysical experiments                     to one another across all timescales.
that parametrically manipulate the relevant acoustic features                     Previous studies have suggested that surrogate languages or
reported here.                                                                language-based music, such as talking drums, may enhance
   It is interesting to note the considerably faster amplitude                our understanding of music and language (Patel, 2008; Winter,
modulations of the dùndún performances, compared to the                       2014). In the present study, such ecologically valid material
AMS previously established for music (around 2 Hz, Ding                       provided the unique opportunity to compare stimuli coming
et al., 2017) or to the perceived rate in natural sounds (Roeske              from the same sound source (and performer) while representing

Frontiers in Psychology | www.frontiersin.org                            11                                      May 2021 | Volume 12 | Article 652673
Durojaye et al.                                                                                                                                          Talking Drum Perception

different conceptual domains, which paves the way to a more                                   AUTHOR CONTRIBUTIONS
in-depth understanding of speech/music differences/similarities.
Altogether, our findings confirm the relevance of acoustic                                    CD, MW-F, and PL-M designed the study. CD collected the
features relative to intensity, pitch, timbre, and timing in                                  data. TR conducted acoustic analyses. LF conducted perceptual
distinguishing speech and music, as well as the role of culture                               analyses and mixed modeling. LF and PL-M drafted the
and/or exposure in defining such categories.                                                  manuscript. All authors edited and approved the manuscript.

DATA AVAILABILITY STATEMENT                                                                   ACKNOWLEDGMENTS
The datasets presented in this study can be found in                                          We thank David Poeppel for helpful discussion and feedback
the links below: https://edmond.mpdl.mpg.de/imeji/collection/                                 on analyses. We thank the performer for providing the
ovmWl7rLtIiGSv1v, https://github.com/lkfink/Dundun.                                           stimuli and the dùndún experts who assisted in classifying the
                                                                                              stimuli for final use.

ETHICS STATEMENT
                                                                                              SUPPLEMENTARY MATERIAL
The studies involving human participants were reviewed and
approved by Ethics Council of the Max Planck Society.                                         The Supplementary Material for this article can be found
The participants provided their written informed consent to                                   online at: https://www.frontiersin.org/articles/10.3389/fpsyg.
participate in this study.                                                                    2021.652673/full#supplementary-material

REFERENCES                                                                                    Durojaye, C. (2020). The dùndún talking drum of the Yorùbá community in
                                                                                                  south-west Nigeria. J. Arts Hum. 9, 11–19. doi: 10.18533/journal.v9i7.1902
Akinbo, S. (2019). Representation of Yorùbá tones by a talking drum: an acoustic              Durojaye, C., Knowles, K., Jakob Patten, K., Garcia, M., and McBeath, M. (in
   analysis. Linguist. Lang. Afr. 5, 11–23.                                                       review). When Music Speaks: An Acoustic Study of the Speech Surrogacy of the
Arewa, O., and Adekola, N. (1980). Redundancy principles of statistical                           Nigerian Dùndún Talking Drum.
   communications as applied to Yorùbá talking-drum. Anthropos 75, 185–202.                   Euba, A. (1990). Yorùbá Drumming: The Dùndún Tradition. Bayreuth: Bayreuth
Banse, R., and Scherer, K. R. (1996). Acoustic profiles in vocal emotion expression.              African Studies.
   J. Pers. Soc. Psychol. 70, 614–636. doi: 10.1037/0022-3514.70.3.614                        Farbood, M. M., Marcus, G., and Poeppel, D. (2013). Temporal dynamics and
Bänziger, T., and Scherer, K. R. (2005). The role of intonation in emotional                      the identification of musical key. J. Exp. Psychol. Hum. Percept. Perform. 39,
   expressions. Speech Commun. 46, 252–267. doi: 10.1016/j.specom.2005.02.016                     911–918. doi: 10.1037/a0031087
Bates, D., Maechler, M., Bolker, B., and Walker, S. (2015). Fitting linear mixed-             Fraisse, P. (1963). The Psychology of Time. Oxford: Harper & Row.
   effects models using lme4. J. Stat. Softw. 67, 1–48. doi: 10.18637/jss.v067.i01            Fukino, M., Hirata, Y., and Aihara, K. (2016). Coarse-graining time series data:
Blades, J. (1992). Percussion Instruments and Their History. Wesport, CT: Bold                    recurrence plot of recurrence plots and its application for music. Chaos
   Strummer Limited.                                                                              26:023116. doi: 10.1063/1.4941371
Bolinger, D. (1986). Intonation and Its Parts: Melody in Spoken English. Stanford,            Gotham, M. (2015). Attractor tempos for metrical structures. J. Math. Mus. 9,
   CA: Stanford: Stanford University Press.                                                       23–44. doi: 10.1080/17459737.2014.980343
Bregman, M. R., and Creel, S. C. (2014). Gradient language dominance affects                  Hannon, E. E., Soley, G., and Ullal, S. (2012). Familiarity overrides complexity
   talker learning. Cognition 130, 85–95. doi: 10.1016/j.cognition.2013.09.010                    in rhythm perception: a cross-cultural comparison of American and Turkish
Brown, S. (2000). “The ‘musilanguage’ model of music evolution,” in The Origins of                listeners. J. Exp. Psychol. Hum. Percept. Perform. 38, 543–548. doi: 10.1037/
   Music, eds N. L. Wallin, B. Merker, and S. Brown (Cambridge, MA: MIT Press),                   a0027225
   271–300.                                                                                   Hellbernd, N., and Sammler, D. (2016). Prosody conveys speaker’s intentions:
Carter-Ényì, A., and Carter-Ényì, Q. (2016). “Perception of syntagmatic tone                      acoustic cues for speech act perception. J. Mem. Lang. 88, 70–86. doi: 10.1016/j.
   intervals in Ìgbò and Yorùbá,” in Proceedings of the Tonal Aspects of Languages                jml.2016.01.001
   2016, Buffalo, NY, 107–110. doi: 10.21437/TAL.2016-23                                      Huron, D. (2001). Tone and voice: a derivation of the rules of voice-leading from
Chicco, D., and Jurman, G. (2020). The advantages of the Matthews                                 perceptual principles. Music Percept. 19, 1–64. doi: 10.1525/mp.2001.19.1.1
   correlation coefficient (MCC) over F1 score and accuracy in binary                         Jaisin, K., Suphanchaimat, R., Figueroa Cnadia, M., and Warren, J. (2016).
   classification evaluation. BMC Genomics 21:6. doi: 10.1186/s12864-019-                         The speech-to-song illusion is reduced in speakers of tonal (vs. non-tonal)
   6413-7                                                                                         languages. Front. Psychol. 7:662. doi: 10.3389/fpsyg.2016.00662
Cross, I. (2001). Music, cognition, culture, and evolution. Ann. N. Y. Acad. Sci. 930,        Kalender, B., Trehub, S. E., and Schellenberg, E. G. (2013). Cross-cultural
   28–42. doi: 10.1111/j.1749-6632.2001.tb05723.x                                                 differences in meter perception. Psychol. Res. 77, 196–203. doi: 10.1007/s00426-
Deutsch, D., Henthorn, T., and Lapidis, R. (2011). Illusory transformation from                   012-0427-y
   speech to song. J. Acoust. Soc. Am. 129, 2245–2252. doi: 10.1121/1.3562174                 Kaminski, J. (2008). Surrogate speech of the Asante ivory trumpeters of Ghana.
Deutsch, D., Lapidis, R., and Henthorn, T. (2008). The speech-to-song illusion.                   Ybook. Trad. Music 40, 117–135.
   J. Acoust. Soc. Am. 124:2471. doi: 10.1121/1.4808987                                       Kraljic, T., and Brennan, S. E. (2005). Prosodic disambiguation of syntactic
Dilley, L. C., and McAuley, J. D. (2008). Distal prosodic context affects word                    structure: for the speaker or for the addressee? Cogn. Psychol. 50, 194–231.
   segmentation and lexical processing. J. Mem. Lang. 59, 294–311. doi: 10.1016/j.                doi: 10.1016/j.cogpsych.2004.08.002
   jml.2008.06.006                                                                            Kraus, N., Skoe, E., Parbery-Clark, A., and Ashley, R. (2009). Experience-
Ding, N., Patel, A. D., Chen, L., Butler, H., Luo, C., and Poeppel, D. (2017).                    induced malleability in neural encoding of pitch, timbre and timing.
   Temporal modulations in speech and music. Neurosci. Biobehav. Rev. 18,                         Ann. N. Y. Acad. Sci. 1169, 543–557.                   10.1111/j.1749-6632.2009.
   181–187. doi: 10.1016/j.neubiorev.2017.02.011                                                  04549.x

Frontiers in Psychology | www.frontiersin.org                                            12                                               May 2021 | Volume 12 | Article 652673
Durojaye et al. Talking Drum Perception Krumhansl, C. L. (1979). The psychological representation of musical pitch Sharma, N., Krishnamohan, V., Ganapathy, S., Gangopadhayay, A., and in a tonal context. Cogn. Psychol. 11, 346–374. 10.1016/0010-0285(79) Fink, L. (2020). Acoustic and linguistic features influence talker change 90016-1 detection. J. Acoust. Soc. Am. Express Lett. 147:5. doi: 10.1121/10.000 Ladd, D. R., Faulkner, D., and Faulkner, H. (1999). Constant “segmental anchoring” 2462 of F0 movements under changes in speech rate. J. Acoust. Soc. Am. 106:1543. Siedenburg, K., and McAdams, S. (2016). The role of long-term familiarity and doi: 10.1121/1.427151 attentional maintenance in short-term memory for timbre. Memory 25, 550– Ladd, R. (2008). Intonational Phonology, 2nd Edn. Cambridge: Cambridge 564. doi: 10.1080/09658211.2016.1197945 University Press. Sotunsa, M. (2009). Yorùbá Drum Poetry. London: Stillwatersstudios. Lartillot, O., Eerola, T., Toiviainen, P., and Fornari, J. (2008). “Multi-feature Stadlen, P. (1981). Schoenberg’s Speech-Song. Music Lett. 62, 1–11. doi: 10.1093/ modeling of pulse clarity: design, validation, and optimization,” in Proceedings ml/62.1.1 of the 9th International Conference on Music Information Retrieval, eds J. P. Stern, T. (1957). Drum and whistle “languages”: an analysis of speech surrogates. Bello, E. Chew, and D. Turnbull (Philadelphia, PA: Drexel University), 521–526. Am. Anthropol. 59, 487–506. doi: 10.1525/aa.1957.59.3.02a00070 Lerdahl, F., and Jackendoff, R. (1983). An overview of hierarchical structure in Strand, J. (2009). The Sambla Xylophone: Tradition and Identity in Burkina Faso. music. Music Percept. 1, 229–252. doi: 10.2307/40285257 Unpublished Ph.D. thesis. Middletown, CT: Wesleyan University. London, J., Polak, R., and Jacoby, N. (2017). Rhythm histograms and musical The MathWorks Inc. (2020). Audio Toolbox Toolbox. Natick, MA: The MathWorks meter: a corpus study of Malian percussion music. Psychon. Bull. Rev. 24, Inc. 474–480. doi: 10.3758/s13423-016-1093-7 Thompson, W. F. (2013). “Intervals and scales,” in The Psychology of Music, 3rd Margulis, E., Simchy-Gross, R., and Black, J. (2015). Pronunciation difficulty, Edn. ed. D. Deutsch (London: Elsevier), 107–140. doi: 10.1016/B978-0-12- temporal regularity, and the speech-to-song illusion. Front. Psychol. 6:48. doi: 381460-9.00004-3 10.3389/fpsyg.2015.00048 Tomic, S. T., and Janata, P. (2008). Beyond the beat: modeling metric structure McPherson, L. (2018). The talking Balafon of the Sambla: grammatical principles in music and performance. J. Acoust. Soc. Am. 124, 4024–4041. doi: 10.1121/1. and documentary implications. Anthropol. Linguist. 60, 255–294. doi: 10.1353/ 3006382 anl.2019.0006 Torchiano, M. (2020). effsize: Efficient Effect Size Computation. R Package Version Merrill, J., and Larrouy-Maestri, P. (2017). Vocal features of song and speech: 0.8.1. doi: 10.5281/zenodo.1480624 insights from Schoenberg’s pierrot lunaire. Front. Psychol. 8:1108. doi: 10.3389/ Vanden Bosch der Nederlanden, C. M., Hannon, E. E., and Snyder, J. S. (2015). fpsyg.2017.01108 Finding the music of speech: musical knowledge influences pitch processing in Moore, D., and Meyer, J. (2014). The study of tone and related phenomena in an speech. Cognition 143, 135–140. doi: 10.1016/j.cognition.2015.06.015 Amazonian tone language: Gavião of Rondônia. Lang. Doc. Conserv. 8, 613–636. Villepastour, A. (2010). Ancient Text Messages of the Yorùbá Bata Drum. Farnham: Morrison, S. J., and Demorest, S. M. (2009). Cultural constraints on music Ashgate. perception and cognition. Prog. Brain Res. 178, 67–77. doi: 10.1016/S0079- Villepastour, A. (2014). Talking tones and singing speech among the YoruÌbaì of 6123(09)17805-6 Southwest Nigeria. Jahrb. Phonogrammarchivs Österr. Akad. Wiss. 44, 29–47. Palmer, C., and Krumhansl, C. L. (1987). Pitch and temporal contributions Weidema, J., Roncaglia-Denissen, M. P., and Honing, H. (2016). Top-down to musical phrase perception: effects of harmony, performance timing, and modulation on the perception and categorization of identical pitch contours familiarity. Percept. Psychophys. 41, 505–518. doi: 10.3758/BF03210485 in speech and music. Front. Psychol. 23:1647. doi: 10.3389/fpsyg.2016.00817 Parncutt, R. (1994). A perceptual model of pulse salience and metrical accent in Winter, Y. (2014). On the grammar of a Senegalese drum language. Language 90, musical rhythms. Music Percept. 11, 409–464. doi: 10.2307/40285633 644–668. doi: 10.1353/lan.2014.0061 Patel, A. D. (2008). Music, Language, and the Brain. New York, NY: Oxford Yip, M. (2002). Tone. Cambridge Textbooks in Linguistics. Cambridge: Cambridge University Press. University Press. Perrachione, T. K., Del Tufo, S. N., and Gabrieli, J. D. E. (2011). Human voice Zatorre, R. J., and Baum, S. R. (2012). Musical melody and speech intonation: recognition depends on language ability. Science 333:595. doi: 10.1126/science. singing a different tune. PLoS Biol. 10:e1001372. doi: 10.1371/journal.pbio. 1207327 1001372 R Core Team (2013). R: A Language and Environment for Statistical Computing. Zemp, H., and Soro, S. (2010). Talking Balafons. Afr. Music 8, 7–24. Vienna: R Foundation for Statistical Computing. Ringer, A. L. (2002). “Melody: definition and origins,” in The New Grove Dictionary Conflict of Interest: The authors declare that the research was conducted in the of Music Online, ed. L. Macy (London: Macmillan Online Publishing). absence of any commercial or financial relationships that could be construed as a Roeske, T., Kelty-Stephen, D., and Wallot, S. (2018). Multifractal analysis potential conflict of interest. reveals music-like dynamic structure in songbird rhythms. Sci. Rep. 8:4570. Copyright © 2021 Durojaye, Fink, Roeske, Wald-Fuhrmann and Larrouy-Maestri. Roeske, T., Larrouy-Maestri, P., Sakamoto, Y., and Poeppel, D. (2020). Listening This is an open-access article distributed under the terms of the Creative Commons to birdsong reveals basic features of rate perception and aesthetic judgements. Attribution License (CC BY). The use, distribution or reproduction in other forums Proc. R. Soc. B. 287:20193010. doi: 10.1098/rspb.2019.3010 is permitted, provided the original author(s) and the copyright owner(s) are credited Savage, P. E., Brown, S., Sakai, E., and Currie, T. E. (2015). Statistical universals and that the original publication in this journal is cited, in accordance with accepted reveal the structures and functions of human music. Proc. Natl. Acad. Sci. 112, academic practice. No use, distribution or reproduction is permitted which does not 8987–8992. doi: 10.1073/pnas.1414495112 comply with these terms. Frontiers in Psychology | www.frontiersin.org 13 May 2021 | Volume 12 | Article 652673
You can also read