Spatial and Temporal Patterns of Symbiont Colonization and Loss During Bleaching in the Model Sea Anemone Aiptasia
←
→
Page content transcription
If your browser does not render page correctly, please read the page content below
ORIGINAL RESEARCH
                                                                                                                                              published: 15 March 2022
                                                                                                                                       doi: 10.3389/fmars.2022.808696

                                            Spatial and Temporal Patterns of
                                            Symbiont Colonization and Loss
                                            During Bleaching in the Model Sea
                                            Anemone Aiptasia
                                            Trevor R. Tivey* † , Tyler J. Coleman and Virginia M. Weis
                                            Department of Integrative Biology, Oregon State University, Corvallis, OR, United States

                                            The ability of symbionts to recolonize their hosts after a period of dysbiosis is essential
                                            to maintain a resilient partnership. Many cnidarians rely on photosynthate provided
                                            from a large algal symbiont population. Under periods of thermal stress, symbiont
                                            densities in host cnidarians decline, and the recovery of hosts is dependent on the
                           Edited by:
                                            re-establishment of symbiosis. The cellular mechanisms that govern this process of
                         Russell T. Hill,   colonization are not well-defined and require further exploration. To study this process
     University of Maryland, Baltimore
                                            in the symbiotic sea anemone model Exaiptasia diaphana, commonly called Aiptasia,
                 County, United States
                                            we developed a non-invasive, efficient method of imaging that uses autofluorescence to
                        Reviewed by:
                           Fan Zhang,       measure the abundance of symbiont cells, which were spatially distributed into distinct
          Baylor College of Medicine,       cell clusters within the gastrodermis of host tentacles. We estimated cell cluster sizes to
                          United States
                        Ross Cunning,
                                            measure the occurrence of singlets, doublets, and so on up to much larger cell clusters,
   University of Hawai’i, United States     and characterized colonization patterns by native and non-native symbionts. Native
                   *Correspondence:         symbiont Breviolum minutum rapidly recolonized hosts and rapidly exited under elevated
                         Trevor R. Tivey
                                            temperature, with increased bleaching susceptibility for larger symbiont clusters. In
                     trt43@cornell.edu
                   † Present
                                            contrast, populations of non-native symbionts Symbiodinium microadriaticum and
                          address:
                   Trevor R. Tivey,         Durusdinium trenchii persisted at low levels under elevated temperature. To identify
   Boyce Thompson Institute, Ithaca,        mechanisms driving colonization patterns, we simulated symbiont population changes
                NY, United States
                                            through time and determined that migration was necessary to create observed patterns
                   Specialty section:       (i.e., egression of symbionts from larger clusters to establish new clusters). Our results
         This article was submitted to      support a mechanism where symbionts repopulate hosts in a predictable cluster pattern,
                 Microbial Symbioses,
               a section of the journal     and provide novel evidence that colonization requires both localized proliferation and
          Frontiers in Marine Science       continuous migration.
       Received: 03 November 2021
                                            Keywords: Symbiodiniaceae, cnidarian, coral reefs, dinoflagellate, microscopy, symbiosis
        Accepted: 15 February 2022
         Published: 15 March 2022
                               Citation:    INTRODUCTION
            Tivey TR, Coleman TJ and
Weis VM (2022) Spatial and Temporal
                                            The ecological success of many cnidarian species relies on their nutritional symbiosis with
    Patterns of Symbiont Colonization
            and Loss During Bleaching
                                            endosymbiotic dinoflagellate algae (family Symbiodiniaceae; LaJeunesse et al., 2018) to provide
 in the Model Sea Anemone Aiptasia.         nutrient-rich photosynthate in nutrient-poor environments (Muscatine and Porter, 1977). These
             Front. Mar. Sci. 9:808696.     photosynthetic algae reside in vesicles called symbiosomes inside gastrodermal cells of the host
     doi: 10.3389/fmars.2022.808696         cnidarian (Fitt and Trench, 1983; Wakefield et al., 2000). In the majority of symbiotic cnidarians,

Frontiers in Marine Science | www.frontiersin.org                                  1                                             March 2022 | Volume 9 | Article 808696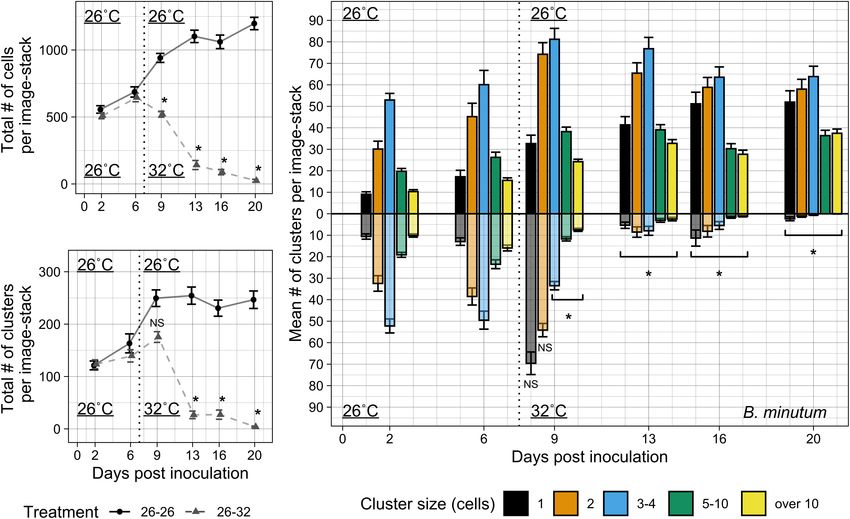
Tivey et al.                                                                                                Spatiotemporal Colonization Patterns in Aiptasia

symbionts are newly acquired with each host generation                              Although the overall symbiont population dynamics during
(Hartmann et al., 2017). Once ingested into the cnidarian                       bleaching are well-documented, mechanisms for how algal
gastrovascular cavity, algal symbionts colonize the cnidarian                   populations decrease and subsequently recover in hosts are not
gastrodermis via host cell phagocytic pathways (Colley and                      well-understood (Gates et al., 1992; Weis, 2008; Bieri et al.,
Trench, 1983; Davy et al., 2012). Symbiont populations                          2016). For example, it is still not clear whether symbiont
then increase to populate the entire host gastrodermis. This                    populations originate externally from the water column or
intracellular relationship is vulnerable to environmental stress                surrounding sediment, or if population recovery is solely from
throughout the life history of the host. Altered temperature or                 algae remaining within the depleted host. In some coral hosts,
nutrient conditions can result in dysbiosis, known as cnidarian                 thermotolerant species such as Durusdinium trenchii have been
bleaching, wherein algal populations decrease within host tissues               found to occur at low proportions prior to bleaching events,
to the point where the host cnidarian can die from a lack of                    persist during periods of bleaching, and become the predominant
nutrition (Oakley and Davy, 2018). As environmental changes                     symbiont after bleaching events, presumably through lack of
occur more rapidly worldwide, the mechanisms governing these                    competition from other thermally sensitive symbiont species
host-symbiont dynamics and the ability to recover from dysbiosis                (Silverstein et al., 2015; Bay et al., 2016; Manzello et al., 2019).
has become consequential for the fate of coral reef ecosystems                  However, these thermotolerant species appear to be replaced
across the planet.                                                              over longer periods of time by species that were dominant
   The establishment of algal populations within cnidarians can                 at pre-bleaching timepoints (Thornhill et al., 2006). Accurate
either occur through initial colonization or colonization after                 predictions of responses to rapidly changing ocean environments
symbiont population depletion. During initial colonization, algae               by threatened cnidarian hosts and their algal symbionts requires
are acquired by host larvae or juvenile polyps (Schwarz et al.,                 further examination of these cellular mechanisms of symbiont
1999). After episodes of dysbiosis, algae can recolonize adult                  population depletion and re-establishment (Davy et al., 2012).
hosts with differential success in a process which can result                       Despite the considerable number of colonization studies
in “shuffled” symbiont population proportions (Cunning et al.,                  in cnidarians, the spatial population dynamics of symbionts
2018). These colonization events are fundamental to the fitness                 within their cnidarian hosts remains relatively uncharacterized.
and survival of symbiotic cnidarians; the ability for the host to               Gabay et al. (2018) examined these spatial patterning in the
be rescued by thermotolerant symbiont colonization represents                   symbiotic sea anemone Exaiptasia diaphana (commonly called
one of several solutions for coral species resilience and survival              Aiptasia) across the entire host polyp in combination with
during the climate crisis (Berkelmans and van Oppen, 2006;                      inoculation of several symbiont species. Patterns of symbiont
Hoegh-Guldberg et al., 2018). It is therefore critical to study and             occurrence across host body sections were uniformly “patchy”
model how cnidarian-dinoflagellate symbiosis operates with non-                 for all observed symbiont species, appearing first in tentacles
native thermotolerant symbiont populations under ambient and                    and oral disks, and then spreading to column and pedal
elevated temperature regimes.                                                   disk. The authors suggest this rapid increase in colonized
   Many experimental studies have measured the dynamics of                      patches of host tissue is a result of symbiont migration
symbiont populations on an organismal level (e.g., symbiont cells               after rapid mitotic cell division, whereby either algae move
per larva) or after tissue homogenization (e.g., symbiont cells                 into the gastrovascular cavity and are reacquired by other
per mg host protein). In general, symbiont species are more                     gastrodermal cells, or they move directly through gastrodermal
rapid colonizers when derived from the same host cnidarian                      tissue. This hypothesis suggests that the size of a colonized
species (i.e., native symbionts). This differential success has been            patch of host tissue represents a history of localized population
measured in larvae and juvenile coral polyps, by inoculations of                dynamics, one in which smaller patches originate from recent
native species resulting in robust colonization and inoculation                 colonization/migration events and larger patches originate
of non-native species resulting in more varied colonization                     from older colonization/migration events. Spatial population
outcomes (Weis et al., 2001; Little et al., 2004; Harii et al., 2009;           dynamics of symbionts may therefore aid in understanding the
Wolfowicz et al., 2016). Host-symbiont specificity is hypothesized              different constraints governing host-symbiont interactions under
to be more restrictive in the colonization of adult aposymbiotic                environmental change.
hosts (Coffroth et al., 2001; Baker, 2003; Abrego et al., 2009).                    In anthozoans, which include scleractinian corals, it is
This restriction has implications for colonization of adults during             presumed that symbiont proliferation occurs within cnidarian
recovery from bleaching. In examining successful symbiont                       gastrodermal host cells, and that levels of host cell-specific
colonization events in aposymbiotic adults, native algal symbiont               symbiont density vary from species to species (Muscatine et al.,
populations colonize at faster rates resulting in larger symbiont               1998). Due to the small size of anthozoan host cells, however,
populations (Schoenberg and Trench, 1980; Davy et al., 1997;                    cell-specific symbiont population studies are extraordinarily
Belda-Baillie et al., 2002; Gabay et al., 2018; Tortorelli et al., 2020).       difficult to perform (Davy et al., 2012). Therefore, most of
Non-native algal colonization often comes with a slower initial                 our understanding of host cell-specific symbiont dynamics
colonization rate, and success depends on symbiont species. In                  comes from the larger gastrodermal cells of hydroids Hydra
some studies, differences in colonization between native and non-               and Myrionema (McAuley and Cook, 1994; Fitt, 2000; Fitt
native symbionts have been correlated with significant differences              and Cook, 2001). Despite the relatively uncharacterized cellular
in oxidative stress response and apoptotic pathway activation                   relationship between symbiont and host cell proliferation in
(Dunn and Weis, 2009; Matthews et al., 2017).                                   anthozoans, there are a number of hypotheses for host cell

Frontiers in Marine Science | www.frontiersin.org                           2                                       March 2022 | Volume 9 | Article 808696
Tivey et al.                                                                                            Spatiotemporal Colonization Patterns in Aiptasia

modulation of symbiont colonization, including augmenting                    of the clonal H2 strain containing their native symbiont species
symbiont populations via host cell cycle dynamics (Camaya,                   B. minutum, originally isolated from a single individual collected
2020; Tivey et al., 2020), constraining symbiont populations by              from Coconut Island, Kaneohe, Hawaii (Xiang et al., 2013).
restricting nitrogen availability (Krueger et al., 2020; Xiang et al.,       Aposymbiotic sea anemones were generated using a menthol
2020), and physical expulsion of dividing symbionts in fully                 bleaching protocol (Matthews et al., 2016). Sea anemones were
populated hosts (Baghdasarian and Muscatine, 2000). Though                   maintained in filtered sea water (FSW) in an aposymbiotic
some of these physiological mechanisms are well-studied on the               state in the dark for longer than 2 months prior to use in
organismal scale, many questions about the underlying cellular               experiments and fed Artemia nauplii three times per week
mechanisms governing spatial population dynamics on the tissue               until 1 week prior to experiments. Anemones were plated
level and cellular level remain unanswered.                                  into individual wells of multi-well plates 1 week in advance
   In this study, we characterized and modeled the spatial                   of experiments, moved to 26◦ C incubators under 12:12 L:D
patterns of native and non-native symbiont population dynamics               cycle and checked for symbionts to ensure that the polyps
in Aiptasia. Aiptasia provides a tractable model to study                    remained symbiont-free using an inverted epifluorescence Zeiss
these fundamental cellular mechanisms in depth (Weis et al.,                 AxioObserver A1 microscope with an Axiovert ICm1 camera
2008; Hambleton et al., 2014; Goldstein and King, 2016). The                 (Carl Zeiss AG, Jena, Germany).
thin, translucent epidermal and gastrodermal tissue layers of
Aiptasia polyps enable flexible imaging techniques to characterize           Experiment 1: Colonization by Breviolum
the location and proliferation of autofluorescent symbionts
                                                                             minutum Over 1 Week at 26◦ C
(Tortorelli et al., 2020). In addition, Aiptasia is readily culturable
                                                                             As part of a pilot experiment, tiny (1 mm oral disc diameter)
in a laboratory setting and can be maintained indefinitely in
                                                                             aposymbiotic anemones were selected and plated into 24-well
an aposymbiotic state after rapid bleaching from either thermal
                                                                             plates. Anemones were visually inspected under bright light and
stress or menthol treatment (Belda-Baillie et al., 2002; Matthews
                                                                             under laser excitation using the Cy3 red filter to capture symbiont
et al., 2016). Aposymbiotic adult Aiptasia polyps can, to varying
                                                                             autofluorescence and verified to contain no algal symbionts.
degrees, be colonized with both native and non-native symbionts,
                                                                             Animals were then inoculated with 1 × 10⁴ cells • mL−1 of
which allows for symbiont species specificity comparisons of
                                                                             B. minutum (Culture FLAp2). After 24 h of exposure, anemones
spatial patterns within host tissue.
                                                                             were rinsed with FSW, moved to a 96-well plate, and imaged daily
   In this study, we quantified spatiotemporal proliferation
                                                                             for up to 7 days after inoculation (n = 10). Animals were kept
dynamics of algal symbionts in individual host anemones
                                                                             at 26◦ C for the duration of the experiment. Prior to imaging,
during both periods of colonization and heat-stress-induced
                                                                             animals were placed in a relaxing solution of 1:1 FSW mixed
bleaching. We developed and compared two non-invasive
                                                                             with 0.37 M MgCl2 in FSW. After 5 min, the animal was plated
imaging methods for tracking symbiont population patterns
                                                                             onto a depression slide for confocal imaging at 10x magnification
over time throughout the tentacles of Aiptasia. We further used
                                                                             on a Zeiss LSM 780 NLO Confocal Microscope System (Carl
this methodology to compare the patterning and population
                                                                             Zeiss AG, Jena, Germany) in the Center for Genome Research
dynamics of native symbiont species (Breviolum minutum)
                                                                             and Biocomputing at Oregon State University. Z-stack images
and non-native species (Symbiodinium microadriaticum and
                                                                             (850 × 850 µm) were taken of the tentacles and columns of the
D. trenchii) under ambient and elevated temperatures. Finally, we
                                                                             anemone under bright light only. Quantification of the number
compared our data with models of symbiont population growth
                                                                             of singlet, doublet, triplet, and quadruplet algal cells in the
to better understand the relationship between local symbiont
                                                                             tentacles and in the body column/oral disc was performed for
proliferation and migration within gastrodermal tissue. We find
                                                                             each Z-stack image using Fiji (ImageJ2) (Schindelin et al., 2012;
that migratory events after initial inoculation play a critical
                                                                             Rueden et al., 2017).
role throughout symbiont colonization, and that thermal stress
impacts symbiont density on a localized scale in a species-
specific manner.                                                             Experiment 2: Colonization by Breviolum
                                                                             minutum Over 4 Weeks at 26 and 32◦ C
                                                                             To broaden our understanding of symbiont population dynamics
MATERIALS AND METHODS                                                        in Aiptasia tentacles over a longer duration in larger areas
                                                                             of tentacle tissue, we changed our imaging approach to
Algal and Animal Culturing                                                   epifluorescence microscopy and developed a more rapid imaging
Algal cultures of Symbiodiniaceae were maintained at 26◦ C                   method, which captured symbiont populations using z-stack
under 12:12 L:D cycle and grown in f/2 media at a light                      videos of symbiont autofluorescence without a need for animal
intensity of 50 µmol quanta • m−2 • s−1 . Cultures included                  anaesthetization. For this method, medium-sized (0.25 cm oral
one native symbiont of Aiptasia, Breviolum minutum (culture                  disc diameter) aposymbiotic sea anemones were selected and
IDs: FLAp2 Mf1.05b), and two competent but non-native species,               plated into 24-well plates. This animal size ensured that the
Symbiodinium microadriaticum (CCMP 2467) and Durusdinium                     full-length of any chosen tentacle could be imaged under a
trenchii (Ap2). All cultures were genotyped prior to experiments             10x objective. To determine if there were residual symbiont
to verify the identification of symbionts (data not shown).                  populations, animals were visually inspected under bright light
Experimental Aiptasia polyps were generated from animal stocks               and under laser excitation using the Cy3 red filter to capture

Frontiers in Marine Science | www.frontiersin.org                        3                                      March 2022 | Volume 9 | Article 808696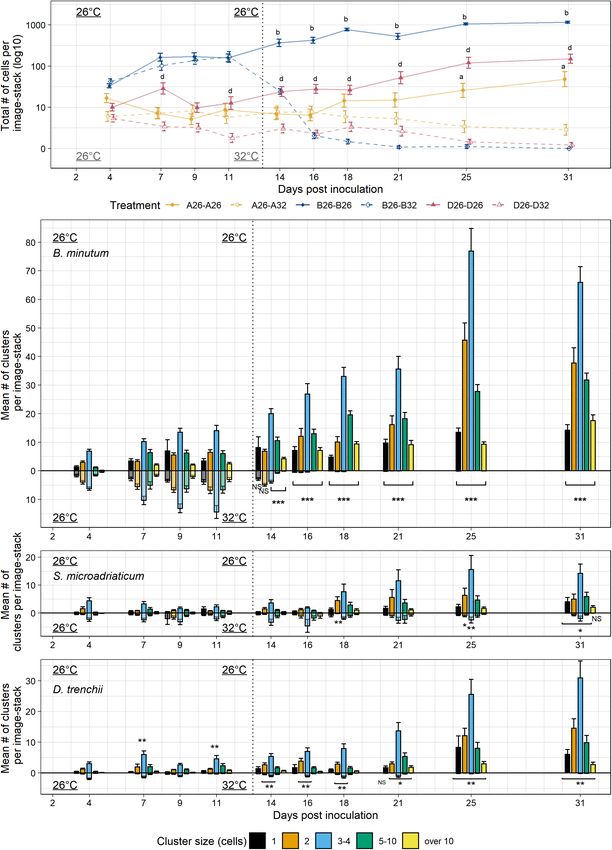
Tivey et al.                                                                                           Spatiotemporal Colonization Patterns in Aiptasia

symbiont autofluorescence. In this experiment, very low algal              Image Analysis to Determine Symbiont
densities consisting of singlet algal cells (approximately 5–15            Populations
cells per tentacle) were found to have persisted in Aiptasia
                                                                           For experiments performed on the epifluorescence microscope
tentacles after 6 months of darkness post-menthol bleaching
                                                                           (i.e., Experiment 2 and 3), videos were saved and exported
(Supplementary Figure 1).
                                                                           into jpeg stacks using the batch export function in the ZEN
    To examine patterns of symbiont colonization, we inoculated
                                                                           software package (Black Edition v. 3.0). Photo stacks contained
these Aiptasia with their native symbiont B. minutum and
                                                                           either all autofluorescent images or all brightfield images. Photo
examined proliferation patterns under two temperature regimes.
                                                                           stacks with more than 50 images were flagged and truncated
All animals were inoculated with 5 × 10⁴ cells • mL−1 of
                                                                           to delete images that were out of focus at the top and bottom
B. minutum culture in 2 mL of FSW in 24-well plates. After
                                                                           of the image stack. Image stacks were then imported into
24 h, polyps were rinsed with FSW (d = 0) and moved
                                                                           Adobe Photoshop CC 2019 (v. 20.0.3) to undergo autoblend in
into fresh FSW-filled 24-well plates to restrict the timing of
                                                                           order to merge the entire image stack into one 2D image of a
inoculation. Animals were imaged and maintained at 26◦ C for
                                                                           tentacle (Figure 1C). Once all of the stacks were merged into
1 week before dividing them into an ambient treatment (26◦ C)
                                                                           single images, brightfield and fluorescent merged images were
and an elevated heat treatment (32◦ C) (n = 24 anemones per
                                                                           separated into two folders. Fluorescent merged images were
treatment). Animals were maintained at either 26◦ C or 32◦ C
                                                                           analyzed in FIJI using intensity thresholds (Figure 1D) and the
for an additional 2 weeks. Since heat and ambient treatment
                                                                           3D object counter plugin (Bolte and Cordelieres, 2006). Each
of anemones required incubation in two separate incubators,
                                                                           sample image resulted in a list of object sizes corresponding to
each 24-well plate was housed in identical chambers with LED
                                                                           clusters of autofluorescent symbionts. These tables containing
lighting strips (LEDENET 24V cold white 6500K-7000K LED
                                                                           cluster sizes for each sample were imported into R, binned as
strip, Enet Light Technology Co., Limited, China) covered with
                                                                           count data according to cluster object area size, and combined
nylon mesh for a final light intensity of 10 µmol quanta •
                                                                           into a dataframe with sample metadata for further analysis. To
m−2 • s−1 across the entire plate. Periodically, over 3 weeks,
                                                                           bin clusters into singlets, doublets, and larger clusters, a range
an inverted epifluorescence Zeiss AxioObserver A1 microscope
                                                                           of size cutoffs was used. To ensure accuracy, manual counting
with an Axiovert ICm1 camera (Carl Zeiss AG, Jena, Germany)
                                                                           was performed for 39 samples across experimental timepoints
was used to take videos of three tentacles per anemone at
                                                                           (Supplementary Table 1). The manually counted numbers
35 ms exposure under bright light and under laser excitation
                                                                           of singlets, doublets, triplets, quadruplets, quintuplets, total
(Cy3 red filter) to capture algal cell chlorophyll autofluorescence
                                                                           clusters, and total cells were correlated into the best fitting cutoff
(Figure 1A). For each tentacle, videos were taken by scrolling
                                                                           range for size-based segregation. After assigning size cutoffs
through the focus from the tip to the base of a tentacle using a 10x
                                                                           and binning clusters into cell numbers, a subset of clusters
objective, simulating a confocal z-stack (Figure 1B). Brightfield
                                                                           (n = 177) was used to directly compare the identification of
video was taken first to determine the depth of the tentacle, and a
                                                                           each cluster between hand-counting and automatic binning
video was taken immediately after using darkfield laser excitation.
                                                                           methods (Supplementary Figure 2). Overall, automatic binning
                                                                           connected neighboring clusters more frequently, resulted
Experiment 3: Colonization by Breviolum                                    in 19% fewer clusters overall compared to hand-counting,
minutum, Symbiodinium                                                      however, there was a tight correlation on total clusters for
microadriaticum, and Durusdinium                                           each sample (R = 0.94, p < 2.2 × 10⁻¹⁶ , Supplementary
                                                                           Figure 2). Cell clusters containing more than two cells were
trenchii Over 4 Weeks at 26 and 32◦ C                                      binned into groups of three-to-four cells, five-to-ten cells,
To compare patterns of host colonization by different symbionts
                                                                           and greater than ten cells to signify increased difficulty in
species, we inoculated medium-sized (0.25 cm oral disc diameter)
                                                                           discriminating between larger cluster sizes with increased
Aiptasia with one of three species of Symbiodiniaceae: native
                                                                           cell-cell obscuration.
B. minutum, and non-native S. microadriaticum or D. trenchii.
Prior to inoculations, animals were visually inspected under
bright light and under laser excitation using the Cy3 red filter           Statistical Analysis of Symbiont Cluster
to capture symbiont autofluorescence and verified to contain               Population Dynamics
no algal symbionts. Inoculations were performed using 5 × 10⁵              To assess differences between count data in Experiment 2, linear
cells • mL−1 for all species over 2 days, tenfold higher than              mixed models were applied for each cluster size to test the
the symbiont density of the previous experiment, to increase               interaction between days and temperature treatment, with plate
the success of non-native inoculation. After 48 h of inoculation,          treated as a random effect. To assess differences between count
anemones were rinsed and moved to new 24-well plates. All                  data in Experiment 3, linear models were used to test the
sea anemones were maintained at 26◦ C for 2 weeks before                   interaction between days and temperature treatment for each
separating into an ambient treatment (26◦ C) and an elevated               cluster size of each symbiont species. For both experiments,
heat treatment (32◦ C) (n = 12 each). Animals were maintained              each model required a square root or log transformation to
at either 26 or 32◦ C for an additional 3 weeks. Environmental             normalize count data. To assess pairwise relationships, Tukey’s
conditions and epifluorescence imaging were identical to the               tests were constructed using the general linear hypothesis test
previous experiment.                                                       (glht) function, which was corrected for multiple comparisons by

Frontiers in Marine Science | www.frontiersin.org                      4                                       March 2022 | Volume 9 | Article 808696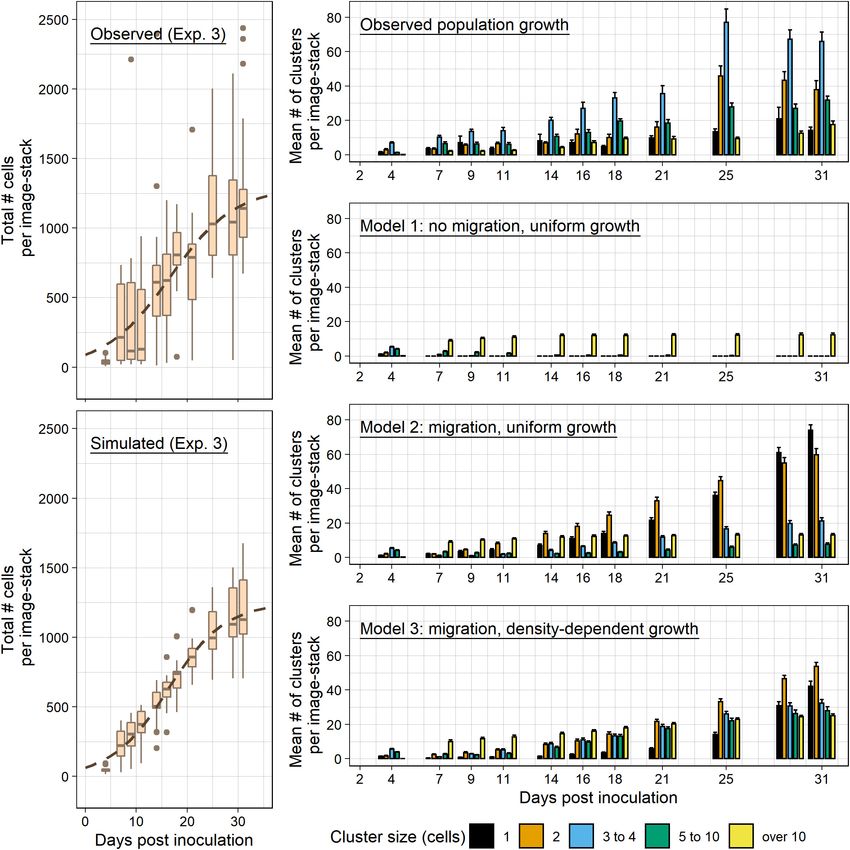
Tivey et al.                                                                                                              Spatiotemporal Colonization Patterns in Aiptasia

  FIGURE 1 | Imaging colonization dynamics in Aiptasia polyps using epifluorescence microscopy. (A) Bleached Aiptasia polyps (left: day 0) were colonized with algal
  symbionts over a period of 4 weeks (right: day 10) and imaged under brightfield and epifluorescence to track symbiont autofluorescence. (B) Videos were taken as
  representative Z-stack images under brightfield (left) and laser excitation (right) to provide focus for each z-plane of the tentacles. (C) Videos were merged into 2D
  images, and (D) the epifluorescence images were processed in Fiji (ImageJ2) to create a 2D mask of symbiont presence (left), which was used to identify size and
  location of symbiont cluster objects (right). The number of cells within each cluster was determined based on object size cutoffs.

the single-step method. All statistical analyses were performed in                      inoculation data from Experiment 3. Three random subsamples
R and are made available in Supplementary Tables 2, 3.                                  of symbiont cluster populations from each anemone host were
                                                                                        generated from total cell clusters present at day four. Each
                                                                                        subsample contained the mean number of cell clusters present
Modeling the Role of Algal Migration in                                                 per host anemone at day four. A regression model was then
Algal Colonization Dynamics                                                             constructed by measuring the observed summed symbiont
To test the effect of migration among symbiont clusters during                          cell population in each sample image as a function of days
colonization, simulated symbiont populations were created from                          post-inoculation: and fitting a self-starting nls logistic model.

Frontiers in Marine Science | www.frontiersin.org                                   5                                             March 2022 | Volume 9 | Article 808696
Tivey et al. Spatiotemporal Colonization Patterns in Aiptasia
To account for variation between the symbiont populations of
sample anemone hosts, a unique self-starting nls logistic model
was fit to each anemone host (Supplementary Table 4). The
logistic growth models were then applied equally to every cell
present in the newly generated samples at day four. To create
a zero-migration model, only these clusters present at day four
were allowed to grow in cluster size at this linear growth rate over
time. To create a simulated migration model, each cell was given
the same daily probability of migration, independent of cluster
size, and subjected to a Bernoulli trial where the cell would either
migrate from a cluster or remain in the cluster. For each positive
migration outcome, the cell would be subtracted from the cluster
and added as a newly formed cluster.
After the migration process was completed for every cell
in a sample, a daily growth rate was applied equally to all
cells. An end day cell population was determined by the fixed
population number from the corresponding logistic growth
model (Supplementary Table 4). The difference in cell number
between the starting day and end day cell population was then
allocated to each cell proportionally. To further test the influence
of symbiont cluster size-dependent growth in the model, the
distribution of this allocation was root-transformed according to
the cell cluster size, which added proportionally more cells to
smaller cell clusters and fewer cells to larger clusters. An array of
√ √ √ √
root transformations (un-transformed, 2, 4, 8, 16, log2 )
and migration probabilities (0, 0.5, 1, 1.5, 2, 3, 4, 7, 10%) were
used to simulate symbiont populations. Each simulated dataset
was compared against the observed dataset using a chi-square
goodness-of-fit test, which additively measured Chi-square values
between simulated and observed cluster frequencies for each
biological replicate at each timepoint (df = 127). Chi-square
values were measured for total clusters to determine the best
fit simulation (Supplementary Table 5). Chi-square values were
also measured for clustered bins (one, two, three to four,
five to ten, over ten) to determine modeling accuracy for
differing cluster sizes (Supplementary Table 6). After choosing
the best fit simulations, the cluster size abundances of best fit
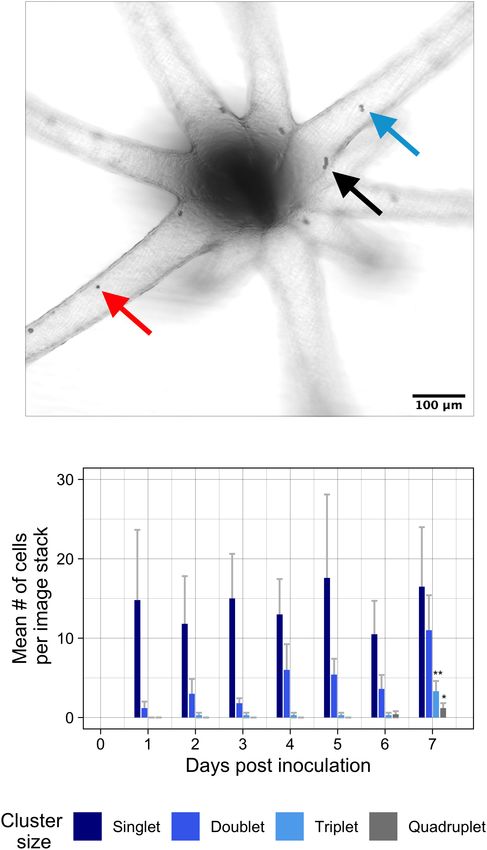
simulated populations over time were compared to observed FIGURE 2 | Colonization by B. minutum over 1 week at 26◦ C. (A) Colonizing
experimental data to infer the effects of migration and growth rate symbionts were tracked within the tentacles of tiny Aiptasia polyps with the
genetic host strain background of H2 (n = 7 anemones). For each day, one
application among clusters. brightfield confocal z-stack per anemone was used to capture all information
between the focal planes of the closest and furthest tissue. Clusters of
symbiont cells were identified over a period of 7 days. (B) The cluster sizes of
RESULTS singlets (red arrow), doublets (blue arrow), triplets (not shown) and
quadruplets (black arrow) were summarized within tentacles to find mean
Experiment 1: Colonization by Breviolum abundances of cells per cluster size over time. Aiptasia were inoculated with a
concentration of 1 × 10⁴ cells • mL−1 . Error bars signify standard error.
minutum Over 1 Week at 26◦ C Asterisks represent statistically significant differences after ANOVA and Tukey
Using brightfield confocal microscopy, we took repeated post hoc test: ∗∗ p < 0.005 for triplets at 7 days compared to all other days;
∗ p < 0.05 for quadruplets at 7 days compared to days 1–5.
measurements and tracked symbiont cell cluster populations
of native symbiont Breviolum minutum during 1 week
of colonization in Aiptasia polyps (oral disk < 0.5 mm;
Figures 2A,B). After a relatively low symbiont inoculation of triplets was recorded as early as 2 days post-inoculation,
concentration (1 × 10⁴ cells • mL−1 ), tentacles were populated multiple triplets and quadruplets only began to appear at day
with low levels of singlet symbionts primarily in the tentacles seven of the experiment [F (6 , 63) = 4.18, p = 0.001; F (6 , 63) = 2.7,
(Figure 2B). Over the course of 1 week of colonization, singlet p = 0.02]. The area including the oral disk and column of
cells remained in tentacles at a constant rate [F (6 , 63) = 0.93, inoculated Aiptasia had much lower symbiont densities and
p = 0.48], whereas the occurrence of doublets grew exponentially remained at low density through the duration of the experiment
(Figure 2B) [F (6 , 63) = 1.85, p = 0.10]. Though the appearance (Supplementary Figure 3).
Frontiers in Marine Science | www.frontiersin.org 6 March 2022 | Volume 9 | Article 808696Tivey et al. Spatiotemporal Colonization Patterns in Aiptasia
Experiment 2: Colonization by Breviolum Experiment 3: Colonization by Breviolum
minutum Over Three Weeks at 26 and minutum, Symbiodinium
32◦ C microadriaticum, and Durusdinium
Epifluorescence microscopy and automated imaging processes trenchii Over 4 Weeks at 26 and 32◦ C
(Figure 1) allowed us to collect and analyze symbiont patterns To explore how colonization patterns of hosts by symbionts differ
within host Aiptasia more efficiently and with less damage to across symbiont species, we compared colonization of Aiptasia
the host than the confocal imaging used in Experiment 1. Based using three species of Symbiodiniaceae: native B. minutum, and
on the increased colonization of tentacles compared to the oral non-native Symbiodinium microadriaticum, and Durusdinium
disk/column area in Experiment 1 (Supplementary Figure 3), we trenchii (Figure 4). Aposymbiotic Aiptasia were verified to
chose to focus on imaging only tentacles. With these methods, we contain no residual native symbiont populations. In comparison
were able to capture symbiont proliferation dynamics in Aiptasia to Experiment 2, symbiont inoculation concentration was
tentacles over an extended period of colonization. After scaling increased to ensure successful symbiont uptake of non-native
our symbiont inoculation concentration to accommodate for a species. Despite this increase in inoculation concentration, the
larger animal size, compared to the anemones used in Experiment initial cell populations of B. minutum during the first week
1, initial symbiont uptake of B. minutum occurred throughout of colonization were threefold lower in Experiment 3 (26d7,
the length of the tentacle with no discernible differences in Figure 4A) compared to Experiment 2 (26d6, Figure 3A). As a
density along the proximal-distal axis (data not shown). During result, we were able to capture growing populations of symbionts
the colonization process at 26◦ C, the cell populations within across a longer timeframe than the previous experiment. The
our sample images experienced consistent growth throughout initial uptake of native symbiont B. minutum populations
the experiment (Figure 3A). In comparison, the total number resulted in symbiont populations twice as large as non-native
of clusters became constant at day 9 (Figure 3B). Similarly to symbiont populations S. microadriaticum and D. trenchii (26d4,
the total cells and clusters, each measured cluster size at 26◦ C Figure 4A). As in the previous experiment, polyps colonized with
increased in abundance up to day 9, but abundance trends B. minutum showed consistent linear growth of large cell clusters
differed between cluster sizes after day 9 (Figure 3C). The (10 cells or more) (Figure 4B). Triplet/quadruplet populations
frequency of singlet populations increased significantly from day were again the most abundant at each timepoint during this
two to day six of colonization (d2C-d6C, p < 0.001, Tukey experiment. Though overall trends of B. minutum colonization
post hoc test). Doublets and triplets/quadruplets were the most were consistent across experiments, cluster patterns exhibited
numerous cluster sizes present in host tissue within the first week. higher variation in Experiment 3 compared to Experiment 2,
As expected, larger clusters of five-ten and over ten cells increased most likely as a result of lower inoculation numbers and halving
with each day post-inoculation except for day 16 (p < 0.001, the sample size.
Tukey post hoc test), when both the total number of cells and Both non-native symbionts colonized animals at much
clusters slightly decreased (Figures 3A,B). lower levels and slower rates compared to native symbionts
After 1 week of colonization at 26◦ C (26d7), a heat (Figure 4A). In polyps colonized by S. microadriaticum, low
treatment of 32◦ C was applied to half of the sample animals levels of initial symbiont uptake by animal hosts during the
in Experiment 2 (26d7 + 32d0). Two days of 32◦ C heat inoculation period was predictive of overall slow colonization
treatment was enough to significantly reduce the total number (Figures 4C). The total number of cells and clusters did not
of symbiont cells (26d7 + 32d2) compared to samples in the significantly change within the first 2 weeks of colonization.
26◦ C treatment (26d9) (p < 0.01, post hoc Tukey test; Figure 3A Substantial colonization correlated with increases in singlet,
and Supplementary Table 2). Though the total number of cells doublet, and triplet populations during the third week of
immediately decreased compared to counts just prior to elevated colonization. Mean number of cells and clusters doubled
temperature onset, there was a temporary increase of cell clusters between day 16 and day 18 of colonization (26d16-26d18,
during the bleaching response (d7C + d0H, Figures 3A,B). Figures 4A,C), with stronger colonization patterns appearing
The increase in total cluster abundance was explained by the from day 25 (26d25) onward.
dramatic increase of singlets and retention of doublet clusters Colonization by D. trenchii also resulted in reduced levels of
during this immediate bleaching response (Figure 3C). In symbiont uptake and took longer to establish in Aiptasia polyps
contrast to smaller cluster sizes, all clusters containing four or (Figure 4D). After remaining low, total cells tripled and total
more cells immediately decreased compared to their previous clusters doubled from day 18 to day 21, beginning a pattern
measurements (d7C + d0H) and compared to samples from the of consecutive increases whereby effective colonization occurred
26◦ C (d9C-d20C) temperature treatment (Figure 3C, p < 0.01 (Figure 4A). Sudden population growth was marked by increases
for all pairwise post hoc Tukey tests). Singlets, doublets, and in triplet and quadruplets, followed by increases in singlets and
triplets/quadruplets were the last type of clusters to remain after doublets. After growth of these smaller clusters, larger clusters of
1 week of elevated temperature. All cell cluster sizes declined five-to and over ten cells began to form relatively quickly (26d21).
after 2 weeks of heat treatment, and only the occasional singlet Colonization with either S. microadriaticum or D. trenchii
or doublet symbiont cluster was found in tentacles. There was no resulted in higher variation in symbiont colonization between
locational difference in colonization or bleaching along the length individual anemones compared to colonization with B. minutum
of the tentacle (data not shown). (Supplementary Figures 4–6). For 26◦ C treatment, all polyps
Frontiers in Marine Science | www.frontiersin.org 7 March 2022 | Volume 9 | Article 808696Tivey et al. Spatiotemporal Colonization Patterns in Aiptasia
FIGURE 3 | Colonization by B. minutum over 3 weeks at 26 and 32◦ C. Algal symbiont populations were monitored over 3 weeks in the tentacles of Aiptasia polyps
under ambient and elevated temperature regimes. (A) The total numbers of cells per sample image-stack were measured over a 3-week period (3 sample
image-stacks per anemone, 24 anemones per treatment). During the first week both treatments received the same 26◦ C temperature treatment to promote
colonization. After 7 days, one treatment remained at 26◦ C and the other treatment was moved to 32◦ C to compare colonization and bleaching phenotypes. (B) The
total numbers of clusters per sample image-stack were measured over 3 weeks under ambient and bleaching conditions. (C) The mean number of cell clusters per
image-stack were binned into discrete cell cluster sizes measured over 3 weeks. 26◦ C treatment for 3 weeks is shown on the positive y-axis, while 26–32◦ C
treatment is shown on the negative y-axis, reflected across the x-axis for comparison. The beginning of the difference in treatment conditions is indicated by a vertical
dotted line at 7 days post-inoculation. Aiptasia were inoculated with a concentration of 5 × 10⁴ cells • mL−1 . Error bars signify standard error for the total abundance
of clusters or cells. Asterisks indicate significant differences between temperature treatments at each timepoint by Tukey post hoc tests (p < 0.01 in all cases).
with B. minutum ended up being substantially colonized clusters containing three or more cells at 1 day post heat stress
(Supplementary Figure 4), whereas only three of twelve (26d13 + 32d1) compared to day 11 (26d11 + 32d0) and
polyps were substantially colonized with S. microadriaticum compared to the 26◦ C treatment (26d14) (p < 0.001 for all
(Supplementary Figure 5) and eight of twelve polyps were pairwise Tukey post hoc tests). Similar to Experiment 2, singlet
substantially colonized with D. trenchii (Supplementary and doublet populations did not immediately decline under heat
Figure 6). Substantial colonization was determined by the stress. After 1 week post-bleaching exposure (26d14 + 32d7),
presence of continuous symbiont population growth with however, most tentacles had no clusters of symbionts present in
average symbiont abundances consistently above 50 clusters their tentacles.
(Supplementary Figures 4–6). In polyps inoculated with In contrast, in animals recolonized by S. microadriaticum,
S. microadriaticum, higher levels of early inoculation resulted algal population numbers remained relatively constant under
in polyps with substantial symbiont populations (26d4-26d7, thermal stress conditions (Figure 4B and Supplementary
Supplementary Figure 5). In contrast, there were no obvious Figure 5). Symbiont clusters did not significantly change
differences in inoculation levels between rapid and slower throughout the heat treatment, with symbiont populations
colonizations of D. trenchii at early time points immediately averaging between 50 and 100 symbionts per sample
following inoculation (26d4-26d7, Supplementary Figure 6). (Figures 4A,C and Supplementary Table 3). Cell number
After 2 weeks of colonization (26d13), a heat stress and cluster populations only significantly declined at day 31
temperature of 32◦ C was applied to half of the anemones after 2 weeks of heat stress (26d13 + 32d18, p < 0.05, Tukey
undergoing colonization. In animals recolonized by native post-hoc test; Figure 4C). Polyps colonized by S. microadriaticum
B. minutum, algal populations again declined in overall cell remained symbiotic at the end of the experiment.
and cluster number after the temperature was increased In animals recolonized by D. trenchii, symbiont populations
(26d13 + 32d1, Figures 4A,B). There was a decline in all also initially persisted under thermal stress conditions (Figure 4D
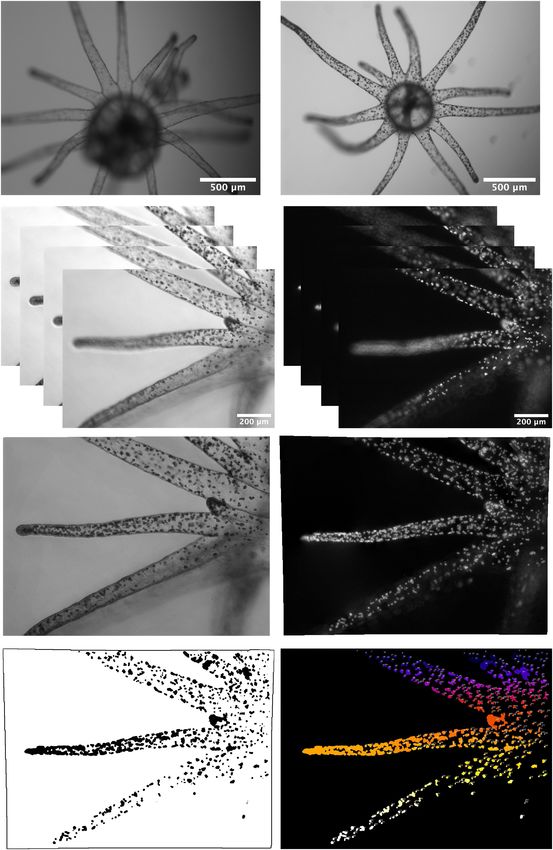
Frontiers in Marine Science | www.frontiersin.org 8 March 2022 | Volume 9 | Article 808696Tivey et al. Spatiotemporal Colonization Patterns in Aiptasia FIGURE 4 | Colonization by B. minutum, S. microadriaticum, and D. trenchii over 4 weeks at 26 and 32◦ C. (A) Bleached Aiptasia polyps were colonized with one of three species of algal symbionts: B. minutum, S. microadriaticum, and D. trenchii and subjected to a temperature treatment of a constant 26◦ C or a temperature shift from 26 to 32◦ C to compare colonization and bleaching phenotypes. The total numbers of cells per sample image-stack were measured over a 4 week period for each symbiont (3 sample image-stacks per anemone host, 12 anemones per treatment). During the first week both treatments received the same 26◦ C temperature treatment to promote colonization. After 7 days, one temperature treatment remained at 26◦ C and the other temperature treatment was moved to 32◦ C. Aiptasia were inoculated with a concentration of 5 × 10⁵ cells • mL−1 . Y -axis is log10 transformed for clarity. (B–D) The mean number of cell clusters per image-stack were binned into discrete cell cluster sizes measured over 3 weeks for each symbiont species, (B) B. minutum, (C) S. microadriaticum, and (D) D. trenchii. 26◦ C treatment for 3 weeks is shown on the positive y-axis, while 26–32◦ C treatment is shown on the negative y-axis, reflected across the x-axis for comparison. The beginning of the difference in treatment conditions is indicated by a vertical dotted line at 13 days post-inoculation. Error bars signify standard error for the total abundance of clusters or cells. Letters (A) and asterisks (B–D) indicate significant differences between temperature treatments within symbiont species at each timepoint by Tukey post hoc tests (*p < 0.05, **p < 0.01, ***p < 0.001). Frontiers in Marine Science | www.frontiersin.org 9 March 2022 | Volume 9 | Article 808696
Tivey et al.                                                                                            Spatiotemporal Colonization Patterns in Aiptasia

and Supplementary Figure 6). D. trenchii inoculations resulted              test was applied between observed data set and each migration
in the lowest levels of algal colonization of hosts prior                   simulation to compare total cluster number across timepoints
to bleaching, with fewer than ten symbionts on average                      (Supplementary Table 5). The closest migration rate matching
per sample image. These small populations persisted under                   observed data was 1% per day (χ 2 = 5257.04, df = 127, p < 1
thermal stress for 1 week in host polyps before showing                     · 10−5 ; Figure 5E and Supplementary Table 5). However, the
population reductions in all clusters at day 25 (26d13 + 32d12,             migration model consistently overestimated singlet clusters and
p < 0.001, Tukey post hoc test; Figure 4D). By day 33                       underestimated cluster sizes between three and ten (Figure 5E
(26d13 + 32d20, Figure 4D), all symbionts had been lost                     and Supplementary Table 6).
from host polyps.                                                              To model a more rapid transition of singlet clusters
                                                                            into larger-sized clusters, the daily total population growth
                                                                            was instead distributed among individual clusters using root
Experiment 3: Model Comparisons to                                          transformations of cluster size, which resulted in a faster growth
Estimate Effects of Migration on                                            rate for smaller clusters and a slower growth rate for large clusters.
Symbiont Colonization Patterns                                              A series of root transformations were used in conjunction with
To better understand the mechanisms governing population                    migration rates between 0.5 and 10% to generate population
growth of symbiont clusters, we created population simulations              simulations. All simulated datasets including non-transformed
to test the effect of migration rate, i.e., egress of algae from            data (n = 63) were compared against observed data using
existing clusters to form new clusters, on symbiont colonization            chi-square goodness of fit tests (Supplementary Tables 5,
patterns. Self-starting nls logistic models were fit to Experiment          6). Among all simulations tested, the simulation that most
3 colonization by native symbiont B. minutum under 26◦ C                    consistently estimated observed cluster growth was a square-
conditions by using summed cell populations per sample image                root transformation with a migration rate of 1% (Figure 5F).
from between day 4 and day 31 (Figure 5A). Logistic growth                  The dataset was still significantly different from observed data
models generated three numeric parameters for each biological               (χ 2 = 5039.69, df = 127, p < 1 · 10−5 ; Supplementary
replicate (n = 12), representing the asymptote, the inflection point        Table 5). Singlets and clusters with over 10 cells remained
of the logistic curve, and y-axis scaling parameter in the equation         elevated compared to observed data, but the overall distribution
y = asymptote/[1 + exp((inflection-x)/scale)] (Supplementary                of cells among cluster sizes was more representative of measured
Table 4). A linear model described the data within this period              populations (Figure 5F and Supplementary Table 6).
but overestimated population growth in the days following,
whereas a logistic model provided a better estimate of the slowing
population growth in the tentacles (Supplementary Table 4).                 DISCUSSION
    These parameters were then used to simulate new symbiont
populations for each biological replicate. Three random samples             This study is a first step in describing symbiont populations
of clusters per biological replicate were taken from observed data          within the context of their dynamic spatial landscape of colonized
at day four, with each sample containing the mean number of                 cnidarian tissue. Our imaging methods are a simple and
clusters per replicate. Using parameters specific to each biological        affordable method for capturing symbiont proliferation patterns
replicate, a growth rate was applied to these cell populations each         under colonizing and bleaching conditions. Using this dataset, we
day up to day 33 (Figure 5B). Daily total population growth                 were able to model and infer the role of symbiont migration (i.e.,
was distributed proportionally to each cell so that each cell               egress and subsequent inoculation) within cnidarian tissue. We
grew at the same rate. Comparison of total observed population              found that the colonization process is not a discrete set of ordered
growth (Figure 5A) and a simulation of total population growth              steps but rather an iterative process that involves continual
(Figure 5B) follow the same summary logistic model, but with                inoculation of aposymbiotic tissue, most likely sustained by
substantially more variation in observed data.                              symbiont egress and migration, coupled with localized symbiont
    To visualize the effect of allowing population growth but               growth and proliferation.
no migration, observed data (Figure 5C) was compared with
simulated data showing growth of only the original clusters                 Early Proliferation of Cells, Cell Cluster
from day 4 (Figure 5D). This type of growth was not
representative of the cluster sizes found in our observed
                                                                            Abundance, and Symbiont Uptake
population (χ 2 = 23419.03, df = 127, p < 1 · 10−5 ;                        Contribute to Colonization Success of
Supplementary Table 5). To more closely replicate observed                  Native Symbiont Species
data, a daily cell migration probability was set for each                   Across our experiments with native B. minutum colonizing
simulated cell population to model cells egressing from clusters            Aiptasia polyps, we found predictive symbiont patterns that were
to establish new clusters. Briefly, a set migration probability             broadly consistent across three distinct colonization timelines.
was applied to each cell in a sample population for each day.               Colonization resulted from localized symbiont proliferation
If the resulting outcome was migration, then the cell was                   centered around locations of symbiont inoculation events, as well
subtracted from its cluster and added back into the sample                  as from what appeared to be new migration events (e.g., new
population as a new singlet cluster. Migration probabilities                singlet clusters) occurring throughout the colonization timeline.
between 0.5 and 10% were tested. A chi-square goodness of fit               In each experiment, increased frequencies of both singlet

Frontiers in Marine Science | www.frontiersin.org                      10                                       March 2022 | Volume 9 | Article 808696
Tivey et al. Spatiotemporal Colonization Patterns in Aiptasia FIGURE 5 | Population growth and migration models. (A) Data from Experiment 3 (B. minutum populations at 26◦ C) were used to create simulated population growth models. Total symbiont populations for each sample over time are represented by boxplots, with points showing outliers at each timepoint. The dashed line depicts a representative summary logistic model for all samples [y = 1249.146/(1 + e((15.916−x)/5.815) ]. (B) Simulated data was created using logistic model parameters generated from observed populations for each biological replicate. Boxplots indicate total symbiont populations for each simulated sample over time. The same representative summary logistic model as above is indicated by the dashed line. The modeled data shown was generated using a 1% migration rate and a cluster density-dependent growth rate. (C–F) The mean number of clusters per sample image for each cluster size are displayed for observed and simulated data. (C) Observed data replicated from Figure 4B for comparison. (D) Simulated data with no migration allowed and a logistic growth rate unique to each host anemone applied uniformly applied across sample populations. (E) Simulated data with cells allowed to egress from clusters to create new singlet clusters. Each cell was given a daily 1% probability of migration and had a uniformly applied growth rate. (F) Simulated data with a 1% probability of migration and a cell density-dependent transformation, in which daily population growth is allotted to cells using a square-root transformation to slow the growth of large clusters and instead apply population growth to smaller sized clusters. Error bars signify standard error. and doublet populations were short-term predictors of overall at a consistent rate and were accurate long-term indicators of colonization establishment; these recurring migration events increased symbiont density and colonization establishment. during colonization preceded immediate increases in overall Although patterning of colonization was consistent across population growth. Larger symbiont cluster sizes were also useful experiments, the rate of symbiont population growth depended predictors; clusters containing more than 10 cells grew in number strongly on the initial number of symbionts and clusters. In Frontiers in Marine Science | www.frontiersin.org 11 March 2022 | Volume 9 | Article 808696
Tivey et al.                                                                                          Spatiotemporal Colonization Patterns in Aiptasia

low-density symbiont inoculation of tiny anemones (Figure 2),              21 for D. trenchii (Figures 4A,D). This benchmark acted as
symbiont populations only grew if there were at least two                  a threshold for non-native species; before reaching this level
symbiont cells per tentacle. In larger polyps, colonization                of colonization, non-native species increased relatively slowly
success could be measured by consistent increases in both                  over the first few weeks, whereas afterward symbiont growth
symbiont numbers and clusters (Figure 3C). In measuring                    was much more robust. In our experiments, only a handful of
this success, an important timepoint in the progression of                 inoculations of S. microadriaticum proliferated with a slower
native B. minutum colonization was an increased level of                   but similar pattern to B. minutum, resulting in the lowest
larger cluster sizes (greater than five cells) and a symbiont              colonization averages overall (Figure 4A and Supplementary
density of between 100 and 200 cells and 25 cell clusters                  Figure 5). A large proportion of D. trenchii inoculations began
per sample image, as measured on day 2 of Experiment 2                     substantial proliferation of symbiont clusters after 3 weeks
(Figure 3A) and day 7 of Experiment 3 (Figure 4A and                       (Supplementary Figure 6). Even in replicates with the most
Supplementary Figure 4). Between these two experiments, these              robust initial colonization, non-native symbiont populations
strong differences in the timing of overall symbiont population            more closely matched the slowest growing native populations
growth correlated with significant differences in levels of native         (Supplementary Figures 4–6).
B. minutum uptake within the first 4 days of initial inoculation.              Lower amounts of symbiont uptake and slower rates of
Differences in this uptake could have arisen from very                     host colonization by these non-native species were consistent
small residual symbiont populations in aposymbiotic Aiptasia               with previous Aiptasia studies (Colley and Trench, 1983; Belda-
used in Experiment 2. Alternatively, there could have been                 Baillie et al., 2002; Gabay et al., 2018). Gabay et al. (2018)
differences in growth rate and density of B. minutum cultures,             specifically examined the colonization patterns of symbionts
or differences in menthol bleaching history of aposymbiotic                within adult aposymbiotic Aiptasia and found that unsuccessful
Aiptasia. Despite these differing colonization timelines, native           colonization with non-competent symbiont Effrenium voratum
B. minutum experienced similar early proliferation cluster                 failed from the beginning, and that those with competent
patterns. These first 2 weeks of colonization are a critical               but non-native symbionts, S. microadriaticum and D. trenchii,
time of symbiosis establishment, prior to log-phase growth                 start slowly and take twice as long to recolonize hosts than
of symbionts within hosts. Early proliferation has been a                  do B. minutum. These slower rates of colonization of a
common indicator of colonization success in many studies,                  cnidarian host by non-native symbiont species have been
and is a characteristic of colonization by native symbionts                observed in the colonization of the scyphozoan aposymbiotic
(Schoenberg and Trench, 1980; Davy et al., 1997; Belda-Baillie             Cassiopeia xamachana, a scyphozoan, and sea anemone Cereus
et al., 2002; Gabay et al., 2018). Furthermore, past studies               pedunculatus, a sea anemone (Colley and Trench, 1983;
have shown that the initial symbiont density at 2 weeks                    Davy et al., 1997).
appeared predictive of overall length and intensity of colonization
(Belda-Baillie et al., 2002).
                                                                           Heat Stress Immediately Impacts Native
                                                                           Symbiont Populations Colonizing Host
Non-native Symbiont Populations Are
                                                                           Tissue
Limited by Variation in Host Uptake and                                    Polyps recolonized by native symbiont B. minutum experienced
Slower Growth but Proliferation Patterns                                   consistent symbiont cluster patterns during thermal stress. Larger
Remain Consistent                                                          cluster sizes decreased, and smaller cluster sizes temporarily
Non-native symbiont species S. microadriaticum and D. trenchii             remained stable or increased before subsequently decreasing
recolonized aposymbiotic Aiptasia adults more slowly and                   through algal loss (Figures 3B, 4B). The initial winnowing
with significantly higher variation across animals than did                of larger symbiont clusters may be a function of local tissue
B. minutum (Figure 4). Despite the stochastic failure to                   stress, which would result from local effects of reactive oxygen
robustly colonize with non-native species, in general the same             species production from both high algal densities and the
symbiont cluster patterning and growth occurs irrespective                 host cells that contain these multiple algal cells (Lesser, 1996;
of symbiont species. For each symbiont species, doublet and                Perez and Weis, 2006; Hawkins and Davy, 2012). This stress
triplet clusters each averaged greater than 10 clusters in polyps          could also result directly in the temporary stability/increase
with rapid symbiosis establishment (i.e., continuous population            of singlet clusters in B. minutum populations immediately
growth over time), and averaged fewer than 10 clusters in                  post-bleaching, as increased exit of larger clusters may leave
polyps with slow symbiosis establishment (Supplementary                    neighboring host cells containing only singlets. The subsequent
Figures 4–6). Therefore, in our experiments the most important             rapid disappearance of B. minutum singlet populations indicated
stage of symbiont incompatibility occurred during initial                  the relatively poor tolerance of the B. minutum—Aiptasia
inoculation (especially with S. microadriaticum). Similar to               symbiosis to heat stress. Additional video observations were
native species, an important moment in colonization was the                gathered during the time-point immediately following thermal
consistent measurement of larger clusters (greater than five               stress treatment (Movie 1). In many samples, circulation of large
cells) coupled with a symbiont density of between 100 and                  symbiont clusters was observed within the gastrovascular cavity
200 cells and 25 cell clusters per sample image, as found                  of the column and tentacles as evidenced by autofluorescence
on day 25 for S. microadriaticum (Figures 4A,C), and day                   of the clusters. As a consequence of environmental stress,

Frontiers in Marine Science | www.frontiersin.org                     12                                      March 2022 | Volume 9 | Article 808696
You can also read