Surface aggregations of Calanus finmarchicus during the polar night
←
→
Page content transcription
If your browser does not render page correctly, please read the page content below
ICES Journal of Marine Science, 2022, 79, 803–814
DOI: 10.1093/icesjms/fsac030
Advance access publication date: 16 March 2022
Original Article

Surface aggregations of Calanus finmarchicus during the
polar night
Boris Espinasse 1,* , Malin Daase                           1
                                                                , Elisabeth Halvorsen1 , Marit Reigstad1 , Jørgen Berge1,2,3
and Sünnje L. Basedow1
1
  Department of Arctic and Marine Biology, UiT The Arctic University of Norway, Tromsø, Norway
2
  University Centre in Svalbard, Longyearbyen, Norway
3
  Centre for Autonomous Marine Operations and Systems, Department of Biology, Norwegian University of Science and Technology,

                                                                                                                                                             Downloaded from https://academic.oup.com/icesjms/article/79/3/803/6549746 by guest on 02 July 2022
Trondheim Norway
* Corresponding   author: tel: +47 939 268 90; email: boris.espinasse@laposte.net.

While marine ecosystems in polar areas were thought to be mostly inactive during the polar night, recent observations in the Arctic highlight
that dynamic biological interactions occur across all trophic levels. One particularly interesting observation made repeatedly is the occurrence
of Calanus finmarchicus, a key species at the base of the food web, in the upper part of the water column in early January. This contrasts with
the confirmed life cycle of this copepod, which predicts descent to overwintering depths in autumn and ascent at the end of the winter. Here,
we compiled 6 years of data from the polar night to explore this unusual behaviour and to investigate the underlying mechanisms that may
cause these surface aggregations. Highest abundance of C. finmarchicus in surface waters was closely related to Polar Surface Water in the
vicinity of the sea ice edge. A total of six hypotheses are assessed to explain this distribution pattern, which includes passive transport and
active behaviour as a way to improve survival chances or food access. In the context of climate change and sea ice decrease, the presence of
lipid-rich copepods in cold surface waters could be a key parameter in driving the spatial distributions of top predators in the Arctic.
Keywords: Arctic Ocean, ice edge, overwintering, vertical distribution, vertical migration.

Introduction                                                                         conditions (primary productivity and sea temperature; Melle
Copepods of the genus Calanus are lipid-rich organisms that                          et al., 2014).
accumulate large energy stores in form of wax esters during                             Calanus finmarchicus is an Atlantic species with its core
the productive season. These lipids sustain the organisms dur-                       habitat in the basins of the North Atlantic. The copepod is
ing the low productive season, and fuel maturation and repro-                        transported in large numbers northward from the Norwe-
duction at the end of the overwintering period (Falk-Petersen                        gian Sea into the Arctic basin via the Fram Strait (Basedow
et al., 2009). Due to their high energy content, Calanus spp.                        et al., 2018; Wassmann et al., 2019) and is commonly ob-
are an important, high quality food source for planktivorous                         served west and north of Svalbard, an area heavily influenced
predators, and are a key resource in polar and subpolar re-                          by the inflow of relatively warm Atlantic Water (AW). During
gions (Pershing and Stamieszkin, 2020). The life history strate-                     the polar night and throughout winter, when primary produc-
gies of Calanus species in the North Atlantic and Arctic have                        tion is low and other food sources are scarce, the supply of
been described extensively (e.g. Conover, 1988; Bonnet et al.,                       lipid-rich organisms might be crucial for the survival of per-
2005; Daase et al., 2013; Melle et al., 2014). There are species-                    manent resident planktivorous species of seabirds, fish, and
specific differences in for example generation time, energy re-                      marine mammals. But by residing at overwintering depths, a
quirements for reproduction and growth, and timing of repro-                         large part of the Calanus population is inaccessible for most of
ductive events, reflecting adaptations to environmental condi-                       these predators. However, recent observations have revealed
tions in their main area of distribution (Falk-Petersen et al.,                      the unexpected presence of C. finmarchicus in the surface layer
2009). However, the general life cycle is similar for all Calanus                    off north Svalbard coast in early January (Daase et al., 2014;
species and includes an ontogenetic vertical migration at the                        Berge et al., 2015a, 2020, Daase and Søreide 2021). An in-
end of the summer, when the copepods migrate to greater                              dividual based life-history model also indicates that an early
depth where they spend the winter in a state of diapause. This                       ascent from overwintering depth does not necessarily reduce
migration to deeper and colder waters is regarded as an adap-                        fitness (Hobbs et al., 2020). Concurrently, high levels of activ-
tation to avoid predation in surface layers, to reduce metabolic                     ity have been observed at different trophic levels during the
costs, and it may help to retain the population in an area by                        polar night, previously thought to be a period of rest for the
limiting the exposure to advective processes in upper water                          marine ecosystem (Berge et al., 2015b). Furthermore, popula-
layers (Hirche, 1996; Brierley, 2014; Chen et al., 2021). The                        tion strategies that are emerging from recent individual-based
ascent towards surface waters usually takes place in late win-                       models (Maps et al. 2012, Bandara et al. 2021) indicate a flexi-
ter with variations in the timing depending on environmental                         ble overwintering strategy with copepods descending to over-

Received: October 8, 2021. Revised: January 26, 2022. Accepted: February 7, 2022

C The Author(s) 2022. Published by Oxford University Press on behalf of International Council for the Exploration of the Sea. This is an Open Access

article distributed under the terms of the Creative Commons Attribution License (https://creativecommons.org/licenses/by/4.0/), which permits unrestricted
reuse, distribution, and reproduction in any medium, provided the original work is properly cited.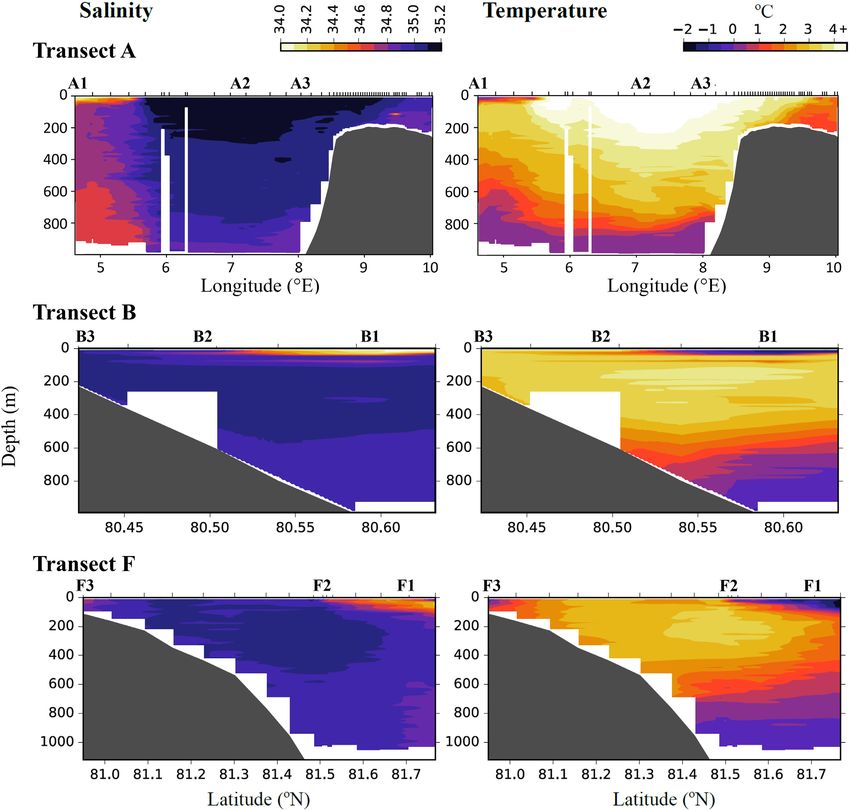
804                                                                                                                 B. Espinasse et al.

wintering and ascending almost continuously over the year           were counted from each sample. Samples with low abundance
(bet-hedging strategy).                                             were examined in their entirety. A few copepodite stage III
   The increasing observations and model-based support, in-         were found but were not included in this study where we fo-
dicate that lower trophic level dynamics in the Arctic during       cused on older overwintering stages. Hereafter, the denomina-
winter are not yet well-understood. With changes in sea ice         tion C. finmarchicus CIV to adult refers to the sum of CIV, CV,
extent and concomitant bloom phenology, species are able to         and adults (both male and female) stages. Copepodite stages
extend their spatial distribution range into areas previously       of the morphologically similar Calanus glacialis and C. fin-
not suitable (Strand et al., 2017; Ershova et al., 2021, Freer      marchicus were distinguished based on prosome length using
et al., 2022). However, the lack of a full comprehension of         previously established size classes (Daase et al., 2018). Genetic
life history strategies and adaptation in key species hampers       identification conducted on 44 randomly selected Calanus in-
our understanding of how the poleward flux of boreal species        dividuals sampled at station C1 (Choquet et al., 2017) showed
will affect food webs and ecosystem functioning (Haug et al.,       very similar species composition to the length-based identifi-
2017; Kaartvedt and Titelman, 2018).                                cation, with the contribution to the Calanus pool estimated as
   The presence of C. finmarchicus in surface waters during         C. finmarchicus 89.9%, C. glacialis 9.5%, and C. hyperboreus

                                                                                                                                          Downloaded from https://academic.oup.com/icesjms/article/79/3/803/6549746 by guest on 02 July 2022
winter needs to be described and explained more systemati-          0.5% using length-based identification, and C. finmarchicus
cally, to be able to assess the evolution of this newly docu-       91%, C. glacialis 9%, and C. hyperboreus 0% using the ge-
mented behaviour and its impact on higher trophic levels. In        netic method.
this study, we gathered published and unpublished data col-            The weighted mean depth (WMD) of C. finmarchicus was
lected west and north of the Svalbard Archipelago during the        calculated for each station following the equation (Roe et al.,
polar night. We aim to determine whether the presence of C.         1984):
finmarchicus close to the surface during the polar night is a                            n                   n
reoccurring feature or only an occasional phenomenon, and                      W MD =            abi zi dzi /    abi dzi ,
                                                                                             i=1              i=1
to assess potential mechanisms that might explain this unex-
                                                                    where n is the number of layers, and for a layer i, abi is the
pected distribution pattern.
                                                                    abundance of C. finmarchicus per cubic meter in the layer, zi
                                                                    the mean depth of the layer, and dz the thickness of the layer.
                                                                       For three of the cruises (2015–2017), the prosome length of
Methods
                                                                    C. finmarchicus CV were recorded. This allowed us to describe
Data on mesozooplankton composition and abundance were              the size distribution of individuals of the same developmental
collected in concert with data on the physical environment          stage at different locations and depths. When the size distribu-
in the study area between ca. 80◦ N, 12◦ E and 82◦ N, 20◦ E,        tions showed a strong bimodal pattern, we fitted a Gaussian
with the addition of one transect located upstream along the        mixture model to the data to define the mean length of the
west coast of Svalbard (Figure 1, map produced with the Mat-        two different size groups. This analysis was performed using
lab package M_Map (Pawlowicz, 2020)). Samples were col-             Matlab (version R2014a) and the function fitgmdist.
lected during five cruises with R/V Helmer Hanssen in January
2012, 2014, 2015, 2016, and 2017 as part of different projects      Hydrography and physical parameters
dealing with the ecological impacts of the AW inflow into the
                                                                    At each station, measurements of temperature and salinity
Arctic Ocean and polar night ecology (Table 1). We present
                                                                    were obtained by a ship-board conductivity, temperature, and
here both published (4: A1–3, E1; Daase et al., 2014; Base-
                                                                    depth (CTD) profiler (SBE911plus, SeaBird Electronics). In
dow et al., 2018, Daase and Søreide 2021) and unpublished
                                                                    addition, a certain number of CTD casts were performed in
(10) datasets for a total of 14 stations.
                                                                    between the stations to better resolved water mass distribu-
                                                                    tion. CTD data were quality-checked to identify and remove
Zooplankton sampling and data analysis                              out-of-range values.
The mesozooplankton community was sampled by depth                     To investigate the relationship between surface aggrega-
stratified vertical hauls with a multiple opening/closing net       tions of C. finmarchicus and water masses, we identified differ-
(Multinet, Hydrobios, Kiel, mouth opening 0.25 m2 , 180 μm          ent water masses using T–S diagrams (Supplementary Figure
mesh size) hauled from close to the seafloor (or ca 1000 m          S1). For this, potential temperature  and density were com-
depth) to the surface with a towing speed of 0.5 m s–1 . Sam-       puted using the seawater package (version 3.3.4) in python
ples were preserved in a 4% formaldehyde-in-seawater solu-          (version 2.7.11).
tion until analysis ashore. Between 3 and 6 sampling depth             To investigate if surface aggregation may be caused by
layers were used across the cruises. To compare differences in      upwelling along the shelf slope, we computed the offshore
abundance and population structure in different depth layers        Ekman transport from 6-h frequency wind data measured
between stations, we fitted the data into five predefined layers:   at the geographical point 80.65◦ N, 25.00◦ E (source: eK-
1000–600 m, 600–200 m, 200–100 m, 100–50 m, and 50–0                lima.met.no). It represents the flow in m3 s–1 integrated over
m depth.                                                            the surface Ekman layer for a cell of 1-m width, and was cal-
   Multinet samples were examined under a Leica stereomi-           culated following the equation:
croscope for enumeration and taxonomic analyses of zoo-
                                                                                    Qy = ρairCDUUy / ρwat f ,
plankton. From the preserved samples, sub-samples were ob-
tained with a 5-ml automatic pipette, with the pipette tip cut      with the density of air, ρ air = 1.25 kg m–3 , the density of wa-
at 5 mm diameter to allow free collection of mesozooplank-          ter, ρ wat = 1027 kg m–3 , the drag coefficient, CD = 1.6 10–3 , f
ton. Large (total length > 5 mm) organisms were removed             being the Coriolis parameter, and U the wind speed. The sys-
and counted before taking sub-samples. The number of sub-           tem axis was set parallel to the coast so that the Qy compo-
samples analyzed was chosen so that at least 150 Calanus spp.       nent showed offshore/inshore Ekman transport. Then, to test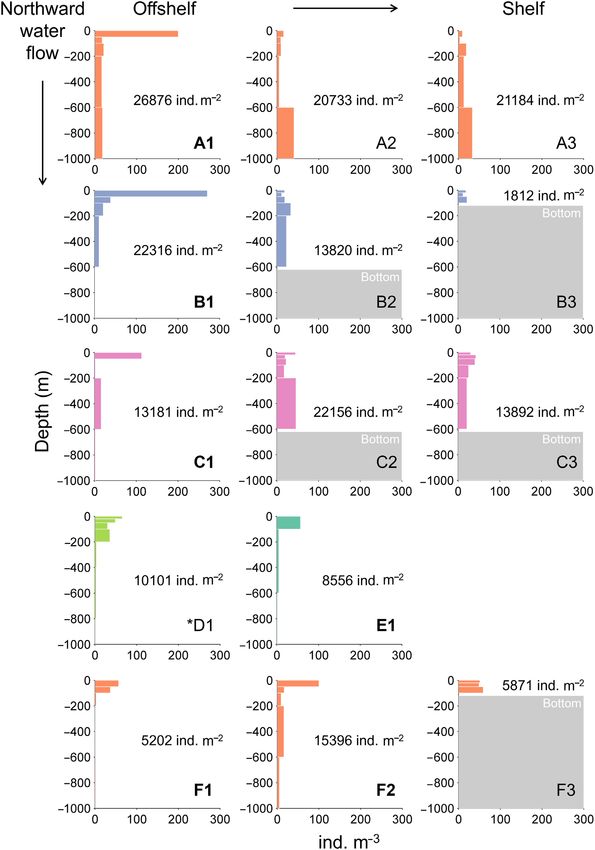
Surface aggregations of Calanus finmarchicus during the polar night                                                                                  805

                                                                                                                                                             Downloaded from https://academic.oup.com/icesjms/article/79/3/803/6549746 by guest on 02 July 2022
Figure 1. Location of the sampling stations around Svalbard Islands. The years of sampling are shown. The main inflow of AW into the Arctic Basin (red
line), and approximate location and movement of Polar Surface Water are shown (blue dashed line). The black cross represents the wind station.

Table 1. Sampling details including sea ice coverage (from 0 to 1; 1 = fast ice), distance to the open ocean ice edge (defined as sea ice coverage > 0.3),
and sea temperature range in the top 50 m.

                                           Latitude          Longitude           Bottom              Sea ice           Distance to          Temperature
Station                 Date                (◦ N)              (◦ E)            depth (m)           coverage          ice edge (km)          range (◦ C)

A1               January 12th, 2014          79.00              4.36              2 564                 –                  43                −0.8–1.2
A2               January 13th, 2014          79.00              7.01              1 197                 –                   97               4.9–5.9
A3               January 13th, 2014          79.00              8.00              1 087                 –                  117               5.0–5.0
B1                January 8th, 2015          80.59             12.62              1 000               0.01                  37              −1.8–−0.80
B2                January 8th, 2015          80.49             13.05               609                0.00                  47               2.0–3.2
B3                January 8th, 2015          80.41             13.55               229                  –                   58               2.9–3.0
C1               January 15th, 2016          80.96             14.96              1 628               0.00                 39                −1.5–2.5
C2               January 16th, 2016          80.73             13.98               591                  –                  57                3.2–3.5
C3               January 15th, 2016          80.84             16.94               608                  –                  60                3.5–3.5
D1               January 12th, 2017          81.38             15.07              2 289               0.31                 41                2.6–3.1∗
E1               January 13th, 2012          81.74             14.25              2 276               0.94                   0              −1.85–1.00
F1               January 10th, 2014          81.77             19.16              3 168               0.87                   0                 −1.8
F2                January 9th, 2014          81.5              17.43              1 767               0.29                  19               −1.1–0.9
F3                January 8th, 2014          80.95              20                 125                0.01                  86               0.2–0.3
∗
    Top 10 m missing.

for relative differences in wind conditions between years, an                  date, based on the product ‘PHY_001_030’ available on the
estimation of the Ekman transport was calculated by averag-                    Copernicus platform.
ing Qy values over a 10-d period prior to the first sampling
station (the maximum interval between first and last station
was 2 d). We restricted this analysis to 2014, 2015, and 2016                  Results
when C. finmarchicus abundance data and CTD measure-                           Calanus finmarchicus horizontal and vertical
ments are available along shelf-offshore transects that provide                distribution
a more detailed insight into water mass distribution and aggre-                A general decrease of C. finmarchicus (CIV to adult) inte-
gation patterns to aid the interpretation of eventual upwelling                grated abundance was observed from southwest to northeast,
events.                                                                        with highest abundance found at the offshore station on the
   To analyze if surface aggregations were related to the pres-                west coast of Svalbard (∼26 800 ind. m–2 ; transect A; Figure
ence of sea ice, sea ice concentrations at the sampling loca-                  2). Within each transect, maximum abundances were usually
tions were computed as a 3-d average prior to the sampling                     found off the shelf above the continental slope. Along the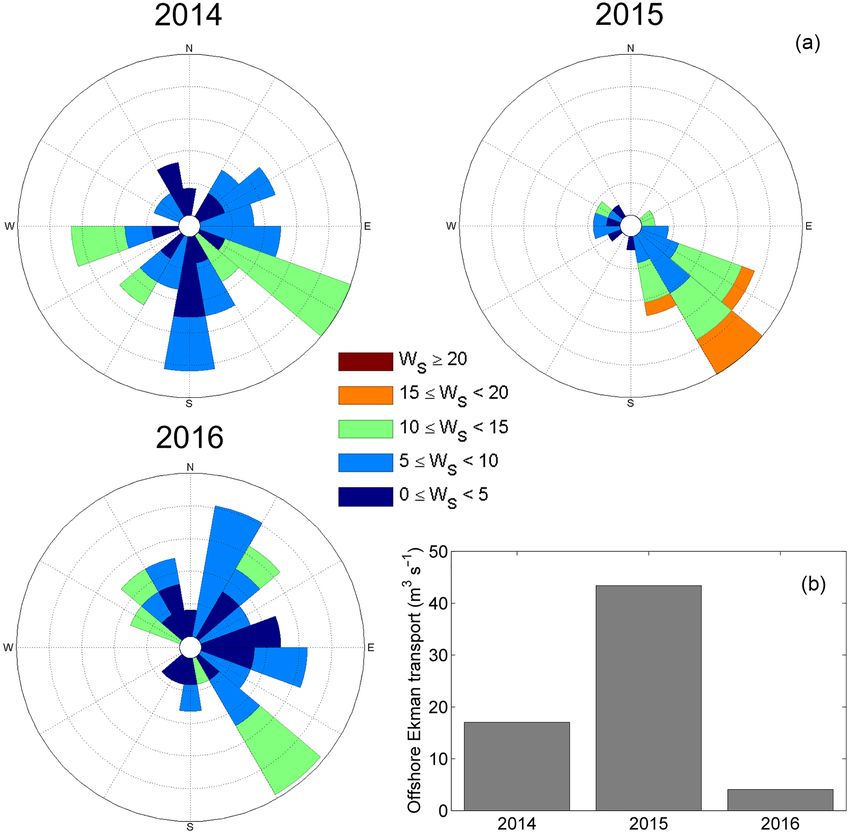
806                                                                                                                                B. Espinasse et al.

                                                                                                                                                          Downloaded from https://academic.oup.com/icesjms/article/79/3/803/6549746 by guest on 02 July 2022

Figure 2. Vertical distribution of C. finmarchicus CIV to adults in the water column during January 2012 and 2014–2017 (see Figure 1 for colour code).
Polar Surface Waters occurred at stations in bold (undefined at D1). The abundance integrated over the water column (ind. m–2 ) are also shown. Station
locations go from southwest to northeast (a)–(f) and from offshelf to shelf (1)–(3).

northern coast, the stations located farthest offshore showed                 C. finmarchicus, with slightly higher abundances occurring
relatively low abundances (C1, D1, E1, and F1).                               sporadically in deep layers (Figure 2). These differences
   Higher densities of C. finmarchicus were found within                      in C. finmarchicus vertical distribution are supported by
the upper layers of some of the stations offshore, with                       the WMD of the copepods being located closer to sur-
maximum values in the surface layer (0–50 m, up to 270                        face for the stations close to the ice edge (standardized
ind. m–3 ) while densities decreased sharply downward. Other                  WMD of 0.07–0.34), compared to other stations (0.45–0.68,
stations showed a relatively uniform depth distribution of                    Table 2).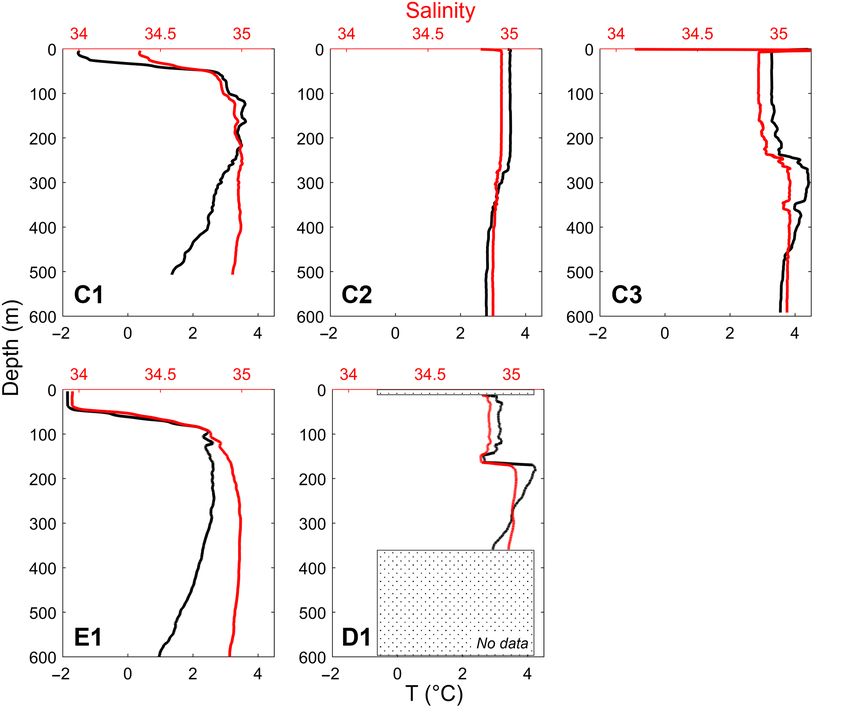
Surface aggregations of Calanus finmarchicus during the polar night                                                                   807

Table 2. WMD of C. finmarchicus (CIV to adult). The last column shows     F1, and F2 but that was generally associated with low total
where the WMD is located relatively to the height of the whole sampling   Calanus abundances.
profile (standardized WMD). For example, if the WMD is 50 m and the
                                                                             For a number of stations and depth layers, C. finmarchi-
water column height is 100 m, the standardized WMD is equal to 0.5, but
if the water column height is 1000 m then the standardized WMD is equal
                                                                          cus CV showed a bimodal length frequency distribution (Sup-
to 0.05. Polar Surface Waters (PSW) occurred at stations in underlined    plementary Table S2), with the two size classes differing sig-
italic.                                                                   nificantly in prosome length (mean difference of ca. 0.4 mm,
                                                                          Supplementary Figure S2). This was particularly obvious at
                   Water column                          Standardized     offshore stations B1, C1, and D1, where two size groups were
Stations            height (m)         WMD (m)              WMD
                                                                          observed in most layers. However, no patterns emerged be-
A1                     1 000              339                0.34         tween size patterns and distance to the coast or depth layer.
A2                     1 000              681                0.68
A3                     1 000              619                0.62
B1                     1 000              128                0.13         Discussion
B2                      600               300                0.50
B3                      100                53                0.53         Our data collected during six polar night campaigns show

                                                                                                                                             Downloaded from https://academic.oup.com/icesjms/article/79/3/803/6549746 by guest on 02 July 2022
C1                     1 000              256                0.26         that C. finmarchicus aggregated in PSW during the polar night
C2                      600               339                0.57         and that this is a recurring feature. The presence of part of
C3                      600               266                0.45         the population in the surface layer during winter has been re-
∗
  D1                   1 000              173                0.17
E1                     1 000              182                0.18
                                                                          ported previously from Svalbard fjords (Daase et al., 2018;
F1                     1 000               66                0.07         Berge et al., 2020), in the western Barents Sea (Pedersen et
F2                     1 000              300                0.30         al., 1995), and in the Greenland Sea Gyre (Hirche, 1991; Fort
F3                      100                52                0.52         et al., 2010). However, in this study we highlight the occur-
∗
    Occurrence of PSW undefined.                                          rence of high concentration aggregations (usually > 100 ind.
                                                                          m–3 ), representing sometimes more than half of the total C.
                                                                          finmarchicus population, constrained in a thin layer near the
                                                                          surface (depth of 0–50 m). We observed these surface aggre-
Hydrography and Ekman transport
                                                                          gations in different years and over a large geographical area,
In all years the predominating water mass was AW (potential               particularly off shelf and in proximity to the ice edge.
temperature  > 1◦ C; Rudels et al., 2005; Pérez-Hernández et                One important piece of information currently missing is
al., 2017), which occupied roughly the upper 600 m (Figures 3             whether the individuals observed in the surface layer in Jan-
and 4). The AW layer was thickest along the shelf break. Below            uary had descended to overwintering depth at all or if they re-
the layer of AW, the water column was thermally stratified and            mained in surface waters since summer. Previous observations
occupied by gradually colder AW and by Modified AW (0◦ C <                of C. finmarchicus attested that part of the population was
 < 2◦ C, σ T > 27.7; Rudels et al., 2000). Polar Surface Water           present in the surface layer during the period from October to
(PSW), characterized by low salinity (< 34.9) and temperature             January in the North Atlantic (Hirche, 1991; Pedersen et al.,
( < 0◦ C) was observed above AW at most of the offshore                  1995). However, these studies recorded only small abundances
stations, except for the stations A2 and A3 located on the west           and the process behind these observations remains unclear. In
coast of Svalbard. The layer of PSW reached down to ca. 100               our study area, Calanus spp. have been observed in surface
m farthest northeast (transect F), but occupied only the upper            as late as end of September (Walkusz et al., 2009), but no
ca. 20 m further southwest, at stations B1 and C1.                        data are available on Calanus abundances and distributions
   Southeasterly winds were dominating during the research                for the period October–December. We can, therefore, not as-
cruises conducted in 2014–2016 resulting in a positive off-               sess whether the high concentrations observed in January were
shore Ekman transport. The averaged Ekman transport was                   due to recent aggregations or had persisted since late autumn.
the highest in 2015 reaching 43.4 m3 s–1 (Figure 5).                         To explain these unusual surface aggregations in mid-
                                                                          winter, we discuss six hypotheses independently. However,
Calanus distribution in relation to hydrography                           the hypotheses are not mutually exclusive, and the behaviour
Highest C. finmarchicus abundances (> 100 ind. m–3 ) were                 of C. finmarchicus outside its core habitat is probably best ex-
found in water masses with characteristics corresponding to               plained by a combination of two or more of these. Our study
PSW ( < 0◦ C, and S < 34.9; Figure 6). The large increase in             is based on samples collected during cruises with various
the contribution of C. finmarchicus to the total copepod pool             scientific objectives, implying that some type of contextual
in these surface layers compared to the deeper layers demon-              data were not systematically sampled conjointly, limiting us
strates that this surface aggregation process was specific to C.          in testing thoroughly some of the hypotheses. Therefore, the
finmarchicus and not found in the rest of the copepod com-                following discussion is rather meant to set a framework for
munity (Table 3).                                                         future explorations.

Calanus stage and size composition                                        Hypothesis #1—advection by upwelling
In all years and at all stations the C. finmarchicus population           Perhaps the most intuitive way to explain the aggregation of
was dominated by copepodite stage V (CV), except for off-                 C. finmarchicus in surface layers is upwelling, forcing the pop-
shore station E1 (Supplementary Table S1). Copepodite stage               ulation from their overwintering depth in deeper AW layers
IV was the second most abundant stage, while only few or                  to the surface. North of Svalbard in winter, the winds blow
no adults were observed (usually < 5% of the C. finmarchi-                mostly from two directions, northwest and southeast (Cohen
cus pool; data not shown). Abundance of C. finmarchicus CV                et al., 2017). Southeasterly winds produce offshore Ekman
was lower in deep layers at offshore stations such as D1, E1,             transport by pushing coastal surface water offshore, which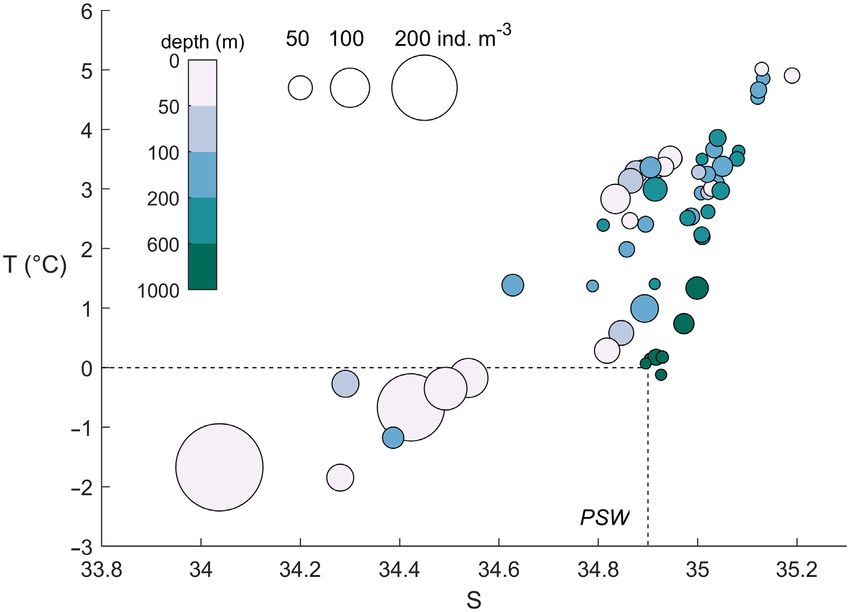
808                                                                                                                                    B. Espinasse et al.

                                                                                                                                                               Downloaded from https://academic.oup.com/icesjms/article/79/3/803/6549746 by guest on 02 July 2022
Figure 3. Salinity (left) and temperature (right) along one longitudinal transect and two latitudinal transects crossing the Atlantic inflow into the Arctic
Ocean, sampled in January 2015 (b) and 2014 (a) and (f). Ticks on the top axis indicate locations of CTD profiles. Stations where Multinet samples were
taken are labelled. See Figure 1 for positions of stations.

eventually leads to coastal upwelling (Lind and Ingvaldsen,                      Hypothesis #2—evolutionary pressure to be
2012). When the winds are steady over a time period long                         transported back to the Norwegian Sea
enough to initiate this physical process, it can concentrate the                 Life history strategies of C. finmarchicus have evolved as
organisms in the surface layer and then transport them off-                      adaptations to the environmental conditions in its core habi-
shore. Prevailing southeasterly winds caused a positive off-                     tat (North Atlantic). These conditions change dramatically the
shore Ekman transport in the 3 years for which we have shelf-                    further north the population is advected, particular in terms
offshore data. The year 2015 in particular, was characterized                    of the seasonality in incoming solar radiation and of temper-
by strong southeasterly winds over 10 d preceding the cruise,                    ature, and associated changes in phytoplankton bloom phe-
resulting in the highest volume of surface water moved off-                      nology. The ability of C. finmarchicus to survive in the polar
shore compared to the other years (Figure 4). However, the                       basin is hampered by the short phytoplankton growing sea-
vertical distribution of Calanus at the shelf station (B3) and                   sons and low temperatures (Ji et al., 2012), and it largely fails
on the slope (B2) do not show any sign of surface aggrega-                       to reproduce in the Arctic Ocean (Hirche and Kosobokova,
tion. Therefore, even though the physical processes make this                    2007). The continuous advection into the Arctic is, therefore,
hypothesis plausible, our observations do not support the no-                    regarded as a “death trail” (Wassmann et al., 2015). The only
tion that C. finmarchicus is being aggregated in PSW due to                      way to exit this conveyor belt into the Arctic Ocean is to reach
physical forcing.                                                                PSW. In our study area, PSW is decoupled from the main cur-
Surface aggregations of Calanus finmarchicus during the polar night 809
Downloaded from https://academic.oup.com/icesjms/article/79/3/803/6549746 by guest on 02 July 2022
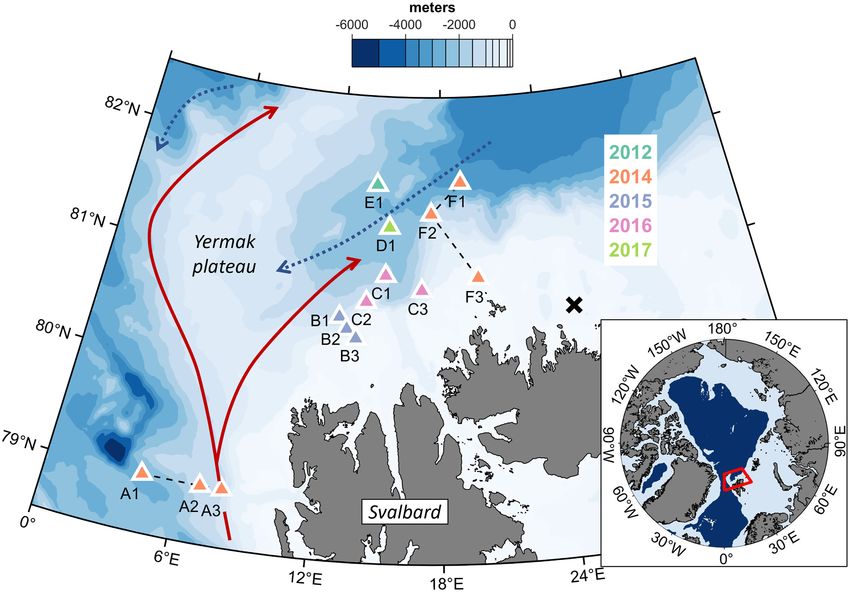
Figure 4. Salinity and temperature profiles at five stations sampled in January 2012 (E1), 2016 (C1-3), and 2017 (D1). See Figure 1 for positions of stations.
rent below and mainly flows toward the southwest, i.e. out Cusa et al., 2019). Planktivorous fish can impact the vertical
of the Arctic Ocean and into the Fram Strait (Lundesgaard distribution of Calanus (Dale et al., 1999), and it has been
et al., 2021). However, the mainly wind-driven PSW move- shown that they can actively predate at high latitude during
ment is rather unpredictable on shorter time scales (Proshutin- the polar night (Berge et al., 2015a). The presence of preda-
sky and Johnson, 1997). Under favourable conditions, the tors may, thus cause Calanus to abandon overwintering depth.
copepods would be transported southwestward across the High predation pressure within a given water layer results in
Yermak plateau and could then reach a branch of recircu- a decrease in the prey population, either because the prey ac-
lating AW further southward (Hattermann et al., 2016). This tively migrates away to avoid being predated on, or because
hypothesis might seem counter-intuitive at first. Indeed, cope- the prey gets consumed by the predators in that water layer.
pods would need to use energy to actively ascend from deeper While both options impact the vertical distribution of the prey,
water, which provide adequate conditions for overwintering, the first option does not affect prey abundance integrated over
to less favourable surface waters with temperatures close to the entire water column. Among the three transects that con-
freezing, just to reach an uncertain path back to its core habi- tain slope and offshelf stations with similar depths (Figure
tat. Currently, it is also unclear which proximate cues the 5; transect A, B, and C), C. finmarchicus abundances were
copepods would use to reach PSW. However, the outlined slightly higher offshore along the transects A and B (transect
transport out of the Arctic Ocean is likely the only option for A1 > A2 and B1 > B2) suggesting that predation pressure on
copepods to reach waters where they could reproduce suc- C. finmarchicus distributed in AW was not higher at the off-
cessfully, so even if only a small part of the population would shelf stations. Fish surveys conducted during the 2016 cruise
succeed to do so, over time it might create a selection pressure in the same study area (Geoffroy et al., 2019) found that the
favouring aggregation in PSW. dominant fish species, Sebastes mentella, was mainly feeding
on euphausiids and biomass of other planktivorous fish was
low. Furthermore, most fish were located in AW above the
Hypothesis #3—avoidance of mesopelagic shelf and in surface water further offshore, making it unlikely
predators that the avoidance of fish predation leads Calanus to aggre-
Stages CIV to adult of C. finmarchicus are fed upon by a large gate in the upper water column.
variety of species, including and micronekton such as lantern Other potentials predators include carnivorous copepods
fish (Pepin, 2013) or polar cod (Lønne and Gulliksen, 1989; (e.g. Paraeuchaeta spp.; Yen, 1985; Tönnesson et al., 2006)810 B. Espinasse et al.
Downloaded from https://academic.oup.com/icesjms/article/79/3/803/6549746 by guest on 02 July 2022
Figure 5. (a) Wind rose graphs produced from observational data measured at 80.65◦ N; 25.00◦ E for a period of 10 d prior to the sampling date for
2014–2016. It indicates the direction from which the wind was blowing. The colours refer to the wind speed and the length of the bar to the percentage
compared to all wind measurements. (b) Averaged offshore Ekman transport over the same time period.
and macrozooplankton such as chaetognaths (Petursdottir et the primary production will start first could thus balance the
al., 2012; Espinasse et al., 2018) or amphipods (Kraft et al., metabolic cost associated with activity during the polar night.
2012). Chaetognath species, such as Eukrohnia hamata, in However, our available data are not sufficient to evaluate this
particular can be found in very high abundances (Błachowiak- hypothesis. For example, we do not know to which extent the
Samołyk et al., 2015), but during winter these populations copepods were active and, therefore, even less how much en-
mainly consist of small specimens. Data on macrozooplank- ergy would be required to maintain this level of activity. More-
ton distribution along two transects A and F (data not shown) over, although C. finmarchicus aggregated in PSW, they did
show that the largest chaetognaths, which have the ability to not aggregate in the nearby stations above the slope (Figure
prey on Calanus CIV to adult, were distributed evenly over 5; A2, B2, and C2). We do not have data describing when
the entire water column. They are, therefore, unlikely to push primary production commences in the different parts of the
Calanus to migrate upwards. Overall, even though our dataset study area and, therefore, cannot conclude on how this could
does not allow us to refute the predator avoidance hypothesis, spatially trigger Calanus ascent. To evaluate the validity of
we also did not find any evidence to support it. the hypothesis, one would need comparative time-series data,
rather than spatial snapshots.
Hypothesis #4—anticipating the phytoplankton
spring bloom Hypothesis #5—feeding on organic matter
Berge et al. (2015a) speculated that it may be advantageous associated to sea ice
for herbivorous grazers to become active long before the on- The aggregation of C. finmarchicus in surface waters was par-
set of the spring bloom. This would enable the copepods to ticular pronounced at stations close to the ice edge, suggest-
take advantage of primary production as soon as the light re- ing that the proximity to the sea ice might provide advantages.
turns and phytoplankton development starts. When light is Many species are sustained directly or indirectly by particulate
returning, some phytoplankton species can start to reproduce organic matter (POM), algae, and microzooplankton com-
within a day even at low irradiance levels as early as Febru- munities associated to sea ice (Seuthe et al., 2011; Stoecker
ary (Morin et al., 2020; Randelhoff et al., 2020). The advan- and Lavrentyev, 2018; Olsen et al., 2019). While predomi-
tage for Calanus of being distributed in surface layers where nantly herbivorous during the spring bloom, Calanus spp. ex-Surface aggregations of Calanus finmarchicus during the polar night 811
Downloaded from https://academic.oup.com/icesjms/article/79/3/803/6549746 by guest on 02 July 2022
Figure 6. Scatter plot of C. finmarchicus CIV to adult abundances (ind. m–3 ) west and north of Svalbard in January as a function of mean sea potential
temperature and salinity in the water layer where the samples were collected. The size of the circle corresponds to the abundance and the colour to the
mean depth of the water layer. Based on data from all stations and layers.
Table 3. Relative contribution (%) of C. finmarchicus to the total copepod abundance for each sample. PSW occurred at stations in underlined italic.
Depth (m)
Stations 0–50 50–100 100–200 200–600 600–1 000 0–1 000/bottom
A1 50.5 41.8 42.4 46.4 22.1 45.2
A2 14.8 21.1 56.6 65.4 59.5 32.8
A3 15.1 17.6 34.8 46.5 58.5 35.2
B1 64.4 51.3 58.8 33.9 2.37 56.5
B2 14.5 27.4 48.9 26.6 – 23.9
B3 13.5 17.9 – – – 14.9
C1 45.0 x 27.0 33.6 5.0 37.3
C2 22.0 19.5 25.8 28.9 – 23.2
C3 55.1 68.2 49.4 51.0 – 56.5
F1 62.7 11.9 2.20 2.03 0.64 16.0
F2 42.6 27.7 14.7 37.8 4.93 29.0
F3 8.91 12.3 11.6 17.8 8.91 12.3
hibits a more omnivorous diet outside bloom scenarios and risky for Calanus to exit diapause and search for food in sur-
can feed on POM related to sea ice (Søreide et al., 2013; face waters, it has been modelled that if food is available even
Kohlbach et al., 2016). Both C. glacialis and C. hyperboreus in low concentrations there is no difference in fitness between
have been found to aggregate closely under the ice during ice Calanus spp. emerging early from overwintering and those re-
algae blooms. The sea ice around Svalbard in January con- maining at depth for longer (Hobbs et al., 2020). Stable iso-
sists mainly of young ice from the previous one or two sea- topes analysis could be an easy way to highlight any inter-
sons drifting from the eastern part of the Arctic Ocean. While actions between C. finmarchicus and sea ice biota during the
the absence of light inhibits any local primary production in polar night, as the latter often show high nitrogen isotopic
January, the ice can transport dead or resting biological ma- values (Fripiat et al., 2014; Espinasse et al., 2019). Lipid com-
terial produced earlier in the season (Olsen et al., 2017). Dur- position has also been shown to be a useful marker of sea ice
ing winter storms, generally associated with a sharp increase origin (Amiraux et al., 2021).
in temperature due to their southern provenance (Cohen et
al., 2017), the ice cover undergoes strong pressure resulting in
deformation and weakening of the ice (Itkin et al., 2017), and Hypothesis #6—second generation
even melting (Duarte et al., 2020). This can result in POM and The bimodal size distribution observed for CV in some of the
microorganisms being released into the water column where water layers suggests the presence of two generations from the
it presents a substantial food source during winter that could same year. The occurrence of a second generation is not un-
attract C. finmarchicus to the surface layer. While it may seem common in warmer water further south (Head et al., 2013),812 B. Espinasse et al.
but has so far not been documented in Arctic waters. Calanus face aggregations, and especially (1) to define if the Calanus
finmarchicus is thought to descend to overwintering depths as observed in surface in January ascended from overwintering
soon as it has accumulated sufficient lipids (Fiksen and Car- depth or never descended, and (2) to delineate interactions
lotti, 1998). If a second generation (G2) was spawned late the between the surface aggregations and the rest of the popula-
previous summer, it is possible that these late recruits would tion. We reviewed the most plausible hypotheses behind this
not have stored enough lipids to trigger the downward migra- behaviour and provide the basis for further studies that could
tion, and therefore, would need to remain in surface waters. address these specifically.
However, we did not observe a smaller mean size of cope-
pods in the surface layer compared to deeper layers, rather
the opposite. Although our data might indicate the presence
Supplementary material
of a second generation, they do not support the hypothesis Supplementary material is available at the ICESJMS online
that it is the second generation that aggregates in surface wa- version of the manuscript.
ters. Further investigation in lipid content of the individuals
distributed in the different depth layers might be a comple- Data availability
Downloaded from https://academic.oup.com/icesjms/article/79/3/803/6549746 by guest on 02 July 2022
mentary way to approach this question.
Abundance data shown in Figures 4 and 5 are available as
Implications and conclusions supplementary material.
Based on our dataset, we conclude that mechanisms described
in the hypotheses 2, 4, and 5, and to a lesser extent 3, may Conflicts of interest
contribute to the observed high abundances in surface wa- The authors have no conflict of interest to declare.
ters close to the ice edge and deserve further attention. All
of these hypotheses imply that C. finmarchicus is not in dor-
mancy but remains at least partly active during winter. This is Funding
in line with observations from the Arctic demonstrating that This study is a contribution to the Norwegian Research
copepods conduct diel vertical migration (Berge et al., 2009, Council (NRC) project Sea Patches (number 268391), which
2015a, b; Darnis et al., 2017) and are actively mating (Daase funded B. Espinasse and S. Basedow during the initiation of
et al 2018) during the polar night. the study. Sample collection and analysis was funded by the
The C. finmarchicus concentrations in the PSW were rela- NRC projects Carbon Bridge (number 226415), Marine Night
tively high (between 100 and 300 ind. m–3 ) compared to abun- (number 226417), Arctic ABC (number 244319), and Deep
dance estimates from late summer north of Svalbard (6–85 Impact (number 300333) and supported by Tromsø Forskn-
ind. m–3 ; Daase and Eiane, 2007; Hop et al., 2019). Such high ingsstiftelse (project Arctic ABC-E). Presently, B. Espinasse is
concentrations could be beneficial for predators such as fish or funded from the European Union’s Horizon 2020 MSCA pro-
large mammals. Only few whale species reside year round in gram under Grant agreement number 894296 – Project ISO-
the Arctic, most notable the Bowhead whale, which is plank- MOD.
tivorous and distributed close to the ice edge (Vacquié-Garcia
et al., 2017). These whales might, thus find a substantial food
Acknowledgements
source in the surface aggregations of Calanus during mid-
winter. Bowhead whales were brought close to extinction in We appreciate the help of the Captain and crew of RV Helmer
the 18th century but recent observations indicate that the pop- Hanssen. This study is a contribution to the ARCTOS research
ulation size in our study area is increasing (Vacquié-Garcia et network (arctos.uit.no).
al., 2017). This could indicate that the whales find favourable
conditions associated with the rapid environmental changes
currently observed in the Arctic (Falk-Petersen et al., 2015). References
Calanus is also an important food source for juvenile polar Amiraux, R., Archambault, P., Moriceau, B., Lemire, M., Babin, M.,
cod (Boreogadus saida; Lønne and Gulliksen, 1989; Cusa et Memery, L., Massé, G., et al. 2021. Efficiency of sympagic-benthic
al., 2019). When other food sources such as ice-associated am- coupling revealed by analyses of n-3 fatty acids, IP25 and other
phipods become scarce due to the loss of sea ice, the impor- highly branched isoprenoids in two filter-feeding Arctic benthic mol-
luscs: Mya truncata and Serripes groenlandicus. Organic Geochem-
tance of C. finmarchicus in their diet might further increase
istry, 151:104160.
and large aggregations in proximity to the ice could be a valu- Bandara, K., Varpe, Ø., Maps, F., Ji, R., Eiane, K., and Tver-
able asset. berg, V. 2021. Timing of Calanus finmarchicus diapause in
To conclude, we suggest that the implications of C. fin- stochastic environments. Ecological Modelling, 460: 109739.
marchicus being distributed in cold surface waters during https://doi.org/10.1016/j.ecolmodel.2021.109739
mid-winter should be considered in Arctic predator ecology Basedow, S. L., Sundfjord, A., von Appen, W.-J., Halvorsen, E., Kwas-
studies. We suggest monitoring the spatial extent of this phe- niewski, S., and Reigstad, M. 2018. Seasonal variation in transport
nomenon closely as it is likely to evolve with seawater temper- of zooplankton into the Arctic basin through the Atlantic Gateway,
ature increase, potentially having a strong impact on the rest Fram Strait. Frontiers in Marine Science, 5: 194.
of the Arctic marine ecosystem during winter. Indeed, warm- Berge, J., Cottier, F., Last, K. S., Varpe, Ø., Leu, E., Søreide, J., Eiane, K.
et al. 2009. Diel vertical migration of Arctic zooplankton during the
ing temperatures could provide a more suitable environment
polar night. Biology Letters, 5: 69–72.
for Calanus to reproduce successfully in the future and even- Berge, J., Daase, M., Hobbs, L., Falk-Petersen, S., Darnis, G., and
tually colonize the Arctic (Tarling et al., 2021), although the Søreide, J. E. 2020. Zooplankton in the polar night. In POLAR
lack of light could be the ultimate limiting factor (Ljungström NIGHT Marine Ecology: Life and Light in the Dead of Night, pp.
et al., 2021). Monthly or bi-monthly sampling from October 113–159. Ed. by J. Berge, G. Johnsen, and J. H. Cohen. Springer
to January is required to describe the temporal dynamic of sur- International Publishing, Cham.Surface aggregations of Calanus finmarchicus during the polar night 813
Berge, J., Daase, M., Renaud, Paul E., Ambrose, William G., Darnis, biogeographical shifts of key Calanus species in the central Arctic
G., Last, Kim S., Leu, E. et al. 2015. Unexpected levels of biological Ocean. Global Change Biology,27: 2128–2143,
activity during the polar night offer new perspectives on a warming Espinasse, B., Pakhomov, E. A., Hunt, B. P. V., and Bury, S. J. 2019. Lat-
Arctic. Current Biology, 25: 2555–2561. itudinal gradient consistency in carbon and nitrogen stable isotopes
Berge, J., Renaud, P. E., Darnis, G., Cottier, F., Last, K., Gabrielsen, T. M., of particulate organic matter in the Southern Ocean. Marine Ecol-
Johnsen, G. et al. 2015. In the dark: a review of ecosystem processes ogy Progress Series, 631: 19–30.
during the Arctic polar night. Progress in Oceanography, 139: 258– Espinasse, B., Tverberg, V., Kristensen, J. A., Skreslet, S., and Eiane, K.
271. 2018. Winter mortality in Calanus populations in two northern Nor-
Błachowiak-Samołyk, K., Wiktor, J. M., Hegseth, E. N., Wold, A., Falk- wegian fjords from 1984 to 2016. Polar Biology, 41: 1405–1415.
Petersen, S., and Kubiszyn, A. M. 2015. Winter tales: the dark side Falk-Petersen, S., Mayzaud, P., Kattner, G., and Sargent, J. R. 2009.
of planktonic life. Polar Biology, 38: 23–36. Lipids and life strategy of Arctic Calanus. Marine Biology Research,
Bonnet, D., Richardson, A., Harris, R., Hirst, A., Beaugrand, G., Ed- 5: 18–39.
wards, M., Ceballos, S. et al. 2005. An overview of Calanus hel- Falk-Petersen, S., Pavlov, V., Berge, J., Cottier, F., Kovacs, K. M., and
golandicus ecology in European waters. Progress in Oceanography, Lydersen, C. 2015. At the rainbow’s end: high productivity fueled
65: 1–53. by winter upwelling along an Arctic shelf. Polar Biology, 38: 5–11.
Brierley, A. S. 2014. Diel vertical migration. Current Biology, 24: Fiksen, Ø., and Carlotti, F. 1998. A model of optimal life history and diel
Downloaded from https://academic.oup.com/icesjms/article/79/3/803/6549746 by guest on 02 July 2022
R1074–R1076. vertical migration in Calanus finmarchicus. Sarsia, 83: 129–147.
Chen, B., Masunaga, E., Smith, S. L., and Yamazaki, H. 2021. Diel verti- Fort, J., Cherel, Y., Harding, A. M. A., Egevang, C., Steen, H., Kuntz,
cal migration promotes zooplankton horizontal patchiness. Journal G., Porter, W. P. et al. 2010. The feeding ecology of little auks raises
of Oceanography, 77: 123–135. questions about winter zooplankton stocks in North Atlantic sur-
Choquet, M., Hatlebakk, M., Dhanasiri, A. K. S., Kosobokova, K., face waters. Biology Letters, 6: 682–684.
Smolina, I., Søreide, J. E., Svensen, C. et al. 2017. Genetics redraws Freer, JJ, Daase, M, and Tarling, GA 2022. Modelling the biogeographic
pelagic biogeography of Calanus. Biology Letters, 13:20170588. boundary shift of Calanus finmarchicus reveals drivers of Arctic At-
Cohen, L., Hudson, S. R., Walden, V. P., Graham, R. M., and Granskog, lantification by subarctic zooplankton Global Change Biology, 28:
M. A. 2017. Meteorological conditions in a thinner Arctic Sea ice 429–440.
regime from winter to summer during the Norwegian Young Sea Ice Fripiat, F., Sigman, D. M., Fawcett, S. E., Rafter, P. A., Weigand, M. A.,
expedition (N-ICE2015). Journal of Geophysical Research: Atmo- and Tison, J. L. 2014. New insights into sea ice nitrogen biogeo-
spheres, 122: 7235–7259. chemical dynamics from the nitrogen isotopes. Global Biogeochem-
Conover, R. J 1988. Comparative life histories in the genera Calanus and ical Cycles, 28: 115–130.
Neocalanus in high latitudes of the Northern Hemisphere. In G.A. Geoffroy, M., Daase, M., Cusa, M., Darnis, G., Graeve, M., Santana
Boxshall and H.K. Schminke (eds). Biology of Copepods, pp. De- Hernández, N., Berge, J. et al. 2019. Mesopelagic sound scattering
velopments in Hydrobiology, vol 47 127–142. Springer, Dordrecht. layers of the high Arctic: seasonal variations in biomass, species as-
https://doi.org/10.1007/978-94-009-3103-9_11 semblage, and trophic relationships. Frontiers in Marine Science, 6:
Cusa, M., Berge, J., and Varpe, Ø. 2019. Seasonal shifts in feeding pat- 364.
terns: individual and population realized specialization in a high Hattermann, T., Isachsen, P. E., Appen, W. J., Albretsen, J., and
Arctic fish. Ecology and Evolution, 9: 11112–11121. Sundfjord, A.. 2016. Eddy-driven recirculation of Atlantic Wa-
Daase, M, and Søreide, JE 2021. Seasonal variability in non- ter in Fram Strait. Geophysical Research Letters, 43: 3406–3414.
consumptive mortality of Arctic zooplankton. Journal of Plankton doi:10.1002/2016GL068323.
Research, 43:565–585. 10.1093/plankt/fbab042 Haug, T., Bogstad, B., Chierici, M., Gjøsæter, H., Hallfredsson, E. H.,
Daase, M., and Eiane, K. 2007. Mesozooplankton distribution in north- Høines, Å. S., Hoel, A. H. et al. 2017. Future harvest of living re-
ern Svalbard waters in relation to hydrography. Polar Biology, 30: sources in the Arctic Ocean north of the Nordic and Barents Seas: a
969–981. review of possibilities and constraints. Fisheries Research, 188: 38–
Daase, M., Falk-Petersen, S., Varpe, Ø., Darnis, G., Søreide, J. E., Wold, 57.
A., Leu, E. et al. 2013. Timing of reproductive events in the marine Head, E. J. H., Melle, W., Pepin, P., Bagøien, E., and Broms, C. 2013. On
copepod Calanus glacialis: a pan-Arctic perspective. Canadian Jour- the ecology of Calanus finmarchicus in the Subarctic North Atlantic:
nal of Fisheries and Aquatic Sciences, 70: 871–884. a comparison of population dynamics and environmental conditions
Daase, M., Kosobokova, K., Last, K. S., Cohen, J. H., Choquet, M., in areas of the Labrador Sea-Labrador/Newfoundland Shelf and
Hatlebakk, M., and Søreide, J. E. 2018. New insights into the biol- Norwegian Sea Atlantic and Coastal Waters. Progress in Oceanog-
ogy of Calanus spp. (Copepoda) males in the Arctic. Marine Ecology raphy, 114:46–63. http://dx.doi.org/10.1016/j.pocean.2013.05.004
Progress Series, 607: 53–69. Hirche, H.-J. 1991. Distribution of dominant calanoid copepod
Daase, M., Varpe, Ø., and Falk-Petersen, S. 2014. Non-consumptive species in the Greenland sea during late fall. Polar Biology, 11:
mortality in copepods: occurrence of Calanus spp. carcasses in the 351–362.
Arctic Ocean during winter. Journal of Plankton Research, 36: 129– Hirche, H.-J. 1996. Diapause in the marine copepod, Calanus finmarchi-
144. cus — a review. Ophelia, 44: 129–143.
Dale, T., Bagøien, E., Melle, W., and Kaartvedt, S. 1999. Can predator Hirche, H.-J., and Kosobokova, K. 2007. Distribution of Calanus fin-
avoidance explain varying overwintering depth of Calanus in dif- marchicus in the northern North Atlantic and Arctic Ocean—
ferent oceanic water masses? Marine Ecology Progress Series, 179: expatriation and potential colonization. Deep Sea Research Part II:
113–121. Topical Studies in Oceanography, 54: 2729–2747.
Darnis, G., Hobbs, L., Geoffroy, M., Grenvald, J. C., Renaud, P. E., Berge, Hobbs, L., Banas, N. S., Cottier, F. R., Berge, J., and Daase, M. 2020. Eat
J., Cottier, F. et al. 2017. From polar night to midnight sun: diel ver- or sleep: availability of winter prey explains mid-winter and spring
tical migration, metabolism and biogeochemical role of zooplank- activity in an Arctic Calanus population. Frontiers in Marine Sci-
ton in a high Arctic fjord (Kongsfjorden, Svalbard). Limnology and ence, 7:541564.
Oceanography, 62: 1586–1605. Hop, H., Assmy, P., Wold, A., Sundfjord, A., Daase, M., Duarte, P., Kwas-
Duarte, P., Sundfjord, A., Meyer, A., Hudson, S. R., Spreen, G., and niewski, S. et al. 2019. Pelagic ecosystem characteristics across the
Smedsrud, L. H. 2020. Warm Atlantic water explains observed sea Atlantic water boundary current from Rijpfjorden, Svalbard, to the
ice melt rates north of Svalbard. Journal of Geophysical Research: Arctic Ocean during summer (2010–2014). Frontiers in Marine Sci-
Oceans, 125: e2019JC015662. ence, 6: 181.
Ershova, E. A., Kosobokova, K. N., Banas, N. S., Ellingsen, I., Niehoff, Itkin, P., Spreen, G., Cheng, B., Doble, M., Girard-Ardhuin, F., Haapala,
B., Hildebrandt, N., and Hirche, H. J. 2021. Sea ice decline drives J., Hughes, N. et al. 2017. Thin ice and storms: sea ice deformation814 B. Espinasse et al.
from buoy arrays deployed during N-ICE2015. Journal of Geophys- Pershing, A. J., and Stamieszkin, K. 2020. The North Atlantic ecosystem,
ical Research: Oceans, 122: 4661–4674. from plankton to whales. Annual Review of Marine Science, 12:
Ji, R., Ashjian, C. J., Campbell, R. G., Chen, C., Gao, G., Davis, C. S., 339–359.
Cowles, G. W. et al. 2012. Life history and biogeography of Calanus Petursdottir, H., Falk-Petersen, S., and Gislason, A. 2012. Trophic inter-
copepods in the Arctic Ocean: an individual-based modeling study. actions of meso- and macrozooplankton and fish in the Iceland Sea
Progress in Oceanography, 96: 40–56. as evaluated by fatty acid and stable isotope analysis. ICES Journal
Kaartvedt, S., and Titelman, J. 2018. Planktivorous fish in a future Arctic of Marine Science, 69: 1277–1288.
Ocean of changing ice and unchanged photoperiod. ICES Journal of Proshutinsky, A. Y., and Johnson, M. A. 1997. Two circulation regimes
Marine Science, 75: 2312–2318. of the wind-driven Arctic Ocean. Journal of Geophysical Research:
Kohlbach, D., Graeve, M. A., Lange, B., David, C., Peeken, I., and Flo- Oceans, 102: 12493–12514. doi:10.1029/97JC00738
res, H. 2016. The importance of ice algae-produced carbon in the Randelhoff, A., Lacour, L., Marec, C., Leymarie, E., Lagunas, J., Xing,
central Arctic Ocean ecosystem: food web relationships revealed by X., Darnis, G. et al. 2020. Arctic mid-winter phytoplankton growth
lipid and stable isotope analyses. Limnology and Oceanography, 61: revealed by autonomous profilers. Science Advances, 6:eabc2678.
2027–2044. Roe, H. S. J., Angel, M. V., Badcock, J., Domanski, P., James, P. T., Pugh,
Kraft, A., Berge, J., Varpe, Ø., and Falk-Petersen, S. 2013. Feeding in P. R., and Thurston, M. H. 1984. The diel migrations and distribu-
Arctic darkness: mid-winter diet of the pelagic amphipods Themisto tions within a Mesopelagic community in the North East Atlantic. 1.
Downloaded from https://academic.oup.com/icesjms/article/79/3/803/6549746 by guest on 02 July 2022
abyssorum and T. libellula. Marine Biology, 160: 241–248. Introduction and sampling procedures. Progress in Oceanography,
Lind, S., and Ingvaldsen, R. B. 2012. Variability and impacts of Atlantic 13: 245–268.
Water entering the Barents Sea from the north. Deep Sea Research Rudels, B., Björk, G., Nilsson, J., Winsor, P., Lake, I., and Nohr, C.
Part I: Oceanographic Research Papers, 62: 70–88. 2005. The interaction between waters from the Arctic Ocean and
Ljungström, G., Langbehn, T. J., and Jørgensen, C. 2021. Light and ener- the Nordic Seas north of Fram Strait and along the East Greenland
getics at seasonal extremes limit poleward range shifts. Nature Cli- Current: results from the Arctic Ocean-02 Oden expedition. Journal
mate Change, 11:530–536. of Marine Systems, 55: 1–30.
Lønne, O. J., and Gulliksen, B. 1989. Size, age and diet of polar cod, Rudels, B., Meyer, R., Fahrbach, E., Ivanov, V. V., Østerhus, S., Quad-
Boreogadus saida (Lepechin 1773), in ice covered waters. Polar Bi- fasel, D., Schauer, U. et al. 2000. Water mass distribution in Fram
ology, 9: 187–191. Strait and over the Yermak Plateau in summer 1997. Annales Geo-
Lundesgaard, Ø., Sundfjord, A., and Renner, A. H. H. 2021. Drivers of physicae, 18: 687–705.
interannual sea ice concentration variability in the Atlantic water Seuthe, L., Töpper, B., Reigstad, M., Thyrhaug, R., and Vaquer-Sunyer,
inflow region north of Svalbard. Journal of Geophysical Research: R. 2011. Microbial communities and processes in ice-covered Arc-
Oceans, 126:e2020JC016522. tic waters of the northwestern Fram Strait (75 to 80◦ N) during the
Maps, F., Runge, J. A., Leising, A., Pershing, A. J., Record, N. R., vernal pre-bloom phase. Aquatic Microbial Ecology, 64: 253–266.
Plourde, S., and Pierson, J. J. 2012. Modelling the timing and dura- Søreide, J. E., Carroll, M. L., Hop, H., Ambrose, W. G., Hegseth, E.
tion of dormancy in populations of Calanus finmarchicus from the N., and Falk-Petersen, S. 2013. Sympagic-pelagic-benthic coupling
Northwest Atlantic shelf. Journal of Plankton Research, 34:36–54. in Arctic and Atlantic waters around Svalbard revealed by stable
10.1093/plankt/fbr088 isotopic and fatty acid tracers. Marine Biology Research, 9: 831–
Melle, W., Runge, J., Head, E., Plourde, S., Castellani, C., Licandro, P., 850.
Pierson, J. et al. 2014. The North Atlantic Ocean as habitat for Stoecker, D. K., and Lavrentyev, P. J. 2018. Mixotrophic plankton in the
Calanus finmarchicus: environmental factors and life history traits. polar seas: a pan-Arctic review. Frontiers in Marine Science, 5: 292.
Progress in Oceanography, 129: 244–284. Strand, K. O., Sundby, S., Albretsen, J., and Vikebø, F. B. 2017. The
Morin, P.-I., Lacour, T., Grondin, P.-L., Bruyant, F., Ferland, J., For- Northeast Greenland shelf as a potential habitat for the Northeast
get, M.-H., and Babin, M. 2020. Response of the sea-ice di- Arctic cod. Frontiers in Marine Science, 4: 304.
atom Fragilariopsis cylindrus to simulated polar night darkness Tarling, G. A., Freer, J. J., Banas, N. S., Belcher, A., Blackwell, M., Castel-
and return to light. Limnology and Oceanography, 65:1041–1060. lani, C., Cook, K. B. et al. Can a key boreal Calanus copepod species
10.1002/lno.11368 now complete its life-cycle in the Arctic? Evidence and implications
Olsen, L. M., Duarte, P., Peralta-Ferriz, C., Kauko, H. M., Johansson, for Arctic food-webs. Ambio, 51:333–344.
M., Peeken, I., Różańska-Pluta, M. et al. 2019. A red tide in the Tönnesson, K., Nielsen, T. G., and Tiselius, P. 2006. Feeding and pro-
pack ice of the Arctic Ocean. Scientific Reports, 9: 9536. duction of the carnivorous copepod Pareuchaeta norvegica in the
Olsen, L. M., Laney, S. R., Duarte, P., Kauko, H. M., Fernández-Méndez, Skagerrak. Marine Ecology Progress Series, 314: 213–225.
M., Mundy, C. J., Rösel, A. et al. 2017. The seeding of ice algal Vacquié-Garcia, J., Lydersen, C., Marques, T. A., Aars, J., Ahonen, H.,
blooms in Arctic pack ice: the multiyear ice seed repository hypoth- Skern-Mauritzen, M., Øien, N. et al. 2017. Late summer distribu-
esis. Journal of Geophysical Research: Biogeosciences, 122: 1529– tion and abundance of ice-associated whales in the Norwegian High
1548. Arctic. Endangered Species Research, 32: 59–70.
Pawlowicz, R. 2020. M_Map: A Mapping Package for MATLAB. Ver- Walkusz, W., Kwasniewski, S., Falk-Petersen, S., Hop, H., Tverberg,
sion 1.4m [Computer software], available at: www.eoas.ubc.ca/∼r V., Wieczorek, P., and Weslawski, J. M. 2009. Seasonal and spatial
ich/map.html. changes in the zooplankton community of Kongsfjorden, Polar Re-
Pedersen, G., Tande, K., and Ottesen, G. O. 1995. Why does a com- search, 28: 254–281.
ponent of Calanus finmarchicus stay in the surface waters during Wassmann, P., Kosobokova, K. N., Slagstad, D., Drinkwater, K. F.,
the overwintering period in high latitudes? ICES Journal of Marine Hopcroft, R. R., Moore, S. E., Ellingsen, I. et al. 2015. The con-
Science, 52: 523–531. tiguous domains of Arctic Ocean advection: trails of life and death.
Pepin, P. 2013. Distribution and feeding of Benthosema glaciale in the Progress in Oceanography, 139: 42–65.
western Labrador Sea: fish–zooplankton interaction and the conse- Wassmann, P., Slagstad, D., and Ellingsen, I. 2019. Advection of meso-
quence to calanoid copepod populations. Deep Sea Research Part I: zooplankton into the northern Svalbard shelf region. Frontiers in
Oceanographic Research Papers, 75: 119–134. Marine Science, 6:458.
Pérez-Hernández, M. D., Pickart, R. S., Pavlov, V., Våge, K., Ingvaldsen, Yen, J. 1985. Selective predation by the carnivorous marine copepod
R., Sundfjord, A., Renner, A. H. H. et al. 2017. The Atlantic Wa- Euchaeta elongata: laboratory measurements of predation rates ver-
ter boundary current north of Svalbard in late summer. Journal of ified by field observations of temporal and spatial feeding patterns.
Geophysical Research: Oceans, 122: 2269–2290. Limnology and Oceanography, 30: 577–597.
Handling Editor: Brock C WoodsonYou can also read