On the contribution of fast and slow responses to precipitation changes caused by aerosol perturbations
←
→
Page content transcription
If your browser does not render page correctly, please read the page content below
Atmos. Chem. Phys., 21, 10179–10197, 2021
https://doi.org/10.5194/acp-21-10179-2021
© Author(s) 2021. This work is distributed under
the Creative Commons Attribution 4.0 License.

On the contribution of fast and slow responses to precipitation
changes caused by aerosol perturbations
Shipeng Zhang, Philip Stier, and Duncan Watson-Parris
Atmospheric, Oceanic and Planetary Physics, Department of Physics, University of Oxford, Oxford, UK

Correspondence: Shipeng Zhang (shipeng.zhang@physics.ox.ac.uk)

Received: 24 December 2020 – Discussion started: 3 February 2021
Revised: 17 May 2021 – Accepted: 27 May 2021 – Published: 7 July 2021

Abstract. Changes in global-mean precipitation are strongly      cooling from the clear–clean sky, which is consistent with the
constrained by global radiative cooling, while regional rain-    reduced rainfall. Examining the changes in large-scale circu-
fall changes are less constrained because energy can be trans-   lation and local thermodynamics qualitatively explains the
ported. Absorbing and non-absorbing aerosols have different      responses of precipitation to aerosol perturbations, whereas
effects on both global-mean and regional precipitation, due      the energetic perspective provides a method to quantify their
to the distinct effects on energetics. This study analyses the   contributions.
precipitation responses to large perturbations in black carbon
(BC) and sulfate (SUL) by examining the changes in atmo-
spheric energy budget terms on global and regional scales,
in terms of fast (independent of changes in sea surface tem-     1   Introduction
perature, SST) and slow responses (mediated by changes in
SST). Changes in atmospheric radiative cooling/heating are       Aerosols have been proposed to affect clouds and precipita-
further decomposed into contributions from clouds, aerosols,     tion to a large extent by interacting with clouds and radia-
and clear–clean sky (without clouds or aerosols).                tion (Ramanathan et al., 2001). However, aerosol effects on
   Both cases show a decrease in global-mean precipitation,      clouds and precipitation remain highly uncertain due to the
which is dominated by fast responses in the BC case and slow     complex nature of aerosol–cloud–radiation interactions. For
responses in the SUL case. The geographical patterns are dis-    example, satellite-estimated and model-simulated aerosol–
tinct too. The intertropical convergence zone (ITCZ), accom-     cloud interactions show large discrepancies in terms of mag-
panied by tropical rainfall, shifts northward in the BC case,    nitude and even in sign (e.g. Ackerman et al., 2004; Rosen-
while it shifts southward in the SUL case. For both cases, en-   feld et al., 2019; Wang et al., 2012). Disagreements be-
ergy transport terms from the slow response dominate the         tween different studies can be attributed to methodologies
changes in tropical rainfall, which are associated with the      (Gryspeerdt et al., 2014) and model uncertainties (White
northward (southward) shift of the Hadley cell in response       et al., 2017) and, importantly, are often related to differ-
to the enhanced southward (northward) cross-equatorial en-       ences in environmental conditions, such as relative humidity,
ergy flux caused by increased BC (SUL) emission. The extra-      dynamic background, cloud types, and stability (Alizadeh-
tropical precipitation decreases in both cases. For the BC       Choobari, 2018; Khain, 2009; Khain et al., 2008; Lohmann
case, fast responses to increased atmospheric radiative heat-    et al., 2007; Zhang et al., 2016). Knowledge about the chain
ing contribute most to the reduced rainfall, in which ab-        of processes, from aerosol emission to acting as cloud con-
sorbing aerosols directly heat the mid-troposphere, stabilise    densation nuclei (CCN) or ice nuclei (IN) and to cloud mi-
the column, and suppress precipitation. Unlike BC, non-          crophysics, and dynamics, is critical for reducing the un-
absorbing aerosols decrease surface temperatures through         certainties and understanding the climate system (Ghan et
slow processes, cool the whole atmospheric column, and re-       al., 2016), which is referred to as a “bottom-up” approach.
duce specific humidity, which leads to decreased radiative       However, this is challenging, considering uncertainties can
                                                                 arise from aerosol emissions, activation, cloud microphysics

Published by Copernicus Publications on behalf of the European Geosciences Union.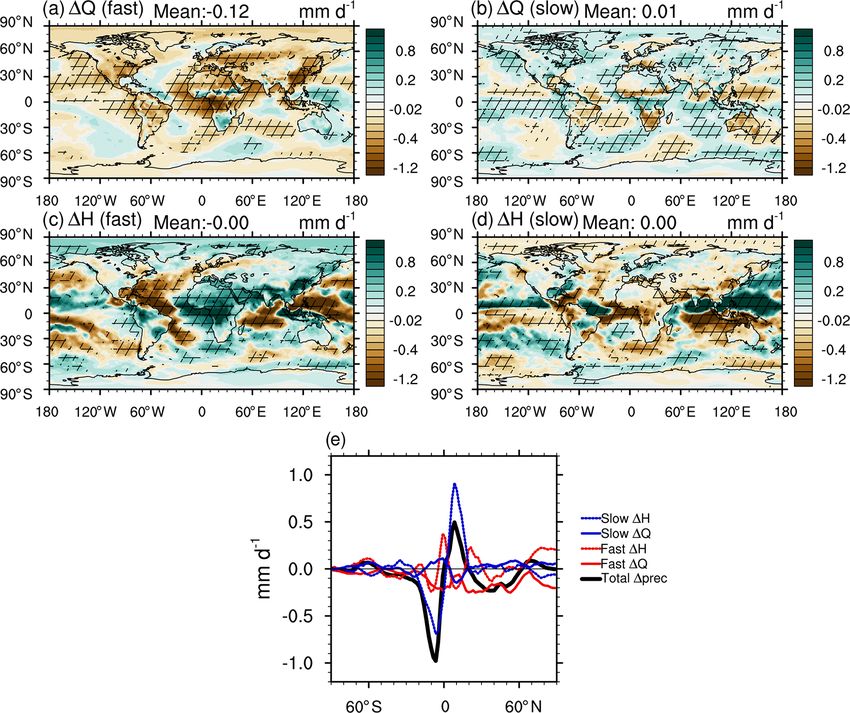
10180                                                S. Zhang et al.: Aerosol effects on fast and slow precipitation responses

and dynamic regimes (e.g. Gettelman et al., 2013; Ghan et          but it can also increase precipitation by warming up the sur-
al., 2012; Michibata et al., 2016; Zhang et al., 2016).            face temperature on longer timescales (e.g. Pendergrass and
   An energetic perspective provides an alternative approach       Hartmann, 2012). The net effect can be uncertain among
to examine aerosol effects on precipitation, which is referred     GCMs (Samset et al., 2016) and is sensitive to the alti-
to as a “top-down” approach. For global scales, in equilib-        tude where the BC is added (Ming et al., 2010). Unlike
rium, latent heat released from rainfall should be energet-        BC, non-absorbing aerosols, for example sulfate (SUL), re-
ically balanced by atmospheric radiative cooling together          duce precipitation predominantly by decreasing SST on long
with surface energy fluxes (Allen and Ingram, 2002; An-            timescales through the dimming effect, whereby SUL scat-
drews et al., 2010). Climate forcers, such as greenhouse gases     ters incoming solar radiation back to the space (Boucher
(GHGs) and aerosols, which affect the energy budget, can           et al., 2013; Kasoar et al., 2018). Additionally, the surface
modify the hydrological responses (Kvalevåg et al., 2013;          sensible heat flux is more sensitive to changes in BC than
Stephens and Hu, 2010). The energy constraints can be ap-          SUL (Myhre et al., 2017; Richardson et al., 2018). On zonal
plied to regional rainfall by introducing the energy trans-        scales, due to the relatively short life cycle of aerosols, the ra-
port term (H ) (Muller and O’Gorman, 2011; Richardson et           diative forcing caused by aerosols is hemispherically asym-
al., 2016). The local energy budget at equilibrium can be ad-      metric, which leads to a warmer Northern Hemisphere for
dressed as the following equation:                                 the BC case and a colder one for the SUL case. As a result,
                                                                   the cross-equatorial energy fluxes lead to the intertropical
LδP = δQ + δH,                                              (1)    convergent zone (ITCZ) shifting towards the warmer hemi-
                                                                   sphere (Wang, 2009; Bischoff and Schneider, 2016; Zhao and
where δ denotes the difference between two climate states          Suzuki, 2019; Keshtgar et al., 2020; Zanis et al., 2020). On
(e.g. with and without anthropogenic aerosols). L refers to        regional scales, it is also worth noting that SUL is usually
the latent heat of condensation, and P is the precipitation        more suitable as CCN due to its higher hygroscopicity com-
rate, so LP refers to the atmospheric latent heating rate from     pared to BC. It can therefore alter cloud microphysics and
rainfall. H is the column-integrated divergence of dry static      subsequent precipitation formation and regional rainfall by
energy, which is expected to be zero on a global scale. Q          interacting with clouds. However, the susceptibility of pre-
is the atmospheric diabatic cooling (except for latent heat        cipitation to sulfate aerosols (and the precursors) shows large
released from precipitation), consisting of atmospheric ra-        discrepancies in satellite-estimated precipitation susceptibil-
diative cooling (ARC) and downward surface sensible heat           ity to aerosols from several products (Bai et al., 2018; Haynes
flux (−SH). ARC is the difference of shortwave (SW) and            et al., 2009) and a broad inter-model spread (uncertainty)
longwave (LW) fluxes between the top of the atmosphere             in GCMs (Ghan et al., 2016; Samset et al., 2016). Some
(TOA) and the surface. ARC has significant impacts on              studies also found that the sensitivity of precipitation to sul-
global hydrological sensitivity (Allen and Ingram, 2002),          fate aerosols varies between model-simulated and satellite-
while changes in the energy transport term (δH ) are essential     estimated results, in terms of magnitude and sometimes in
in determining the spatial pattern of precipitation response       sign (Liu et al., 2020; Wang et al., 2012).
(Muller and O’Gorman, 2011). Dagan et al. (2019) further              These responses of precipitation have been conventionally
demonstrated that whether precipitation responses are more         suggested to be composed of fast and slow responses (An-
correlated with changes in Q or H depends on the latitude          drews et al., 2009; Bala et al., 2010). Fast responses, on the
considered. In the extra-tropics, diabatic cooling/heating per-    timescale from days to months, are independent of changes in
turbations are confined to local scales due to strong Coriolis     sea surface temperature (SST) and mostly dependent on in-
force (thus weak energy transport), and hence the latent heat-     stantaneous changes in atmospheric radiative heating/cooling
ing must balance diabatic cooling according to the energy          (O’Gorman et al., 2012; Richardson et al., 2016). It should
budget. However, in the tropics, horizontal gradients of dry       be noted that even though SST is unchanged in atmosphere-
static energy are small due to the weak Coriolis force. There-     only models, the land surface temperature is generally still
fore, local strong diabatic heating perturbations can lead to      allowed to vary (Stjern et al., 2017). Slow responses, on
thermally direct circulations that drive convergence and di-       the timescale of years, are mediated by changes in sea sur-
vergence of moisture and dry static energy. This low-level         face temperature (SST) and strongly correlate with top-of-
convergence of mass and moisture can lead to vertical mo-          atmosphere (TOA) forcing (Kvalevåg et al., 2013; Lam-
tion and thus an increase in precipitation. So rainfall does not   bert and Webb, 2008; Suzuki et al., 2017). Distinguishing
necessarily have to positively correlate with diabatic cooling     contributions from fast and slow responses is essential for
(Dagan et al., 2019).                                              understanding the mechanisms that cause the precipitation
   Absorbing and non-absorbing aerosols can have different         changes. For example, Bony et al. (2013) examined the re-
effects on each energy budget term and thus precipitation.         sponses of tropical rainfall to increasing GHGs. They found
On the global scale, black carbon (BC), a strongly absorbing       that the fast processes weaken the vertical motion and coun-
aerosol, can stabilise the atmosphere and suppress precipi-        teract a considerable part of the increasing trend induced by
tation via strong shortwave absorption for short timescales,       surface warming. Shaw and Voigt (2015) have investigated

Atmos. Chem. Phys., 21, 10179–10197, 2021                                           https://doi.org/10.5194/acp-21-10179-2021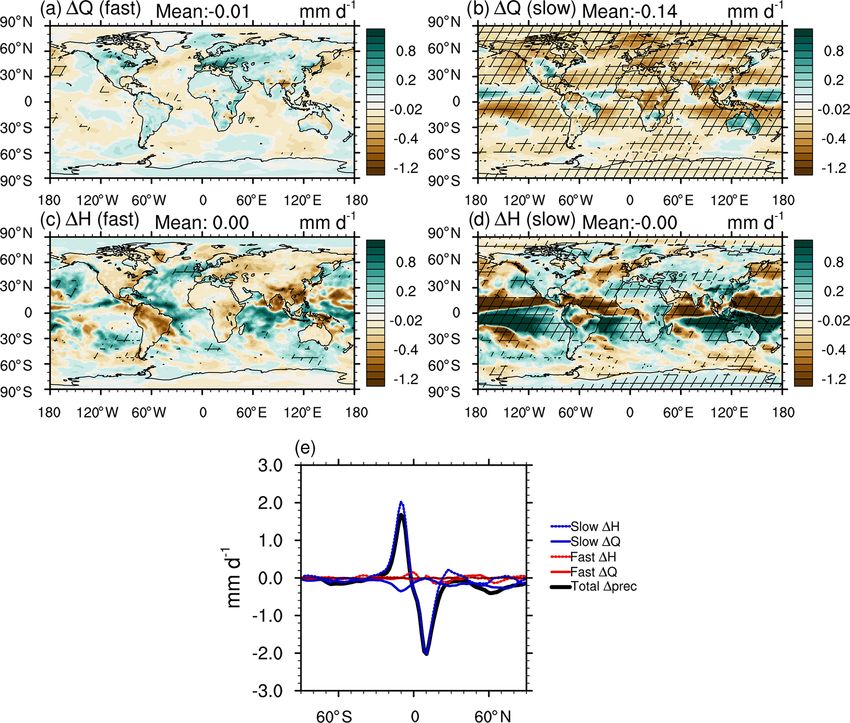
S. Zhang et al.: Aerosol effects on fast and slow precipitation responses                                                  10181

predicted changes in the summertime Asian monsoon under            on the comparison between absorbing and non-absorbing
a warming scenario caused by GHGs, and the fast responses          aerosols, and in particular on the underlying mechanisms
caused by direct radiative effect are generally opposite to the    causing the differences by distinguishing contributions from
slow impacts caused by the SST warming. The changes in             each energetic term at various scales.
circulation are essential for local climate responses, includ-        In light of previous work illustrating the potential of en-
ing clouds, radiation, and precipitation (Johnson et al., 2019),   ergy budget constraints for understanding regional precipita-
whereas the spatial distribution of aerosols’ radiative forcing    tion changes, and the fact that absorbing and non-absorbing
in turn affects atmospheric circulations (Chemke and Dagan,        aerosols impact the response on two distinct timescales, we
2018).                                                             aim to answer three questions. (1) What are the contribu-
   Distinguishing contributions from different energetic           tions of fast and slow responses to total precipitation changes
terms is also helpful for understanding physical processes         on global and regional scales? (2) What is the dominant
and model differences (DeAngelis et al., 2015). It has his-        energetic term in precipitation responses to absorbing/non-
torically been used to distinguish contributions from clouds       absorbing aerosol perturbations on different spatial and tem-
and aerosols when studying aerosol radiative forcing (Forster      poral scales? (3) How do we relate changes in local ther-
et al., 2007; Ghan 2013). While energetics have been ap-           modynamics and large-scale circulation to changes in ener-
plied before to analyse precipitation responses (e.g. Ming et      getic terms and quantify their contribution to precipitation
al., 2010; Dagan et al., 2019), here we further decompose          responses?
them into individual terms to provide additional insights.
Changes in the energy transport term (δH ) can be decom-
posed into eddy and mean state components, which are fur-          2   Method
ther associated with changes in thermodynamics and dynam-
ics (Muller and O’Gorman, 2011; Richardson et al., 2016).          The global aerosol–climate model ECHAM6–HAM2 (Stier
Changes in ARC can be further decomposed into contribu-            et al., 2005; Zhang et al., 2012; Tegen et al., 2019; Neubauer
tions from aerosol (mostly through SW absorption), clouds          et al., 2019) is used to perform all the experiments. It is
(LW radiative cooling), and clear–clean sky (mainly from           based on the general circulation model ECHAM6 (Stevens
water vapour, greenhouse gases, and the Planck feedback).          et al., 2013) and is coupled to the aerosol module HAM2
While it has long been appreciated that changes in ARC are         (Stier et al., 2005; Zhang et al., 2012). A two-moment cloud
essential in balancing latent heat release from precipitation      microphysics scheme is used to prognostically predict the
responses on global scales, their relationship on zonal-mean       number and mass mixing ratios for both cloud water and
or regional scales (and which the ARC component domi-              ice (Lohmann et al., 2007; Lohmann and Hoose, 2009). The
nates) has not been fully explored.                                parameterisations for convection, including cumulus con-
   The Precipitation Driver Response Model Intercompari-           vection and deep convections, are based on the scheme by
son Project (PDRMIP) (Myhre et al., 2017) has conducted            Tiedtke (1989) and Nordeng (1994). The activation of CCN
several experiments to study the response of precipitation         to cloud droplets is adopted from Abdul-Razzak and Ghan
to different climate forcers, such as GHGs, aerosols, and          (2000), which is based on Köhler theory (Köhler, 1936). It
solar radiation change (e.g. Samset et al., 2016; Stjern et        should be noted that freshly emitted BC is assumed to be
al., 2018). It has been found that the fast response domi-         hydrophobic and does not act as cloud condensation nuclei.
nates the global-averaged precipitation responses to BC per-       However, subsequent condensation of sulfuric acid and mix-
turbation, which differs from other drivers of climate change      ing with hydrophilic sulfate aerosols will increase its hygro-
(Samset et al., 2017; Stjern et al., 2017). It has also been       scopicity so that internally mixed BC particles can activate
shown that BC contributes to the most substantial uncertain-       as CCN (Stier et al., 2006). In HAM2.3, BC can act as ice
ties among GCMs in simulating the changes in surface tem-          nuclei through heterogeneous freezing, but only in the ac-
perature and precipitation, due to different parameterisations     cumulation and coarse modes (Neubauer et al., 2019). The
of physical, chemical, and dynamical processes involved on         parameterisation for autoconversion is from Khairoutdinov
the path from BC emission to the final climate impact (e.g.        and Kogan (2000). There are 16 spectral shortwave bands
Stjern et al., 2017). However, it is worth noting that most        in the solar radiation scheme and 14 spectrum bands in the
PDRMIP research focuses on global-mean changes and ad-             longwave radiation scheme (Pincus and Stevens, 2013). The
dressing uncertainties among GCMs (e.g. Myhre et al., 2017;        general circulation model ECHAM6 provides essential mete-
Richardson et al., 2018; Stjern et al., 2018). Samset et al.       orological backgrounds such as temperature, pressure, wind,
(2016) showed the spatial patterns of fast, slow, and total re-    and humidity and is coupled to HAM2 for the parameterisa-
sponses of precipitation to different climate forcers including    tions of several aerosol processes such as aerosol activation
absorbing and non-absorbing aerosols, with a greater focus         and deposition.
on the inter-comparison between different GCMs and differ-            Emissions of anthropogenic BC, organic carbon, and
ent climate forcers. Here we study the fast and slow response      sulfate are from the Atmospheric Chemistry and Climate
contribution to total response of precipitation with a focus       Model Intercomparison Project (ACCMIP) emission dataset

https://doi.org/10.5194/acp-21-10179-2021                                        Atmos. Chem. Phys., 21, 10179–10197, 2021
10182                                                S. Zhang et al.: Aerosol effects on fast and slow precipitation responses

(Lamarque et al., 2010), including emissions from indus-           performed a Gregory-style regression (Gregory and Webb,
try, agriculture, aircraft, domestic, ships, and waste. Biomass    2008) to check the equilibrium for the BC and SUL cases
burning emissions are also from the ACCMIP dataset, in-            (see Supplement). For the BC experiment, it is very likely
cluding both natural and anthropogenic biomass burning             to reach equilibrium after approximately 50 years. For the
(Lamarque et al., 2010). Dimethyl sulfide (DMS) emission           SUL case, the energy imbalance is significantly reduced and
is interactively related to the 10 m wind speed and concen-        reaches a near equilibrium after a 50-year run as well, but
tration in seawater. Biogenic volatile organic carbon and          it is suggested that more than 100 years of simulation are
volcanic emissions follow the AeroCom phase II emission            needed to fully equilibrate. So the total response of surface
dataset (Dentener et al., 2006). All the emissions are pre-        temperature to 5-fold SUL should be even lower (more neg-
scribed for the year 2000, so there are no interannual variabil-   ative). Considering the purpose of our study is to understand
ities of emissions. Simulations are performed at T63 (1.9◦ ×       the mechanisms of precipitation responses to aerosols, an ex-
1.9◦ ) spectral resolution using 47 vertical levels (L47).         act equilibrium is not critical here and our conclusions still
   To study the precipitation response to absorbing and non-       apply to an approximate equilibrium. Another simulation is
absorbing aerosol perturbations, we analyse two scenarios:         run for 20 years with fixed sea surface temperatures (fSST)
one with a 10-fold increase in BC emissions (hereafter             and the last 10 years are used. The precipitation responses
10BC) and another with a 5-fold increase in sulfur dioxide         for fSST simulations can be interpreted as the fast response
(hereafter 5SUL), relative to baseline emissions in the year       (1Pfast ). The slow response is then calculated as the differ-
2000 (Tegen et al., 2019). It should also be noted that the        ence between the total response and the fast response (Myhre
increases in BC emissions here include both anthropogenic          et al., 2017; Samset et al., 2016):
and natural sources. This is because the biomass burning
emission, as a large source of BC, includes both anthro-           1Pslow = 1Ptotal − 1Pfast .                                  (2)
pogenic emissions (e.g. agricultural waste burning) and natu-
rally occurring wildfire emissions. The anthropogenic contri-      The length of integration period is sufficient to derive the fast
bution to wildfire emissions is assumed to dominate but sub-       and total responses because the fast response of precipitation
ject to significant uncertainties (e.g. Lamarque et al., 2010;     occurs on timescales from days to months and a slower re-
van Marle et al., 2017), and it is very uncertain to separate      sponse on a timescale of years (Myhre et al., 2017).
the anthropogenic contribution of wildfires. However, the in-         Since fast and slow responses are examined from an en-
creases in SO2 emissions are all anthropogenic because the         ergetic perspective, we focus on how the atmospheric dia-
sources of volcanic and sulfur are kept the same. The main         batic cooling (Q) and energy transport terms (H ) respond
purpose of this work is to better understand the mechanisms        to aerosol perturbations in fSST and MLO simulations. H
of aerosol–precipitation interactions, with a focus on, but not    is calculated offline, as a residual by using the energy bud-
limited to, anthropogenic aerosol effects. As only particu-        get equation. Following previous studies (e.g. Muller and
lar aerosol emissions are changed in each perturbation, the        O’Gorman, 2011; Richardson et al., 2016), Q is the combina-
differences between baseline and the perturbed case can be         tion of atmospheric radiative cooling (ARC) and downward
interpreted as aerosol effects. Geographical patterns of emis-     surface sensible flux (−SH), as follows:
sion aerosol optical depth change can be found in the Supple-
ment (Fig. S1 in the Supplement). We chose the multipliers
                                                                   Q = ARC − SH.                                                (3)
of aerosol emissions differently here to make the aerosol ef-
fects statistically large enough and keep their radiative forc-
ing at the same magnitude (Myhre et al., 2017). Another rea-       ARC is defined as net shortwave (SW) and longwave (LW)
son is to make our results comparable with PDRMIP work             radiation loss of the atmospheric column, which can be cal-
(Samset et al., 2016).                                             culated from the difference between the top of atmosphere
   We run the simulations for 100 years with a mixed-layer         (TOA) and surface radiative fluxes (downward positive), de-
ocean (MLO), which is described as 50 m in depth (Dallafior        fined as
et al., 2016). The ocean heat transport term (also known as
the Q flux) is prescribed, which also means the ocean dy-          ARC = (LWTOA + SWTOA ) − (LWSUR + SWSUR ).                   (4)
namics are unchanged. Therefore, the changes in SST are
caused by local responses to net surface heat flux, and the        Ghan (2013) suggested using additional diagnostics to dis-
responses in ocean circulations are omitted. To obtain the         tinguish aerosol radiative forcing from aerosols, clouds,
equilibrium state of precipitation responses to aerosol per-       and surface albedo. This has been widely adopted in cur-
turbations, i.e. the total response (1Ptotal ), we use the last    rent GCMs to better estimate aerosol effects (e.g. Zhang et
50 years of the simulations because at that time the model         al., 2016). Following Ghan (2013), we further decompose
has reached approximate equilibrium (Samset et al., 2016).         ARC into contributions from clouds, aerosols, and clear–
We acknowledge that it might take more than 100 years for          clean sky (without aerosols and clouds) separately (Eq. 5),
a slab ocean model to fully equilibrate. Therefore we also         by using the same additional radiation call to calculate ARC

Atmos. Chem. Phys., 21, 10179–10197, 2021                                          https://doi.org/10.5194/acp-21-10179-2021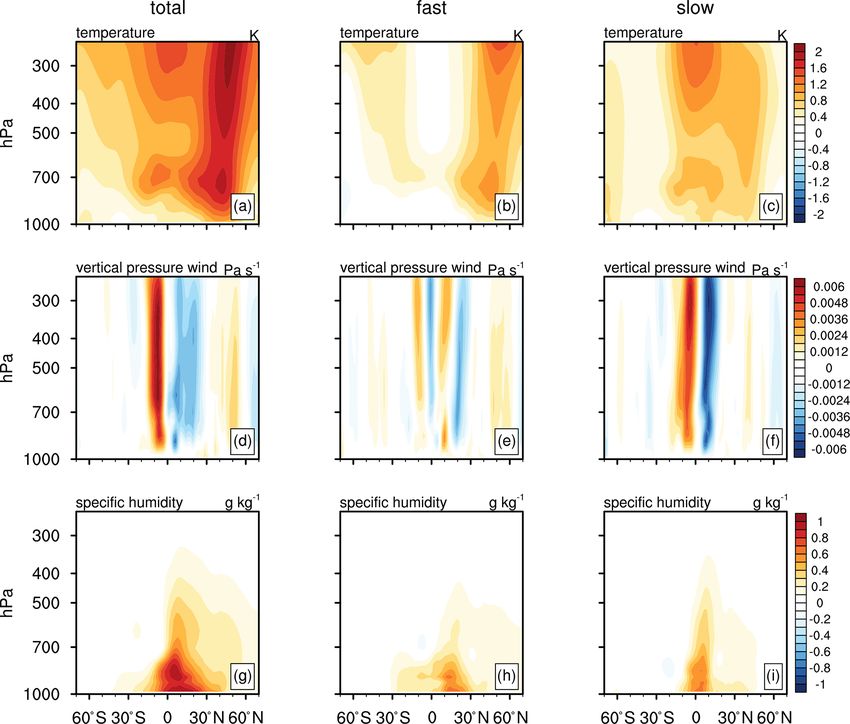
S. Zhang et al.: Aerosol effects on fast and slow precipitation responses                                               10183

from the clear–clean sky (ARCclear,clean ):                         For the BC case, the decreased precipitation from total re-
                                                                 sponses (L1P around −3.26 W m−2 ) is mostly contributed
ARC = ARCaerosol + ARCcloud + ARCclear,clean ,             (5)   by fast responses (L1P around −3.64 W m−2 ). Slow re-
ARCaerosol = ARC − ARCclean ,                              (6)   sponses (L1P around 0.38 W m−2 ) lead to precipitation
                                                                 changes that are increased but much smaller in magnitude
ARCcloud = ARCclean − ARCclear,clean .                     (7)
                                                                 precipitation compared to the fast responses. Previous stud-
Since ARC consists of radiative heating/cooling from             ies suggest that fast responses are largely mediated by at-
aerosols (mainly through aerosol direct SW absorption),          mospheric radiative absorption while slow responses scale
clouds (primarily through cloud LW absorption/cooling),          with surface temperature change (Samset et al., 2016). An
and clear–clean sky (mainly though LW radiative absorp-          increase in BC emissions can increase atmospheric absorp-
tion/cooling from GHGs, water vapour, and Planck feed-           tion to a large extent, which is a near-instantaneous pro-
back), it is helpful to systematically study the effect of ab-   cess. This can be seen from the decomposition of ARC,
sorbing and non-absorbing aerosols on each decomposed en-        which shows that the decreased ARC from fast and total re-
ergy term and to further connect those to changes in precipi-    sponses is mainly due to the increased SW absorption from
tation.                                                          BC aerosols (1ARCaerosol ) (Table 1). However, the change
   It is worth noting that 1ARCaerosol only includes direct      of global-mean surface temperature in the BC case is small
interactions with radiation here and is much more sensi-         (around 0.4 K). That is because for an increase in BC emis-
tive to absorbing aerosol burden rather than non-absorbing       sions, reduction of downward SW radiation largely counter-
aerosols. Despite the significant negative radiative forcing     acts increased downward LW radiation from the warmer at-
at TOA (Boucher et al., 2013), non-absorbing aerosols do         mosphere. As a result, the change of surface temperature is
not significantly modify atmospheric radiative absorption,       regionally dependent and globally small (Stjern et al., 2017)
as they act to decrease net SW radiative fluxes at both the      (Fig. S2). Large changes in 1ARCaerosol and small changes
surface and TOA in the same way. Non-absorbing aerosols          in global-mean surface temperature lead to a dominating con-
can affect atmospheric radiative absorption via changing ab-     tribution from fast responses to total global-mean rainfall
sorbing aerosol life cycles (Stier et al., 2006), but the im-    changes for the BC cases.
pacts can be very small. It should also be noted here that          For the SUL case, the slow response dominates the total
changes in ARCcloud include aerosol indirect effects (inter-     response (Table 1). Since SUL is a non-absorbing aerosol,
actions with clouds) on ARC and cloud feedbacks in slow          which decreases net SW radiative fluxes at both the surface
responses, but most of the changes are from LW radiation         and TOA through scattering solar radiation, atmospheric ab-
from clouds (e.g. Lubin and Vogelman, 2006) rather than          sorption changes little. Most of the reduced ARC in the total
SW radiation. And its magnitude depends on the temper-           response is from changes in clear–clean-sky radiative cool-
ature (height) at both cloud top and bottom as well as on        ing (1ARCclear,clean ) from slow responses mediated via sur-
the ice concentration at cloud top (see Fig. S2 for baseline     face flux changes. As SUL decreases SW radiation reaching
ARCcloud ). As aerosol effects on convective clouds are not      the surface, the global-mean temperature decreases around
explicitly simulated in ECHAM6–HAM2 (or most GCMs)               2 K on a relatively long timescale due to the high capacity of
yet, changes of ARCcloud from convective clouds are mostly       oceans (a slow process). Decreased global-mean temperature
caused by aerosol-induced changes in dynamics. Baseline          further leads to reduced ARCclear,clean from decreased atmo-
1ARCaerosol , 1ARCcloud , and 1ARCclear,clean can be seen        spheric column temperature (i.e. Planck feedback) (Zelinka
in the Supplement (Figs. S2–S4).                                 et al., 2020) and decreased water vapour content, which is
                                                                 controlled by the Clausius–Clapeyron relationship (Suzuki
                                                                 and Takemura, 2019).
3     Results                                                       The contribution of changes from SH acts to counteract
                                                                 nearly one-third of the decreased ARC in fast and total re-
3.1    Global-mean responses                                     sponses for the BC case, which is much larger than that in
                                                                 the SUL case. This is because the absorbing aerosols heat the
Table 1 shows the global-mean fast, slow, and total responses    atmosphere and decrease the temperature difference between
of the energy budget terms, including atmospheric latent heat    near-surface air and the surface, resulting in reduced upward
release from precipitation (L1P ) and other atmospheric di-      SH fluxes. So changes in SH are also dominated by the fast
abatic cooling terms, in response to increased BC and SUL        response and mainly act to increase precipitation from an
emission for the fSST and MLO simulations, respectively.         energetic perspective, counteracting the decreasing effect in-
Globally averaged precipitation is decreased in both the BC      duced by ARC in the BC case (Ming et al., 2010).
and SUL experiments, and the associated reduced latent heat-
ing is primarily balanced by decreased ARC (Table 1). How-
ever, there are some substantial differences between BC and
SUL cases after decomposition into different contributions.

https://doi.org/10.5194/acp-21-10179-2021                                      Atmos. Chem. Phys., 21, 10179–10197, 2021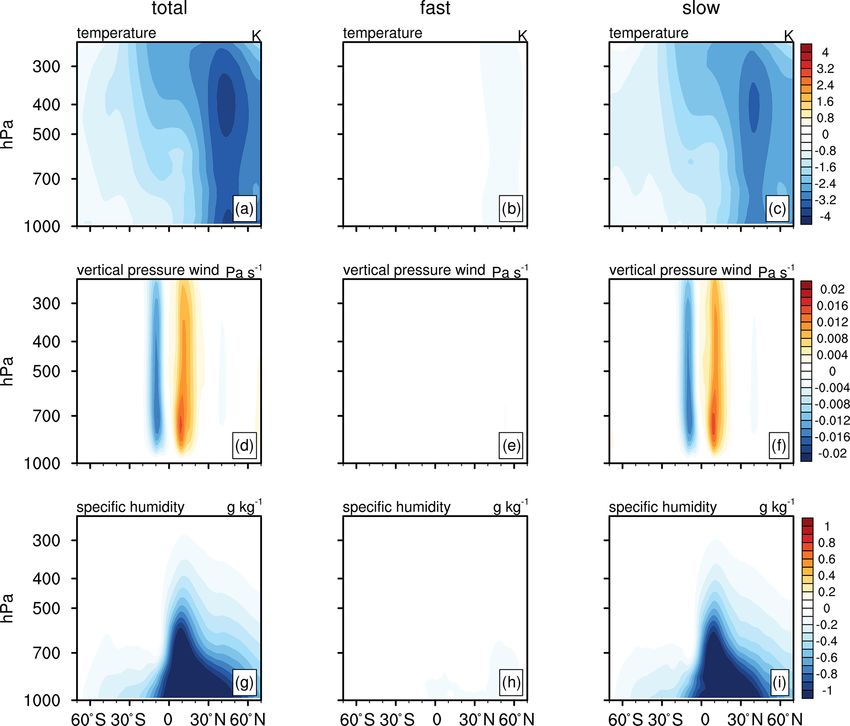
10184                                                   S. Zhang et al.: Aerosol effects on fast and slow precipitation responses

Table 1. ECHAM6–HAM2 simulated multi-annual global averaged fast, slow, and total responses of atmospheric energy budget terms (LP –
the atmospheric latent heating rate from rainfall, ARC – atmospheric radiative cooling, SH – sensible heat flux) and surface temperature (T )
in response to an increase of a factor of 10 in black carbon (BC) emission and a factor of 5 in sulfate (SUL) precursor emission. ARC has
been further decomposed into the contribution from aerosols, clouds, and clear–clean sky. All terms are shown in equivalent precipitation
units of mm d−1 .

                (mm d−1 )        L1P      1ARC       1ARCaerosol     1ARCcloud       1ARCclear,clean     −1SH       1T (K)
                Fast, 10BC      −0.13      −0.21            −0.29        0.03                   0.05       0.08      −0.03
                Slow, 10BC       0.01       0.02            −0.01        0.00                   0.04      −0.01       0.39
                Total, 10BC     −0.11      −0.18            −0.30        0.03                   0.09       0.07       0.35
                Fast, 5SUL      −0.01      −0.01             0.01        0.00                  −0.02       0.00      −0.14
                Slow, 5SUL      −0.14      −0.13             0.00        0.02                  −0.15      −0.01      −1.73
                Total, 5SUL     −0.15      −0.14             0.01        0.01                  −0.17      −0.01      −1.87

3.2   Regional responses and their contributions                         the lower troposphere and lead to more ascending motions
                                                                         over central Africa (Fig. S3) (Dagan et al., 2019; Roeckner
The geographical patterns of precipitation responses are sub-            et al., 2006). As for the SUL case, the rapid precipitation
stantially different between BC and SUL, in both the fast and            response shows an opposite land–sea contrast pattern in the
total responses (Fig. 1). The patterns are similar to Samset et          tropics, because SUL cools the land temperature (Fig. 1d)
al. (2016), in which they showed an ensemble result with a               as land surface temperature is not constrained in fSST runs.
focus on inter-comparison among several models and climate               However, considering SUL does not directly affect the dia-
forcers. For the total response, it shows a distinct pattern of          batic heating/cooling in the atmosphere, which differs from
an ITCZ shift in response to increased BC and SUL emis-                  BC, the changes are small and not statistically significant
sion. ITCZ tends to shift northward in the BC case while                 over most regions. There are still some exceptions. For ex-
it shifts southward in the SUL case (Fig. 1a and b). Since               ample, southeast Asia, which has the largest contribution to
BC warms (SUL cools) the Northern Hemisphere, there is                   SUL emission, and SUL impacts on rainfall through cool-
an enhanced southward (northward) cross-equatorial energy                ing of land temperature as well as interactions with are mon-
flux in response to the aerosol perturbation, resulting in ITCZ          soon (e.g. Wang et al., 2019). Decreased surface temperature
being shifted towards the warmer hemisphere (Bischoff and                over continents, such as South America, leads to a decrease
Schneider, 2016; Wang, 2009). Changes in tropical rainfall               in precipitation in most land regions as well as an increase in
are dominated by changes in the Hadley cell in response to               surrounding oceans (i.e. southeast Pacific Ocean) (Fig. 1d).
the enhanced cross-hemispheric energy fluxes. Figure 1e and                 In the zonal mean, precipitation is decreased over northern
f further show that the slow response mainly contributes to              hemispheric mid-latitudes in both BC and SUL cases for total
the ITCZ shift in both cases. This will be further demon-                responses, but different processes contribute to the total re-
strated in Sect. 3.3 and 3.4.                                            sponse. Most of the precipitation changes over high latitudes
   The fast response of precipitation in the BC case (Fig. 1c)           are contributed by fast responses in the BC case (Fig. 1g) and
shows a land–sea contrast pattern in the tropics, in which               slow responses in the SUL case (Fig. 1h). Dagan et al. (2019)
rainfall increases in central Africa while it decreases in the           showed different responses of rainfall to aerosol perturba-
surrounding tropical ocean. Central Africa is one of the main            tion in the tropics and extra-tropics. They demonstrated that
source regions of BC emission through biomass burning, and               precipitation responses are more correlated with the energy
a 10-fold increase in BC emissions makes the burden changes              transport term (H ) in the tropics where heating anomalies
significant (Fig. S1). The pattern of the fast precipitation re-         can be compensated for by large-scale thermally driven cir-
sponse in the BC case is similar to the pattern of rapid pre-            culations, whereas extra-tropical rainfall responses are con-
cipitation response to CO2 shown in Richardson et al. (2016).            strained by radiative cooling in the extra-tropics due to the
But the mechanism is not exactly the same. In the CO2 case,              stronger Coriolis force (thus weak energy transport). The dif-
even though SST remains unchanged, CO2 can increase land                 ferent contribution from fast and slow processes between the
surface temperature, and the land–sea temperature contrast               BC and SUL case indicates different responses in the dia-
(warmer land and unchanged ocean) leads to a shift of con-               batic cooling in the extra-tropics, and this will be addressed
vection to over land (Richardson et al., 2016). For an increase          in Figs. 3 and 4 from an energetic perspective.
in BC emissions, increased downward LW radiation from the                   Figure 2 quantifies how fast and slow responses contribute
warmer atmosphere is largely counteracted by a reduction                 to total responses of precipitation on regional scales. We used
of downward SW radiation. As a result, surface temperature               the response ratio which has also been used in Samset et
is decreased in central Africa (Fig. S2), which differs from
the CO2 case. But increased BC emission can still warm up

Atmos. Chem. Phys., 21, 10179–10197, 2021                                                 https://doi.org/10.5194/acp-21-10179-2021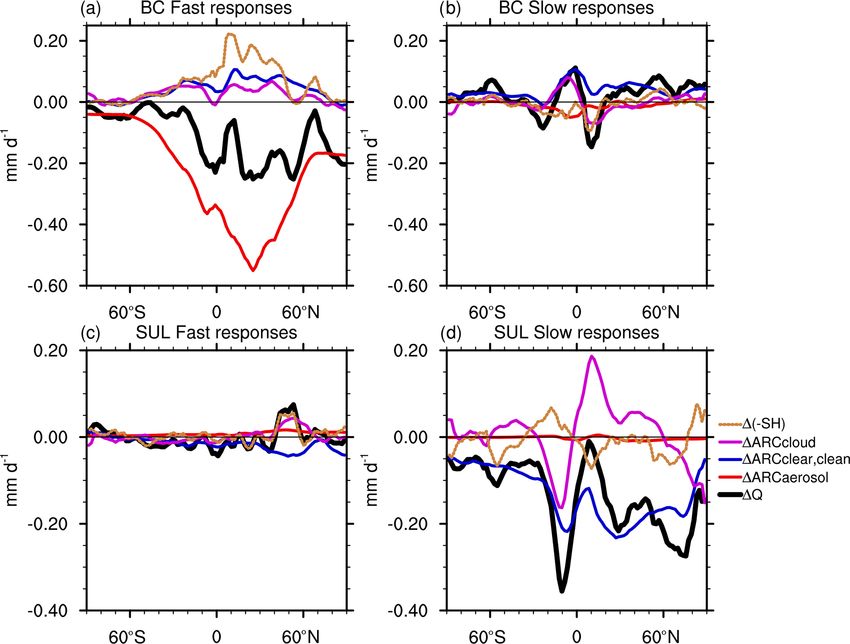
S. Zhang et al.: Aerosol effects on fast and slow precipitation responses 10185
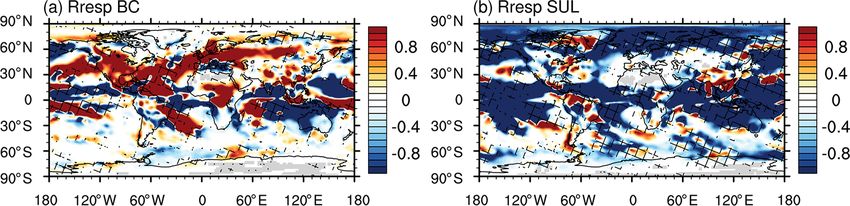
Figure 1. ECHAM6–HAM2 simulated geographical patterns of multi-annual mean precipitation change in response to 10-fold increased
(a, c, e) BC emissions and (b, d, f) 5-fold increased SUL precursor emissions for (a, b) total, (c, d) fast, and (e, f) slow responses. Hatching
indicates where the changes are significant (90 % confidence). (g, h) Zonal averages of changes in precipitation in terms of total, fast, and
slow responses to 10-fold increased (g) BC emission and (h) 5-fold increased SUL emission.
al. (2016), as follows: BC case, generally the response over northern hemispheric
mid-latitudes is consistent with the globally averaged result
Rresp = (|1Pfast | − |1Pslow |) / (|1Pfast | + |1Pslow |) . (8) shown in Table 1, which shows that the precipitation change
If Rresp is larger than 0 and close to 1, it means most of the is dominated by fast responses (Fig. 2a). It can be seen
total responses are contributed by fast responses. If Rresp is from Fig. 2a that a significant contribution is from fast re-
less than 0 and close to −1, it means slow responses dom- sponse over North America, the northern Atlantic Ocean, Eu-
inate over fast responses. Samset et al. (2016) showed con- rope, most regions in China, and northeastern Pacifica Ocean.
tinentally based results of Rresp for different climate forcers However, as for the changes in tropical rainfall, which is as-
and found the variabilities among models. Here Fig. 2 fo- sociated with the ITCZ shift seen in the total response, slow
cuses only on BC and SUL perturbations and quantitatively responses mainly contribute to the northward shift of ITCZ
gives us the geographical patterns of contributions from fast rather than fast responses in the BC case. One exception is
and slow responses to total precipitation change. For the central Africa, where the precipitation changes are still dom-
https://doi.org/10.5194/acp-21-10179-2021 Atmos. Chem. Phys., 21, 10179–10197, 202110186 S. Zhang et al.: Aerosol effects on fast and slow precipitation responses
inated by fast responses, and this will be further examined The slow response of δQ leads to a global increase in pre-
later. For the SUL case, it has been shown that total responses cipitation (Fig. 3b), but the magnitude is an order of magni-
are dominated by slow responses, both globally and region- tude less than the fast response in δQ. This increased pre-
ally (Fig. 2b). Some exceptions are some land regions such cipitation in the slow response is caused by the associated
as America, China, and the Sahel, where the precipitation increase in global temperature (Fig. 6c) (Table 1). From an
change is mostly not significant in total responses. energetic perspective, it is mainly associated with the clear–
clean-sky LW cooling (ARCclear,clean ) (Table 1 and Fig. 5b)
3.3 Changes in energy budget terms as a result of increased atmospheric column temperature
(Planck feedback). As precipitation responses in the extra-
To explain the different mechanisms between BC and SUL tropics are more correlated with δQ , larger fast responses of
in terms of the contribution from fast and slow responses in Q explain why rainfall responses in extra-tropics are domi-
more detail, we examine the changes in each energy budget nated by the fast response in the BC case (Fig. 2a). Figure 3e
term from Eq. (1). shows that the ITCZ shift seen in total responses is strongly
For the BC case, in fast responses, most decreases in Q correlated with slow responses of δH . The warmer Northern
are located over the main BC source regions such as central Hemisphere caused by an increase in BC leads to a south-
Africa and northeast China (Figs. 3a and S1). For zonal-mean ward cross-equatorial energy flux, which is accompanied by
results, after decomposing δQ into different terms based on a northward shift of the Hadley cell (Bischoff and Schneider,
Eqs. (3) and (5), it shows aerosol SW absorption is the major 2016). Changes in vertical pressure velocity can be found in
contributor to changes in Q (Fig. 5a). Since BC is a strongly Fig. 6, which also indicates a northward shift of the ascend-
absorbing aerosol, and the effect is near instantaneous, the ing branch of the Hadley cell. From an energetic view, the
changes of Q lead to decreased precipitation on global- and changes in vertical pressure velocity drive the dynamic effect
zonal-mean scales and happen through fast responses (Ta- on advection of dry static energy, which is a strong compo-
ble 1 and Fig. 5a). The zonal-mean plot (Fig. 3e) shows that nent in the changes of divergence of dry static energy fluxes
fast responses of δQ caused by aerosol absorption (Fig. 5a) (δH ) in the tropics (Richardson et al., 2016).
lead to reduced rainfall, especially over northern hemispheric For the SUL case, most of the fast responses are not
mid-latitudes (red solid line in Fig. 3e). statistically significant (Fig. 4a and c), and total responses
However, on regional scales, the energy transport term are dominated by the slow response. For changes in extra-
plays an important role. The geographical pattern of fast pre- tropics, changes in Q are correlated with changes in pre-
cipitation changes (Fig. 1c) is more similar to the fast re- cipitation. SUL decreases the mean-state temperature of the
sponse of δH (Fig. 3c) (spatial correlation ∼ 0.9) than δQ troposphere through slow responses, which leads to a re-
(spatial correlation ∼ −0.5). The spatial pattern of fast δH duction of specific humidity (Fig. 7). From an energetic
(Fig. 3c) also shows a land–sea contrast in the tropics as view, it leads to a decreased clear–clean-sky radiative cooling
in the precipitation change distribution (Fig. 1c), and this (ARCclear,clean ) (Fig. 5d), which contributes to most of the re-
is most prominent in central Africa and the middle Atlantic duced slow responses of δQ. For changes in the tropics, like
Ocean. There is a significant increase in rainfall over central the BC case, slow responses of δH are consistent with the
Africa and decrease over the middle Atlantic Ocean (Fig. 1a). southward ITCZ shift in the total response (Fig. 4d). In the
This is mostly contributed by fast responses (Figs. 1c and extra-tropics, for the SUL case, there is also an interesting
2a). As mentioned, this pattern is similar to the case of CO2 land–sea contrast in both fast and slow δH , with dry static
shown in Richardson et al. (2016). Although BC decreased energy fluxes generally diverging from oceans to lands in
surface temperature in central Africa through fast responses fast δH (Fig. 4c) and converging in slow δH (Fig. 4d). This
(Fig. S2), BC can still warm up the lower troposphere in cen- is because in the fixed SST simulations, land surface tem-
tral Africa, which results in a thermally driven circulation perature is still allowed to decrease in response to increased
which favours more convections there. This is evidenced by SUL emission (Fig. S5b in the Supplement) as a result of
Fig. 3c, which shows the dry static energy flux flow from reduced downward SW radiation. The land–sea contrast of
central Africa to the middle Atlantic Ocean (Fig. 3c). Dagan temperature (colder land) results in more downward large-
et al. (2019) performed an idealised experiment by adding an scale motions and divergence of moisture (see Fig. S6 in
absorbing plume in the tropics, and they found a very similar the Supplement for changes in vertical pressure velocity and
standing wave pattern of precipitation as a response. Examin- column-integrated water vapour) over most land regions, par-
ing δH shows that this is caused by a thermally driven circu- ticular Southeast Asia and South America, in fast responses.
lation, which favours more convections over central Africa. Since fast responses have already accounted for part of land
Positive δH is consistent with more ascending motions in temperature reduction, ocean surface temperature decreases
central Africa (Fig. S3). BC warms up the lower troposphere more than land surface in slow responses (Fig. S2d). The
in central Africa, which results in more ascending motions colder ocean temperature therefore leads to an opposite land–
(Fig. S3) and the dry static energy flux flow from central sea pattern compared to fast responses (Fig. 4d).
Africa to the middle Atlantic Ocean (Fig. 3c).
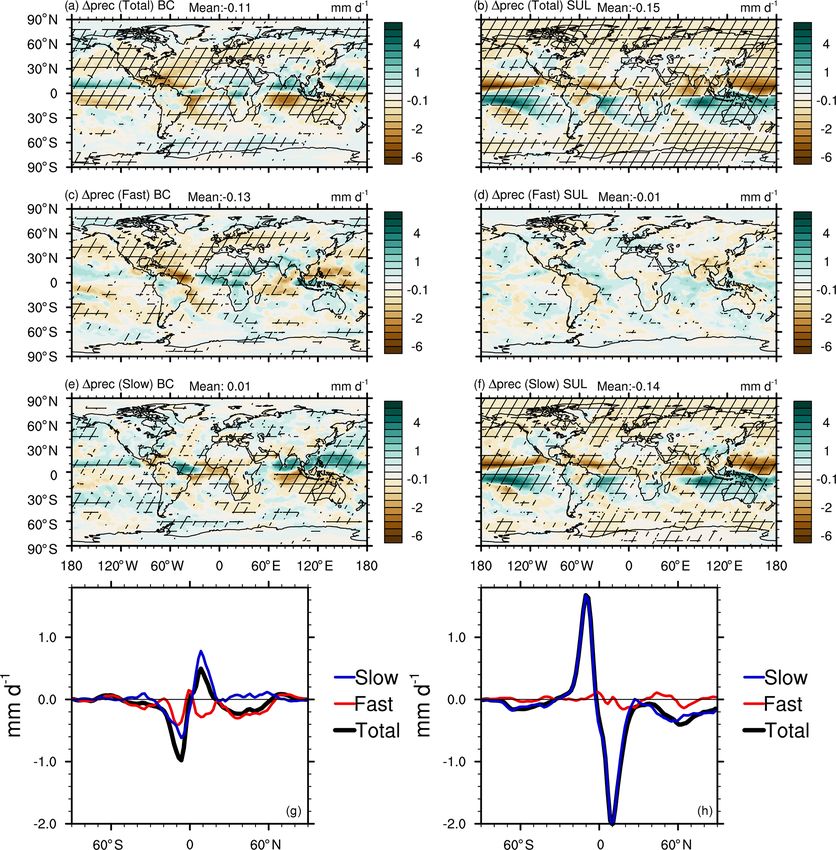
Atmos. Chem. Phys., 21, 10179–10197, 2021 https://doi.org/10.5194/acp-21-10179-2021S. Zhang et al.: Aerosol effects on fast and slow precipitation responses 10187 Figure 2. Response ratio of fast and slow responses (Rresp ) (red denotes fast responses dominate the total responses and blue indicates slow responses dominate) for (a) BC cases and (b) SUL cases. Results have been normalised by total responses of precipitation. Hatching indicates the signs of fast and slow responses are same. If Rresp is around 0, contributions from fast and slow responses are similar. If Rresp is larger than 0, the total response is dominated by fast responses. If Rresp is less than 0, the total response is dominated by slow responses. Figure 3. ECHAM6–HAM2 simulated geographical patterns of multi-annual mean changes in (a, b) atmospheric diabatic cooling (1Q) and (c, d) dry static energy flux divergence (1H ) for (a, c) fast responses and (b, d) slow responses to 10-fold increased BC emission. Hatching indicates where the changes are significant (90 % confidence interval through bootstrapping methods). (e) The zonal mean of total precipitation response and its decompositions, including fast and slow responses of diabatic cooling and dry static energy flux divergence. All of them are shown in equivalent precipitation units of mm d−1 . https://doi.org/10.5194/acp-21-10179-2021 Atmos. Chem. Phys., 21, 10179–10197, 2021
10188                                                   S. Zhang et al.: Aerosol effects on fast and slow precipitation responses

Figure 4. ECHAM6–HAM2 simulated geographical patterns of multi-annual mean changes in (a, b) atmospheric diabatic cooling and (c, d)
dry static energy flux divergence for (a, c) fast responses and (b, d) slow responses to 5-fold increased SUL emission. Hatching indicates
where the changes are significant (90 % confidence interval through bootstrapping methods). (e) The zonal mean of total precipitation
response and its decompositions, including fast and slow responses of diabatic cooling and dry static energy flux divergence. All of them are
shown in equivalent precipitation units of mm d−1 .

   Changes of Q are more robust in the fast response for                 part of diabatic cooling over tropical regions (Fig. 5b and d).
the BC case, and the slow response of Q is more robust                   This counteraction with the ITCZ shift is caused by the as-
for the SUL case. Decomposition of diabatic cooling shows                sociated change of deep convective clouds (see Supplement
its global-mean decrease is dominated by an increase in at-              for changes in cloud properties). This is consistent with the
mospheric aerosol absorption for fast responses in the BC                results shown in Naegele and Randall (2019). They found
case (Fig. 5a) and decreased radiative cooling from the clear–           a negative correlation between tropical rainfall and diabatic
clean sky for slow responses in the SUL case (Fig. 5d). The              cooling and demonstrated this is caused by feedbacks from
decreased ARCclear,clean values are mainly caused by the de-             deep convective clouds. More high clouds lead to a decrease
creased atmospheric column temperature (Planck feedback)                 in atmospheric LW radiative cooling but an increase in pre-
and associated reduced water vapour content (controlled by               cipitation, and the negative correlation is robust over tropical
the Clausius–Clapeyron relationship). Sensible heat flux (up-            regions where deep convective clouds prevail (Naegele and
ward) is also reduced due to the warmer atmosphere caused                Randall, 2019). The spatial patterns of fast, slow, and total
by absorption from BC (Fig. 5a).                                         responses to 1ARCaerosol , 1ARCcloud , and 1ARCclear,clean
   It should also be noted that changes in diabatic cooling              can be found in the Supplement.
counteract the latent heat released from precipitation asso-
ciated with the ITCZ shift in both cases (Figs. 3b and 4b).
This is mainly caused by ARCclouds , as it contributes a large

Atmos. Chem. Phys., 21, 10179–10197, 2021                                                 https://doi.org/10.5194/acp-21-10179-2021
S. Zhang et al.: Aerosol effects on fast and slow precipitation responses                                                             10189

Figure 5. ECHAM6–HAM2 simulated multi-annual zonal mean of decomposed changes in atmospheric diabatic cooling (1Q), including
ARC changes from aerosols (1ARCaerosol ), clouds (1ARCcloud ), clear–clean sky (1ARCclear,clean ), and downward sensible heat flux
(1(−SH)) for (a) fast responses in the BC case, (b) slow responses in the BC case, (c) fast responses in the SUL case, and (d) slow responses
in the SUL case. All items are shown in equivalent precipitation units of mm d−1 .

3.4   Responses of large-scale circulation and local                     of the Hadley cell, which show an increased upward motion
      thermodynamic conditions                                           in NH tropics and decreased ascending motion in SH trop-
                                                                         ics (Fig. 6d). Therefore, the tropical rainfall associated with
Figures 3e and 4e show that changes in tropical rainfall are             ITCZ changes in response to the changes of large circula-
strongly associated with slow responses of the energy trans-             tion. Figure 6f further demonstrates that slow responses con-
port term, independent of aerosol types (absorbing or non-               tribute to most of the changes in tropical large-scale circu-
absorbing), whereas changes in mid-latitude precipitation are            lations in Fig. 6d. It is consistent with Fig. 3 that changes
dependent on aerosol types, which are dominated by fast re-              in tropical latent heat released from precipitation are mostly
sponses of aerosol SW absorption in the BC case and slow                 contributed by δHslow , because the dynamic component as-
responses of clear–clean-sky radiative cooling in the SUL                sociated with changes in vertical velocity dominates the en-
case. To help understand the mechanisms of the tropospheric              ergy transport term over the tropics (Richardson et al., 2016).
response in different regions, we study the response of the              Outside the tropics, changes in ω are not as significant as in
large-scale circulation and thermodynamic conditions, by ex-             the tropics (Fig. 6d), and zonal-mean rainfall is more related
amining the changes in vertical pressure velocity (ω), tem-              to local changes in thermodynamic conditions. Absorbing
perature T , and specific humidity q (Figs. 6 and 7). The                aerosols directly heat the mid-troposphere through fast pro-
vertical pressure velocity (ω) at 500 hPa is a useful method             cesses (Fig. 6b). Heating the mid-troposphere will stabilise
to distinguish different cloud dynamic regimes and a met-                the column and suppress precipitation. This is consistent with
ric to quantify the strength of large-scale circulation (Bony            the energetic perspective shown in Figs. 3 and 5a that fast re-
and Dufresne, 2005; Zhang et al., 2016). Here we only show               sponses of radiative cooling caused by BC SW absorption
zonal-mean analysis.                                                     (reduced ARCaerosol ) account for the decreased latent heat
   As shown in Fig. 6, BC warms up the atmosphere through                in extra-tropics. An interesting aspect here is that while BC
SW absorption, and the warming is confined mainly in the                 induces the ITCZ shift, the fast response (Fig. 6e) seems
Northern Hemisphere (NH) where the BC emissions prevail.                 to counteract the stronger slow response shown in Fig. 6f.
This leads to southward cross-equatorial energy fluxes and               This is because of the strong non-zonal effect from central
a northward shift of the Hadley cell (Wang, 2009; Bischoff               Africa (see geographical pattern of vertical pressure velocity
and Schneider, 2016; Zhao and Suzuki, 2019). The changes                 changes in the Supplement), where BC warms up the lower
in ω demonstrate the northward shift of the ascending branch

https://doi.org/10.5194/acp-21-10179-2021                                               Atmos. Chem. Phys., 21, 10179–10197, 2021
10190 S. Zhang et al.: Aerosol effects on fast and slow precipitation responses Figure 6. ECHAM6–HAM2 simulated multi-annual (a, d, g) total, (b, e, h) fast, and (c, f, i) slow responses of zonally averaged (a–c) temperature, (d–f) vertical pressure velocity, and (g–i) specific humidity in response to 10-fold increased BC emission. Blue colours indicate large-scale ascent, and red colours indicate large-scale descent in (d–f). troposphere, resulting in more ascending motions in fast re- surface temperature through slow processes and leads to a sponses (Fig. S6). It is also consistent with Fig. 1g that fast cooling of the whole column in the extra-tropics (Fig. 7a and responses of rainfall in the southern tropical branch act to en- c). As a result, the specific humidity shows a large reduc- hance ITCZ while only the northern branch acts to decrease tion (Fig. 7i), which is associated with a reduction of rainfall ITCZ. in the extra-tropics. This is consistent with the energetic per- For the SUL case, the tropical rainfall response is opposite spective shown in Figs. 4 and 5d that reduced clear–clean-sky to that in the BC case, but the mechanism is similar. Increas- radiative cooling (ARCclear,clean ) accounts for the decreased ing sulfate aerosols induces a dimming effect and causes latent heat in extra-tropics. a negative radiative forcing at the surface, which is a fast It is worth mentioning that Figs. 6 and 7, as a bottom-up process. Subsequently, global surface temperatures are de- method, qualitatively show how the changes in large-scale creased, a slow process controlled by ocean heat capacity, circulation and local thermodynamics affect rainfall in terms and this cooling is more significant in the NH (Fig. 7a and of total, fast, and slow responses, whereas the energy budget c). As a result, the northward cross-equatorial energy fluxes view (Figs. 3, 4, and 5), as a top-down method, more easily lead to a southward shift of the Hadley cell (Fig. 7d). The quantifies these contributions through energetic terms (e.g. slow responses of the large-scale circulation (caused by SST the energy transport term, ARCaerosol , and ARCclear,clean ). difference between hemispheres) contribute most of the shift Combining these two methods makes the link between pre- of Hadley cell (Fig. 7e). In the extra-tropics, a decrease in cipitation and aerosols explicit. precipitation is also found in response to changes in ther- modynamics. However, unlike black carbon, SUL decreases Atmos. Chem. Phys., 21, 10179–10197, 2021 https://doi.org/10.5194/acp-21-10179-2021
S. Zhang et al.: Aerosol effects on fast and slow precipitation responses                                                           10191

Figure 7. ECHAM6–HAM2 simulated multi-annual (a, d, g) total, (b, e, h) fast, and (c, f, i) slow responses of zonally averaged (a–c)
temperature, (d–f) vertical pressure velocity, and (g–i) specific humidity in response to 5-fold increased SUL precursor emission. The blue
colour indicates large-scale ascent, and the red colour indicates large-scale descent in (d–f).

4   Conclusions                                                         and local energy transport. We introduce a method, based on
                                                                        Ghan (2013), to further decompose ARC into contributions
We have examined the response of precipitation to absorb-               from aerosols (through aerosol direct SW absorption), clouds
ing and non-absorbing aerosol perturbations by separately               (through cloud LW absorption/cooling), and clear–clean sky
increasing BC emission and SUL emission in ECHAM6–                      (without aerosols or clouds; mainly though LW radiative ab-
HAM2 by 10 times and 5 times their baseline emission,                   sorption/cooling from GHGs, water vapour, i.e. Planck feed-
following the PDRMIP protocol (Myhre et al., 2017; Sam-                 back).
set et al., 2016). The precipitation response is separated                 While it has long been appreciated that changes in ARC
into fast (mediated by near-instantaneous changes in atmo-              are essential in balancing latent heat released from precip-
spheric radiative cooling) and slow responses (mediated by              itation on global scales, their relationship on zonal-mean or
changes in SST) on both global and regional scales. An en-              regional scales has not been fully explored. For global means,
ergetic perspective has been adopted to study precipitation             although SUL and BC have a different sign of radiative forc-
changes. Global-averaged energetics have previously been                ing at TOA (Boucher et al., 2013), we found that precipita-
used to study precipitation responses (e.g. Ming et al., 2010;          tion is decreased for both cases, which is energetically bal-
some PDRMIP work); here, we further decompose atmo-                     anced by reduced atmospheric diabatic cooling δQ (Table 1).
spheric heating rates into individual terms separately for fast         This response occurs at different timescales, dominated by
and slow responses. Changes in atmospheric latent heat re-              fast responses for BC and by slow responses for SUL. For
lease from precipitation are balanced by changes in atmo-               BC, on the global scale, the most significant effect is that ab-
spheric radiative cooling (ARC), surface sensible heat flux,

https://doi.org/10.5194/acp-21-10179-2021                                              Atmos. Chem. Phys., 21, 10179–10197, 2021
10192 S. Zhang et al.: Aerosol effects on fast and slow precipitation responses sorbing aerosols directly heat the mid-troposphere, stabilise case, together with reduced precipitation over the middle the column, and suppress precipitation. Therefore, most of Atlantic Ocean, and this pattern is most prominent in fast the changes are due to aerosol absorption (ARCaerosol ) from responses. This pattern shows clear similarities with the fast responses. Meanwhile BC warms up the lower tropo- standing wave pattern response of precipitation to an ide- sphere and decrease the temperature differences between the alised plume of absorbing aerosols in the tropics (Dagan surface and near-surface temperature, which results in a de- et al., 2019). Examining δH shows that this is caused by creased upward sensible heat. Investigating the energy bal- a thermally driven circulation, which favours more convec- ance, we found this decreased upward surface heat flux from tions over central Africa. BC warms up the lower troposphere the fSST experiment acts to cancel almost one-third of the in central Africa, which results in more ascending motions decreasing effect caused by increased aerosol SW absorp- (Fig. S3). The low latitude (thus weak Coriolis force) allows tion. For SUL, although non-absorbing aerosol does not di- for the dry static energy to be efficiently diverged from cen- rectly affect ARC through aerosol absorption, the net nega- tral Africa to the middle Atlantic Ocean (Fig. 3c). In the tive radiative forcing at TOA in fSST experiments and asso- SUL case, while most regions are dominated by slow re- ciated surface forcing leads to a decrease in global surface sponses, in some regions, such as most parts of China and temperature through slow responses. As a result, it cools the South America, rainfall changes are still dominated by fast whole atmospheric column, accompanied by reduced spe- responses (Fig. 2b), where the surface temperature is signifi- cific humidity, which leads to reduced precipitation. This can cantly decreased (Fig. S2). This is due to the dimming effect also be seen from the decreased radiative cooling from the from SUL and associated surface flux changes, and because clear–clean-sky ARCclear,clean in slow responses. changes of land surface temperature are not constrained in Zonally averaged patterns of precipitation changes for the fSST experiments. Reduced surface fluxes and temperatures BC and SUL cases are different (Fig. 1). Tropical rainfall therefore lead to a decrease in precipitation over most land is primarily associated with ITCZ, which shifts northward regions as well as an increase in surrounding oceans (e.g. for BC and southward for SUL. Extra-tropical rainfall is re- southeast Pacific Ocean). duced in both cases. For BC, slow responses account for Changes in zonally averaged vertical pressure velocity, most of the changes in tropical rainfall, while fast responses temperature profile, and specific humidity (Figs. 6 and 7) dominate changes in other regions (Fig. 2a). BC warms the show consistency with zonally averaged energetics. Changes Northern Hemisphere through slow responses, which leads in vertical pressure velocity indicate a northward shift of the to a southward energy flux (Bischoff and Schneider, 2016; ascending branch of the Hadley cell in the BC case and SUL Rotstayn and Lohmann, 2002). From an energetic perspec- case. It is consistent with the changes in the divergence of tive, in the tropics where intense convections and large-scale dry static energy fluxes, which is dominated by the changes thermally driven circulations prevail, slow responses of the in vertical velocity (the dynamic component) in the tropics energy transport term dominate the changes in tropical rain- (Richardson et al., 2016). In the extra-tropics, stabilisation fall (Fig. 3e), which is associated with the northward shift induced by BC through fast response is consistent with in- of Hadley cells (Fig. 6). Outside the tropics, BC warms up creased atmospheric radiative heating from aerosol SW ab- the mid-troposphere, stabilises the atmosphere (Fig. 6), and sorption. Reduced specific humidity as well as decreased at- suppresses precipitation, which is a fast response. Energet- mospheric column temperature in the SUL case is consistent ically, different from the tropics, BC-induced increased di- with decreased radiative cooling from the clear–clean sky. abatic heating is locally confined due to a stronger Corio- The changes in large-scale circulations and local thermody- lis force. This geostrophic confinement of the diabatic heat- namics qualitatively explain the responses of precipitation, ing associated with increased aerosol shortwave absorption whereas the energetic perspective provides a method to quan- has to be balanced by reduced latent heat from precipitation tify and make their contributions explicit. (a fast response) (Fig. 5a). For the SUL case, the slow re- In summary, we examined the relationship between sponse dominates in nearly all regions (Fig. 2b), which is aerosol-induced changes in atmospheric energetics and pre- not surprising given that sulfate aerosol does not directly af- cipitation changes across different scales. Generally, changes fect the column diabatic cooling. In the extra-tropics, SUL in ARC and latent heat from precipitation are largely bal- decreases surface temperatures, primarily through slow pro- anced globally and in the extra-tropics (Dagan et al., 2019). cesses; cools the whole column; and reduces specific humid- However, these two terms are less balanced in the trop- ity (Fig. 7). From an energetic perspective, this can also be ics due to efficient local energy transport. We introduced seen from the decreased radiative cooling from the clear– a new decomposition method, derived from Ghan (2013), clean sky (without clouds and aerosols) (Fig. 5d) due to to examine aerosol effects on precipitation. For absorb- the reduced water vapour content and decreased atmospheric ing aerosols, decreased global-mean and extra-tropical pre- column temperature (Planck feedback). cipitation is associated with increased atmospheric aerosol There exist some interesting regions where the responses SW absorption from fast responses, while for non-absorbing are distinct from globally or zonally averaged results. Rain- aerosols, reduced rainfall is more correlated with decreased fall is significantly increased over central Africa, in the BC clear–clean-sky atmospheric radiative cooling from slow re- Atmos. Chem. Phys., 21, 10179–10197, 2021 https://doi.org/10.5194/acp-21-10179-2021
You can also read