Tree growth is more limited by drought in rear-edge forests most of the times
←
→
Page content transcription
If your browser does not render page correctly, please read the page content below
Camarero et al. Forest Ecosystems     (2021) 8:25
https://doi.org/10.1186/s40663-021-00303-1

 RESEARCH                                                                                                                                           Open Access

Tree growth is more limited by drought in
rear-edge forests most of the times
J. Julio Camarero1* , Antonio Gazol1, Gabriel Sangüesa-Barreda2, Marta Vergarechea3, Raquel Alfaro-Sánchez4,
Nicolás Cattaneo3 and Sergio M. Vicente-Serrano1

  Abstract
  Background: Equatorward, rear-edge tree populations are natural monitors to estimate species vulnerability to
  climate change. According to biogeographical theory, exposition to drought events increases with increasing aridity
  towards the equator and the growth of southern tree populations will be more vulnerable to drought than in
  central populations. However, the ecological and biogeographical margins can mismatch due to the impact of
  ecological factors (topography, soils) or tree-species acclimation that can blur large-scale geographical imprints in
  trees responses to drought making northern populations more drought limited.
  Methods: We tested these ideas in six tree species, three angiosperms (Fagus sylvatica, Quercus robur, Quercus
  petraea) and three gymnosperms (Abies alba, Pinus sylvestris and Pinus uncinata) by comparing rear-edge tree
  populations subjected to different degrees of aridity. We used dendrochronology to compare the radial-growth
  patterns of these species in northern, intermediate, and southern tree populations at the continental rear edge.
  Results and conclusions: We found marked variations in growth variability between species with coherent
  patterns of stronger drought signals in the tree-ring series of the southern populations of F. sylvatica, P. sylvestris,
  and A. alba. This was also observed in species from cool-wet sites (P. uncinata and Q. robur), despite their limited
  responsiveness to drought. However, in the case of Q. petraea the intermediate population showed the strongest
  relationship to drought. For drought-sensitive species as F. sylvatica and P. sylvestris, southern populations presented
  more variable growth which was enhanced by cool-wet conditions from late spring to summer. We found a trend
  of enhanced vulnerability to drought in these two species. The response of tree growth to drought has a marked
  biogeographical component characterized by increased drought sensitivity in southern populations even within the
  species distribution rear edge. Nevertheless, the relationship between tree growth and drought varied between
  species suggesting that biogeographical and ecological limits do not always overlap as in the case of Q. petraea. In
  widespread species showing enhanced vulnerability to drought, as F. sylvatica and P. sylvestris, increased
  vulnerability to climate warming in their rear edges is forecasted. Therefore, we encourage the monitoring and
  conservation of such marginal tree populations.
  Keywords: Climate change, Dendroecology, Latitudinal gradient, Mediterranean forests, Standardized
  evapotranspiration precipitation index (SPEI)

* Correspondence: jjcamarero@ipe.csic.es
1
 Instituto Pirenaico de Ecología (IPE-CSIC), Avda. Montañana 1005, E-50192
Zaragoza, Spain
Full list of author information is available at the end of the article

                                       © The Author(s). 2021 Open Access This article is licensed under a Creative Commons Attribution 4.0 International License,
                                       which permits use, sharing, adaptation, distribution and reproduction in any medium or format, as long as you give
                                       appropriate credit to the original author(s) and the source, provide a link to the Creative Commons licence, and indicate if
                                       changes were made. The images or other third party material in this article are included in the article's Creative Commons
                                       licence, unless indicated otherwise in a credit line to the material. If material is not included in the article's Creative Commons
                                       licence and your intended use is not permitted by statutory regulation or exceeds the permitted use, you will need to obtain
                                       permission directly from the copyright holder. To view a copy of this licence, visit http://creativecommons.org/licenses/by/4.0/.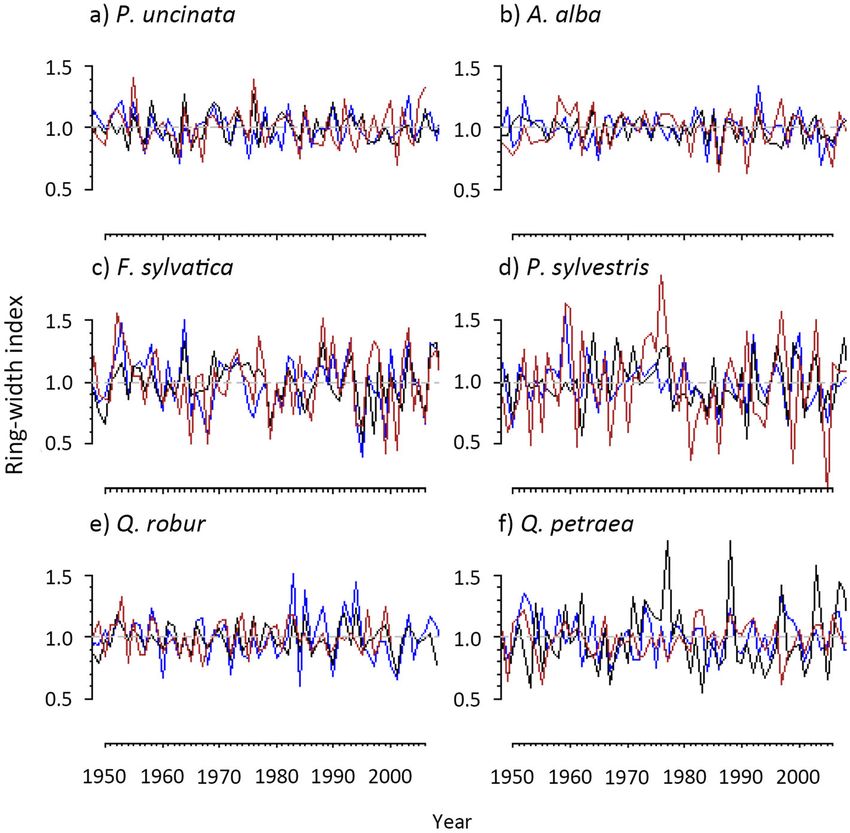
Camarero et al. Forest Ecosystems   (2021) 8:25                                                                  Page 2 of 15

Background                                                      L.) populations show greater sensitivity to drought in dry
Climate warming impacts the productivity and function-          regions of Spain than in northern or wetter areas (Serra-
ing of forest ecosystems worldwide with consequences            Maluquer et al. 2019; Bose et al. 2020). However, local
on the services they provide for human wellbeing                ecological conditions can affect the growth responsiveness
(Anderegg et al. 2013; Hartmann et al. 2018). Recent            of these species and populations to climate making rear-
warming trends have accelerated tree growth in                  edge populations less vulnerable to drought than their
temperature-limited forests (Serreze and Barry 2011),           northern counterparts (Dorado-Liñán et al. 2019). This
while they have caused widespread drought-related               contingency on site conditions has been shown in silver fir
mortality in most biomes (Allen et al. 2010; Choat et al.       forests in the Spanish Pyrenees (Camarero et al. 2011),
2018). Drought is becoming a major driver of tree               Scots pine in southern Spain (Herrero et al. 2013), or
growth globally (Babst et al. 2019) revealing a temporal        European beech forests in north eastern Spain (Vilà-
instability in its impacts on forests over the last decades     Cabrera and Jump 2019). Thus, the growth response
(Peltier and Ogle 2020; Wilmking et al. 2020). Along            to drought of rear-edge tree populations can deviate
with this, the role of drought in determining tree growth       from biogeographical predictions due to the influence
is also spatially variable (Anderegg et al. 2015), with tree    of local ecological factors or genetic adaptations to
populations located near the equatorward distribution           drought (Vilà-Cabrera et al. 2019).
limit being more vulnerable to drought (e.g., Sánchez-            Several factors can contribute to the strong variability
Salguero et al. 2017; but see Cavin and Jump 2017).             in tree growth response to drought between populations
Therefore, when trees are not adapted to harshening             decoupling biogeographical and ecological margins
environmental conditions, widespread dieback and                (Vilà-Cabrera et al. 2019). Thus, population performance
mortality occur leading to the range contraction of the         may depend on the interaction between different eco-
species distribution limit (Anderegg and HilleRisLambers        logical factors, climate-competition trade-offs (e.g., Jump
2016; Anderegg et al. 2019). However, recent studies have       et al. 2017; Anderegg and HilleRisLambers 2019), or
demonstrated that populations on the equatorward limit          phenotypic plasticity and genetic variability (Hampe
display adaptations to drought (Dorado-Liñán et al. 2019;       2004; Valladares et al. 2015). For example, Herrero et al.
Muffler et al. 2020) and that ecological factors can blur or    (2013) and Marqués et al. (2016) found that Scots pine
override geographical patterns of greater vulnerability to      rear-edge populations were vulnerable to drought at low
drought as latitude decreases (Vilà-Cabrera and Jump            elevations, where the evapotranspiration demand in-
2019). In other words, marginality has different compo-         creases, while at high elevations growth was less con-
nents (i.e., geographical, ecological, and genetic) and geo-    strained by water shortage. Altitudinal variations can
graphical range margins do not always dictate population        decouple local microclimate conditions from regional
performance (Vilà-Cabrera et al. 2019).                         macroclimatic patterns affecting tree growth response to
   According to biogeographical expectations, as climate        climate but also competitive interactions (Anderegg and
becomes warmer and drier, rear-edge tree populations of         HilleRisLambers 2019). That is, within the rear edge
temperate or mountain species may become vulnerable             those populations at lower elevations were more vulner-
to drought and show productivity and growth reductions          able to drought. Muffler et al. (2020) found that
preceding dieback events (Camarero et al. 2017). Several        European beech rear-edge populations did not respond
Eurasian tree species reach their southern distribution         to drought as compared to central populations and
limit in Spain (de Vries et al. 2015), where drought-           attributed this effect to the cooling effects of local fog
limitations on species performance and vitality have            events or high elevation mitigating drought impacts (see
been already reported and are expected to increase              also Rozas et al. 2015; Barbeta et al. 2019). In such situa-
(Lindner et al. 2010; Camarero et al. 2015). Even within        tions, plant-soil interactions, and the capacity of trees to
Spain, southern or low altitudinal forests of some species      compete within their neighbourhood may play an im-
such as Scots pine can be more vulnerable to drought            portant role in enhancing or limiting drought impacts
than forests located at higher elevations or latitudes in       (Leuschner 2020). Marqués et al. (2018) found that the
the rear edge (Marqués et al. 2016; Serra-Maluquer et al.       response of growth of Scots pine to drought in rear-edge
2019). These reasons make some Spanish forests a valu-          populations was modulated by stand density, pointing to
able proxy of drought impacts on European rear-edge             the impact of past forest management on recent growth
tree populations.                                               vulnerability, as has been found for other species
   Tree populations of species such as silver fir (Abies alba   (Camarero et al. 2011; Pérez-Luque et al. 2020). Rubio-
Mill.) present lower growth rates in some Pre-Pyrenean          Cuadrado et al. (2020) found competition due to the ces-
sites of northern Spain than in other wetter regions of         sation of traditional management as the main driver of
Central Europe (Gazol et al. 2015). Similarly, Scots Pine       growth in a rear edge, mixed broadleaved forest. These
(Pinus sylvestris L.) and European beech (Fagus sylvatica       variations between populations can be even more apparent
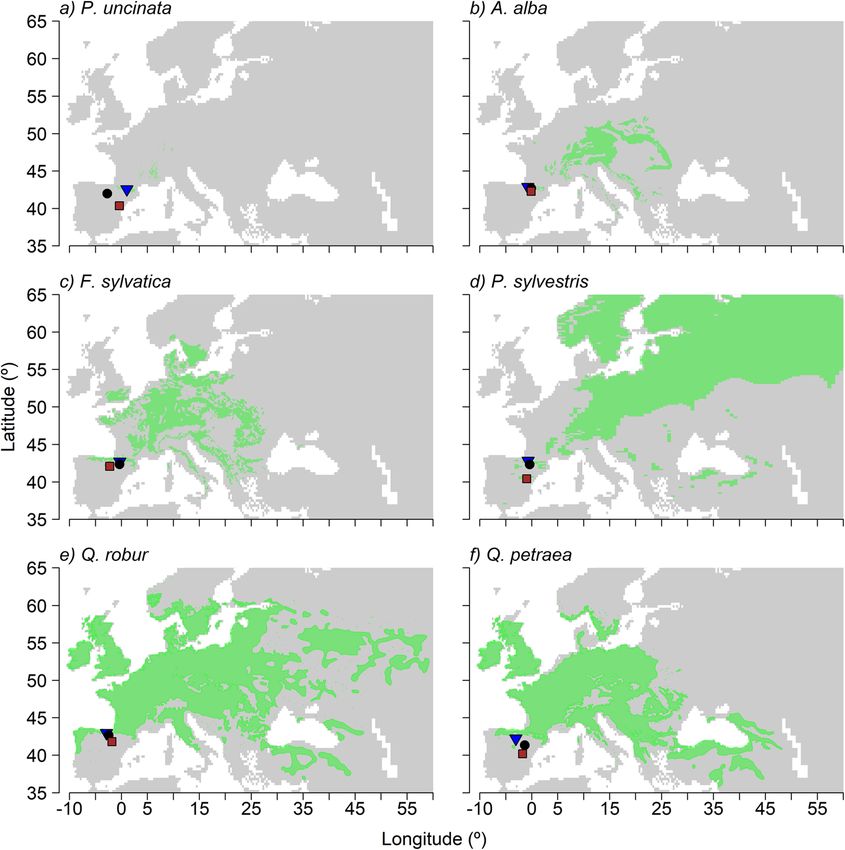
Camarero et al. Forest Ecosystems        (2021) 8:25                                                                                         Page 3 of 15

when different species are considered given the contrasted                        Here we tested the hypothesis that even within the rear
sensitivity to drought between drought-sensitive species                       edge those tree populations located in southern sites are
such as European beech and Scots pine or tolerant species                      subjected to drier conditions and thus display greater
such as pedunculate oak (Quercus robur L.) (Vitasse et al.                     growth vulnerability to drought than populations located in
2019). These results question the universal validity of the                    intermediate or northern sites. Alternatively, tree popula-
hypothesis of a greater vulnerability of tree growth to                        tions of a species in intermediate and northern sites have
drought near their rear edge (Vilà-Cabrera et al. 2019;                        not experienced an equally strong selection for drought re-
Muffler et al. 2020). Further, they indicate that regional                     sistance because they are less adapted to experience severe
studies over geographically and climatically contrasting                       drought than those towards the species’ moisture-limited
tree populations are required to decipher if rear-edge                         range margin. Therefore, one would expect southern, equa-
populations are the most vulnerable to drought across a                        torward populations would be less impacted by drought of
species distribution range. In this sense, it is expected                      a given severity than would be poleward populations. To
that if tree populations are climatically different or                         test these ideas, we selected six species widely distributed in
geographically distant, rear-edge populations will be                          Europe that found their rear-edge distribution limit in
consistently more constrained by drought events as                             Spain. The species were three gymnosperms (Pinus sylves-
they face harsher environmental conditions (Anderegg                           tris, Abies alba and Pinus uncinata Ram.) and three
and HilleRisLambers 2019). However, genetic adapta-                            angiosperms (Fagus sylvatica, Quercus robur and Quercus
tions can make rear-edge populations less vulnerable to                        petraea (Mattuschka) Liebl.) forming rear-edge populations
drought (Vilà-Cabrera et al. 2019).                                            in north-eastern Spain (Fig. 1). For each species in each site,

 Fig. 1 Distribution maps of the studied species across Europe. For each species (a, Pinus uncinata; b, Abies alba; c, Fagus sylvatica; d, Pinus
 sylvestris; e, Quercus robur; f, Quercus petraea) the green area represents the distribution of the species in Europe. The dots in the graph indicate
 the location of the northern (blue triangle), intermediate (black circle) and southern or rear-edge (red squares)
Camarero et al. Forest Ecosystems (2021) 8:25 Page 4 of 15
we used dendrochronology to reconstruct past radial- Germany). Cross-dating accuracy was checked by using
growth patterns by accurately dating tree-ring width re- the software COFECHA (Holmes 1983).
cords. We expected: (i) higher growth variability, and lower Mean growth series or chronologies were created for
mean growth, in southern as compared to intermediate and each site and species by detrending tree-ring width mea-
northern populations; (ii) stronger coupling between sures (Fritts 1976). Individual tree-ring width series were
growth variability and drought stress in southern popula- detrended using a cubic smoothing spline with a 50%
tions; and (iii) an increasing growth sensitivity to drought frequency response cut-off at 30 years (Cook and Peters
in southern populations during the last decades. 1981). The ring width index (RWI) for each series was
obtained by dividing the observed and fitted tree-ring
Methods width values. Pre-whitened RWI series were calculated
Studied sites and tree species by removing temporal autocorrelation using autoregres-
We studied six common European tree species (three sive models. The resulting standardized, pre-whitened
Pinaceae and three Fagaceae) widely distributed in individuals RWI series were averaged into mean site
Europe (Figs. 1 and S1) namely: P. uncinata, A. alba, P. chronologies for each species using bi-weight robust
sylvestris, F. sylvatica, Q. robur and Q. petraea. Moun- means.
tain pine (P. uncinata) is a species distributed in central To characterize the species’ chronologies of each site
and southwestern European mountains finding its south- for the common period 1950–2000 we calculated the
ern distribution limit in the Iberian System, eastern following tree-ring statistics: mean, standard deviation
Spain (Camarero et al. 1998). Silver fir (A. alba) is an and coefficient of variation (CV) of tree-ring width;
economically profitable species widely distributed in mean correlation between indexed, individual series (rbar);
central and southwestern Europe with rear-edge popula- and the Expressed Population Signal (EPS), a measure of
tions in north-eastern Spain mountains as the Pre- replication and internal coherence of each chronology
Pyrenees (Gazol et al. 2015). Scots pine (P. sylvestris) (Fritts 1976). The Dunnett’s modified Tukey-Kramer pair-
and European beech (F. sylvatica) also find their south- wise multiple comparison test (Dunnett 1980) was used to
western distribution limits in Spain where drought- compare tree-ring width of individuals between southern,
induced dieback has been reported for both species intermediate and northern populations for each species.
(Camarero et al. 2015, 2017). Pedunculate (Q. robur) and
sessile (Q. petraea) oaks are widely distributed from Climatic and distribution data
northern to southern Europe and they form pure or For each species, distribution maps were downloaded
mixed stands, where they can hybridize, in wet sites (e.g. from the EUFORGEN website (http://www.euforgen.org/
valley bottoms) or mountain sites of north-eastern Spain species/; de Vries et al. 2015) and they were completed
(Caudullo et al. 2017). using recent distribution data across Europe (Caudullo
et al. 2017). The European distribution maps of each
Field sampling and laboratory work species were compared with climate data to describe the
Three sites with contrasting climatic conditions, and climatic niche of each species. To this end, maps of
always including a drier rear-edge site, were selected for mean annual temperature (MAT) and mean annual pre-
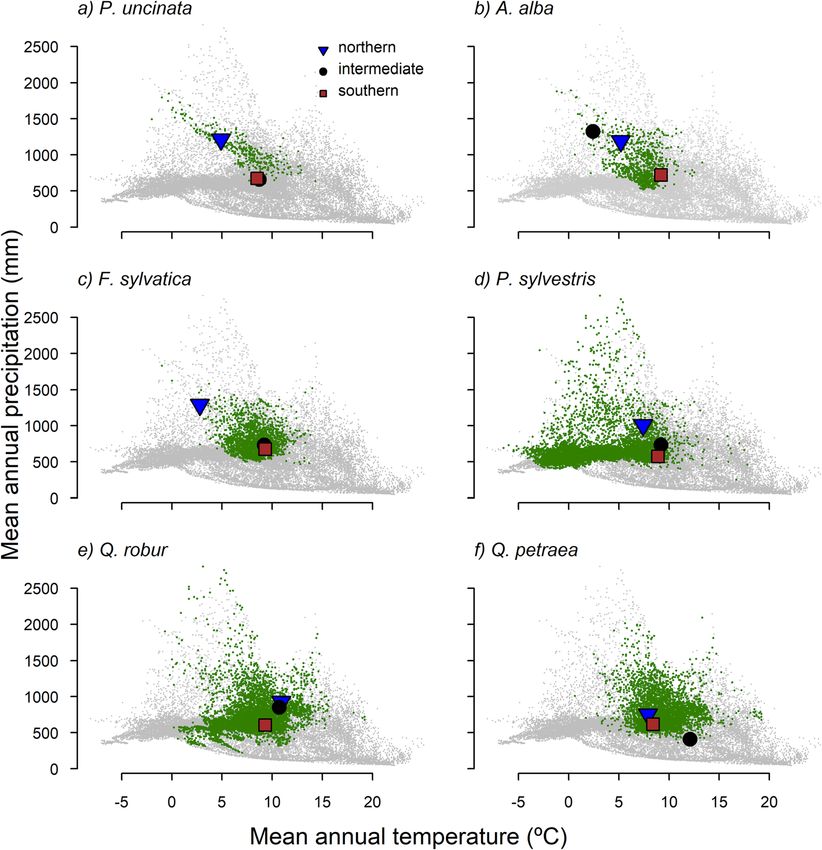
each species (Table 1; Figs. 1 and 2). In each species, the cipitation (MAP) were downloaded from the WorldClim
driest, rear-edge site presented lower precipitation than database (https://www.worldclim.org/; Fick and Hijmans
the other two sites (Figs. 2 and S2). We quantified radial 2017). These maps represent averages over the period
growth because this is a reliable proxy of tree vigour 1970–2000 and show global patterns in climate. Then,
changes in response to drought (Dobbertin 2005). We we plotted each site in a MAT vs. MAP graph consider-
sampled at least 15 dominant trees for each species and ing the European distribution area of the study species,
site. All sites form mixed stands excepting the pure i.e. between 12° W–60° E, and 32°–72° N (Fig. 2).
Betato and Poyales F. sylvatica sites, and the Tessó del To quantify climate-growth relationships, monthly
Son P. uncinata site situated near the alpine treeline. mean temperature and precipitation data from the E-
The diameter at breast height of each tree (Dbh) was OBS database v. 20.0e (Haylock et al. 2008) were down-
measured at 1.3 m using a metric tape. Two cores (see loaded at 2.5° resolution for the period 1950–2018 using
Table 1) were extracted per tree at 1.3 m using 5-mm the Climate Explorer webpage (https://climexp.knmi.nl/
increment borers, and perpendicular to the main stem start.cgi). To quantify drought impact, we used the Stan-
and the slope. Then, cores were air-dried, glued, and dardized Evapotranspiration Precipitation Index (SPEI;
polished using a series of sand-paper grits until tree-ring Vicente-Serrano et al. 2010). The SPEI is a multi-scalar
boundaries were clearly visible. These samples were visu- index that quantifies drought intensity based on the
ally cross-dated and measured to the nearest 0.01 mm difference between precipitation and the atmospheric
using a LINTAB measuring device (Rinntech, Heidelberg, evaporative demand for different periods, with negative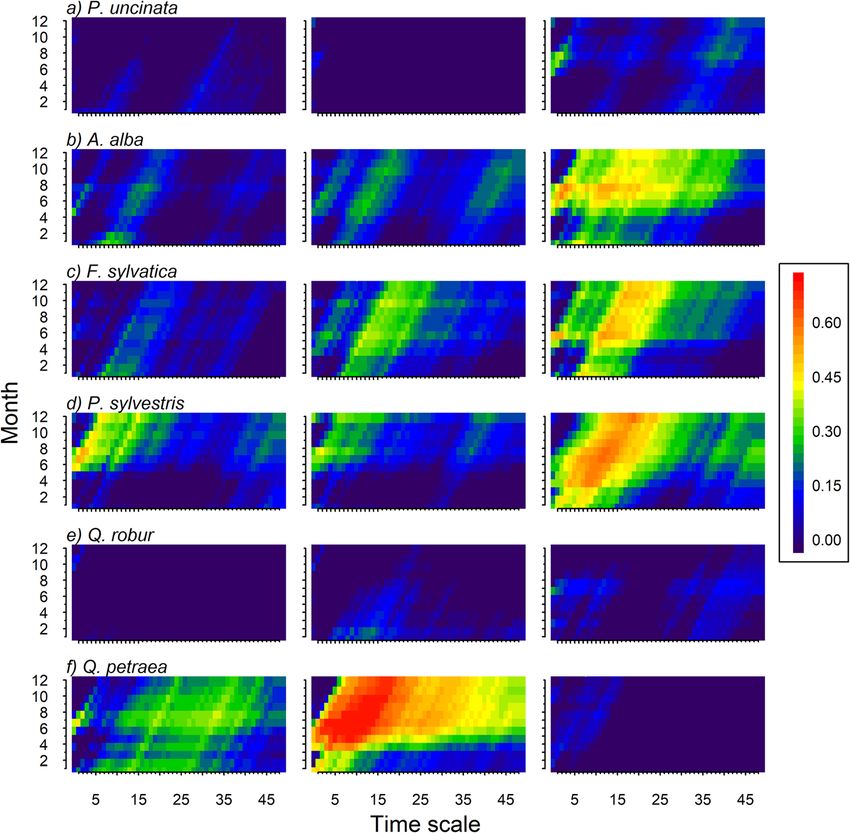
Table 1 Main characteristics of each site and mean tree-ring width (and standard deviation) and dendrochronological statistics for the period 1950–2000
                                                                                                                                                                                                                         Camarero et al. Forest Ecosystems

Species              Site name           Site type          Latitude (N)      Longitude        Elevation       Dbh (cm)       No. trees        Timespan        TRW (mm)         SD (mm)        CV       rbar      EPS
                                                                              (−W, +E)         (m a.s.l.)                     (No. radii)
Abies alba           Gamueta             Northern           42.88             −0.78            1400            58.4           22 (43)          1558–2018       1.43a            0.97           0.68     0.26      0.94
                     Bujaruelo           Intermediate       42.71             −0.13            1420            47.2           16 (32)          1882–2017       3.41b            1.63           0.48     0.29      0.89
                     Guara               Rear edge          42.30             −0.12            1428            39.0           19 (38)          1887–2011       3.59b            1.37           0.38     0.46      0.94
                                                                                                                                                                                                                           (2021) 8:25

Fagus sylvatica      Betato              Northern           42.71             −0.33            1841            38.9           15 (30)          1895–2017       2.03b            1.08           0.53     0.55      0.97
                     Monrepos            Intermediate       42.37             −0.37            1560            36.3           16 (32)          1877–2011       1.58b            0.94           0.59     0.36      0.95
                     Poyales             Rear edge          42.10             −2.25            1400            42.0           12 (24)          1785–2017       0.89a            0.49           0.55     0.46      0.95
Pinus sylvestris     Selva de Oza        Northern           42.83             −0.72            1272            47.0           15 (30)          1910–2017       1.52b            0.75           0.49     0.46      0.89
                     Monrepos            Intermediate       42.34             −0.40            1560            40.6           18 (36)          1860–2009       1.29b            0.73           0.57     0.45      0.95
                     Corbalán            Rear edge          40.43             −0.97            1300            38.4           28 (56)          1800–2014       0.67a            0.46           0.68     0.60      0.97
Pinus uncinata       Tessó del Son       Northern           42.58             1.03             2239            63.5           36 (71)          1537–2017       1.23a            0.88           0.72     0.36      0.94
                     Vinuesa             Intermediate       42.00             −2.73            2050            72.0           27 (54)          1559–2015       1.11a            0.80           0.72     0.33      0.95
                     Valdelinares        Rear edge          40.37             −0.39            1955            51.8           35 (68)          1730–2006       1.10a            0.82           0.75     0.37      0.97
Quercus petraea      Posadas             Northern           42.22             −3.06            1180            38.6           13 (25)          1881–2014       1.09a            0.56           0.52     0.42      0.95
                     Monsomero           Intermediate       41.35             −1.35            975             31.2           21 (41)          1935–2014       1.00a            0.67           0.67     0.54      0.98
                     Valdemeca           Rear edge          40.18             −1.77            1576            33.5           16 (30)          1922–2014       2.34b            0.93           0.40     0.35      0.93
Quercus robur        Beluntza            Northern           42.95             −2.89            462             49.5           17 (34)          1824–2017       1.21a            0.47           0.39     0.45      0.94
                     Izki                Intermediate       42.68             −2.48            760             48.6           34 (68)          1863–2008       1.63a            0.96           0.59     0.25      0.90
                     Moncayo             Rear edge          41.81             −1.83            1202            38.2           16 (32)          1885–2000       1.31a            0.65           0.50     0.31      0.88
Abbreviations: TRW Tree-ring width, SD Standard deviation, CV Coefficient of variation, rbar mean correlation between series, EPS Expressed population signal. The Dunnett multiple comparison test was used to
compare TRW between populations of the same species and significant differences (p < 0.05) are indicated by different letters
                                                                                                                                                                                                                            Page 5 of 15
Camarero et al. Forest Ecosystems       (2021) 8:25                                                                                      Page 6 of 15

 Fig. 2 Representation of each studied species in the climatic space (Worldclim data; Fick and Hijmans 2017) The green dots represent values of
 mean annual temperature and total precipitation where the species are present in Europe (a, Pinus uncinata; b, Abies alba; c, Fagus sylvatica; d,
 Pinus sylvestris; e, Quercus robur; f, Quercus petraea). Climate data was downloaded for the distribution of the species in Europe (http://www.
 euforgen.org/species/). Grey dots represent values of temperature and precipitation where the species are not found in Europe. The dots in the
 graph indicate the location of the tree populations of each species

values indicating water scarcity. We used 1–48 month                        between RWI and relevant climate variables (precipita-
SPEI timescales for the period 1962–2016 for the                            tion, temperature and July SPEI) and considering 30-
sampled forest sites from a high spatial resolution                         year moving windows. We used July SPEI as tree growth
gridded dataset for Spain based on quality controlled                       for many tree species in north-eastern Spain, where
and homogenised meteorological series (Vicente-Serrano                      most of our studied populations are located, have been
et al. 2017).                                                               found to respond to drought from June up to August
                                                                            (Pasho et al. 2011). Analyses were performed using the
Statistical analyses                                                        “dplR” (Bunn 2008), the “treeclim” (Zang and Biondi
The relationships between tree growth (RWI) and                             2015), and the “visreg” libraries (Breheny and Burchett
monthly mean temperature and precipitation (deviations                      2017) of the R statistical software (R Core Team 2020).
with respect to the mean temperature and precipitation
values at a site) were quantified for the best-replicated                   Results
period 1950–2006 using bootstrapped Pearson correla-                        The “climatic space” plot allowed to characterize the cli-
tions (Meko et al. 2011). These analyses were performed                     mate conditions of geographically southern populations
from September in the year before the tree-ring was                         from the other species sites (Fig. 2). This differentiation
formed to September of the year of tree-ring formation                      was clear in the case of A. alba, and less evident in P.
(hydrological year). Moving correlation functions were                      sylvestris, and Q. robur. In P. uncinata and F. sylvatica
applied to assess the dynamic nature of the relationships                   intermediate and southern sites shared similar annual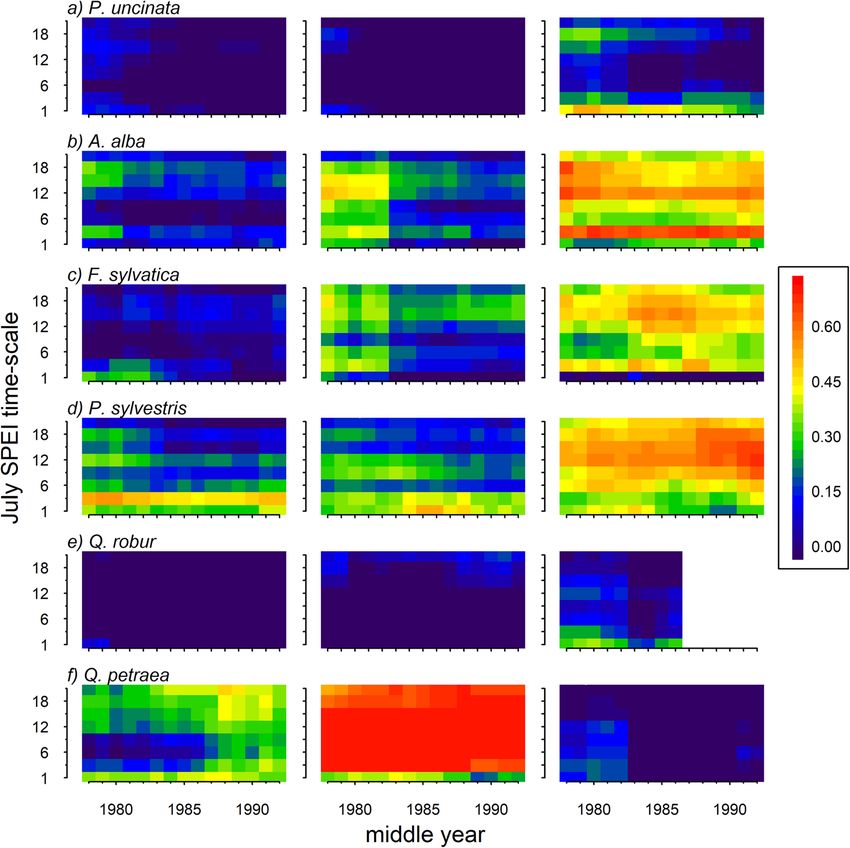
Camarero et al. Forest Ecosystems         (2021) 8:25                                                                                            Page 7 of 15

climatic conditions (Fig. S2). Lastly, in Q. petraea the                         (Table 1). This result contrasts with species such as P.
warmest and driest conditions (highest MAT and lowest                            sylvestris and A. alba that showed the highest rbar
MAP) were observed in the intermediate site, and not in                          values but either higher or lower growth variability in
the southern site.                                                               their respective southern sites.
   We found marked growth differences across populations                            The relationship between growth and climate displayed
for some species (Table 1). Lower growth rates in the                            different patterns between species and sites (Fig. 4). In the
southern sites were more evident for drought-sensitive spe-                      case of A. alba and Q. robur we found a greater depend-
cies such as F. sylvatica and P. sylvestris (Table 1; Fig. S3).                  ency of growth on summer precipitation in southern sites
Growth rates of A. alba individuals were higher in the                           than in the other two populations. In A. alba and P. sylves-
intermediate and southern sites than in the northern site,                       tris warmer summer temperatures negatively impacted
and the largest growth rates in the case of Q. petraea were                      tree growth in southern sites (Fig. 4). This negative correl-
found in the southern site (Table 1; Fig. S3). Growth                            ation was also observed in the northern P. sylvestris site,
variability varied considerably between species. Tree spe-                       and particularly in the intermediate Q. petraea site which
cies inhabiting cold and wet sites (A. alba, Q. robur), but                      depended on prior-winter and spring precipitation. This
not P. uncinata, displayed lower growth variability (Fig. 3                      dependency on the amount of rainfall received before or
and Table 1) than P. sylvestris and F. sylvatica. Q. petraea                     early in the growing season was also observed in southern
was the only exception in which growth variability was                           F. sylvatica and P. sylvestris sites. The growth of P. unci-
stronger in the central than in the rear-edge site (Fig. 3). In                  nata and A. alba in southern populations, and P. uncinata
this respect, the average correlation between series (rbar)                      and P. sylvestris in intermediate populations, was nega-
and the coefficient of variation in TRW were higher in                           tively related to temperature of September in the year
its intermediate site than in the other two populations                          prior to tree-ring formation. In the A. alba and F. sylvatica

 Fig. 3 Mean series of ring-width indices (RWI) of the six species (a, Pinus uncinata; b, Abies alba; c, Fagus sylvatica; d, Pinus sylvestris; e, Quercus
 robur; f, Quercus petraea) studied in the northern (blue), intermediate (black) and southern (brown) tree populations for the period 1950–2006
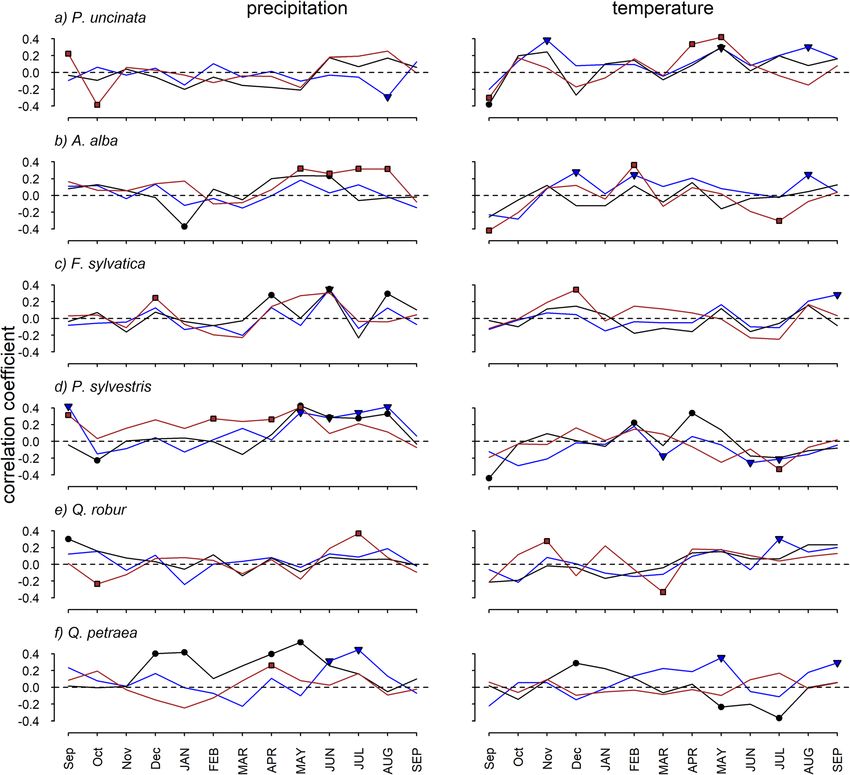
Camarero et al. Forest Ecosystems          (2021) 8:25                                                                                            Page 8 of 15

 Fig. 4 Correlations (Pearson coefficients) calculated between mean site series of ring-width indices and precipitation (left) and temperature (right)
 deviations. Dots indicate significant coefficients according to bootstrapping tests. Colours represent: northern (blue), intermediate (black), and southern
 (brown) populations of the six tree species (a, Pinus uncinata; b, Abies alba; c, Fagus sylvatica; d, Pinus sylvestris; e, Quercus robur; f, Quercus petraea)

southern populations, prior-winter temperatures were                                Unexpectedly, the strongest correlation between the
positively correlated with growth.                                                SPEI and growth was found for Q. petraea in the inter-
  For all species except Q. robur, the negative impact of                         mediate population (Fig. 6). According to our expecta-
summer temperatures on growth has increased over the                              tions, we found a stronger correlation between SPEI and
last decades (Figs. 5 and S4). This was evident at the                            growth in the southern than in the other two sites for
southern sites of some species (P. uncinata, A. alba, F.                          three out of the six species studied. This was the case of
sylvatica), whereas in others it was observed in all sites (P.                    the drought-sensitive species F. sylvatica and P. sylves-
sylvestris). In Q. petraea, growth decreased in response to                       tris, and A. alba. Differences between populations were
increasingly warmer summer conditions in the intermedi-                           less evident in Q. robur and P. uncinata. The temporal
ate site. The temporal evolution of the correlation be-                           evolution of the correlation between growth and SPEI
tween growth and precipitation was less clear, but spring                         showed that in the southern P. sylvestris population
precipitation gained importance in the intermediate sites                         there was a marked increase in the vulnerability of
of F. sylvatica, P. sylvestris and Q. petraea (Figs. 5 and S5).                   growth to long droughts (12- to 18-month SPEI values;
Camarero et al. Forest Ecosystems        (2021) 8:25                                                                                        Page 9 of 15

 Fig. 5 Moving window correlations calculated between mean site series of ring-width indices and monthly temperature (T.) and precipitation (P.)
 data from May to August. Moving correlations were obtained for 30-year intervals shifted by one year and the middle year of the interval is
 shown in x axes for each species (a, Pinus uncinata; b, Abies alba; c, Fagus sylvatica; d, Pinus sylvestris; e, Quercus robur; f, Quercus petraea). The
 colour scale (right side) shows the Pearson correlation coefficients

Figs. 7 and S6). In the rear-edge A. alba site, there was a                    increase in growing-season temperatures, and probably
persistence influence of short- and mid-term droughts                          evapotranspiration rates, over the past decades (Vicente-
on growth, and, again, this influence was more evident                         Serrano et al. 2015). Our findings evidence the drought
in the intermediate Q. petraea site.                                           vulnerability of tree species such as silver fir, European
                                                                               beech and Scots pine (see also Vitasse et al. 2019; Bose
Discussion                                                                     et al. 2020). There is a notable exception in the case of
We found that drought is a major factor limiting tree                          sessile oak, a drought-sensitive species (Aranda et al.
growth for most of the studied species and sites near the                      2000), whose growth is more impacted by drought in
rear edge of their distribution range. According to our                        intermediate than in southern populations, pointing to
expectations, drought-sensitivity increased towards the                        the importance of other ecological or local factors
equatorial border of the species distribution range for                        modulating tree growth sensitivity to drought (Cavin
most of the species studied. That is, populations located                      and Jump 2017). The intermediate and southern sites
in southern sites were in general more vulnerable to                           are separated by 120 km (Fig. S1) and the highest re-
drought than populations located in intermediate or                            sponsiveness to drought was observed in the climatic
northern sites. In accordance, growth sensitivity to                           limit or most xeric site (Monsomero). This site was also
drought varied markedly among tree populations within                          formerly exploited as a coppice forest about 60 years ago
each species (Fig. 6). For drought-sensitive species as                        (JJ Camarero, pers. observ.), which could have exacerbated
Scots pine, the results showed that tree growth is more                        its current sensitivity to drought due to competition
limited by drought in the southern site (Figs. 6 and 7).                       among stems of the same individual (Corcuera et al. 2006;
This negative impact has been exacerbated due to the                           Pérez-Luque et al. 2020). The case of Q. petraea shows
Camarero et al. Forest Ecosystems (2021) 8:25 Page 10 of 15 Fig. 6 Correlations between mean site series of ring-width indices and the SPEI drought index calculated at 1- to 48-month temporal resolution (x axes) and from January to December (y axes). Northern, intermediate and southern populations are represented for the six species (a, Pinus uncinata; b, Abies alba; c, Fagus sylvatica; d, Pinus sylvestris; e, Quercus robur; f, Quercus petraea). The colour scale shows the Pearson correlations that other ecological factors besides climate can constrain The six studied species are widely distributed in the growth responsiveness to drought and can modify Europe, excepting the mountain pine (P. uncinata), and latitudinal patterns of drought sensitivity. Recent studies find their southwestern distribution limit in Spain. have pointed out that discrepancies between micro and However, as occurs with the geographical and climatic macroclimate conditions, interactions between ecological extents of their distribution ranges (Figs. 1 and 2), the factors, species interactions and genetic adaptations can drought sensitivity of each species varies notably (Fig. 6). play an important role in driving growth response to In the mountain pine we found that its growth in the re- drought, despite biogeographical differences being import- gion is controlled by late-spring and early-summer tem- ant (Vilà-Cabrera et al. 2019). The lack of reliable infor- peratures (Fig. 4a), in line with previous studies (e.g., mation on local conditions only allows us to speculate on Camarero et al. 1998; Tardif et al. 2003), but we also the factors that make intermediate and northern popula- found a low drought susceptibility in the rear edge tions less vulnerable to drought than southern populations which could be explained by ontogenic or genetic differ- in some cases. Solving this question will require a more ences (Galván et al. 2014; González-Díaz et al. 2020). holistic approach to understand the interactions between This contrast with what was found for Scots pine, a geographical, ecological and historical factors. Overall, the widely distributed drought-sensitive species (Dorado- presented results enlighten that rear-edge populations are, Liñán et al. 2019; Bose et al. 2020). Despite growth posi- most of the times, reliable monitors of the long-term re- tively responded to summer precipitation and negatively sponse of drought-sensitive tree species to climate change to summer temperature in all studied Scots pine sites, and show that most tree populations are more vulnerable the response occurred earlier (in the case of temperature) to drought southwards. and was more intense in the southern site. In this site, an
Camarero et al. Forest Ecosystems        (2021) 8:25                                                                                        Page 11 of 15

 Fig. 7 Moving window correlations calculated by relating mean site series of ring-width indices and the July SPEI drought index at 1-, 3-, 6-, 9-,
 12-, 15-, 18-, and 21-month temporal resolutions (y axes). Moving correlations were obtained for 30-year intervals shifted by 1 year and the
 middle year of the interval is shown in x axes for each species (a, Pinus uncinata; b, Abies alba; c, Fagus sylvatica; d, Pinus sylvestris; e, Quercus
 robur; f, Quercus petraea). The colour scale shows the Pearson correlation coefficients

acute dieback episode started after the severe 2012                            droughts, which is corroborated in our study by the earl-
drought and resulted in the death of many Scots pine trees                     ier sensitivity of growth to precipitation and SPEI in the
(Camarero et al. 2015; Gazol et al. 2018). The significantly                   southern site (Figs. 4 and 6). It has been found that the
lower growth rates and the larger vulnerability of tree                        stomatal control over water loss and the leaf area /
populations to drought and warmer conditions in this re-                       sapwood area ratio change along gradients of dryness in
gion as compared to other populations, together with the                       Scots pine (Martínez-Vilalta et al. 2009), which can also
observed lack of recruitment of Scots pine, point towards                      explain the lower growth rates found in the southern
major compositional changes and the replacement of that                        site. The sensitivity of European beech to drought in-
species by more drought-tolerant oak and juniper species                       creased also notably in the southern site, but no clear
(Gazol et al. 2018).                                                           changes in temperature-growth couplings were found in
  Our results also highlighted the drought sensitivity of                      this species (Fig. 4). European beech presents large
European beech in line with previous research (Serra-                          geographical differences in drought-response across its
Maluquer et al. 2019; Vitasse et al. 2019; Wilmking et al.                     distribution area since southern populations are located
2020). Both, Scots pine and European beech have been                           in mountain areas, which allow mitigating Mediterranean
recognized as drought-sensitive species in terms of                            drought stress, and present local adaptations related to
growth loss (Dorado-Liñán et al. 2019) despite their                           leaf phenology (Peaucelle et al. 2019; Vilà-Cabrera et al.
marked differences in functional traits including stoma-                       2019; Wilmking et al. 2020; Leuschner 2020). However,
tal control in response to drought (Klein 2014). Scots                         we found that the growth rates were lower and the vulner-
pine is a species with a tight stomata regulation (Klein                       ability of European beech growth to drought was stronger
2014), and thus very vulnerable to early summer                                in the southern as compared to the other two populations
Camarero et al. Forest Ecosystems   (2021) 8:25                                                                  Page 12 of 15

(Fig. 6), suggesting that the tightest responses to drought         The response of pedunculate oak to drought contrasts
occur in the driest site (Fig. 2), and pointing to the import-   with the response of sessile oak (Q. petraea) that showed
ance of geographical differences in climate as drivers of        a marked reaction of growth to temperature, precipita-
European beech growth (Dorado-Liñán et al. 2019).                tion, and drought (Figs. 4, 5 and 6), particularly in the
   Special attention should be paid to silver fir, a species     intermediate site. Wet-warm prior winter and cool-wet
that has been found to be resistant and resilient to             spring-summer conditions improved its growth in the
spring droughts (Vitasse et al. 2019), but that has              drought-sensitive, intermediate site. This represents the
showed drought-induced dieback in some Spanish Pyr-              only example in which we found a greater vulnerability
enean populations over the last decades (e.g., Camarero          of tree growth to drought in a site different from the
et al. 2011; Gazol et al. 2015, 2020). The large difference      geographical rear edge (i.e., southernmost site). Previous
in growth rates found between the northern and the               studies have found that site-specific conditions can alter
other two populations can be explained by the mature-            broad biogeographical patterns resulting in mismatches
ness of the old-growth Gamueta site (Molina-Valero               between the geographical and the ecological rear edges
et al. 2021). Thus, site conditions modulated growth             for oak forests (Pérez-Luque et al. 2020). In this respect,
rates but not the vulnerability to drought, which in-            the rear-edge population (Valdemeca) is located at a
creased in the southern sites. Silver fir displayed larger       relatively high elevation (Table 1) which can milder cli-
sensitivity of tree growth to drought in the southern site,      mate conditions thus reducing negative drought impacts
in line with the observed vulnerability of the species to        (Herrero et al. 2013). Further, it is a mixed forest, com-
drought in the Pyrenees (Camarero et al. 2011). In cen-          posed of scattered stands with Scots pine, which could
tral Europe, silver fir is one of the most productive tree       reduce the evaporative demand of oak canopies thus
species (Vitasse et al. 2019). However, this contrasts with      modulating the sensitivity of trees to drought (Rubio-
the observed growth reductions and loss of vitality ob-          Cuadrado et al. 2020). In other words, altitudinal changes
served in some Pyrenean sites (Gazol et al. 2015). In this       decouple micro- from the macroclimate conditions thus
region, low-altitude forests are suffering exacerbated           modulating the vulnerability of tree growth to drought.
growth sensitivity to drought and warmer conditions in              Finally, the distributions of many tree species are out
comparison with other colder sites located at higher ele-        of equilibrium with climate at their range margins
vations. The prevalence of the species in rear-edge sites        (Talluto et al. 2007). The high longevity and limited dis-
is extremely contingent on sufficient precipitation during       persal ability of trees explain their extinction debts near
the summer months (Fig. 4), but also on the existence of         the warmer, equatorward margins of their distribution
a positive water balance in the year before tree-ring for-       ranges. Thus, rear-edge tree populations could persist
mation (Fig. 6) which depends on summer temperatures             under unsuitable climate conditions despite of increasing
(Vicente-Serrano et al. 2015). Over the last decades, the        climate-distribution disequilibrium (Svenning and Sandel
dependency of silver fir growth on summer temperature            2013). We show that tree-ring data are suitable monitors
has increased (Fig. 5) suggesting that the occurrence of         of rapid forest responses to climate and drought and could
hotter summers as a consequence of climate change may            complement other variables (e.g., recruitment and mortal-
negatively impact the species rear-edge (Sánchez-Salguero        ity rates). Since tree species rear edges are predicted to
et al. 2017). We cannot obviate the fact that Iberian popu-      experience contraction in response to climate warming
lations of silver fir are genetically differentiated from core   (Talluto et al. 2007), conservation and management
populations situated in Central Europe (Gazol et al. 2015).      strategies could use retrospective growth assessments to
   Pedunculate oak (Q. robur) showed no clear re-                quantify how trees respond to climate warming and in-
sponses to drought at the rear edge as it can be ex-             creasing drought stress. This would be a first step towards
pected for this drought-tolerant species (Vitasse et al.         accounting for lags between climate change, tree perform-
2019). Climate-growth correlations showed that                   ance and distribution shifts.
growth depended on wet conditions during the grow-
ing season, with a negative signal of March tempera-             Conclusions
tures in the southern site. This signal can be due to a          Our findings demonstrate that the growth of major
shift in the use of stored carbohydrates allowing an             European tree species is constrained by drought in the
earlier expenditure and reducing its availability to             rear edge, but genetic adaptations, ecological interactions
produce new leaves and earlywood vessels, thus de-               and discrepancies between micro- and macroclimate condi-
creasing hydraulic conductivity (Alla and Camarero               tions can alter the expected increase in aridity as we move
2012). The response of pedunculate oak growth to                 southwards. We studied representative Pinaceae and
precipitation during summer (Fig. 4) is in line with             Fagaceae species and found that they presented greater
the response of the species to drought in nearby sites           growth sensitivity to drought in southern than intermediate
(Rozas 2001; Granda et al. 2017).                                or northern sites within the rear edge. This was the case of
Camarero et al. Forest Ecosystems             (2021) 8:25                                                                                               Page 13 of 15

Scots pine, European beech and silver fir. Given the great                           b, Abies alba; c, Fagus sylvatica; d, Pinus sylvestris; e, Quercus robur; f, Quer-
sensitivity to drought of some of the tree species studied in                        cus petraea). The colour scale shows the significance (p < 0.05) of the
the rear-edge of their distribution and the expected increase                        Pearson correlation coefficients (red, significant positive values).
in aridity as climate keeps warming, monitoring and con-
serving such populations is a fundamental tool to under-                            Acknowledgements
                                                                                    We thank the logistical support of Government Aragón Forest Service and
stand their resilience capacity. Dendrochronology provides                          the help for tree sampling of Rubén Camarero Jiménez and David Cuesta
tools to identify vulnerable populations based on their                             Redondo at Poyales and Valdemeca sites, respectively.
long-term responsiveness to drought. However, deciphering
                                                                                    Authors’ contributions
whether increased drought responsiveness results in en-                             JJC designed the study and developed the main hypotheses, GSB, JJC, SMVS
hanced forest vulnerability, including increased dieback and                        collected and prepared the data, AG analyzed the data and drafted the
tree mortality rate, requires a more holistic approach. We                          manuscript. All authors commented preliminary versions of the manuscript
                                                                                    and contributed to improve the final version. The author(s) read and
combined dendrochronology with biogeography, but we                                 approved the final manuscript.
lacked reliable information on the historical and ecological
characteristics of each site allowing us to draw strong                             Funding
                                                                                    We acknowledge funding by project RTI2018–096884-B-C31 (Spanish Ministry
conclusions on why some intermediate or northern sites
                                                                                    of Science). G. S-B. is supported by a Spanish Ministry of Economy, Industry,
are equally or even more vulnerable to drought than their                           and Competitiveness Postdoctoral grant (FJCI 2016–30121; FEDER funds).
southern counterparts. Further studies will be improved by
a better characterization of each site in terms of local fea-                       Availability of data and materials
                                                                                    The datasets used and/or analysed during the current study are available
tures and potential genetic adaptations.                                            from the corresponding author on reasonable request.

                                                                                    Declarations
Supplementary Information
The online version contains supplementary material available at https://doi.        Ethics approval and consent to participate
org/10.1186/s40663-021-00303-1.                                                     Not applicable.

                                                                                    Consent for publication
 Additional file 1: Figure S1. Latitude of the studied sites showing                Not applicable.
 different symbols which correspond to poleward or northern (blue
 triangles), intermediate (black circles) and equatorward or southern (red
                                                                                    Competing interests
 squares) sites. Figure S2. Temperature and precipitation trends of the six
                                                                                    The authors declare that they have no competing interests.
 species (a, Pinus uncinata; b, Abies alba; c, Fagus sylvatica; d, Pinus
 sylvestris; e, Quercus robur; f, Quercus petraea) studied in the northern
                                                                                    Author details
 (blue lines and symbols), intermediate (black lines and symbols) and               1
                                                                                     Instituto Pirenaico de Ecología (IPE-CSIC), Avda. Montañana 1005, E-50192
 southern (brown lines and symbols) tree populations for the period
                                                                                    Zaragoza, Spain. 2EiFAB- iuFOR, University of Valladolid, Campus Duques de
 1950–2006. Figure S3. Mean tree-ring width series of the six species (a,
                                                                                    Soria, E-42004 Soria, Spain. 3NIBIO, Norwegian Institute of Bioeconomy
 Pinus uncinata; b, Abies alba; c, Fagus sylvatica; d, Pinus sylvestris; e, Quer-
                                                                                    Research, Postboks 155, NO-1431 Ås, Norway. 4Department of Biology, Wilfrid
 cus robur; f, Quercus petraea) studied in the northern (blue lines), inter-
                                                                                    Laurier University, N2L 3C5, 75 Univ. Avenue W, Waterloo, Ontario, Canada.
 mediate (black lines) and southern or rear-edge (brown lines) populations
 considering the period 1900–2018. Figure S4. Significance of the mov-
                                                                                    Received: 3 December 2020 Accepted: 26 March 2021
 ing window correlations calculated between mean site series of ring-
 width indices of north, intermediate and south tree populations and
 monthly temperature data from previous September to September in the
 year of tree-ring formation. Previous and current months are abbreviated           References
                                                                                    Alla AQ, Camarero JJ (2012) Contrasting responses of radial growth and wood
 by lower- and upper-case letters, respectively. Moving correlations were
 obtained for 30-year intervals shifted by one year and the middle year of               anatomy to climate in a Mediterranean ring-porous oak: implications for its
 the interval is shown in x axes for each species (a, Pinus uncinata; b, Abies           future persistence or why the variance matters more than the mean. Eur J
 alba; c, Fagus sylvatica; d, Pinus sylvestris; e, Quercus robur; f, Quercus pet-        For Res 131(5):1537–1550. https://doi.org/10.1007/s10342-012-0621-x
                                                                                    Allen CD, Macalady H, Chenchouni D, Bachelet N, Mcdowell M, Vennetier T,
 raea). The colour scale shows the significance (p < 0.05) of the Pearson
 correlation coefficients (blue, significant negative values; red, significant           Kitzberger T, Rigling A, Breshears DD, Hogg EH, Gonzalez P, Fensham R,
 positive values). Figure S5. Significance of the moving window correla-                 Zhang Z, Castro J, Demidova N, Lim J-H, Allard G, Running SW, Semercis S,
 tions calculated between mean site series of ring-width indices of north,               Cobb N (2010) A global overview of drought and heat induced tree
                                                                                         mortality reveals emerging climate change risks for forests. For Ecol Manag
 intermediate and south tree populations and monthly precipitation data
 from previous September to September in the year of tree-ring forma-                    259(4):660–684. https://doi.org/10.1016/j.foreco.2009.09.001
 tion. Moving correlations were obtained for 30-year intervals shifted by           Anderegg LDL, HilleRisLambers J (2016) Drought stress limits the geographic
 one year and the middle year of the interval is shown in x axes for each                ranges of two tree species via different physiological mechanisms. Glob Ch
                                                                                         Biol 22(3):1029–1045. https://doi.org/10.1111/gcb.13148
 species (a, Pinus uncinata; b, Abies alba; c, Fagus sylvatica; d, Pinus sylves-
 tris; e, Quercus robur; f, Quercus petraea). The colour scale shows the sig-       Anderegg LDL, HilleRisLambers J (2019) Local range boundaries vs. large-scale
 nificance (p < 0.05) of the Pearson correlation coefficients (blue,                     trade-offs: climatic and competitive constraints on tree growth. Ecol Lett
 significant negative values; red, significant positive values). Figure S6.              22(5):787–796. https://doi.org/10.1111/ele.13236
                                                                                    Anderegg WRL, Anderegg LDL, Kerr KL, Trugman AT (2019) Widespread drought-
 Significance of the moving window correlations calculated between
 mean site series of ring-width indices of north, intermediate and south                 induced tree mortality at dry range edges indicates that climate stress
 tree populations and the June SPEI drought index at 1-, 3-, 6-, 9-, 12-, 15-,           exceeds species’ compensating mechanisms. Glob Ch Biol 25(11):3793–3802.
 18-, and 21-month temporal resolutions (y axes). Moving correlations                    https://doi.org/10.1111/gcb.14771
                                                                                    Anderegg WRL, Kane JM, Anderegg LDL (2013) Consequences of widespread
 were obtained for 30-year intervals shifted by one year and the middle
 year of the interval is shown in x axes for each species (a, Pinus uncinata;            tree mortality triggered by drought and temperature stress. Nat Clim Ch 3(1):
                                                                                         30–36. https://doi.org/10.1038/nclimate1635
Camarero et al. Forest Ecosystems (2021) 8:25 Page 14 of 15
Anderegg WRL, Schwalm C, Biondi F, Camarero JJ, Koch G, Litvak M, Ogle K, Geographical adaptation prevails over species-specific determinism in trees’
Shaw JD, Shevliakova E, Williams AP, Wolf A, Ziaco E, Pacala S (2015) vulnerability to climate change at Mediterranean rear-edge forests. Glob Ch Biol
Pervasive drought legacies in forest ecosystems and their implications for 25(4):1296–1314. https://doi.org/10.1111/gcb.14544
carbon cycle models. Science 349(6247):528–532. https://doi.org/10.1126/ Dunnett CW (1980) Pairwise multiple comparisons in the unequal variance case. J
science.aab1833 Am Stat Assoc 75(372):796–800. https://doi.org/10.1080/01621459.1980.104
Aranda I, Gil L, Pardos JA (2000) Water relations and gas exchange in Fagus 77552
sylvatica L. and Quercus petraea (Mattuschka) Liebl. In a mixed stand at their Fick SE, Hijmans RJ (2017) WorldClim 2: new 1-km spatial resolution climate
southern limit of distribution in Europe. Trees Struct Funct 14(6):344–352. surfaces for global land areas. Int J Climatol 37(12):4302–4315. https://doi.
https://doi.org/10.1007/s004680050229 org/10.1002/joc.5086
Babst F, Bouriaud O, Poulter B, Trouet V, Girardin MP, Frank DC (2019) Twentieth Fritts HC (1976) Tree rings and climate. Academic Press, London
century redistribution in climatic drivers of global tree growth. Sci Adv 5: Galván D, Camarero JJ, Gutiérrez E (2014) Seeing the trees for the forest: drivers
eaat4313 of individual growth responses to climate in Pinus uncinata mountain forests.
Barbeta A, Camarero JJ, Sangüesa-Barreda G, Muffler L, Peñuelas J (2019) J Ecol 102(5):1244–1257. https://doi.org/10.1111/1365-2745.12268
Contrasting effects of fog frequency on the radial growth of two tree species Gazol A, Camarero JJ, Gutiérrez E, Popa I, Andreu-Hayles L, Motta R, Nola P, Ribas
in a Mediterranean-temperate ecotone. Agric For Meteorol 264:297–308. M, Sangüesa-Barreda G, Urbinati C, Carrer M (2015) Distinct effects of climate
https://doi.org/10.1016/j.agrformet.2018.10.020 warming on populations of silver fir (Abies alba) across Europe. J Bioegogr
Bose AK, Gessler A, Bolte A, Bottero A, Buras A, Cailleret M, Camarero JJ, Haeni M, 42(6):1150–1162. https://doi.org/10.1111/jbi.12512
Hereş A-M, Hevia A, Lévesque M, Linares JC, Martinez-Vilalta J, Matías L, Gazol A, Camarero JJ, Sangüesa-Barreda G, Vicente-Serrano SM (2018) Post-
Menzel A, Sánchez-Salguero R, Saurer M, Vennetier M, Ziche D, Rigling A drought resilience after forest die-off: shifts in regeneration, composition,
(2020) Growth and resilience responses of scots pine to extreme droughts growth and productivity. Front Plant Sci 9:1546. https://doi.org/10.3389/fpls.2
across Europe depend on pre-drought growth conditions. Glob Ch Biol 26(8): 018.01546
4521–4537. https://doi.org/10.1111/gcb.15153 Gazol A, Sangüesa-Barreda G, Camarero JJ (2020) Forecasting forest vulnerability
Breheny P, Burchett W (2017) Visualization of regression models using visreg. The to drought in Pyrenean silver fir forests showing dieback. Front For Glob Ch
R J 9(2):56–71. https://doi.org/10.32614/RJ-2017-046 3:1–13
Bunn AG (2008) A dendrochronology program library in R (dplR). González-Díaz P, Gazol A, Valbuena-Carabaña M, Sangüesa-Barreda G, Moreno
Dendrochronologia 26(2):115–124. https://doi.org/10.1016/j.dendro.2008. Urbano A, Zavala MA, Camarero JJ (2020) Remaking a stand: links between
01.002 genetic diversity and tree growth in expanding mountain pine populations.
Camarero JJ, Bigler C, Linares JC, Gil-Pelegrín E (2011) Synergistic effects of past For Ecol Manag 472:118244. https://doi.org/10.1016/j.foreco.2020.118244
historical logging and drought on the decline of Pyrenean silver fir forests. Granda E, Alla AQ, Laskurain NA, Loidi J, Sánchez-Lorenzo A, Camarero JJ (2017)
For Ecol Manag 262(5):759–769. https://doi.org/10.1016/j.foreco.2011.05.009 Coexisting oak species, including rear-edge populations, buffer climate stress
Camarero JJ, Gazol A, Sangüesa-Barreda G, Oliva J, Vicente-Serrano SM (2015) To through xylem adjustments. Tree Physiol 38:159–172
die or not to die: early-warning signals of dieback in response to a severe Hampe A (2004) Bioclimate envelope models: what they detect and what they
drought. J Ecol 103(1):44–57. https://doi.org/10.1111/1365-2745.12295 hide. Glob Ecol Biogeogr 13(5):469–471. https://doi.org/10.1111/j.1466-822X.2
Camarero JJ, Guerrero-Campo J, Gutiérrez E (1998) Tree-ring growth and 004.00090.x
structure of Pinus uncinata and Pinus sylvestris in the central Spanish Hartmann H, Moura CF, Anderegg WRL, Ruehr NK, Salmon Y, Allen CD, Arndt SK,
Pyrenees. Arct Antarct Alp Res 30(1):1–10. https://doi.org/10.2307/1551739 Breshears DD, Davi H, Galbraith D, Ruthrof KX, Wunder J, Adams HD,
Camarero JJ, Linares JC, Sangüesa-Barreda G, Sánchez-Salguero R, Gazol A, Bloemen J, Cailleret M, Cobb R, Gessler A, Grams TEE, Jansen S, Kautz S,
Navarro-Cerrillo RM, Carreira JA (2017) The multiple causes of forest decline Lloret F, O’Brien M (2018) Research frontiers for improving our understanding
in Spain: drought, historical logging, competition and biotic stressors. In: of drought-induced tree and forest mortality. New Phytol 218(1):15–28.
Amoroso M, Daniels L, Baker P, Camarero JJ (eds) Dendroecology. Springer, https://doi.org/10.1111/nph.15048
New York, pp 307–323. https://doi.org/10.1007/978-3-319-61669-8_13 Haylock MR, Hofstra N, Klein Tank AMG, Klok EJ, Jones PD, New M (2008) A
Caudullo G, Welk E, San-Miguel-Ayanz J (2017) Chorological maps for the main European daily high-resolution gridded dataset of surface temperature and
European woody species. Data Brief 12:662–666. https://doi.org/10.1016/j. precipitation. J Geophys Res-Atmos 113(D20):D20119. https://doi.org/10.102
dib.2017.05.007 9/2008JD010201
Cavin L, Jump AS (2017) Highest drought sensitivity and lowest resistance to Herrero A, Rigling A, Zamora R (2013) Varying climate sensitivity at the dry
growth suppression are found in the range core of the tree Fagus sylvatica L. distribution edge of Pinus sylvestris and P. nigra. For Ecol Manag 308:50–61.
not the equatorial range edge. Glob Ch Biol 23(1):362–379. https://doi.org/1 https://doi.org/10.1016/j.foreco.2013.07.034
0.1111/gcb.13366 Holmes R (1983) Computer-assisted quality control in tree-ring dating and
Choat B, Brodribb TJ, Brodersen CR, Duursma RA, López R, Medlyn BE (2018) measurement. Tree-Ring Bull 43:69–78
Triggers of tree mortality under drought. Nature 558(7711):531–539. https:// Jump AS, Ruiz-Benito P, Greenwood S, Allen CD, Kitzberger T, Fensham R,
doi.org/10.1038/s41586-018-0240-x Martínez-Vilalta J, Lloret F (2017) Structural overshoot of tree growth with
Cook ER, Peters K (1981) The smoothing spline: a new approach to standardizing climate variability and the global spectrum of drought-induced forest
forest interior tree-ring width series for dendroclimatic studies. Tree-Ring Bull dieback. Glob Ch Biol 23(9):3742–3757. https://doi.org/10.1111/gcb.13636
41:45–53 Klein T (2014) The variability of stomatal sensitivity to leaf water potential across
Corcuera L, Camarero JJ, Sisó S, Gil-Pelegrín E (2006) Radial-growth and wood- tree species indicates a continuum between isohydric and anisohydric
anatomical changes in overaged Quercus pyrenaica coppice stands: behaviours. Funct Ecol 28(6):1313–1320. https://doi.org/10.1111/1365-243
functional responses in a new Mediterranean landscape. Trees Struct Funct 5.12289
20(1):91–98. https://doi.org/10.1007/s00468-005-0016-4 Leuschner C (2020) Drought response of European beech (Fagus sylvatica L.) – a
Core Team R (2020) R: a language and environment for statistical computing. R review. Persp Plant Ecol Evol Syst 47:125576
Foundation for Statistical Computing, Vienna Lindner M, Maroschek M, Netherer S, Kremer A, Barbati A, Garcia-Gonzalo J,
de Vries SMG, Alan M, Bozzano M, Burianek V, Collin E, Cottrell J, Ivankovic M, Marchetti M (2010) Climate change impacts, adaptive capacity, and
Kelleher C, Koskela J, Rotach P, Vietto L, Yrjänä L (2015) Pan-European vulnerability of European forest ecosystems. For Ecol Manag 259(4):698–709.
strategy for genetic conservation of forest trees and establishment of a core https://doi.org/10.1016/j.foreco.2009.09.023
network of dynamic conservation units. European Forest Genetic Resources Marqués L, Camarero JJ, Gazol A, Zavala MA (2016) Drought impacts on tree
Programme (EUFORGEN), Bioversity International, Rome growth of two pine species along an altitudinal gradient and their use as
Dobbertin M (2005) Tree growth as indicator of tree vitality and of tree reaction early-warning signals of potential shifts in tree species distributions. For Ecol
to environmental stress: a review. Eur J For Res 124(4):319–333. https://doi. Manag 381:157–167. https://doi.org/10.1016/j.foreco.2016.09.021
org/10.1007/s10342-005-0085-3 Marqués L, Madrigal-González J, Zavala MA, Camarero JJ, Hartig F (2018) Last-
Dorado-Liñán I, Piovesan G, Martínez-Sancho E, Gea-Izquierdo G, Zang C, Cañellas I, century forest productivity in a managed dry-edge scots pine population:
Castagneri D, Di Filippo A, Gutiérrez E, Ewald J, Fernández-de-Uña L, Hornstein the two sides of climate warming. Ecol Appl 28(1):95–105. https://doi.org/1
D, Jantsch MC, Levanič T, Mellert KH, Vacchiano G, Zlatanov T, Menzel A (2019) 0.1002/eap.1631You can also read