Revisiting the tsunamigenic volcanic flank collapse of Fogo Island in the Cape Verdes, offshore West Africa
←
→
Page content transcription
If your browser does not render page correctly, please read the page content below
Downloaded from http://sp.lyellcollection.org/ by guest on December 14, 2021

Revisiting the tsunamigenic volcanic flank collapse of Fogo
Island in the Cape Verdes, offshore West Africa
Rachel Barrett1*, Elodie Lebas1, Ricardo Ramalho2,3,4,5, Ingo Klaucke6,
Steffen Kutterolf6, Andreas Klügel7, Katja Lindhorst1, Felix Gross1,8 and
Sebastian Krastel1
1
  Institute of Geosciences, Christian-Albrechts-University, 24118 Kiel, Germany
2
  Instituto Dom Luiz, Faculdade de Ciências da Universidade de Lisboa, 1749-016 Lisbon,
  Portugal
3
  Departamento de Geologia, Faculdade de Ciências da Universidade de Lisboa, 1749-016
  Lisbon, Portugal
4
  School of Earth Sciences, University of Bristol, Bristol BS8 1RL, UK
5
  Lamont-Doherty Earth Observatory of Columbia University, New York, NY 10964, USA
6
  GEOMAR Helmholtz Centre for Ocean Research Kiel, 24148 Kiel, Germany
7
  Department of Geosciences, University of Bremen, 28359 Bremen, Germany
8
  Center for Ocean and Society, Kiel Marine Science, Christian-Albrechts-University,
  24118 Kiel, Germany
    RB, 0000-0001-6463-4473; EL, 0000-0003-1617-143X; RR, 0000-0002-2338-5535;
SKu, 0000-0002-0645-3399; AK, 0000-0002-5136-4774; FG, 0000-0002-0749-829X;
SKr, 0000-0002-5899-9748
*Correspondence: rachel.barrett@ifg.uni-kiel.de

Abstract: Volcanic archipelagos are a source of numerous on- and offshore geohazards, including explosive
eruptions and potentially tsunamigenic large-scale flank collapses. Fogo Island in the southern Cape Verdes is
one of the most active volcanoes in the world, making it both prone to collapse (as evidenced by the c. 73 ka
Monte Amarelo volcanic flank collapse), and a source of widely distributed tephra and volcanic material. The
offshore distribution of the Monte Amarelo debris avalanche deposits and the surrounding volcaniclastic apron
were previously mapped using only medium-resolution bathymetric data. Here, using recently acquired, higher-
resolution acoustic data, we revisit Fogo’s flank collapse and find evidence suggesting that the deposition of
hummocky volcanic debris originating from the failed eastern flank most likely triggered the contemporaneous,
multi-phase failure of pre-existing seafloor sediments. Additionally, we identify, for the first time, multiple
mass-transport deposits in the southern part of the volcaniclastic apron of Fogo and Santiago based on the pres-
ence of acoustically chaotic deposits in parametric echo sounder data and volcaniclastic turbiditic sands in
recovered cores. These preliminary findings indicate a long and complex history of instability on the southern
slopes of Fogo and suggest that Fogo may have experienced multiple flank collapses.

Volcanic archipelagos are home to numerous on-                 Siebert 1984; Begét and Kienle 1992; McGuire
and offshore hazards such as changes in sea-level,             1996, 2003; Murray and Voight 1996; Tibaldi
storms, volcanic eruptions, slope instabilities, large         2001; Cervelli et al. 2002; Casalbore et al. 2011,
flank collapses and tsunamis (Casalbore 2018).                  2015; Gross et al. 2014; Clare et al. 2018). Such fac-
These events can have devastating consequences for             tors occur over timescales ranging from seconds to
people, nature and infrastructure, both onshore and            thousands of years and are globally widespread
offshore. A variety of internal and external factors can       (McGuire 1996; Blahůt et al. 2019).
precondition and trigger flank instabilities. These                 The volume of volcanic flank collapses varies
include: dyke and sill intrusions; volcanic eruptions          significantly, but can be as large as thousands of
and tremor; earthquakes; flank over-steepening; the             cubic kilometres, for example, in the Hawaiian archi-
weight of new volcanic material on the island flanks;           pelago (Moore et al. 1989). Many such events have
weakening of the volcanic edifice by weathering and             volumes in the order of tens to hundreds of cubic
hydrothermal activity and, for smaller landslides, by          kilometres, for example at Nisyros Volcano in the
the effects of wave, wind and storm activity (e.g.             Aegean Sea (Tibaldi et al. 2008; Livanos et al.

From: Georgiopoulou, A., Amy, L. A., Benetti, S., Chaytor, J. D., Clare, M. A., Gamboa, D., Haughton, P. D. W.,
Moernaut, J. and Mountjoy, J. J. (eds) 2020. Subaqueous Mass Movements and their Consequences: Advances in Process
Understanding, Monitoring and Hazard Assessments. Geological Society, London, Special Publications, 500, 13–26.
First published online March 13, 2020, https://doi.org/10.1144/SP500-2019-187
© 2020 The Author(s). This is an Open Access article distributed under the terms of the Creative Commons Attribution
License (http://creativecommons.org/licenses/by/4.0/). Published by The Geological Society of London.
Publishing disclaimer: www.geolsoc.org.uk/pub_ethics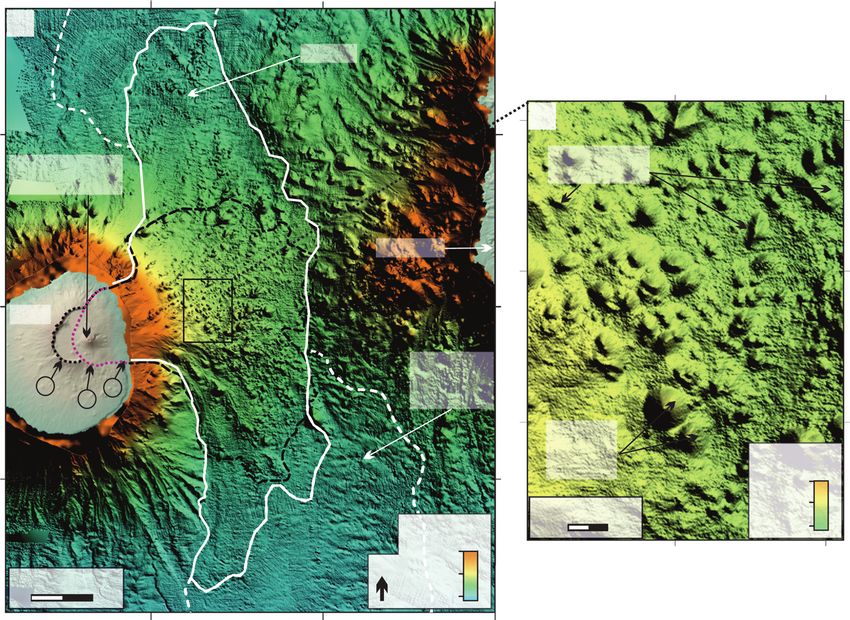
Downloaded from http://sp.lyellcollection.org/ by guest on December 14, 2021

14                                                                   R. Barrett et al.

2013), in the Lesser Antilles Arc (Lebas et al. 2011;                                  2019) and on active offshore margins (e.g. Harders
Le Friant et al. 2015; Brunet et al. 2016), in the                                     et al. 2010; Lafuerza et al. 2014; Hornbach et al.
Canary Islands (Krastel et al. 2001; Masson et al.                                     2015; Kuhlmann et al. 2016; Sammartini et al.
2002; León et al. 2017) and in the Cape Verde                                          2018) have indicated a relationship between tephra
Islands (Masson et al. 2008). However, even com-                                       layers or turbidites and slide failure planes. Although
paratively small-volume volcanic flank collapses,                                       the exact nature of this relationship is disputed
such as the 0.22–0.3 km3 Anak Krakatau flank col-                                       (Wiemer and Kopf 2016), it is thought that tephra
lapse in December 2018 (Grilli et al. 2019), may                                       could behave as ‘weak layers’ – layers of inherently
result in catastrophic tsunamis. The hazard potential                                  lower strength than adjacent layers, which are
of such flank collapses is widely recognized, but                                       thereby prone to failure (Locat et al. 2014). Using
the magnitude, and therefore hazard potential, of                                      core logging, sedimentological and geotechnical
the tsunamis that can be triggered by flank collapses                                   data from the IODP Expedition 340, Lafuerza et al.
is heavily debated (e.g. Moore and Moore 1984;                                         (2014) showed that low hydraulic conductivity of
McMurtry et al. 2004; Watt et al. 2012a; Goff                                          hemipelagic sediments offshore Martinique (Lesser
et al. 2014; Ramalho et al. 2015; Paris et al. 2018).                                  Antilles) could cause low rates of dewatering in tur-
    Other factors that can contribute to the instability                               bidites and tephra layers, allowing excess pore fluid
of slopes offshore are the deposition of centimetre-                                   pressures to persist at depth. Moreover, Hornbach
to decimetre-thick discrete layers of volcanic ash                                     et al. (2015) suggested that even small changes in
across a wide region and the presence of buried tur-                                   the stress regime of these layers, such as that result-
bidites in the volcanic apron. Studies in lacustrine                                   ing from regional strain and grain reorganization
settings (e.g. Wiemer et al. 2015; Moernaut et al.                                     during the compaction of sediments, might trigger

                  25°W                   24°W                       23°W                                   25°W                            24°W
                          Santo Antão
        (b)                 São Vicente
                                                                                        N
                                                                                                            (c)                                                   N
                                                                                 Sal
                                      São Nicolau
                                                                                                    16°N

                                                                            Boa
16°N

                                                                            Vista
                                                                                                    15°N

                                                                      Maio
                  Brava       Fogo
                                                    Sa
                                                     nt
15°N

                                                     ia
                                                       go

                                                                                                                                 20
                                                                                                                            19
                                                                                                                                                          38
                                                                                                    14°N

                                                                                                                                 18
                                                                                                                                                          13
                                                                                                                                                           12
        (a)
                                                                                                                                      41
                                                                                 0
                                                                                        Depth [m]
 30°N

                                                                             2000                                                                         14
         Cape                                                   Shader
                                                                                                             Legend
        Verdes       Africa                                     Direction   4000
                                                                                                                  M155 Gravity core                   8
                                                                 45°         5800
                                                                                                    13°N

                                                                                                                                              7
              b                                                                                                   M155 Gravity core
 10°N

                                                                  Distance [km]                              x
                                                                                                                  shown here                          Distance [km]
                                                            0               50         100                        M155 Parasound profile          0                   50
          20°W           0°

Fig. 1. (a) Location of the Cape Verdes offshore West Africa. Box outlines the region presented in (b).
(b) Multibeam bathymetric data collected during R/V Meteor cruises M155 and M80/3 overlain on GEBCO2019
(British Oceanographic Data Centre, http://www.gebco.net) bathymetry of the southern Cape Verdean archipelago.
Black lines show the locations of Parasound profiles collected during cruise M155. (c) Location of the newly acquired
Parasound data and of the gravity cores collected during cruise M155.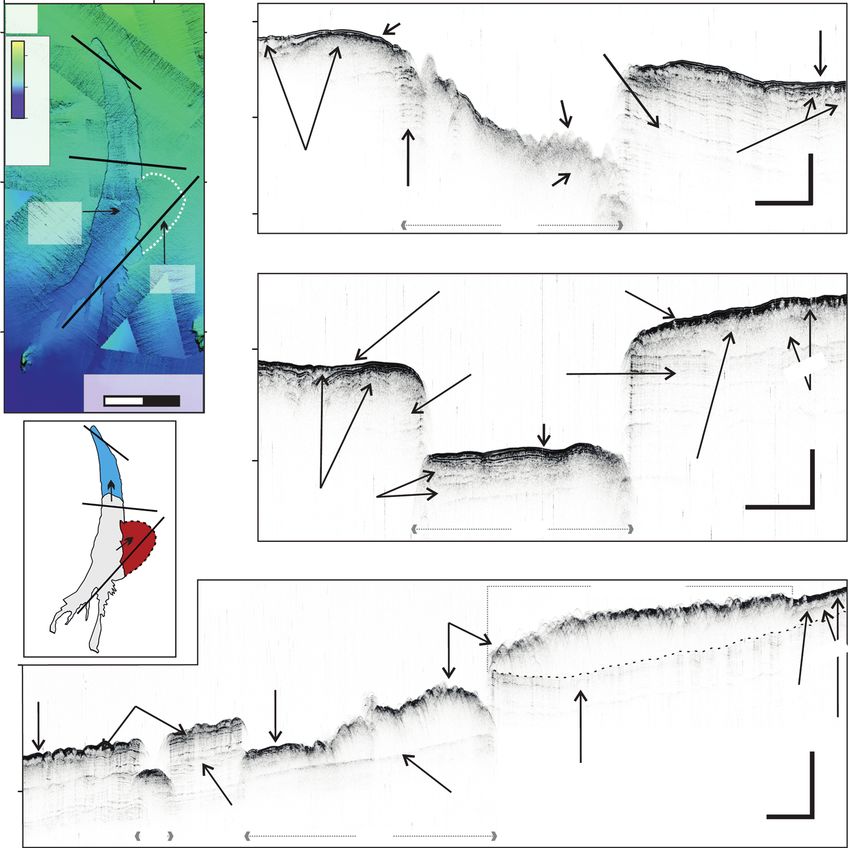
Downloaded from http://sp.lyellcollection.org/ by guest on December 14, 2021

                                    The volcanic flank collapse of Fogo (Cape Verdes)                                 15

motion. Effectively, results from IODP 340 showed             different, recording frequent volcano-tectonic earth-
that sand layers (i.e. tephra ash and turbidites), as         quakes (Grevemeyer et al. 2010; Faria and Fonseca
well as boundaries between sand and mud layers,               2014; Vales et al. 2014). Sediment cores collected
may act as multiple decollement surfaces that pro-            in the region provide evidence of at least 43 large,
mote and enhance the mobility of landslide deposits           explosive eruptions in the area in the last 150 kyr
(Le Friant et al. 2015).                                      (Eisele et al. 2015), attesting to Fogo’s vigorous
                                                              volcanic activity. Such frequent volcanic activity,
Geological setting                                            along with the accumulation of volcanic deposits
                                                              on the submarine flanks, means that Fogo’s flanks
The Cape Verdes archipelago, offshore West Africa             are potentially unstable and prone to collapsing.
(Fig. 1), is the surface expression of a mantle hotspot           A semi-circular depression (Borderia), up to 1 km
(Crough 1978; Holm et al. 2008; Ramalho et al.                high and open to the east on central Fogo, was inter-
2010). The Island of Fogo, in the southern part of            preted by Day et al. (1999) as the scar of a large flank
the archipelago, is one of the most active oceanic            collapse, referred to as ‘Monte Amarelo’ (Fig. 2).
intraplate volcanoes in the world, having erupted             Other authors, however, interpret the same morphol-
28 times in the last 520 years (Ribeiro 1960; Torres          ogy as two partially overlapping volcanic calderas
et al. 1997; González et al. 2015). Such volcanically         that were later cut by a flank collapse that affected
active areas are well known to be associated with             the eastern portion of the edifice (Brum da Silveira
seismicity and the southern Cape Verdes are no                et al. 1997; Torres et al. 1997; Madeira et al. 2008;

                         24.25° W                                23.75° W
           (a)
                                             MTD-A
                                                                                            24°10’ W    24°08’ W

                                                                                                                   15°02’ N
15.25° N

                                                                            (b)

                                                                              Slide blocks
            Pico do Fogo
                                                                              (hummocks)
           (2829 m a.s.l.)

                                                      Santiago

           Fogo

                                                           MTD-A/B
                 2       1                                transitional
                     3
                                                                                                                   14°58’ N

                                                             zone
                                                                              Probable
                                                                              volcanic
14.75° N

                                                                                                       Depth [m]
                                                                               cones
                                                                                                        1000
                                                                            Distance [km]               2000
                                                          Depth [m]           0       1                3000
                                                              0
                                                      N
           Distance [km]                                  2000
           0         10                                   4000

Fig. 2. High-resolution, multibeam bathymetry data highlighting the hummocky nature of the Monte Amarelo debris
avalanche deposits (MTD-A) proximal to Fogo. (a) Compilation of the M155 and M80/3 multibeam bathymetry data
overlain on GEBCO2019 bathymetry and DEM topography of Fogo Island. (1) Espigão escarpment; (2) Bordeira
escarpment (dotted black line) is regarded as either the Monte Amarelo headwall scarp (Day et al. 1999), or the edge
of a caldera (Madeira et al. 2008; Martínez-Moreno et al. 2018); (3) Monte Amarelo headwall scarp (dotted pink line;
Madeira et al. 2008; Martínez-Moreno et al. 2018); dashed black line: previously estimated extent of the Monte
Amarelo debris avalanche deposits (Masson et al. 2008); solid white line: revised extent of the Monte Amarelo debris
avalanche deposits (MTD-A); dashed white line: transitional zone where the size of the hummocks decreases with
distance from the source. (b) Enlarged view of the hummocky topography of the Monte Amarelo debris avalanche
deposits. Note the angular shape and variable size of the hummocks.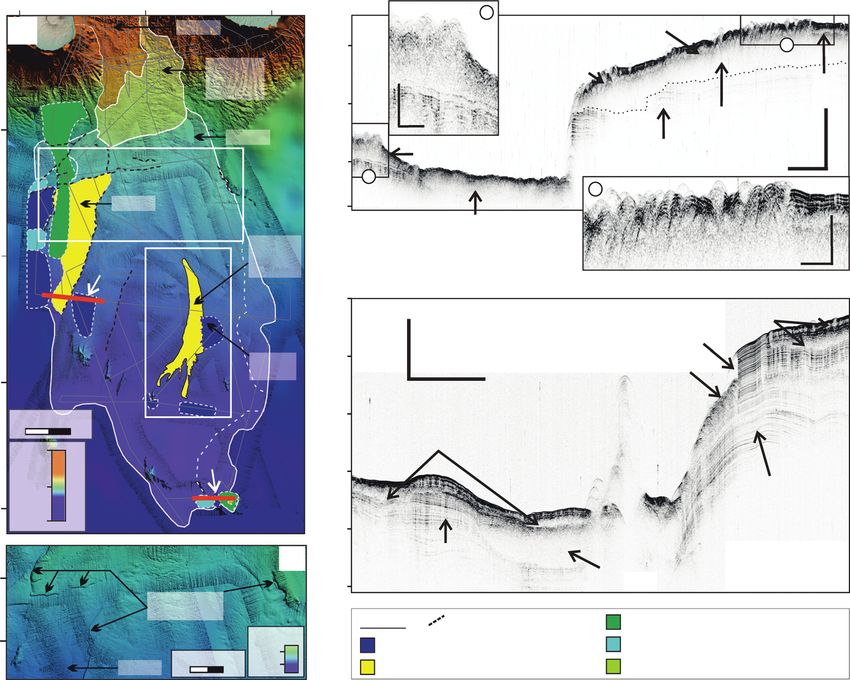
Downloaded from http://sp.lyellcollection.org/ by guest on December 14, 2021

16                                               R. Barrett et al.

Martínez-Moreno et al. 2018). Fogo’s Monte Amar-           volcanic flank. Moreover, this characterization is
elo flank collapse, however, is strongly supported by       crucial for tsunami hazard modelling, given that
the presence of a preserved lateral ramp at Espigão        the mode, volume and run-out of a collapse will
(Brum da Silveira et al. 1997) and a                       have a profound effect on the resulting tsunami
debris avalanche deposit located between the islands       waves (Grilli et al. 1997; Abadie et al. 2012; Watt
of Fogo and Santiago (Le Bas et al. 2007; Masson           et al. 2012a). The offshore distribution of the
et al. 2008) (Figs 2 & 3). Using a combined                Monte Amarelo flank-collapse debris (i.e. debris
magnetotelluric- and multibeam-based approach,             avalanche deposits) and the surrounding volcaniclas-
Martínez-Moreno et al. (2018) estimated a volume           tic apron were previously mapped using only
of 110 km3 for the Monte Amarelo debris avalanche          medium-resolution (100 m grid cell size) multibeam
deposit. This estimate corresponds well with previ-        bathymetric data (Masson et al. 2008). Conse-
ous bathymetric-based estimates, which ranged              quently, the distribution of the debris avalanche
between 80 and 160 km3 (Le Bas et al. 2007;                deposits and of any additional slope instabilities in
Madeira et al. 2008; Masson et al. 2008). Tsunami          the area are still poorly constrained. As Fogo’s vol-
deposits found on the nearby islands of Santiago           canic flank collapse likely triggered a mega-tsunami
and Maio indicate that the Monte Amarelo flank col-         with a recognizable impact on the adjacent islands’
lapse was tsunamigenic, with the resulting tsunami         coastlines (Paris et al. 2011, 2018; Ramalho et al.
achieving a run-up in excess of 270 m above coeval         2015; Madeira et al. 2019), a full characterization
sea-level on Santiago (Ramalho et al. 2015; Madeira        of this landslide and its related volume is crucial
et al. 2019). The exact age of the collapse, however, is   for improving numerical models of tsunami genera-
the topic of ongoing debate. On the basis of 3He geo-      tion, propagation and inundation, and for constrain-
chronology of lava flows from Fogo, Foeken et al.           ing the hazard potential associated with large,
(2009) first estimated the collapse to have occurred        tsunamigenic volcanic flank collapses.
between 62 and 123 ka. Paris et al. (2011) suggested           Here, using recently acquired multibeam bathy-
a narrower window of 86–124 ka, based, respec-             metric data (50 m grid cell size) in conjunction with
tively, on Ar/Ar ages of lava flows from Fogo               parametric sediment echo-sounder data and sediment
thought to be post-collapse, and U–Th dating of cor-       gravity cores, we revisit the Monte Amarelo volcanic
als from tsunami deposits on Santiago. More recently,      flank collapse and consider general slope stability in
based on the results of cosmogenic 3He dating of tsu-      the southern distal region of the volcanic apron. We
nami megaclasts from Santiago Island, Ramalho et al.       aim to (1) map out the lateral extent and characterize
(2015) proposed that the collapse and ensuing tsu-         the acoustic nature of the Monte Amarelo debris ava-
nami took place between 65 and 84 ka, with a most          lanche deposits; (2) identify possible additional land-
probable age of 73 + 7 ka. This agrees, within uncer-      slides on the slopes south of the islands of Fogo and
tainty, with the age recently reported by Maderia et al.   Santiago; and (3) consider the related precondition-
(2019; 78 + 0.9 ka) for a set of tsunami deposits          ing and triggering processes.
found on the coast of Maio Island. Dating of turbidite
material attributed to tsunami-triggered sediment          Data and methodology
transport along the flanks of Fogo and Brava islands,
however, led Eisele et al. (2015) to favour an older       The data presented in this paper were collected
age of 86–117 ka. Finally, and most recently, Mar-         during R/V Meteor cruise M155 (May–June
ques et al. (2019) suggested a much younger age of         2019; Krastel et al. 2019) and are supplemented
43–59 ka, based on K/Ar dating of Fogo lava flows           by multibeam bathymetric data collected during
that they considered to be pre- and post-collapse.         R/V Meteor cruise M80/3 (Hansteen et al. 2014).
    Whether Fogo has collapsed only once or multi-         The bathymetric data were acquired using hull-
ple times is also the subject of discussion (Day et al.    mounted Kongsberg EM120 (M80/3), EM122
1999; Ramalho et al. 2015; Martínez-Moreno et al.          (M155) and EM710 (M155) multibeam echo-
2018; Marques et al. 2019). Subsequent eruptions           sounders. The EM120/EM122 system has a swath
on Fogo have largely been constrained to the central       coverage of up to 150° and a nominal sonar fre-
and eastern parts of the island, and a prominent stra-     quency of 12 kHz, and is designed to perform
tovolcano – Pico do Fogo – presently rises to 2829 m       seabed mapping to full ocean depth. During cruise
above sea-level within the landslide scar (Fig. 2;         M155, the swath width was reduced to 120° in
Torres et al. 1997).                                       order to increase the quality and resolution of the
                                                           data. The EM710 system has a swath coverage of
Objectives                                                 up to 140°, and a nominal sonar frequency of 70–
                                                           100 kHz. As such, the EM710 was used only in
A detailed analysis of the distribution of the land-       water depths less than 700 m close to the islands
slide deposits and failure mechanism are critical for      of Fogo and Santiago. All bathymetric data were fil-
constraining the hazard linked to the collapse of a        tered for outliers and manually edited. The data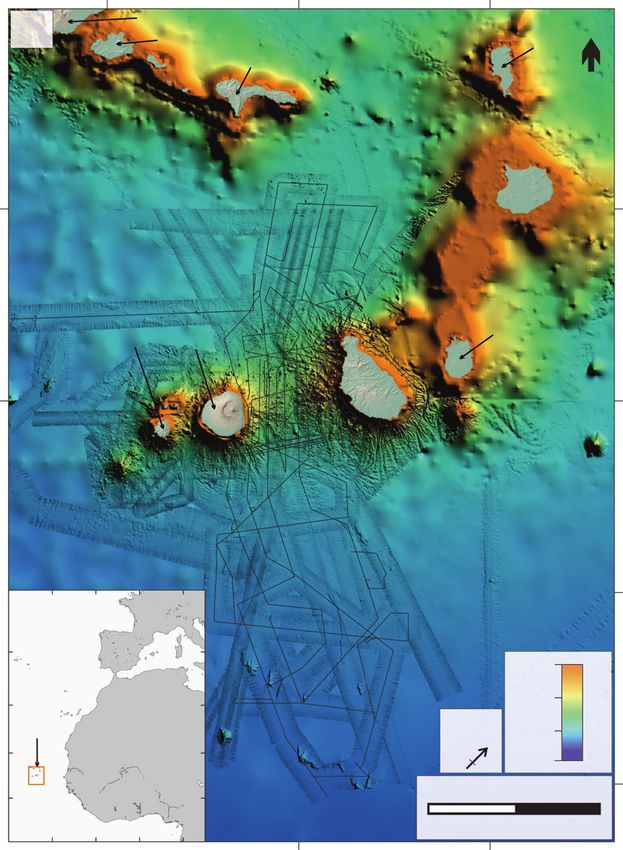
Downloaded from http://sp.lyellcollection.org/ by guest on December 14, 2021
The volcanic flank collapse of Fogo (Cape Verdes) 17
25°W 24°W S N
0 (a) (b) Diffraction hyperbolae/ MTD-A
hummocks
Depth [m]
16°N
2000 3.50
4000
TWT (s)
5800 Double reflectors
MTD-A
3.60
Brava b
20 m
VE c. 43
15°N
2 km
Multiple draping
reflectors
SW NE
MTD-A/B 5.10 (c) Side echo
c Transition
Zone
Edge of Strong draping reflectors
d
TWT (s)
14°N
upper
? e part of
MTD-B Transparent
facies
MTD-B
MTD-A
20 m
5.20
? VE c. 52
?
MTD-A/B transition zone 2 km
Distance [km]
13°N
0 50 ? Transparent facies
NW SE
MTD-B
(d)
5.72
TWT (s)
Strong internal reflector
5.75
Double reflectors
10 m
VE c. 139
Semi-transparent facies
2 km
SW NE
(e) MTD-B
Remnant stratification
5.80
Semi-transparent facies
Strong internal
Strong draping reflector Chaotic facies
reflectors
TWT (s)
10 m
Well-stratified VE c. 93
5.85 Basal reflector sediments
2 km
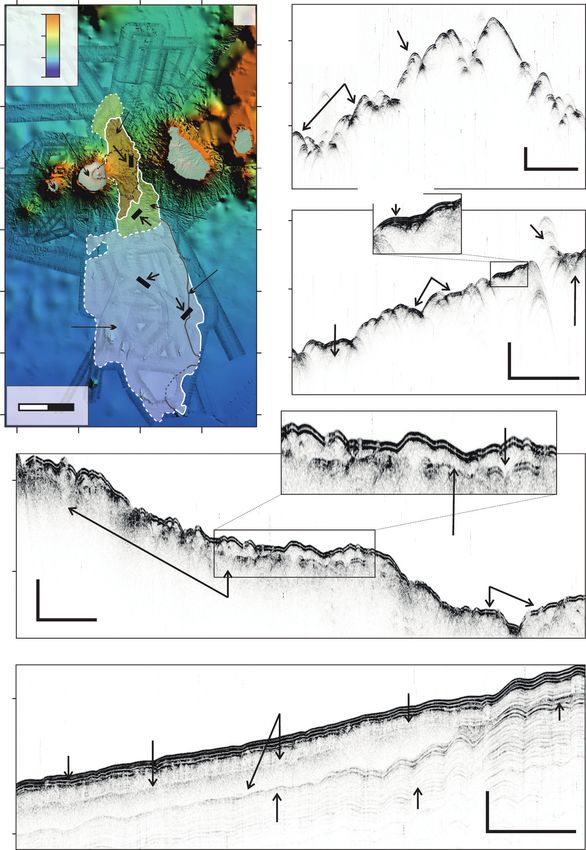
Fig. 3. (a) Map showing the distribution of the debris avalanche deposits (MTD-A), the acoustically transparent/
seismically chaotic MTD-B associated with the Monte Amarelo flank collapse, and a transitional zone where the size
of the hummocks decreases with distance from the source. The lateral extent of MTD-B may extend further south and
west of the surveyed area. Dashed black line: previous mapped extent of the Monte Amarelo deposits (Masson et al.
2008); grey line: eastern margin of the upper part of MTD-B; solid black lines: location of the Parasound lines shown
in (b)–(e). (b–e) Parasound profiles highlighting the acoustic character of (b) MTD-A, (c) the transitional zone, and
(d–e) MTD-B. See the text for discussion on the nature of these deposits. VE, vertical exaggeration.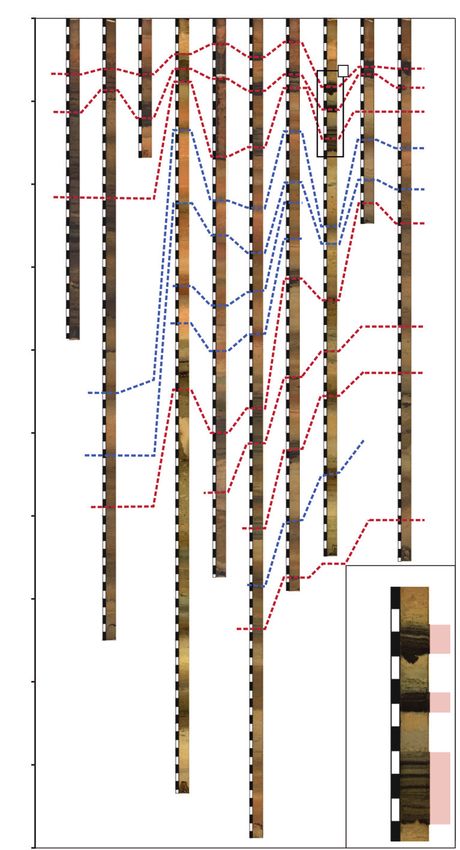
Downloaded from http://sp.lyellcollection.org/ by guest on December 14, 2021

18                                             R. Barrett et al.

from all cruises and multibeam systems are com-          changes from being hyperbolae-dominated to being
bined and gridded at 50 m.                               characterized by an acoustically transparent/semi-
    Parametric sediment echo-sounder data were col-      transparent facies (Fig. 3d; hereafter referred to as
lected using a parametric ATLAS DS-3/P70 system          MTD-B; distribution shown in Fig. 3a). In the north-
(Parasound). This system has an opening angle of         ern reaches of MTD-B, the upper surface of the
4° and operates at primary high frequencies of 18.5      deposits is undulating, with metre-scale variations
and 22.5 kHz, resulting in a parametric low fre-         in depth over wavelengths of tens to hundreds of
quency of 4 kHz. The vertical resolution of this         metres (Fig. 3d). The overlying sedimentary drape
system is in the decimetre range. All depth scales       mantles the surface of the deposits and a strong inter-
on Parasound images presented in this study were         nal reflector is imaged in places within the deposits
calculated using a constant velocity of 1500 m s−1.      (Fig. 3d). This internal reflector clearly contrasts
    Sediment cores were collected during cruise          with the overlying transparent facies, separating it
M155 using a gravity corer with tube lengths of 3 to     from the lower semi-transparent facies. In the north-
15 m. These cores were visually described onboard        ern and western reaches of MTD-B, this internal
and smear slides were analysed to obtain further         reflector is either clearly imaged or not present at
microscopic information about the core mineralogy,       all, and the base of the lower part of MTD-B is not
texture and composition. Dating and further geo-         resolved (Fig. 3d).
chemical and sedimentological analysis of these              In the eastern and southern reaches of MTD-B,
cores is ongoing and will form the basis of future       the aforementioned internal reflector is continuous
work on the subject.                                     over a relatively long distance (Fig. 3e). In these
                                                         areas, a thicker sedimentary drape (up to c. 4 m
                                                         thick), containing multiple strong reflections alter-
Results                                                  nating with relatively thin, transparent layers, over-
                                                         lies MTD-B. The upper surface of MTD-B is
The Monte Amarelo debris avalanche                       diffuse and undulating in parts. The base of
deposits (MTD-A)                                         MTD-B is sometimes marked by a prominent reflec-
                                                         tion that has a similar acoustic signature, although of
The Monte Amarelo deposits proximal to Fogo              lower amplitude, as the double reflector that overlies
(MTD (mass-transport deposit)-A; distribution            the deposits (e.g. Fig. 3e). A series of well-stratified
shown in Fig. 3a) are characterized by overlapping       sediments is imaged below the base of MTD-B
diffraction hyperbolae (Fig. 3b). This hummocky          (Fig. 3e). At the eastern lateral margin of MTD-B,
character is typical of debris avalanche deposits        the internal reflector within the slide deposits is
from volcanic flank collapses (Siebert 1984). The         more diffuse (Fig. 3e). The lowermost part of
sedimentary drape covering MTD-A is relatively           MTD-B remains transparent in nature, but remnant
thin (,1.5 m thick) or not imaged, and is often          stratifications are imaged in some areas of the upper-
characterized by two strong, positive reflections.        most part. The eastern boundary is gradational over
Irregularly shaped blocks that are up to 100 m           2–3 km, and is marked by a progressive thinning
higher than the surrounding seafloor are present          of the transparent facies, and an increase in stratifica-
within the landslide debris (Fig. 2). Further away       tion within the deposits (Fig. 3e).
from Fogo, the hummocky topography is less preva-            Constraining the thickness and lateral extent of
lent in the bathymetric data, despite the presence of    MTD-B is challenging. In the northern reaches,
diffraction hyperbolae in the Parasound data. This       where the strong internal reflector is imaged, the
highlights a decrease in the size of the hummocks        base of the deposits is not resolved by the acoustic
with distance from the island. We note a progressive     system (Fig. 3c). This means that only the thickness
transition in the acoustic signature of the deposits     of the upper transparent facies related to MTD-B
from a hyperbolic facies with metre-scale acoustic       (up to c. 7 m thick, but variable) can be estimated.
penetration (Fig. 3b), to a mounded facies draped        In its eastern and southern extents, however, the
by c. 1.5 m of sediment characterized by the afore-      bases of the upper and lower units of MTD-B are
mentioned prominent double reflections (Fig. 3d).         imaged, leading to thickness estimates of 4–6 m
In a few places, these double reflections are replaced    and 5–15 m for the upper and lower units, res-
by a succession of finely stratified layers (inset of      pectively (Fig. 3e). The large spacings between
Fig. 3c).                                                the Parasound profiles in the central and southern
                                                         parts of the working area, south of Fogo and Santi-
Distal deposits related to the Monte Amarelo             ago, mean that we cannot constrain the thickness of
volcanic flank collapse (MTD-B)                           the deposits in these areas with certainty. In addi-
                                                         tion, MTD-B deposits might extend beyond the lim-
Southwards, with increasing distance from Fogo, the      its of the surveyed area, especially to the west and
acoustic character of the Monte Amarelo deposits         south (Fig. 3a).
Downloaded from http://sp.lyellcollection.org/ by guest on December 14, 2021
The volcanic flank collapse of Fogo (Cape Verdes) 19
Additional mass wasting events on the shallow analyses show that these shallow sandy turbidites are
slopes south of Fogo and Santiago predominantly of volcaniclastic (volcanic lithics that
are mostly lava fragments, tachylitic to brown glass,
Visual analysis of gravity cores taken in the southern crystal fragments), and/or mixed volcaniclastic–
part of the volcaniclastic apron of Fogo and Santiago bioclastic composition, rather than solely bioclastic.
reveals mud- and nanofossil-rich facies interbedded Multibeam-bathymetry and sediment echo-soun-
with multiple sand units that are defined by parallel der data on the shallow slopes south of Fogo and
and cross-laminated, seldom normally graded beds Santiago reveal multiple morphological steps and
(Fig. 4). These sandy intervals generally range from several MTDs (Fig. 5). These additional MTDs are
fine- to coarse-sand deposits, and are typically of cen- characterized by acoustically transparent and/or
timetre to decimetre scale (Fig. 4b). Microscopic hyperbolic facies and occur both above and below
MTD-B. Several of these MTDs are exposed at the
surface and have remobilized previously failed sedi-
West 13 East
0
19 20 18 41 7 8 14 38 12 ments, including those of MTD-B (e.g. Figs 5 & 6).
However, as for MTD-B, their full lateral extent
b V1 is generally poorly constrained due to large profile
?
V2 spacings and their possible continuation outside
V3 the surveyed area. The morphological steps vary in
length, height, strike and orientation (Fig. 5a), but
are typically near vertical (Fig. 5c, d). In the follow-
200
? ?
ing section, we describe the character of, and relation
V4
between, several of these features in more detail.
?
Tectonic escarpments along the western and eastern
margins. A series of escarpments is imaged to the
west, along the western margin of MTD-B, and
? V5
400
stretching between 40 and 110 km south of Fogo
? V6
(Fig. 5a, b). The most prominent escarpment is
?
orientated roughly north–south and extends across
Length (cm)
c. 55 km. It is c. 50 m high and near vertical
? (Fig. 5c). Monte Amarelo MTD-B deposits are
?
imaged on the eastern side (footwall) of this step.
On the western (hanging-wall) side, the sediments
?
600 ? V7 are characterized by a semi-transparent facies with a
hummocky upper surface (hereafter referred to as
? MTD-X; Fig. 5c). In places, a pair of strong reflectors
GC M155_38
is identified within the sedimentary drape that over-
lies MTD-X. Proximal to the escarpment, the base
V1 of MTD-X cannot be resolved. Further west of the
scarp, however, stratified sediment is imaged below
100 cm
800
the base of MTD-X (inset 1 of Fig. 5c). The lateral
V2
extent of MTD-X is constrained to both the north
and east by the morphological steps (Fig. 5b, c),
resulting in a minimum area of 900 km2 for MTD-X.
V3
150 cm
Southern Scour Complex. A prominent, elongated
1000
(a) (b) scour-shaped feature is evident in the central part of
the southern distal region (hereafter referred to as
Fig. 4. (a) Compilation of sediment gravity cores the Southern Scour Complex (SSC), Fig. 6a). This
retrieved south of Fogo and Santiago during M155 feature is c. 60 km long and covers an area of c.
showing preliminary stratigraphic correlations based on 340 km2. The western and eastern sides of the SSC
visual analysis. Dashed red lines: correlations between are constrained by up to 40 and 55 m high escarp-
different volcaniclastic sand layers (V1–V7); dashed
ments, respectively (Fig. 6). In Parasound data cross-
blue lines: correlation of background sediment layers
(reddish-brown horizons) that helped to correlate the ing the complex, acoustically transparent facies with
volcaniclastic sand layers. The locations of these cores a strong internal reflector characterizing the Monte
are shown in Figure 1c. (b) Zoom of gravity core Amarelo MTD-B are evident on both the eastern
M155_38 (62–168 cm) showing the visually identified and western sides of the SSC (Fig. 6b & c). In the cen-
volcaniclastic layers V1–V3. tral part of the SSC (Fig. 6c), acoustically transparentDownloaded from http://sp.lyellcollection.org/ by guest on December 14, 2021
20 R. Barrett et al.
24.5° W 24.0° W 23.5° W W 1 E
(a) Fogo MTD-A (c) Upper MTD-B
5.85 2
10 m
MTD-A/B
Hummocks
Transition Internal
TWT [s]
Zone reflector
14.5° N
Lower
500 m MTD-B VE c. 78
40 m
MTD-B
Double reflector? Stratified 2 km
5.95
1 sediments
2
MTD-X
Semi-transparent facies
10 m
b
14.0° N
Southern with hummocky surface
Fig. 6 Scour 500 m
c (MTD-X)
Complex
6.10
W E
(d) Shallowly buried MTDs
40 m
Headwall
VE c. 40
Eastern
13.5° N
Scour Surficial MTD
2.5 km
TWT [s]
Distance [km] Volcanic feature
0 20
Shallowly buried MTDs (side-echo)
2000
d
Depth [m]
4000 Stratified
13.0° N
sediments
5800
6.30
24°10’ W 23°50’ W (b) Stratified
14°20’ N
sediments Deeply-buried MTDs
Fault-related
escarpments
Legend Fault escarpments MTD beneath 5-10 m of sediments
14°10’ N
Depth [m]
MTD exposed at surface MTD beneath 10-15 m of sediments
Distance [km] 4000
MTD-X 0 10 4500 MTD beneath 30 m of sediments
Fig. 5. (a) Multibeam data overlain on GEBCO2019 bathymetry highlighting the presence of multiple fault-related
escarpments and volcanic features on the shallow slopes south of Fogo. Additional MTDs are also identified in the
Parasound data and coloured according to their burial depth (see legend). Solid red lines: location of the Parasound
profiles shown in (c) and (d). (b) Multibeam data showing the nature of the fault-related escarpments on the slopes
south of Fogo and Santiago in more detail. (c) Parasound profile crossing one of the most striking escarpments visible
on the western side (see (b)), highlights the relation between tectonic processes and landsliding in the area. Monte
Amarelo MTD-B deposits (eastern side) are remobilized across the escarpment. (d) Parasound profile crossing an
escarpment in the southern reaches of the working area highlights acoustically transparent MTDs at varying depths.
MTDs with some internal structure are covered by Discussion
c. 3 m of stratified sediment. In the northern part,
the material within the SSC is characterized by a The two-fold nature of Fogo’s Monte Amarelo
semi-transparent facies with a hummocky upper sur- flank collapse
face, and the deposits are largely exposed at the sur-
face (Fig. 6b). An additional instability is visible on Based on the difference in their acoustic character,
the eastern side of the SSC (hereafter referred to as we distinguish between two main types of deposits
the Eastern Scour (ES); Fig. 6d). The ES reaches a related to the Monte Amarelo volcanic flank collapse:
thickness of up to 35 m thick in its centre and covers hummocky, debris avalanche deposits proximal to
an area of c. 120 km2. Parasound data across the ES Fogo (MTD-A), and finer-grained, acoustically
show that this failure primarily remobilized the transparent landslide deposits (MTD-B) at greater
Monte Amarelo MTD-B deposits in this region distances from Fogo that were previously not recog-
along the same basal glide plane as MTD-B nized (Fig. 3). The blocky debris avalanche deposits
(Fig. 6d). To the south, the SCC is fan-shaped, with of MTD-A cover a surface area of 3180 km2. If we
fingers of unfailed stratified sediments standing up also include the region in which the size of the hum-
to c. 20 m above failed sediment (Fig. 6d). Semi- mocks decreases with distance from the source
transparent deposits characteristic of MTD-B are (marked by the yellow shaded region in Fig. 3a),
imaged on the tops of these stratified fingers. this increases the total area of MTD-A to 6820 km2;Downloaded from http://sp.lyellcollection.org/ by guest on December 14, 2021
The volcanic flank collapse of Fogo (Cape Verdes) 21
24°00’ W 23°45’ W NW SE
(a) 5.75 (b) Strong draping reflectors Strong draping reflectors
Well-stratified
14°00’ N
sediments
4250
Hummocky
B?
b
TWT (s)
surface
-
4750
MTD
Depth D-B
MT
(m) c Transparent Transparent
20 m
facies facies VE c. 90
d Well-stratified Transparent
Southern 5.85 sediments facies
Scour SSC 2 km
Complex
Eastern
W E
Scour Strong draping reflectors
(c)
TWT [s]
13°30’ N
5.85 Well-stratified
D-B
sediments MT
Distance (km)
TWT (s)
0 10 Transparent
Draping reflectors facies
D-B
(e)
MT
2 5.90
20 m
Strong VE c. 86
internal
Transparent reflector
facies 2 km
3 SSC
1
SW NE
Eastern Scour
(d)
Hummocky
surface
t facies
Transparen D-B
5.90 Draping MT
Strong draping relectors
reflectors Transparent facies Strong internal reflector
TWT (s)
(MTD-B)
Transparent facies
40 m
Well-stratified
6.00 Basal sediments VE c. 70
Well-stratified sediments reflector
SSC SSC 2 km
Fig. 6. Southern Scour Complex (SSC). (a) Multibeam data highlighting the surface morphology of the SCC and the
extension of the Eastern Scour (dashed white line). The location of Figure 6a with respect to the other features
discussed in this article is shown in Figure 5. (b–d) Parasound profiles crossing the SSC showing a complex
relationship between former and more recent landsliding processes, along with the variable acoustic character of the
deposits and of the adjacent unfailed material. (e) Conceptual model showing the proposed retrogressive development
of the SSC towards the north and east. Numbers 1–3 highlight the sequence of events.
more than four times the previous estimate constant thickness (4–6 m). Contrastingly the thick-
(c. 1470 km2; Masson et al. 2008). As the base of ness of the lower part of MTD-B is highly variable
the volcanic debris avalanche deposits is not resolved (up to 15 m thick). Interestingly, the upper and
by the Parasound data, we cannot, at this stage, lower parts of MTD-B have a similar areal distri-
revisit estimates of the volume involved. bution within the volcaniclastic apron; covering a
Monte Amarelo MTD-B is characterized by an minimum of 18 400 km2 (upper) and 19 500 km2
acoustically transparent to semi-transparent facies (lower) (Fig. 3a). This implies minimum volumes
that is overlain by a series of two to four strong of 92 km3 (upper) and 195 km3 (lower), assuming
reflectors (Figs 3, 5c & 6b–d). A prominent, internal average thicknesses of 5 m (upper) and 10 m
reflection is clearly observed in places within the (lower). Their similar distribution implies that the
deposits; separating MTD-B into two main parts upper and lower parts of MTD-B might share the
(Fig. 3d, e). The uppermost section is of relatively same source or, at least, be genetically linked. WeDownloaded from http://sp.lyellcollection.org/ by guest on December 14, 2021
22 R. Barrett et al.
therefore infer that the upper and lower part of they originated from Fogo volcano. This indicates
MTD-B might have been emplaced (almost) con- that smaller mass-wasting events may have occurred
temporaneously. The absolute timing of these two at Fogo in addition to the Monte Amarelo volcanic
phases, however, remains unclear. Of particular flank collapse, as also recently suggested by Mar-
interest is whether these two failures occurred as ques et al. (2019). Correlation and origin of these
two phases of the same event, or as two distinct volcaniclastic deposits will, however, be verified
events separated by some time. Further analytical by future analytical work on the sediment cores.
work on the sediment cores will help to reveal
more information about the nature of the prominent Regional tectonic and volcanic influences south of
internal reflection, along with the relative timing of Fogo? The multiple fault-related escarpments and
these two depositional episodes. MTDs identified in the acoustic data south of Fogo
A similar two-fold nature of volcanic flank- further highlight a long and complex history of insta-
collapse deposits – hummocky debris avalanche bility and slope failure in the region (Fig. 5). Ram-
deposits accompanied by acoustically transparent alho et al. (2010) found that the island of Santiago
to seismically chaotic deposits with a comparatively has uplifted at a rate of c. 100 m Ma−1 over the
smooth upper surface – has also been reported for past 4 Ma, and attributed this uplift to a combination
flank collapses at other locations, including in the of magmatic intrusions under or within the island
Lesser Antilles (Watt et al. 2012a, b; Le Friant edifice, together with episodic swell-wide uplift
et al. 2015; Brunet et al. 2016), at La Réunion that affected the whole archipelago. Although geo-
(Indian Ocean; Lebas et al. 2018) and at Ritter Island logically recent uplift has not been reported at
(Papua New Guinea; Karstens et al. 2019; Watt et al. Fogo, the neighbouring island of Brava has experi-
2019). Drilled cores retrieved during IODP Expedi- enced one of the most dramatic intrusion-related
tion 340 in the Lesser Antilles indicated that wide- uplift trends of any ocean island in the world, with
spread, seismically chaotic deposits (interpreted as up to 400 m of uplift in the last 1.8 Ma (Madeira
equivalent to our MTD-B) primarily consist of hemi- et al. 2010). The presence of such widespread uplift
pelagic mud interbedded with a combination of across the archipelago – and particularly around
tephra, volcaniclastic layers, or bioclastic turbiditic the southern Cape Verdes – thus suggests that the
deposits, which have undergone varying degrees of series of escarpments and landslides observed on
deformation (Le Friant et al. 2015; Brunet et al. the slopes south of Fogo may be the surface expres-
2016). To explain these findings, Le Friant et al. sion of a combination of regional tectonics, associ-
(2015) proposed a failure model where the loading ated with the growth of the Cape Verdes hotspot
of seafloor sediment by volcanic debris avalanche swell, and crustal intrusions in the vicinity of the
deposits triggered sediment destabilization and pro- islands. As several of the exposed faults have land-
gressive downslope-propagating failure along a slide deposits on their hanging wall side, we interpret
decollement. In this way, the deformation can prop- that these MTDs are most likely the results of move-
agate great distances away from the flank collapse, ment along the faults and, as such, the result of neo-
affecting seafloor sediments that were otherwise sta- tectonic activity.
ble (Le Friant et al. 2015). The acoustic character of The SSC, which is exposed at the seafloor, post-
our MTD-B bears a strong resemblance to the seis- dates the Monte Amarelo flank collapse (Fig. 6).
mically chaotic deposits in the Lesser Antilles. We, Monte Amarelo MTD-B deposits are imaged on
therefore, interpret MTD-B to be the result of the the footwall east of the SSC (Fig. 6b–d), and on
failure of pre-existing seafloor sediments following the tops of the unfailed, stratified fingers at the south-
the loading of the Monte Amarelo debris avalanche ern extent of the SSC (Fig. 6d). This indicates that
deposits (MTD-A). the SSC formed after the Monte Amarelo flank col-
lapse, remobilizing MTD-B. In the northern and
eastern parts of the SSC, acoustically transparent
A history of mass wasting and remobilization mass-wasting deposits are exposed at the seafloor,
in the southern Cape Verdes highlighting more recent mass wasting and remobili-
zation of MTD-B (Fig. 6b). We interpret the more
Repeated mass-wasting events at Fogo? Preliminary recent mass-wasting deposits in the northern and
stratigraphic correlations based on visual similarities eastern parts of the SSC as evidence of retrogressive
of cores in the southern distal part of the working development of the SSC in these directions (Fig. 6e).
area indicate at least seven volcaniclastic or mixed The presence of fault-related escarpments on the
volcaniclastic–bioclastic sandy turbidite layers slopes south of Fogo, frequent volcanic episodes
above and below the Monte Amarelo flank-collapse at Fogo (Ribeiro 1960; Torres et al. 1997), and ongo-
deposits (Fig. 4). These turbidite layers are domi- ing uplift at the neighbouring islands of Santiago
nated by mafic glass, crystals and lava fragments, and Brava (Madeira et al. 2010; Ramalho et al.
which, based on their petrography, suggests that 2010), together imply the occurrence of frequentDownloaded from http://sp.lyellcollection.org/ by guest on December 14, 2021
The volcanic flank collapse of Fogo (Cape Verdes) 23
earthquakes in the past. The volcanic activity at Fogo prevailing mass-transport processes in the region
has resulted in the widespread deposition of numer- may be dominated by volcanic eruptions or volcanic
ous tephra layers (Eisele et al. 2015). Subsequent mass-wasting events. However, it is also possible
earthquake shaking may have resulted in liquefac- that some of the additional mass-wasting events are
tion of overlying layers, which, together with sedi- unrelated to flank collapse events or submarine fail-
mentary overpressure following further sediment ures, and could instead have been generated by sedi-
deposition, can help to precondition the shallow mentary overpressure and/or by the presence of a
slopes for failure (Moernaut et al. 2019). Even mechanically weak layer such as tephra or turbidites.
small changes in the stress regime of tephra layers Further analytical work is required to verify the
have been found to be able to trigger failure (Horn- sources of these events on the shallow slopes south
bach et al. 2015). Consequently, it is possible that of the Cape Verdean archipelago. As these layers
some of the MTDs observed on the shallowly dip- are thin, have limited lateral extent and occurred
ping slopes south of Fogo, and unrelated to escarp- on low-gradient slopes in deep water, we consider
ments, may result from such a process. Future their associated tsunamigenic potential to be low.
work, particularly on the sediment cores collected
during cruise M155, will help to shed light on the
sources and processes responsible for the MTDs Acknowledgements We are grateful to the captain,
crew and scientific teams of R/V Meteor (M155) for their
mapped on the shallow slopes south of Fogo and
enthusiasm and assistance onboard. We are also thankful
Santiago. for the thoughtful reviews of the editor, Lawrence Amy,
as well as Paraskevi Nomikou and two anonymous review-
ers, whose comments improved this manuscript.
Implications and conclusions
In this study, we revisited the Monte Amarelo vol- Funding Data acquisition during R/V Meteor’s cruise
canic flank collapse of Fogo Island and found that M155 was funded by the DFG and BMBF. R. Barrett is
the deposition of the debris avalanche material may funded by the European Union’s Horizon 2020 research
and innovation programme under the Marie Skłodowska-
have triggered subsequent failures of pre-existing Curie grant agreement No. 721403 (SLATE – ‘Submarine
seafloor sediments in (at least) two phases. This is LAndslides and Their impact on European continental
similar to what has been observed in the Lesser margins’). R. Ramalho acknowledges his IF/01641/2015
Antilles (Le Friant et al. 2015; Brunet et al. 2016), contract funded by Fundação para a Ciência e Tecnologia
at La Réunion (Lebas et al. 2018) and at Ritter Island (FCT), as well as the following projects funded by FCT:
(Karstens et al. 2019; Watt et al. 2019). It is not yet IF/01641/2015, LISBOA-01-0145-FEDER-028588 and
clear whether these two phases of seafloor sediment PTDC/CTA-GEO/28588/2017 UNTIeD, PTDC/GEO-
failure were synchronous as a result of a single flank GEO/1123/2014 FIRE, and UID/GEO/50019/2019 –
collapse, or if they reflect multiple, distinct events. Instituto Dom Luiz.
The question of whether the main flank collapse
occurred as a single or as multiple events is of utmost Author contributions RB: conceptualization (lead),
importance for tsunami modelling because the vol- formal analysis (lead), investigation (supporting),
ume and timing of individual failures are the main methodology (lead), validation (lead), visualization (lead),
factors controlling the tsunamigenic potential writing – original draft (lead), writing – review & editing
(Løvholt et al. 2015). Water depth and landslide (lead); EL: conceptualization (supporting), formal analysis
kinematics play a key role in controlling the tsunami- (supporting), investigation (supporting), methodology
genic potential of a subaqueous landslide (Watts (supporting), project administration (supporting), supervi-
sion (supporting), validation (supporting), visualization
et al. 2000; Ward 2001; Watt et al. 2012a; Harbitz
(supporting), writing – review & editing (supporting);
et al. 2014). As MTD-B occurred in depths exceed- RR: conceptualization (supporting), formal analysis (sup-
ing 3000 m, we consider that its influence on the porting), funding acquisition (supporting), investigation
resulting tsunami magnitude was negligible, and (supporting), project administration (supporting), writing –
that only the hummocky debris avalanche deposits review & editing (supporting); IK: conceptualization
(MTD-A) contributed to the mega-tsunami that inun- (supporting), formal analysis (supporting), investigation
dated nearby islands. (supporting), project administration (supporting), writing –
Multibeam bathymetric, sediment echo-sounder review & editing (supporting); SKu: conceptualization
and sediment gravity core data acquired during (supporting), data curation (equal), formal analysis (sup-
cruise M155 of R/V Meteor provide seafloor evi- porting), funding acquisition (supporting), investigation
(supporting), project administration (supporting), writing –
dence that shows, for the first time, the presence of review & editing (supporting); AK: conceptualization (sup-
multiple additional mass-wasting events on the shal- porting), formal analysis (supporting), funding acquisition
low slopes south of Fogo. Turbidite sands recovered (supporting), investigation (supporting), project administra-
in the cores have a volcaniclastic or mixed volcani- tion (supporting), writing – review & editing (supporting);
clastic–bioclastic composition, which suggests that KL: conceptualization (supporting), formal analysisDownloaded from http://sp.lyellcollection.org/ by guest on December 14, 2021
24 R. Barrett et al.
(supporting), investigation (supporting), writing – review & Crough, S.T. 1978. Thermal origin of mid-plate hot-spot
editing (supporting); FG: conceptualization (supporting), swells. Geophysical Journal of the Royal Astronomical
formal analysis (supporting), methodology (supporting), Society, 55, 451–469, https://doi.org/10.1111/j.
supervision (supporting), writing – review & editing 1365-246X.1978.tb04282
(supporting); SKr: conceptualization (supporting), data Day, S.J., Heleno da Silva, S.I.N. and Fonseca, J.F.B.D.
curation (lead), formal analysis (supporting), funding acqui- 1999. A past giant lateral collapse and present-day
sition (lead), investigation (lead), project administration flank instability of Fogo, Cape Verde Islands. Journal
(lead), supervision (lead), validation (supporting), writing – of Volcanology and Geothermal Research, 94,
review & editing (supporting). 191–218, https://doi.org/10.1016/S0377-0273(99)
00103-1
Eisele, S., Reißig, S., Freundt, A., Kutterolf, S., Nürnberg,
References D., Wang, K.L. and Kwasnitschka, T. 2015. Pleistocene
to Holocene offshore tephrostratigraphy of highly
Abadie, S.M., Harris, J.C., Grilli, S.T. and Fabre, R. 2012. explosive eruptions from the southwestern Cape
Numerical modeling of tsunami waves generated by the Verde Archipelago. Marine Geology, 369, 233–250,
flank collapse of the Cumbre Vieja Volcano (La Palma, https://doi.org/10.1016/j.margeo.2015.09.006
Canary Islands): tsunami source and near field effects. Faria, B. and Fonseca, J.F.B.D. 2014. Investigating volca-
Journal of Geophysical Research: Oceans, 117, 1–26, nic hazard in Cape Verde Islands through geophysical
https://doi.org/10.1029/2011JC007646 monitoring: network description and first results. Natu-
Begét, J.E. and Kienle, J. 1992. Cyclic formation of debris ral Hazards Earth System Sciences, 14, 485–499,
avalanches at Mount St Augustine volcano. Nature, https://doi.org/10.5194/nhess-14-485-2014
356, 701–704, https://doi.org/10.1038/35670la0 Foeken, J.P.T., Day, S. and Stuart, F.M. 2009. Cosmogenic
3
Blahůt, J., Balek, J., Klimeš, J., Rowberry, M., Kusák, M. He exposure dating of the Quaternary basalts from
and Kalina, J. 2019. A comprehensive global database Fogo, Cape Verdes: implications for rift zone and
of giant landslides on volcanic islands. Landslides, magmatic reorganization. Quaternary Geochrono-
16, 2045–2052, https://doi.org/10.1007/s10346-019- logy, 4, 37–49, https://doi.org/10.1016/j.quageo.
01275-8 2008.07.002
Brum da Silveira, A., Madeira, J., Serralheiro, A., Torres, Goff, J., Terry, J.P., Chagué-Goff, C. and Goto, K. 2014.
P.C., da Silva, L.C. and Mendes, M.H. 1997. O controlo What is a mega-tsunami? Marine Geology, 358,
estrutural da erupção de Abril de 1995 na Ilha do Fogo, 12–17, https://doi.org/10.1016/j.margeo.2014.03.013
Cabo Verde. In: A Erupção Vulcânica de 1995 na Ilha González, P.J., Bagnardi, M., Hooper, A.J., Larsen, Y.,
do Fogo, Cabo Verde. Publ. IICT, Lisbon, 51–61. Marinkovic, P., Samsonov, S.V. and Wright, T.J.
Brunet, M., Le Friant, A. et al. and IODP Expedition 340 2015. The 2014–2015 eruption of Fogo volcano: geo-
Science Party. 2016. Composition, geometry, and detic modeling of Sentinel-1 TOPS interferometry.
emplacement dynamics of a large volcanic island land- Geophysical Research Letters, 42, 9239–9246,
slide offshore Martinique: from volcano flank- collapse https://doi.org/10.1002/2015GL066003
to seafloor sediment failure? Geochememistry, Geo- Grevemeyer, I., Helffrich, G., Faria, B., Booth-Rea, G.,
physics, Geosystems, 17, 699–724, https://doi.org/ Schnabel, M. and Weinrebe, W. 2010. Seismic activity
10.1002/2015GC006034 at Cadamosto seamount near Fogo Island, Cape Verdes:
Casalbore, D. 2018. Volcanic islands and seamounts. In: formation of a new ocean island? Geophysical Journal
Micallef, A., Krastel, S. and Savini, A. (eds) Submarine International, 180, 552–558, https://doi.org/10.1111/
Geomorphology. Springer Geology. Springer, Cham, j.1365-246X.2009.04440.x
333–347, https://doi.org/10.1007/978-3-319-57852- Grilli, S.T., Svendsen, I.A. and Subramanya, R. 1997.
1_17 Breaking criterion and characteristics for solitary
Casalbore, D., Romagnoli, C., Bosman, A. and Chiocci, waves on slopes. Journal of Waterway, Port, Coastal,
F.L. 2011. Potential tsunamigenic landslides at Strom- and Ocean Engineering, 123, 102–112, https://doi.
boli Volcano (Italy): insight from marine DEM analy- org/10.1061/(ASCE)0733-950X(1997)123:3(102)
sis. Geomorphology, 126, 42–50, https://doi.org/10. Grilli, S.T., Tappin, D.R. et al. 2019. Modelling of the tsu-
1016/j.geomorph.2010.10.026 nami from the December 22, 2018 lateral collapse of
Casalbore, D., Romagnoli, C. et al. 2015. Volcanic, tec- Anak Krakatau volcano in the Sunda Straits, Indonesia.
tonic and mass-wasting processes offshore Terceira Science Reports, 9, 11946, https://doi.org/10.1038/
Island (Azores) revealed by high-resolution seafloor s41598-019-48327-6
mapping. Bulletin of Volcanology, 77, 1–19, https:// Gross, F., Krastel, S. et al. 2014. Evidence for submarine
doi.org/10.1007/s00445-015-0905-3 landslides offshore Mt. Etna, Italy. In: Krastel, S.
Cervelli, P., Segall, P., Johnson, K., Lisowski, M. and et al. (eds) Submarine Mass Movements and Their Con-
Miklius, A. 2002. Sudden aseismic fault slip on the sequences. Advances in Natural and Technological
south flank of Kilauea volcano. Nature, 415, Hazards Research, 37. Springer, Cham, 307–316,
1014–1018, https://doi.org/10.1038/4151014a https://doi.org/10.1007/978-3-319-00972-8_27
Clare, M.A., Le Bas, T. et al. 2018. Complex and cascading Hansteen, T.H., Kwasnitschka, T. and Klügel, A. 2014. Cape
triggering of submarine landslides and turbidity cur- Verde Seamounts – Cruise No. M80/3 – December 29
rents at volcanic islands revealed from integration 2009 – February 1 2010 – Dakar (Senegal) – Las Palmas
of high-resolution onshore and offshore surveys. Fron- de Gran Canaria (Spain). METEOR-Berichte, M80/3,
tiers in Earth Science, 6, https://doi.org/10.3389/ DFG-Senatskommission für Ozeanographie, Bremen,
feart.2018.00223 https://doi.org/10.2312/cr_m80_3Downloaded from http://sp.lyellcollection.org/ by guest on December 14, 2021
The volcanic flank collapse of Fogo (Cape Verdes) 25
Harbitz, C.B., Løvholt, F. and Bungum, H. 2014. Subma- Research, 123, 1035–1059, https://doi.org/10.1002/
rine landslide tsunamis: how extreme and how likely?. 2017JB014959
Natural Hazards, 72, 1341–1374, https://doi.org/10. Le Bas, T.P., Masson, D.G., Holtom, R.T. and Grevemeyer,
1007/s11069-013-0681-3 I. 2007. Slope failures of the flanks of the southern Cape
Harders, R., Kutterolf, S., Hensen, C., Moerz, T. and Verde Islands. In: Lykousis, V., Sakellariou, D. and
Brueckmann, W. 2010. Tephra layers: a controlling fac- Locat, J. (eds) Submarine Mass Movements and Their
tor on submarine translational sliding?. Geochemistry, Consequences. Advances in Natural and Technological
Geophysics, Geosystems, 11, 1–18, https://doi.org/ Hazards Research, 27. Springer, Dordrecht, 337–345,
10.1029/2009GC002844 https://doi.org/10.1007/978-1-4020-6512-5_35
Holm, P.M., Grandvuinet, T., Friis, J., Wilson, J.R., Barker, Le Friant, A., Ishizuka, O., Boudon, G. et al. 2015. Subma-
A.K. and Plesner, S. 2008. An 40Ar-39Ar study of the rine record of volcanic island construction and collapse
Cape Verde hot spot: temporal evolution in a semista- in the Lesser Antilles arc: first scientific drilling of sub-
tionary plate environment. Journal of Geophysical marine volcanic island landslides by IODP Expedition
Research, 113, 1–22, https://doi.org/10.1029/ 340. Geochemistry, Geophysics, Geosystems, 16,
2007JB005339 420–442, https://doi.org/10.1002/2014GC005652
Hornbach, M.J., Manga, M. et al. 2015. Permeability and León, R., Somoza, L. et al. 2017. Multi-event oceanic
pressure measurements in Lesser Antilles submarine island landslides: new onshore-offshore insights from
slides: evidence for pressure-driven slow-slip failure. El Hierro Island, Canary Archipelago. Marine Geology,
Journal of Geophysical Research: Solid Earth, 120, 393, 156–175, https://doi.org/10.1016/j.margeo.
7986–8011, https://doi.org/10.1002/2015JB012061 2016.07.001
Krastel, S., Schmincke, H.-U., Jacobs, C.L., Rihm, R., Le Livanos, I., Nomikou, P., Papanikolaou, D. and Rousakis,
Bas, T.P. and Alibes, B. 2001. Submarine landslides G. 2013. The volcanic debris avalanche on the SE sub-
around the Canary Islands. Journal of Geophysical marine slope of Nisyros volcano, Greece: geophysical
Research, 106, 3977–3998, https://doi.org/10.1029/ exploration and implications for subaerial eruption his-
2000JB900413 tory. Geo-Marine Letters, 33, 419, https://doi.org/10.
Krastel, S., Andrade, M. et al. 2019. The tsunamigenic 1007/s00367-013-0338-y
gravitational flank-collapse of Fogo volcano, Cape Locat, J., Leroueil, S., Locat, A. and Lee, H.J. 2014. Weak
Verde Islands, Seismic pre-site survey for an IODP layers: their definition and classification from a geo-
site on the Cape Verde Plateau, Cruise No. M155, technical perspective. In: Krastel, S. et al. (eds) Subma-
26.05.19–30.06.19, Pointe-à-Pitre (Guadeloupe) – rine Mass Movements and Their Consequences.
Mindelo (Cape Verde). METEOR-Berichte, Gutachter- Advances in Natural and Technological Hazards
panel Forschungsschiffe, Bonn, M155, 1–44, https:// Research, 37. Springer, Cham, 3–12, https://doi.org/
doi.org/10.2312/cr_m155 10.1007/978-3-319-00972-8_1
Karstens, J., Berndt, C. et al. 2019. From gradual spreading Løvholt, F., Pedersen, G., Harbitz, C.B., Glimsdal, S. and
to catastrophic collapse: Reconstruction of the 1888 Kim, J. 2015. On the characteristics of landslide tsuna-
Ritter Island volcanic sector collapse from high- mis. Philosophical Transactions of the Royal Society A,
resolution 3D seismic data. Earth and Planetary Sci- 373, https://doi.org/10.1098/rsta.2014.0376
ence Letters, 517, 1–13, https://doi.org/10.1016/j. Madeira, J., Brum da Silveira, A., Mata, J., Mourão, C. and
epsl.2019.04.009 Martins, S. 2008. The role of mass movements on the
Kuhlmann, J., Huhn, K. and Ikari, M.J. 2016. Do embedded geomorphologic evolution of island volcanoes: exam-
volcanoclastic layers serve as potential glide planes? ples from Fogo and Brava in the Cape Verde archipel-
An integrated analysis from the Gela Basin offshore ago. Comunicações Geológicas, 95, 93–106.
southern Sicily. In: Lamarche, G. et al. (eds) Submarine Madeira, J., Mata, J., Mourão, C., Brum dal Silveira, A.,
Mass Movements and Their Consequences. Advances Martins, S., Ramalho, R. and Hoffman, D.L. 2010.
in Natural and Technological Hazards Research, 41. Volcano-stratigraphic and structural evolution of
Springer, Cham, 273–280, https://doi.org/10.1007/ Brava Island (Cape Verde) based on 40Ar/39Ar, U–Th
978-3-319-20979-1_27 and field constraints. Journal of Volcanology and Geo-
Lafuerza, S., Le Friant, A. and the Expedition 340 Scientific thermal Research, 196, 219–235, https://doi.org/10.
Party 2014. Geomechanical characterizations of subma- 1016/j.jvolgeores.2010.07.010
rine volcano flank sediments, Martinique, Lesser Antil- Madeira, J., Ramalho, R.S., Hoffmann, D.L., Mata, J. and
les Arc. In: Krastel, S. et al. (eds) Submarine Mass Moreira, M. 2019. A geological record of multiple
Movements and Their Consequences. Advances in Nat- Pleistocene tsunami inundations in an oceanic island:
ural and Technological Hazards Research, 37. Springer, the case of Maio, Cape Verde. Sedimentology,
Cham, https://doi.org/10.1007/978-3-319-00972-8_7 https://doi.org/10.1111/sed.12612
Lebas, E., Le Friant, A. et al. 2011. Multiple widespread Marques, F.O., Hildenbrand, A., Victória, S.S., Cunha, C.
landslides during the long-term evolution of a volcanic and Dias, P. 2019. Caldera or flank collapse in the
island: insights from high-resolution seismic data. Fogo volcano? What age? Consequences for risk
Montserrat, Lesser Antilles. Geochemistry, Geophys- assessment in volcanic islands. Journal of Volcanology
ics, Geosystems, 12, https://doi.org/10.1029/2010 and Geothermal Research, 388, 106686. https://doi.
GC003451 org/10.1016/j.jvolgeores.2019.106686
Lebas, E., Le Friant, A., Deplus, C. and de Voogd, B. 2018. Martínez-Moreno, F.J., Monteiro Santos, F.A. et al. 2018.
Understanding the evolution of an oceanic intraplate Investigating collapse structures in oceanic islands
volcano from seismic reflection data: a new model for using magnetotelluric surveys: the case of Fogo Island
La Réunion, Indian Ocean. Journal of Geophysical in Cape Verde. Journal of Volcanology andYou can also read