Computational aspects of psychometrics taught with R and Shiny
←
→
Page content transcription
If your browser does not render page correctly, please read the page content below
Computational aspects of psychometrics
                   taught with R and Shiny

                                          Patrı́cia Martinková1,2
                                            useR!2021, July 5-9
                        1   Institute of Computer Science, Czech Academy of Sciences
                                    2 Faculty of Education, Charles University

Patrı́cia Martinková                useR!2021: Psychometrics taught with R and Shiny   1/20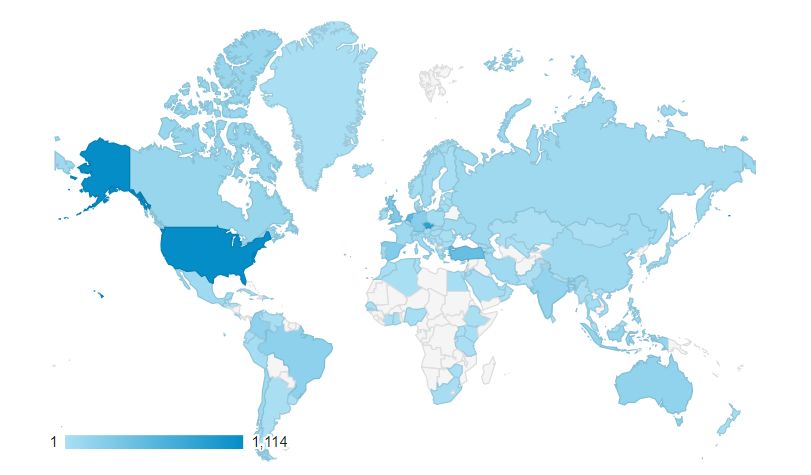
Introduction           ShinyItemAnalysis                                                                              Datasets                                                                                 Psychometrics Book                                             Discussion

 Outline

    1. Introduction: Teaching psychometrics
    2. ShinyItemAnalysis

    3. Real and simulated datasets
                • Reliability and measurement error
                • Differential item functioning
                                                                                                                                                                                                                     Chapman & Hall/CRC

                                                                                                                                                   Computational Aspects of Psychometric Methods
                                                     copy
                                                                                                                                                                                                   Statistics in the Social and Behavioral Sciences Series

                                                                                                                                                                                                     Computational Aspects
                                                                                                                                                                                                     of Psychometric Methods

    4. Book in preparation                                                                                                                                                                           With R

    5. Discussion and conclusion
                                                                                                                                                            Martinková • Hladká
                                                                                                                                                                                                     Patrícia Martinková
                                                                                                                                                                                                     Adéla Hladká

                                                                                                                                      STATISTICS

                                                     w w w. r o u t l e d g e . c o m
                                                     CRC Press titles are available as eBook editions in a range of digital formats

                                            9780367515386_cover_c.indd All Pages                                                                                                                                                                             6/22/21 9:37 AM

Patrı́cia Martinková             useR!2021: Psychometrics taught with R and Shiny                                                                                                                                                                                                  1/20
Introduction ShinyItemAnalysis Datasets Psychometrics Book Discussion
Psychometrics
• Psychometrics deals with the advancement of quantitative
measurement practices in psychology, education, health, and many
other fields
• Psychometric Society https://www.psychometricsociety.org/
• Covers a number of statistical methods that are useful for the
behavioral and social sciences, such as:
• estimation of reliability to deal with the omnipresence of
measurement error
• detailed description of item functioning encompassed in item
response theory (IRT) models
• Number of existing R packages, see CRAN task View
https://CRAN.R-project.org/view=Psychometrics
Patrı́cia Martinková useR!2021: Psychometrics taught with R and Shiny 2/20Introduction ShinyItemAnalysis Datasets Psychometrics Book Discussion
Teaching psychometrics
• Graduate course at University of Washington (2015)
• Graduate courses at Charles University, Prague
• NMST570 Selected topics in psychometrics
• NMST571 Seminar in psychometrics
• Pre-conference workshops, seminars
• Heterogeneous groups of students/participants
• Students of psychology, education, ... and statistics
• Researchers, practitioners from test companies
• Participants of various levels of R proficiency
• Participants of various levels of statistical focus and proficiency
Patrı́cia Martinková useR!2021: Psychometrics taught with R and Shiny 3/20Introduction ShinyItemAnalysis Datasets Psychometrics Book Discussion
Teaching psychometrics with R and ShinyItemAnalysis
Goals:
• Explain psychometric models and methods
• in context of statistics and data science
• Illustrate important computational aspects
• Real and simulated data from various fields
• Provide toolbox of R functions and packages
• Similarities/differences across different packages
• Make procedures and concepts better available
• Interactive application of the ShinyItemAnalysis package
Patrı́cia Martinková useR!2021: Psychometrics taught with R and Shiny 4/20Introduction ShinyItemAnalysis Datasets Psychometrics Book Discussion
ShinyItemAnalysis
Software for psychometric analysis of educational tests, psychological
assessments, health-related and other types of multi-item measurements
• R package
• Version 1.3.7 on CRAN , newest version on GitHub
• Interactive shiny application
• Accessible locally from R with startShinyItemAnalysis()
• Online at ICS server and shinyapps.io
https://shiny.cs.cas.cz/ShinyItemAnalysis/
https://cemp.shinyapps.io/ShinyItemAnalysis/
Martinková and Drabinová (2018). ShinyItemAnalysis for teaching psychometrics and to
enforce routine analysis of educational tests. The R Journal. 10(2), 503–515.
https://doi.org/10.32614/RJ-2018-074
Patrı́cia Martinková useR!2021: Psychometrics taught with R and Shiny 5/20Introduction ShinyItemAnalysis Datasets Psychometrics Book Discussion
R package ShinyItemAnalysis downloads from CRAN
40 000
30 000
cumulative count
20 000
10 000
0
2017 2018 2019 2020 2021
date
Patrı́cia Martinková useR!2021: Psychometrics taught with R and Shiny 6/20Introduction ShinyItemAnalysis Datasets Psychometrics Book Discussion ShinyItemAnalysis online app is used worldwide! Patrı́cia Martinková useR!2021: Psychometrics taught with R and Shiny 7/20
Introduction ShinyItemAnalysis Datasets Psychometrics Book Discussion
Interactive application
Data Scores Validity Reliability Item analysis Regression IRT models DIF/Fairness Reports
Welcome
Welcome to ShinyItemAnalysis!
ShinyItemAnalysis is an interactive online application for the psychometric analysis of educational tests, psychological assessments, health-related and other types
of multi-item measurements, or ratings from multiple raters, built on R and shiny. You can easily start using the application with the default toy dataset. You may
also select from a number of other toy datasets or upload your own in the Data section. Offered methods include:
Exploration of total and standard scores in the Summary section
Analysis of measurement error in the Reliability section
Correlation structure and criterion validity analysis in the Validity section
Item and distractor analysis in the Item analysis section
Item analysis with regression models in the Regression section
Item analysis by item response theory models in the IRT models section
Detection of differential item functioning in the DIF/Fairness section
All graphical outputs and selected tables can be downloaded via the download button. Moreover, you can automatically generate a HTML or PDF report in the
Reports section. All offered analyses are complemented by selected R codes which are ready to be copied and pasted into your R console, therefore a similar
analysis can be run and modified in R.
Visit the www.ShinyItemAnalysis.org webpage to learn more about ShinyItemAnalysis!
Patrı́cia Martinková useR!2021: Psychometrics taught with R and Shiny 8/20Introduction ShinyItemAnalysis Datasets Psychometrics Book Discussion
ShinyItemAnalysis: Newest developments
• New features of the interactive application
• New toy data, new data types allowed for one’s own upload
• Validity: New corrplot, dendrograms, factor analysis
• Reliability: Inter-rater reliability in restricted samples
• Traditional item analysis: Item criterion validity
• Regression models: Models for polytomous data
• IRT models: reorganized
• DIF: polytomous data, uploaded matching criterion
• Interactive training sections with exercises
• All plots interactive, created with plotly
• Downloadable plots, tables and reports
• Sample R code
Patrı́cia Martinková useR!2021: Psychometrics taught with R and Shiny 9/20Introduction ShinyItemAnalysis Datasets Psychometrics Book Discussion
Toy datasets
• Number of toy datasets, upload of one’s own data is possible
Upload your own datasets
Here you can upload your own dataset. Select all necessary files and use the Upload data button on bottom of this page.
The main data file should contain the responses of individual respondents (rows) to given items (columns). Data need to
Choose data (CSV file) be either binary, nominal (e.g. in ABCD format), or ordinal (e.g. in Likert scale). The header may contain item names,
however, no row names should be included. In all data sets, the header should be either included or excluded. Columns
Browse... HCI_ABCD.csv
of dataset are by default renamed to the Item and number of a particular column. If you want to keep your own names,
Upload complete check the box Keep item names below. Missing values in scored dataset are by default evaluated as 0. If you want to
keep them as missing, check the box Keep missing values below.
Type of data Separator Quote Data specification
Binary Comma None Header
Nominal Semicolon Double Quote
Keep item names
Ordinal Tab Single Quote
Missing values
Keep missing values
For nominal data, it is necessary to upload key of correct answers.
Choose key (CSV file)
Browse... HCI_key.csv
Upload complete
Group is a variable for DIF and DDF analyses. It should be a binary vector, where 0 represents the reference group and
Choose group (optional) 1 represents the focal group. Its length needs to be the same as the number of individual respondents in the main
dataset. Missing values are not supported for the group variable and such cases/rows of the data should be removed.
Browse... HCI_group.csv
Patrı́cia Martinková useR!2021: Psychometrics taught with R and Shiny 10/20Introduction ShinyItemAnalysis Datasets Psychometrics Book Discussion
Interactive training sections
• Interactive training sections for IRT models and DIF
Parameters Data Scores Validity Reliability Item analysis Regression IRT models DIF/Fairness Reports
Select parameters a (discrimination), b (difficulty), c (guessing), and d (inattention). By constraining a = 1 ,c = 0 ,d = 1 you get the Rasch model. With option c = 0
and d = 1 you get the 2PL model, and with option d = 1 the 3PL model.
DIF training
a - discrimination b - difficulty c - guessing d - inattention
-4 1 4 -4 0 4 0 1 0 1
In this section, you can explore the group-specific model for testing differential item functioning among two groups - reference and focal.
Parameters
-4 -3.2 -2.4 -0.8 0 0.8 1.6 2.4 3.2 4 -4 -3.2 -2.4 -0.8 0 0.8 1.6 2.4 3.2 4 0 0.1 0.2 0.3 0.4 0.5 0.6 0.7 0.8 0.9 1 0 0.1 0.2 0.3 0.4 0.5 0.6 0.7 0.8 0.9 1
Select parameters a (discrimination) and b (difficulty) for an item given by 2PL IRT model for reference and focal group. When the item parameters for the
a - discrimination b - difficulty c - guessing d - inattention reference and the focal group differ, this phenomenon is termed differential item functioning.
-4 2 4 -4 0.5 4 0 1 0 1
aR - discrimination bR - difficulty aF - discrimination bF - difficulty
-4 -3.2 -2.4 -0.8 0 0.8 1.6 2.4 3.2 4 -4 -3.2 -2.4 -0.8 0 0.8 1.6 2.4 3.2 4 0 0.1 0.2 0.3 0.4 0.5 0.6 0.7 0.8 0.9 1 0 0.1 0.2 0.3 0.4 0.5 0.6 0.7 0.8 0.9 1 0 1 4 -4 -0.5 4 0 2.5 4 -4 0 4
You may also select the value of latent ability θ to obtain the interpretation of the item characteristic curves for this ability.
0 0.4 0.8 1.2 1.6 2 2.4 2.8 3.2 3.6 4 -4 -3.2 -2.4 -1.6 -0.8 0 0.8 1.6 2.4 3.2 4 0 0.4 0.8 1.2 1.6 2 2.4 2.8 3.2 3.6 4 -4 -3.2 -2.4 -1.6 -0.8 0 0.8 1.6 2.4 3.2 4
θ - latent ability
-4 0 4
You may also select the value of latent ability θ to obtain the interpretation of the item characteristic curves for this ability.
-4 -3.2 -2.4 -0.8 0 0.8 1.6 2.4 3.2 4
θ - latent ability
-4 -0.5 4
Equations
a(θ−b) -4 -3.2 -2.4 -1.6 -0.8 0 0.8 1.6 2.4 3.2 4
e
P (Y = 1|θ) = π(θ) = c + (d − c) ⋅
a(θ−b)
1+e
2 2
Interpretation: In the reference group, a respondent with the ability θ = −0.5 has the probability of the correct answer to an item with parameters a = 1 ,
′ 2 2
(π(θ) ) a ⋅ (π(θ) − c) ⋅ (d − π(θ))
b = −0.5 , c = 0 , and d = 1 equal to 0.50. In the focal group, a respondent with the ability θ = −0.5 has the probability of the correct answer to an item with
I (θ) = =
π(θ)(1 − π(θ)) π(θ) ⋅ (1 − π(θ)) (d − c)
2
parameters a = 2.5 , b = 0 , c = 0 , and d = 1 equal to 0.22.
Interpretation: The probability of the correct answer with the latent ability θ = 0 in the red item with parameters a = 1 , b = 0 , c = 0 , and d = 1 is equal to 0.50.
The information for the latent ability θ = 0 in the red item is equal to 0.25. The probability of the correct answer with the latent ability θ = 0 in the blue item with
parameters a = 2 , b = 0.5 , c = 0 , and d = 1 is equal to 0.27. The information for the latent ability θ = 0 in the blue item is equal to 0.79. 1.00
Probability of correct answer
Note that for 1PL and 2PL models, the item information is the highest at θ = b . This is not necessarily the case for 3PL and 4PL models.
0.75
Item characteristic curve Item information function
Probability of correct answer
1.00 4
0.50
0.75 3
Information
0.25
0.50 2
0.00
0.25 1 -4 -2 0 2 4
Ability
0.00 0
-4 -2 0 2 4 -4 -2 0 2 4
Ability Ability
Patrı́cia Martinková useR!2021: Psychometrics taught with R and Shiny 11/20Introduction ShinyItemAnalysis Datasets Psychometrics Book Discussion
Interactive training sections – check your understanding
• Interactive quizzes for IRT models and DIF
Exercise 1
Consider the following 2PL items with parameters
Item 1: a = 2.5, b = −0.5
Item 2: a = 1.5, b = 0
For these items fill in the following exercises with an accuracy of up to 0.05, then click on the Submit answers button. If you need a hint, click on the blue button with
a question mark.
Sketch the item characteristic and information curves. ✖
Calculate the probability of a correct answer for latent abilities θ = −2, −1, 0, 1, 2 .
Item 1: θ = −2 ✔ θ = −1 ✖ θ = 0 ✖ θ = 1 ✖ θ = 2 ✖
0 0 0 0 0
Item 2: θ = −2 ✔ θ = −1 ✖ θ = 0 ✖ θ = 1 ✖ θ = 2 ✖
0 0 0 0 0
For what level of ability θ are the probabilities equal?
θ = ? ✖
0
Which item provides more information for weak (θ = −2 ), average (θ = 0 ) and strong (θ = 2 ) students?
θ = −2 Item 1 Item 2 ✔
θ = 0 Item 1 Item 2 ✔
θ = 2 Item 1 Item 2 ✖ 27% correct. Try again.
Submit answers
Patrı́cia Martinková useR!2021: Psychometrics taught with R and Shiny 12/20Introduction ShinyItemAnalysis Datasets Psychometrics Book Discussion
Automatic report generation
• Generating PDF/HTML reports for uploaded data
• using R Markdown
Patrı́cia Martinková useR!2021: Psychometrics taught with R and Shiny 13/20Introduction ShinyItemAnalysis Datasets Psychometrics Book Discussion
ShinyItemAnalysis: Newest developments
• New ShinyItemAnalysis package functions and functionalities
• startShinyItemAnalysis() now using rstudioapi, runs as
”Local job” in Jobs RStudio IDE pane,
keeping the console available for trying sample R code
• Testing of the online app on collection of datasets, unit tests using
testthat
• Refactoring the code using shiny modules, following the best
practices with golem
• Dealing with high number of dependencies
Patrı́cia Martinková useR!2021: Psychometrics taught with R and Shiny 14/20Introduction ShinyItemAnalysis Datasets Psychometrics Book Discussion
Datasets demonstrating computational aspects: IRR
• Why zero inter-rater reliability estimates are plausible under
restricted range
• Statistical explanation: When proposal range is restricted by
perceived quality, the between-proposal variance of peer review
scores τ 2 decreases.
• Interactive illustration offered in ShinyItemAnalysis with the
AIBS dataset.
• Animation created with the gganimate package.
Erosheva, Martinkova, and Lee (2021). When zero may not be zero: A cautionary note on
the use of inter-rater reliability in evaluating grant peer review. JRSS – A.
doi 10.1111/rssa.12681
Patrı́cia Martinková useR!2021: Psychometrics taught with R and Shiny 15/20IRR in restricted range: Animation
Introduction ShinyItemAnalysis Datasets Psychometrics Book Discussion
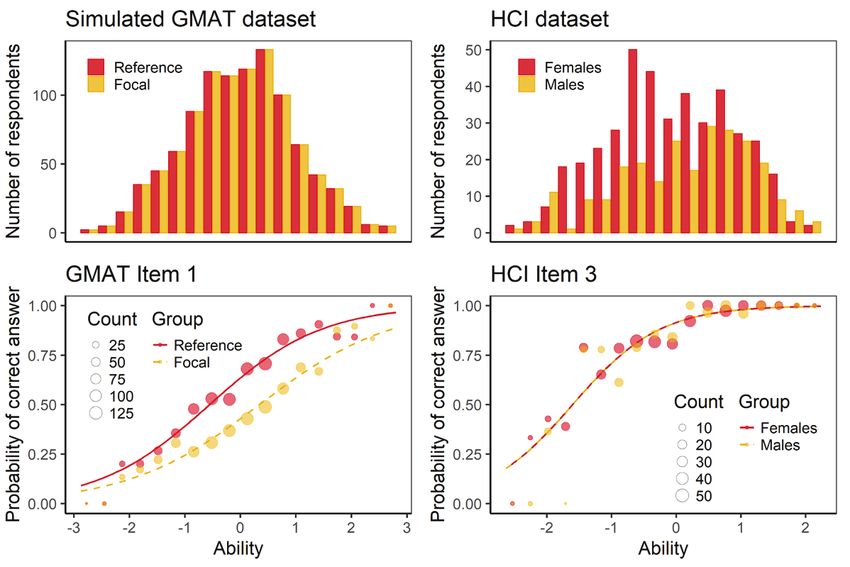
Datasets demonstrating computational aspects: DIF
• Differential item functioning (DIF) analysis may provide deeper
understanding to test functioning among groups.
Martinková et al. (2017). Checking Equity: Why DIF Analysis should be a Routine Part of
Developing Conceptual Assessments. CBE-LSE, 16(2), rm2. doi 10.1187/cbe.16-10-0307
Patrı́cia Martinková useR!2021: Psychometrics taught with R and Shiny 16/20Introduction ShinyItemAnalysis Datasets Psychometrics Book Discussion
DIF in longitudinal designs
DIF-C can provide proof of instructional sensitivity, even when
differences in change are not visible in total scores.
Martinková, Hladká, and Potužnı́ková (2020). Is academic tracking related to gains in
learning competence? Using propensity score matching and differential item change
functioning analysis for better understanding of tracking implications. Learning and
Instruction, 66, 101286. doi: 10.1016/j.learninstruc.2019.101286
Patrı́cia Martinková useR!2021: Psychometrics taught with R and Shiny 17/20Introduction ShinyItemAnalysis Datasets Psychometrics Book Discussion
DIF and DIF-C analysis available in ShinyItemAnalysis
• DIF and DIF-C analysis with difNLR package
Data Scores Validity Reliability Item analysis Regression IRT models DIF/Fairness Reports Data Scores Validity Reliability Item analysis Regression IRT models DIF/Fairness Reports
Observed scores Summary Items
DIF analysis may come to a different conclusion than a test of group differences in total scores. Two groups may have the same distribution of total scores, yet,
some items may function differently for the two groups. Also, one of the groups may have a significantly lower total score, yet, it may happen that there is no DIF
Generalized logistic regression
item (Martinkova et al., 2017). This section examines the differences in observed scores only. Explore further DIF sections to analyze differential item functioning. Generalized logistic regression models are extensions of a logistic regression method which account for the possibility of guessing by allowing for nonzero lower
asymptote - pseudo-guessing ci (Drabinova & Martinkova, 2017) or an upper asymptote lower than one - inattention di . Similarly to logistic regression, its
In DIF analysis, the groups are compared in functioning of items with respect to respondent ability. In many methods, observed ability such as the standardized
extensions also provide detection of uniform and non-uniform DIF by letting the difficulty parameter bi (uniform) and the discrimination parameter ai (non-uniform)
total score is used as the matching criterion. DIF can also be explored with respect to other observed score or criterion. For example, to analyze instructional
differ for groups and by testing for the difference in their values. Moreover, these extensions allow for testing differences in pseudo-guessing and inattention
sensitivity, Martinkova et al. (2020) analyzed differential item functioning in change (DIF-C) by analyzing DIF on Grade 9 item answers while matching on Grade 6
parameters and they can be seen as proxies of 3PL and 4PL IRT models for DIF detection.
total scores of the same respondents in a longitudinal setting (see toy data Learning to Learn 9 in the Data section).
Observed score Method specification
Here you can specify the assumed model. In 3PL and 4PL models, the abbreviations cg or dg mean that parameters c or d are assumed to be the same for both
Uploaded
groups, otherwise they are allowed to differ. With type you can specify the type of DIF to be tested by choosing the parameters in which a difference between
groups should be tested. You can also select correction method for multiple comparison or item purification.
Summary of uploaded variable for groups Finally, you may change the Observed score. While matching on the standardized total score is typical, the upload of other observed scores is possible in the
Data section. Using a pre-test (standardized) total score allows for testing differential item functioning in change (DIF-C) to provide proofs of instructional sensitivity
n Min Max Mean Median SD Skewness Kurtosis
(Martinkova et al., 2020), also see Learning To Learn 9 toy dataset. For selected item you can display plot of its characteristic curves and table of its estimated
Reference group (0) 391 5.00 37.00 20.64 20.00 5.24 0.23 3.21 parameters with standard errors.
Focal group (1) 391 5.00 37.00 20.64 20.00 5.24 0.23 3.21 Model Type Correction method Observed score Item
a 1 29 41
3PLcg None Standardized uploaded
Histograms of uploaded variable for groups b
1 5 10 14 19 23 28 32 37 41
c Item purification
d
40
Plot with estimated DIF generalized logistic curve
Number of respondents
30 Points represent a proportion of the correct answer (empirical probabilities) with respect to the observed score. Their size is determined by the count of
respondents who achieved a given level of observed score with respect to the group membership.
Item6B_9
20
Probability of correct answer
1.00
10
0.75
0
0.50
10 20 30
Observed score
0.25
0.00
-2 0 2 4
Matching criterion
Hladká and Martinková (2020). difNLR: Generalized logistic regression models for DIF and
DDFdetection. The R Journal, 12(1), 300–323. doi: 10.32614/RJ-2020-014
Patrı́cia Martinková useR!2021: Psychometrics taught with R and Shiny 18/20Introduction ShinyItemAnalysis Datasets Psychometrics Book Discussion
Book planned for publication in 2022
Chapman & Hall/CRC
Computational Aspects of Psychometric Methods
copy
Statistics in the Social and Behavioral Sciences Series
• Deeper understanding to psychometric
Computational Aspects
models and methods of Psychometric Methods
With R
• For a wide audience
• Accompanied by sample R code,
practical examples and datasets
Martinková • Hladká
• Each chapter includes a section Patrícia Martinková
Adéla Hladká
presenting the analysis with respective w w w. r o u t l e d g e . c o m
STATISTICS
CRC Press titles are available as eBook editions in a range of digital formats
tab of the ShinyItemAnalsyis
interactive application 9780367515386_cover_c.indd All Pages 6/22/21 9:37 AM
Patrı́cia Martinková useR!2021: Psychometrics taught with R and Shiny 19/20Introduction ShinyItemAnalysis Datasets Psychometrics Book Discussion
Discussion
• Teaching computational aspects of Chapman & Hall/CRC
Computational Aspects of Psychometric Methods
copy
Statistics in the Social and Behavioral Sciences Series
psychometrics with R and
Computational Aspects
ShinyItemAnalysis of Psychometric Methods
With R
• Demonstrating the power of R
• Importance of sample R code within
the Shiny app
Martinková • Hladká
• Importance of relevant simulated and Patrícia Martinková
Adéla Hladká
real data examples STATISTICS
w w w. r o u t l e d g e . c o m
CRC Press titles are available as eBook editions in a range of digital formats
• Stay tuned for the new book!
9780367515386_cover_c.indd All Pages 6/22/21 9:37 AM
Patrı́cia Martinková useR!2021: Psychometrics taught with R and Shiny 20/20Thank you for your attention!
www.cs.cas.cz/martinkova
Acknowledgements:
• Czech Science Foundation grant 21-03658S
• Technology Agency of the Czech Republic grant TL05000008
• Computational Psychometrics Group: https://www.cs.cas.cz/comps/References
Erosheva, E. A., Martinkova, P., & Lee, C. J. (2021). When zero may not be zero: A cautionary note on
the use of inter-rater reliability in evaluating grant peer review. Journal of the Royal Statistical
Society – Series A. doi: 10.1111/rssa.12681
Hladká, A., & Martinková, P. (2020). difNLR: Generalized logistic regression models for DIF and DDF
detection. The R Journal, 12(1), 300–323. doi: 10.32614/RJ-2020-014
Martinková, P., & Drabinová, A. (2018). ShinyItemAnalysis for teaching psychometrics and to enforce
routine analysis of educational tests. The R Journal, 10(2). doi: 10.32614/RJ-2018-074
Martinková, P., Drabinová, A., Liaw, Y.-L., Sanders, E. A., McFarland, J. L., & Price, R. M. (2017).
Checking equity: Why differential item functioning analysis should be a routine part of developing
conceptual assessments. CBE—Life Sciences Education, 16(2), rm2. doi:
10.1187/cbe.16-10-0307
Martinková, P., Hladká, A., & Potužnı́ková, E. (2020). Is academic tracking related to gains in learning
competence? Using propensity score matching and differential item change functioning analysis
for better understanding of tracking implications. Learning and Instruction, 66, 101286. doi:
j.learninstruc.2019.101286You can also read