Contemporary mass balance on a cold Eastern Alpine ice cap as a potential link to the Holocene climate
←
→
Page content transcription
If your browser does not render page correctly, please read the page content below
www.nature.com/scientificreports
OPEN Contemporary mass balance
on a cold Eastern Alpine ice cap
as a potential link to the Holocene
climate
Andrea Fischer1*, Martin Stocker‑Waldhuber1, Martin Frey3 & Pascal Bohleber1,2
Alpine cold ice caps are sensitive indicators of local climate. The adequate interpretation of this
information in an ice core requires detailed in situ glaciological and meteorological records, of which
there are few. The Weißseespitze summit ice cap (3499 m) presents an ideal case to compare past and
present climate and mass balance, with limited ice flow, but close to 6000 years locked into about
10 m of ice. First-ever meteorological observations at the ice dome have revealed that over 3 years of
observation most of the accumulation took place between October and December and from April to
June. In the colder winter months, between January and March, wind erosion prevents accumulation.
Melt occurred between June and September, ice was only affected during short periods, mainly in
August, which caused ice losses of up to 0.6 m (i.e. ~ 5% of the total ice thickness). Historical data
points at a loss of of 34.9 ± 10.0 m between 1893 and 2018 and almost balanced conditions between
1893 and 1914. The local evidence of ice loss lays the basis for the interpretation of past gaps in the ice
core records as past warm/melt events.
Glaciers are icons and indicators of climate change and mitigation efforts1. The current Central European glacier
nprecedented2 and results in large-scale down-wasting3. Therefore, records of past and pre-
retreat is historically u
sent glacier state and fate are important, not only for science but also for society. Current monitoring is designed
to cope with the role of glaciers as essential indicators of past climate c onditions4. In the European Alps, records
ack5 and thus offer the most direct link between instrumental data and glacier area
of glacier variability go far b
or mass balance as proxy records of climate. Climate information from Alpine glaciers includes past terminus
positions recorded in the positions of moraines deposited during past glacier a dvances6, the structure and age
of glacial d eposits7, measured length changes as well as total and point mass balances. The timing and extent of
glacier advances is greatly influenced by topography and d ynamics8, and so are proxy data of terminus positions.
The role of glaciers as climate archives is unique. It ranges from establishing the idea of a changing c limate9
to polar ice cores as cornerstone archives of past climate and atmospheric composition10. With the deposition of
snow, additional properties of the atmospheric composition are archived (aerosols, stable water isotopes, etc.).
In the absence of prolonged mass loss, a chemical and structural stratification of ice exists which makes up the
paleoclimatic record that can be accessed by drilling ice cores. However, ice core records from the polar regions
are not necessarily representative for middle and low latitudes, especially for short-lived atmospheric constituents.
At least for the Holocene period, important complementary information can come from ice cores drilled at
cold (non-temperate) glaciers and ice caps of high mountain ranges in nonpolar a reas11. In the European Alps,
ice core research aimed at continuous stratigraphic climate records focused on a few suitable drilling sites in the
Western Alps. There, in locations above 4000 m, the low infiltration depth of (refreezing) meltwater, if it occurs
at all, allows the preservation of the original layering of the a ccumulation12.
Recent studies have shown that also in the Eastern Alps, and at elevations below 4000 m, millennial-old ice
and associated climate records may be p reserved13–15, sparking new efforts to retrieve this valuable paleoclimatic
information which is currently threatened by w arming16,17. In view of the predominant mass loss even at the
summits of such sites, it is paramount to also take into account the role of surface mass balance in the interpreta-
tion of the associated ice core records. This opens up a new field of research questions, linking mass and energy
balance consideration and modelling efforts to aid the interpretation of ice core r ecords17.
1
Institute for Interdisciplinary Mountain Research, Austrian Academy of Sciences, Innsbruck, Austria. 2Department
for Environmental Science, Informatics and Statistics, Ca’Foscari University of Venice, Venice, Italy. 3Poschenhof,
Kaunertal, Austria. *email: andrea.fischer@oeaw.ac.at
Scientific Reports | (2022) 12:1331 | https://doi.org/10.1038/s41598-021-04699-2 1
Vol.:(0123456789)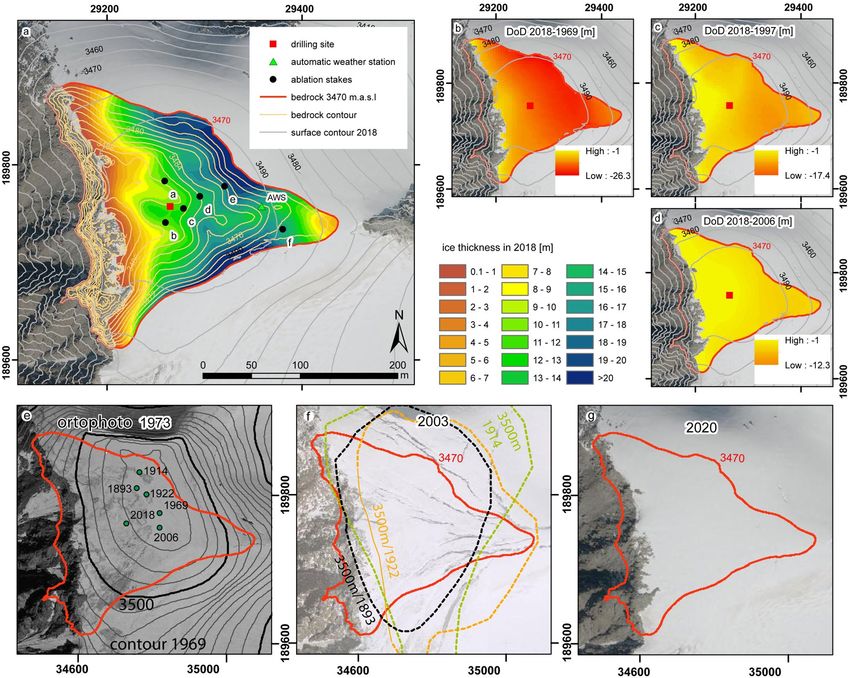
www.nature.com/scientificreports/
Figure 1. (a) The drilling site at the summit glacier at Weißseespitze (red square) is part of Gepatschferner
(GPF); on neighbouring Kesselwandferner glacier Austria’s previously highest altitude stakes have been operated
since the late 1960s; (b) ice thickness has been measured with GPR, ablation stakes were drilled (a–f), an
automatic weather station (AWS) was installed and an ice core was drilled in March 2018 (15). Photos from the
north (c) and east (d) show the summit ice cap at Weißseespitze (viewing directions: yellow arrows in (a). The
visual ice core stratigraphy (e) shows a dark layer and bandings of variable inclination and bubble density. The
relation of these features with regards to an atmospheric or glaciological origin remains unclear. Only a detailed
understanding of the physical processes governing the mass balance can fill this gap. This figure was created with
Adobe Illustrator CS4 version 14.0.0 (www.adobe.com). The maps were compiled with ArcMap 10.6.1 (www.
arcgis.com).
Direct mass balance measurements on summit glaciers complement paleo-mass balances derived from ice
cores18, supported by numerical m odelling17. As the age-depth profile of ice cores is not only relevant for paleo-
hydrology and glaciology, but also for the interpretation of ice core records, this becomes a field of major
significance.
Geodetic or direct mass balances of glaciers include a feedback from glacier geometry. Several authors have
presented methods to estimate the influence of those geometrical feedbacks, such a s19,20. Strategies employing
reference surfaces21,22 and point mass b alances23 aim to discount the topographical and dynamical components.
The logical consequence of such attempts is studying point mass balances at cold summit glaciers, which are
frozen to the ground and thus almost stagnant. So far, only very few summit stakes have been installed within
traditional and long-term mass balance programs. During the 1960s to 1980s, when most of today’s benchmark
glacier in situ programs started, it took immense efforts to dig out and replace the stakes, so numbers were kept
to a minimum. These point mass balance data sets, often unpublished and difficult to find, have already been
compiled for the Swiss A lps24. For the Austrian Alps, single high elevation stakes have been in operation, e.g. at
Kesselwandferner glacier (3494 m, Fig. 125) from 1968 to 1983 and at Übergossene Alm (2850 m) from 1965 to
197526. Thickness records at least are available from repeat cartographic campaigns, where the summit elevation
was often measured directly, e.g. for the Weißseespitze summit (3531 m anno 1922) at Gepatschferner glacier27.
Scientific Reports | (2022) 12:1331 | https://doi.org/10.1038/s41598-021-04699-2 2
Vol:.(1234567890)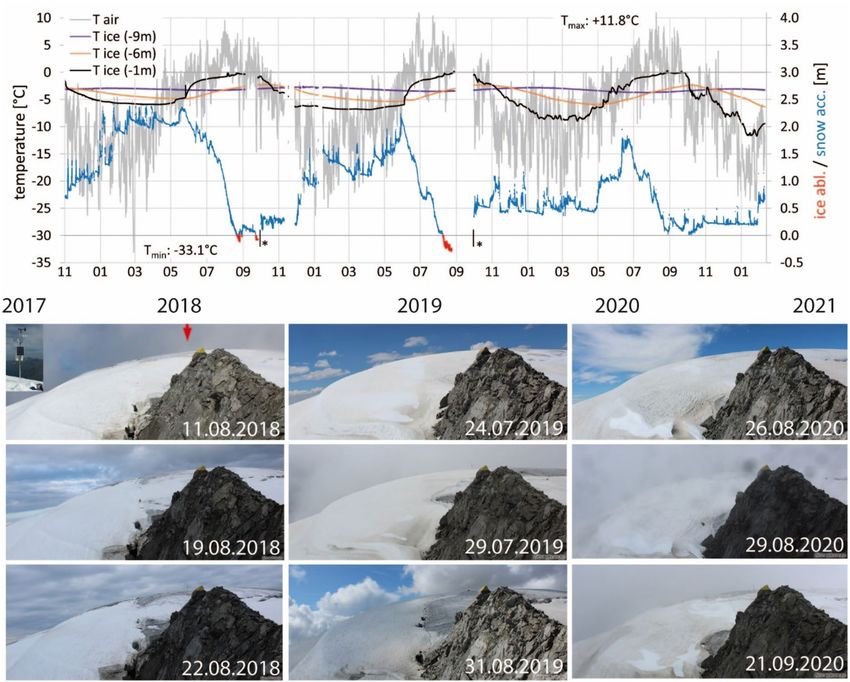
www.nature.com/scientificreports/
In the Western Alps, several prominent glaciers in summit locations have been investigated in detail, for
example in the Monte Rosa and Mont Blanc r egion28–30. Although high-elevation glaciers, especially in the
Western Alps, were remarkably untouched by global w arming31, englacial warming has been recorded despite
insignificant volume changes32. Glacier outlet floods of meltwater trapped by still cold glacier parts also threaten,
as happened at the Tête Rousse glacier c avity33.
The present paper analyses present mass balance and more than a century of thickness change evidence as a
basis for the detailed interpretation of the stratigraphy of the ice core drilled at Weißseespitze (3499 m, Fig. 1).
The ‘present’ direct mass balance and thickness changes were recorded during 3 years at subseasonal resolution
and set a baseline for the last ~ 125 years of ice elevation changes from geodetic data. This first presentation of
mass loss data is compared in detail to the meteorological conditions measured at the summit, published previ-
ously as an overview, and to the total thickness of the remaining ice cap comprising nearly 6000 years of ice 15.
Constraining the contemporary annual and decadal mass balance and its relation to instrumental climate
data is a necessary and important step to link the ice core stratigraphy potentially representing past mass bal-
ances and past climate. This scientific effort is important to identify how and in what way current processes are
potentially unprecedented. This study contributes to our understanding of present glaciological processes on
summits, the respective meteorological conditions and their variability to improve the interface to past mass
balance archived in summit ice cores.
Results
Meteorological conditions at the summit 2018–2020. The meteorological conditions at the summit
were recorded at the automatic weather station (AWS) between November 2017 and February 2021 (Fig. 2).
The mean annual air temperature was − 7.6 °C in 2018 and − 6.1 °C in 2019 and 2020, with an absolute mini-
mum of − 33.1 °C and a maximum of 11.8 °C. Only very limited increase in snow cover was recorded between
27.01.2018–11.04.2018, 17.12.2018–02.05.2019 and 22.10.2019–27.04.2020. During cold conditions, snow accu-
mulation seems to be limited by wind erosion (Fig. S1). Snow height increases mainly between October and
December and in June (Fig. 2). The three ice temperatures at different depths show a seasonal signal. Mean
annual ice temperature at the lowest sensor is around − 3.3 °C, maximum values do not exceed − 2.6 °C (Table S1).
In situ mass balance. Glacier mass balance measurements at Weißseespitze summit comprise automatic
measurements of snow height and ice thickness loss in subdaily resolution at the AWS and stake measurements
in subseasonal resolution. During the 3 years of observation, snow height maximum values appeared in May
and June, with an all out maximum snow depth of 2.4 m recorded in May 2018. During winter 2019/2020, snow
height was around 0.5 m until May and reached its maximum with 2.2 m in June. Winter 2020/2021 presents a
similar pattern, with less than 0.5 m snow height until February.
Continuous records of ice ablation indicate the duration of the ablation season and the magnitude of ice melt
at the AWS. Data gaps cause an underestimation of the seasonal ablation values measured, with 0.11 m in 2018
and 0.29 m in 2019. The length of the ablation season at the weather station was corrected by time-lapse camera
images. No ablation was recorded at the AWS during summer 2020.
At the ablation stakes, the spatial pattern of ice ablation is highly variable between years depending on the
weather conditions and snow accumulation patterns (Fig. 2), as evidenced by stakes c and f. There we recorded
similar ice melt in 2017 and 2018, but not in 2019 (Table 1). The positions of the stakes were recorded several
times a year with DGPS, together with fixed control points in the surrounding area. The stake positions did not
change within the DGPS accuracy, proving the stagnancy of the ice dome at the summit above the bergschrund.
Ice thickness distribution, subsurface topography and volume changes. The Weißseespitze sum-
mit forms a glacier dome with circular contour lines from about 3470–3500 m (Fig. 1). A bergschrund reveals
the stagnant summit region (Fig. 3). From the top, the ice thickness increases sharply towards the north-eastern
and the south-eastern part and shrinks to zero towards the ridge of the west face. In 2018 the mean ice thickness
above the 3470 m bedrock contour was 12.1 m, when the maximum altitude of the glacier summit surface was
3499 m. The maximum elevation from DEMs in 1969 is given as 3518 m (Table 2). Maximum elevations from
historical maps suggest an LIA maximum (1855 AD) elevation only slightly above 3534 m (Table S2). The posi-
tion of the highest point at the summit has shifted within a distance of about 100 m (Fig. 3). Currently the highest
point is located just a few metres from the drilling site.
The maps of thickness changes show greatest losses from the north-eastern to the south-eastern sector and
smallest losses towards the west face (Fig. 3). The mean elevation changes for the area above the 3470 m bedrock
contour line (Fig. 3) range from − 0.3 (2006–1997) to − 0.2 m (2018–2006) per year. From 1969 to 2018, the
longest available period covered by modern DEMs, the mean elevation changed by − 15.5 m (Table S3). During
this period, the summit area lost 56% of its ice volume. The total remaining ice volume in 2018 is 0.38 × 10⁶ m3
(Table S2).
In the historical maps, the maximum thickness change was directly measured. The spacing of the manually
interpolated contour lines of altitude in the historical map varies between 10 and 50 m. This causes an uncertainty
about the shape of the summit, which can be greater than the expected altitude change. Therefore, we used the
directly measured maximum altitude, indicated by respective map symbols, as a proxy to estimate long-term
changes in mean thickness (Table 2).
Historical climate records as a baseline for modern in situ data. Mean summer temperatures have
been known as indicators of glacier melt for more than 100 years, even though on Alpine glaciers the main
source of energy governing glacier melt stems from direct radiation38. Climate change impact on mass balance
Scientific Reports | (2022) 12:1331 | https://doi.org/10.1038/s41598-021-04699-2 3
Vol.:(0123456789)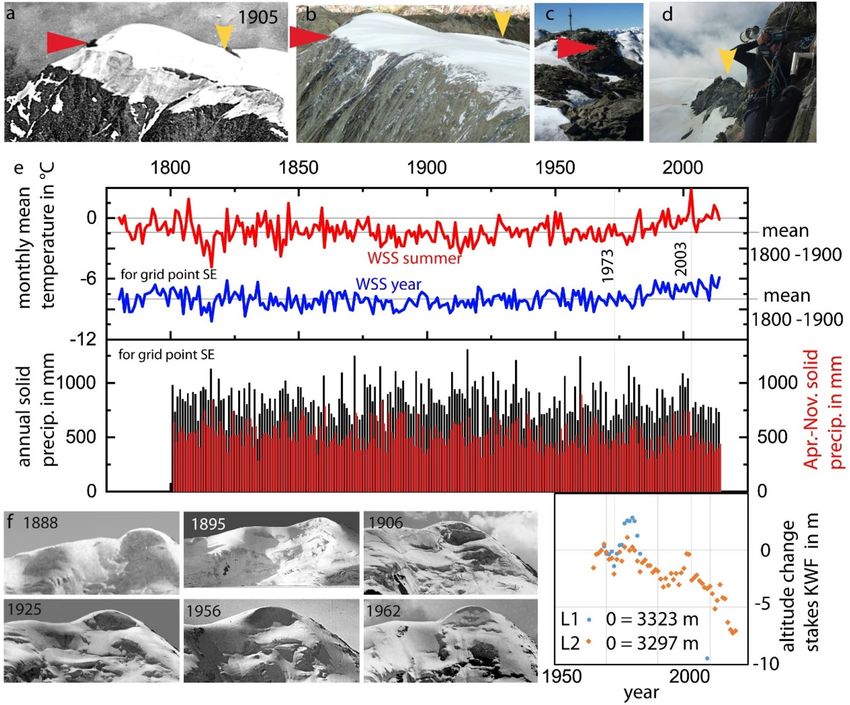
www.nature.com/scientificreports/
Figure 2. Air temperature (T air) and ice temperatures (T ice) at different depths related to the 2017 ice surface,
from November 2017 to February 2021, as well as the minimum and maximum temperature for the whole
period. Snow accumulation and ice ablation measured with the sonic ranging sensor refer to the right ordinate
axis. Ice ablation (red lines) took place from 22.08.2018 to 27.08.2018 and 09.08.2019 to 31.08.2019 2019 (end of
period reconstructed from camera images) (*). In 2020, no ice melted at the location of the AWS. New distance
to surface correction of the sonic ranging sensor sets the ice surface to zero. The pattern of mass balance is
visible on the time-lapse camera images (positon of the AWS indicated by the red arrow).
a b c d e f Drilling site AWS mean max Sh in m
2017 0.54 0.76 0.65
2018 0.95 0.82 0.81 0.61 0.28 0.83 0.11 0.63 2.43
2019 0.40 0.00 0.63 0.43 0.75 0.00 0.26 0.29 0.35 2.24
2020 0.00 0.23 0.00 0.00 0.08 0.00 0.00 0.00 0.04 1.80
Table 1. Annual surface ablation measured at stakes a-f and at the drilling site [m ice] as well as the ice
ablation and maximum snow height (max Sh) from the sonic ranging sensor at the automatic weather station
(AWS). The AWS values are generally too low due to data gaps towards the end of the ablation seasons (Fig. 2).
recipitation39. For Weißseespitze,
is described by changes in the sum of positive daily temperature means and p
gridded Historical Instrumental climatological Surface Temperature and precipitation time series of the Greater
Alpine Region (HISTALP) is available only as monthly means/sums for 1800–2014 (Fig. 4).
We compared the mass balance records to AWS data to find out if local ice melt is indicated by monthly
mean temperatures. In a second step, the AWS records were compared to long-term HISTALP data to find if the
monthly or seasonal means directly measured at WSS exceed the long-term average.
Scientific Reports | (2022) 12:1331 | https://doi.org/10.1038/s41598-021-04699-2 4
Vol:.(1234567890)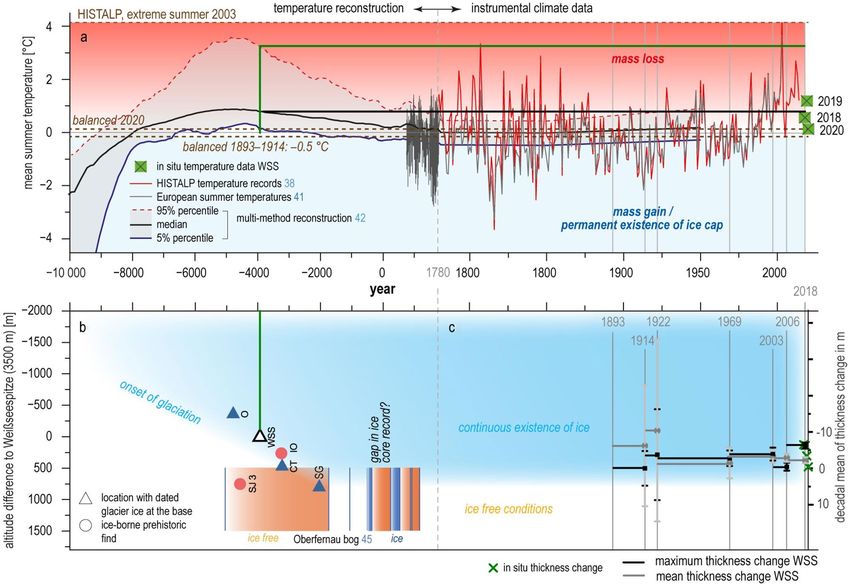
www.nature.com/scientificreports/
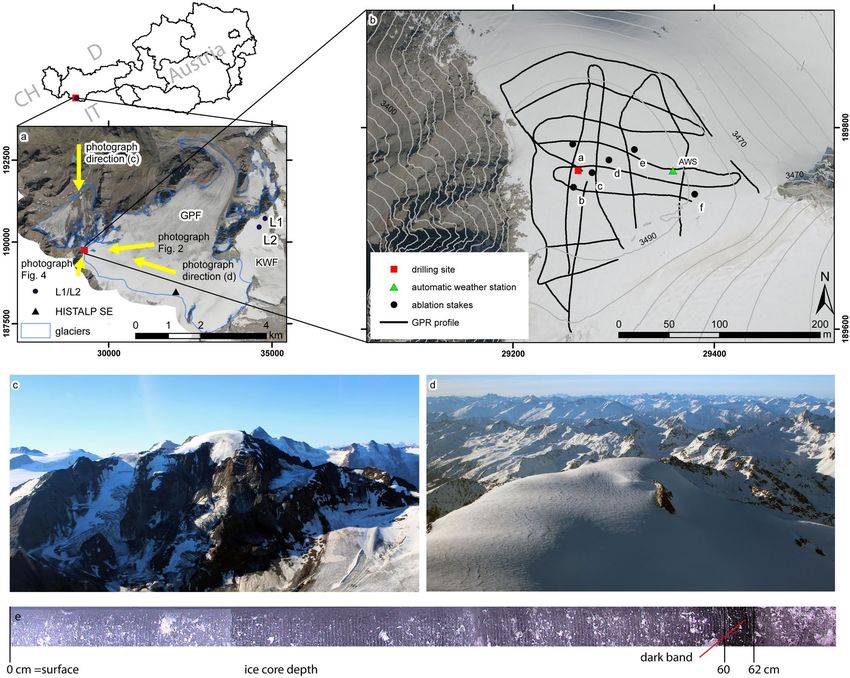
Figure 3. Bedrock topography from the GPR measurements and calculated ice thickness in 2018 (a). The
region above the 3470 m bedrock contour was chosen as area of interest for comparing maps of thickness
change (DEMs of Difference, DODs) for the periods 2018–1969 (b), 2018–1997 (c) and 2018–2006 (d). The
position of the measured maximum altitude and the past contour lines of elevation shows that all of them are
located within the 3470 m bedrock altitude band (e), as well as above the 3520 m contour line of 1969, and
that past cartographers drew the 3500 m contour line in order to represent the dome shape evident from the
photographs (f). The orthophotos of 1973 are the only available ones so far where signs of melt at the summit
dome are evident, as (e–g) demonstrate. This figure was compiled with Adobe Illustrator CS4 version 14.0.0
(www.adobe.com). The maps were created with ArcMap 10.6.1 (www.arcgis.com).
Year hmax (m) Period Length (years) Δhmax (m) Δhmax/a (m/a) Δhmean/a (m/a)
2018 3499.1 ± 0.1 2018–2006 12 − 7.5 − 0.6 ± 0.1 − 0.2 ± 0.1
2006 3506.6 ± 0.1 2006–1997 9 − 0.4 0.0 ± 0.1 − 0.3 ± 0.1
1997 3507.0 ± 1.9 1997–1969 28 − 11.0 − 0.4 ± 0.2 − 0.3 ± 0.2
1969 3518.0 ± 1.9 1969–1922 47 − 13.0 − 0.3 ± 0.2 − 0.1 ± 0.4
1922 3531 ± 1.9 1922–1914 8 − 3.0 − 0.4 ± 1.3 − 1.0 ± 2.5
1914 3534 ± 10 1914–1893 21 0.0 0.0 ± 0.5 − 0.6 ± 1.2
1893 3534 ± 10
Table 2. Maximum elevation (hmax) of the summit Weißseespitze from DEMs and historical maps27,34–37, as
well as the mean thickness change hmean (Fig. 3, Table S2) in total and per year.
Scientific Reports | (2022) 12:1331 | https://doi.org/10.1038/s41598-021-04699-2 5
Vol.:(0123456789)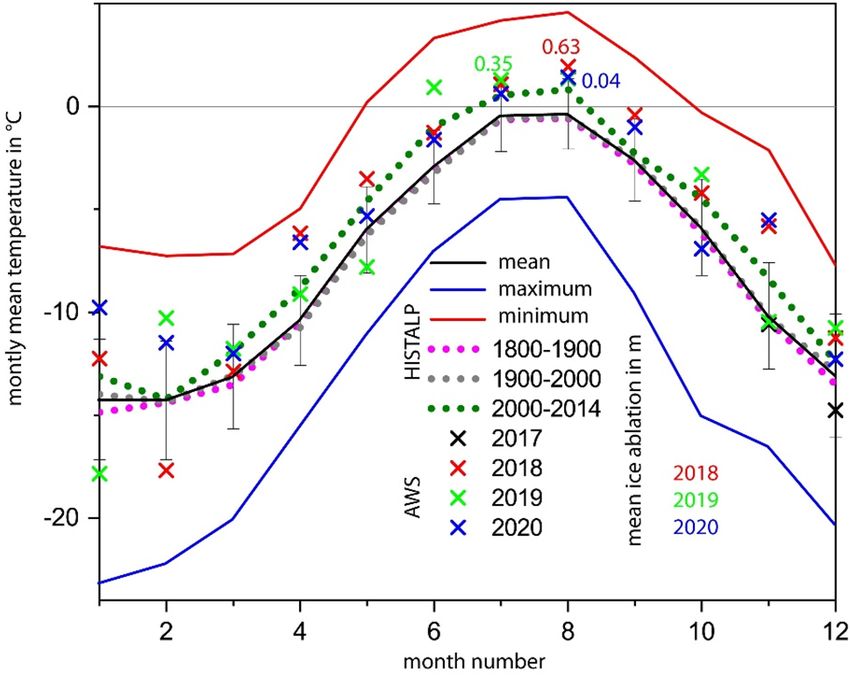
www.nature.com/scientificreports/
Figure 4. The comparison of the (a) historical photograph from 1905 with (b) one of 12.08.2021 supports
the maximum elevation change of 34.9 ± 10.0 m between 1893 and 2018 and shows that the (c,d) rock ridges
marked by arrows in (a–d) were ice-free during the late LIA. (e) Mean annual and summer temperatures for the
HISTALP grid point SE extrapolated to Weißseespitze show an increase starting in the 1980s. Solid precipitation
for the total year (black bars) and April–November (red bars) both decrease in the twenty-first century. The
thickness at stakes L1 and L2 at Kesselwandferner increased with solid precipitation peaks in the 1980s and late
1990s, and decreased with melt events, e.g. in 1973 and most remarkably since 2003. The time series of historical
photographs (f) of Weißseespitze summit shows varying steepness of the ice cliff, but an unchanged dome shape.
Data Source: HISTALP temperature and precipitation data40, federal administration of Tyrol data.tirol.gv.at,
photo by Andrea Fischer27,34–37.
In 2018, the decrease in snow cover started on 24.05., interrupted by several snow falls until 24.07.2018. Ice
melt was recorded at Weißseespitze summit AWS during 22. and 27.08.2018 as well as between 24.09.2018 and
1.10.2018. Monthly air temperatures have been above the freezing point in July (1.1 °C) and August 2018 (1.9 °C)
and close to 0 °C in September 2018 (− 0.4 °C), as well as in July 2019 (Fig. 5). In 2019, snow cover decrease
started on 29.05. and was shortly interrupted by a snow fall on 29.05.2019. Ice ablation took place between 09.08
and 01.10, with monthly means of air temperature above 0 °C for June, July and August and a data gap in Septem-
ber. In 2020, snow cover decrease started on 29.05. and was interrupted by several snow falls until 30.08. when
the ice surface was exposed. In contrast to some of the stakes, no ice melt took place at the AWS. Monthly mean
averages in 2020 were positive in July and August. The limited sample of available data indicates that monthly
means of local air temperature close to or above the freezing point coincide temporally with the observed ice melt.
In the HISTALP record, the number of months with positive mean air temperatures increased most pronounc-
edly around 1800 AD and after 1984 AD (Fig. 4). With the stability of the precipitation signal in the HISTALP
record during the accumulation period for the study site, we can thus claim that mass balance at Weißseespitze
summit ice cap is related to air temperature.
The variability of solid precipitation is high, but the solid precipitation during the months when accumulation
takes place has decreased since 2002. May/June and October/November contribute most to solid precipitation
Scientific Reports | (2022) 12:1331 | https://doi.org/10.1038/s41598-021-04699-2 6
Vol:.(1234567890)www.nature.com/scientificreports/
Figure 5. Mean, maximum and minimum monthly means for the total length of the record (1780–2014,
Table S4) show that, on average, monthly means are below zero even in summer, but positive mean temperatures
have occurred between May and October. The temperatures observed at the AWS are clearly above the mean,
even for 2000–2014. Centennial averages are close to the mean and below zero.
(Table S5), about 10% of the mean annual amount each. During the cold months of January to April, when the
ultrasonic sensor at the AWS records a plateau in snow height, usually no accumulation can take place as the
snow is removed by wind erosion, even though the HISTALP record shows that 29% of the annual solid pre-
cipitation falls in this period.
Discussion
The in situ and geodetic mass balance rates confirm that climate warming in the twentieth century significantly
affected the ice archive at the summit of Weißseespitze. By 2018, the 12.1 m thick summit ice cap had lost 56%
of its thickness of 1969. In the four years of direct mass balance measurements, the average annual ice loss was
0.4 m. The historical thickness loss from 1893 to 1969 at the highest point was 16 ± 5 m. Comparing the annual
thickness loss of 0.2 m for 1893–1969 and 0.3 m for 1969–2018, we must take into account that the summit was
covered by firn prior to the 2010s.
The present ablation measured at the stakes, with up to 0.95 m of ice loss, has removed more than the total
annual accumulation in the past, although ablation conditions last just a few days. The measured mean mass
balance rates would mean a total loss of the ice cap within 30 years, measured maximums a loss within 12 years.
This means that the 12.1 m of ice in 2018, which comprise more than 5900 years, could not have continued to
exist across this period under current melt rates. Current melt rates are thus (i) higher than the average of the last
6 millennia and (ii) past similar events must have led to gaps in the ice core stratigraphy. The visual stratigraphy
of the Weißseespitze ice core already shows a number of layers that suggest discontinuities, such as alternating
sections of inclined and horizontal layers and a visible dark band (Fig. 1). These features are currently under
further investigation, including obtaining precise chronological constraints. Weißseespitze and similar summit
ice caps can thus be considered very sensitive indicators of past warm summer conditions.
Figure 6a presents the synopsis of Holocene proxy climate records, instrumental and in situ climate data
compared to the empirical glaciological evidence on the existence of ice, thickness change and mass balance
(Tables 1, 2). For all data samples, increasing length goes along with decreasing resolution. We plotted the mean
summer temperatures extrapolated to the altitude of Weißseespitze to compare present to past climate conditions
relevant for glacier mass balance. Summer means above 0 °C in 2018, 2019 and 2020 went along with mass losses
at the summit, and potentially provide evidence of a statistical correlation of positive temperatures and melt.
So do above average thickness loss 2006–2018 and above 0° summer means from 2000 to the end of the record
in 2014. The warm summers in the twenty-first century’s instrumental record exceed the dendrochronological
temperature series41 and the mean, but not the 95% percentile of the multi-method r econstruction42. The com-
parison of the onset of the WSS ice core with the multi-method reconstruction time series confirms the dating
of the reformation of ice caps during cooling after the Holocene Optimum. Presuming that a reglaciation of the
summit would require positive mass balance rates, which we can now define as conditions cooler than 2020 and
similar to 1893–1914 (balanced as shown in Fig. 6c), we could expect local conditions to be cooler than the mean
of the multi-method reconstruction. An historical analogue approach like this using sparse empirical evidence to
constrain the potential range of local responses to global climate change is often used for complex socioecological
systems43 as a first step when sufficient data is not available to implement a model output statistics44.
The time when cold Alpine ice bodies (Fig. 6b) started to reform follows an altitudinal gradient15. This sug-
gests air temperature as a major driver over low regional variabilities in local accumulation45. Schladminger
glacier formed at the time when the Oberfernau bog in the Stubai Alps46 was still ice-free. This was possible,
even though Schladminger glacier is located lower, because the amount of precipitation there is higher than in
Scientific Reports | (2022) 12:1331 | https://doi.org/10.1038/s41598-021-04699-2 7
Vol.:(0123456789)www.nature.com/scientificreports/
Figure 6. The instrumental summer mean temperatures roughly cover the bandwidth of centennial mean
temperatures for the last 10,500 years (a), so that measured mass balance (a) and thickness changes between
1893 and 2018 (b) constrain the conditions needed for the existence of glacier ice and a continuous ice core
record at WSS (c). Almost balanced conditions, as found in 2020 and between 1893 and 1914, are the minimum
requirement for a continuous stratigraphic record, with mass losses of 2017, 2018, 2019, and between 1914
and 2018 resulting in significant ice losses with decadal means of up to 60% of the total length of the ice core
in 2017—and therefore must have been rare and/or discontinuous during the length of the record, as today’s
accumulation rates can hardly compensate potential ice losses. Therefore, it is not only the onset of neoglaciation
which allows us to relate the individual mass loss/balance/gain to the climatic conditions, but also the existence
of record gaps in the individual cores at different altitudes. (b) Comparing the datings of the onset of glaciation
at different elevations (O Ortler, WSS Weißseespitze, CT Chli Titlis, SG Schladminger Gletscher) with dated
remnants previous to the glaciation (IO Iceman Ötzi, SJ3 Schnidejoch 3) and type localities like the Oberfernau
bog allows an altitude-specific sampling of climate events as periods of ice melt and formation once an empirical
relation between local mass balance (c, see the data in Table 2) and climate (a) can be established based on a
larger ensemble of summit data.
the Stubai Alps45. The changes between glacier cover and ice-free in conditions in Oberfernau bog basin points
at potential local climate change effects which could be also tackled in Eastern Alpine cores.
At Weißseespitze, the mean annual potential accumulation maximum from 1800 to 2014 is 0.83 m w.e. (if
no melt takes place) according to the HISTALP data (mean annual solid precipitation). This is confirmed by
the observed maximum snow heights of 2.43 m, assuming an average density of 400 kg/m3. At the neighbour-
ing glaciers, snow pits in lower and less wind-exposed locations reveal much higher maximum snow heights 47.
Of this potential maximum accumulation, 0.59 m w.e. occurs in the same months that we observe increases
in snow height today. The HISTALP precipitation signal does not indicate a centennial trend, but annual and
decadal variabilities. The in situ effects of the given range of variability are captured by the measurements at
Kesselwandferner stake L2, suggesting that multi-annual gaps in the ice core records result not from an absence
of accumulation, but from warm summer conditions.
The presence of continuous winter accumulation at WSS is also supported by data from a 20 m deep firn pit
on Kesselwandferner at an altitude of 3240 m48. It revealed 14 annual layers of firn within the upper 19 m, which
were attributed to the accumulation of the years 1963 to 1949, reaching a density of 820 kg/m3. In the firn pit,
several bands of superimposed ice were found, and water was observed to penetrate and saturate the firn layer.
This is not the case at the WSS summit today, as no more firn is present there. So far, no supraglacial runoff
Scientific Reports | (2022) 12:1331 | https://doi.org/10.1038/s41598-021-04699-2 8
Vol:.(1234567890)www.nature.com/scientificreports/
system has been observed that would provide geomorphological evidence for melt water flowing on or in the
ice body, water storage and penetration is limited to microcracks.
The comparison of the thickness loss at WSS to the age constraint of the firn pit on Kesselwandferner sup-
ports an age prior to the atom bomb tests consistent with the lack of tritium in the ice core. The thickness loss
between 1969 and 2018 at the summit of Weißseespitze is similar to the depth of the snow pit at Kesselwandferner.
Hypothesizing that basically no new layers formed during this period, the loss would therefore expose a surface
from about 1950. Taking into account that the summer of 1947 was reported to cause a similar ice loss to 2003,
today’s surface likely dates from layers formed prior to 1947. This is supported by the absence of the tritium peak
from atmospheric nuclear bomb tests in the 1960s in the ice c ore15. New approaches and dating t echniques49
may soon allow determining the surface age at ice core sites with present negative mass balance, a problem that
has recently become more widely recognized16,41.
Conclusion
The synopsis of in situ mass balance and the related processes, such as wind erosion and ablation, confirms
that Weißseespitze summit ice cap is indeed sensitive to climate change. With hardly any temporal variability
in accumulation for the last 200 years, the ice archive is very sensitive to warm summer temperatures. Today
just a few days of ice melt can trigger negative mass balances with a complete loss of the annual accumulation.
The thickness change of the summit ice cap could be constrained to 34.9 ± 10.0 m between 1893 and 2018 by
analysing historical maps. This result was confirmed by historical photographs. The present annual melt rates
of up to 0.95 m/year measured at single stakes are clearly higher than the average annual mean thickness loss of
0.28 ± 0.08 m/year for 1893 and 2018.
The link between ice core-based mass balance signals and climate is known from using layer thickness as
a proxy for past precipitation rates in polar c ores50. However, in an Alpine summit glacier like Weißseespitze,
with a mass balance regime highly sensitive to climate change, this link is far more complex. Reconstructions of
Holocene temperatures42 and g laciation51 point to a fairly pronounced Holocene maximum temperature right
before the reglaciation at Weißseespitze started, according to the age constraint of the basal ice layer of (5.9 ± 0.7)
ka cal (Fig. 6).
Future directions and perspectives. The glacio-meteorological settings of Weißseespitze today, in par-
ticular the close link between summer temperature and mass loss, finally provide a context that is crucial for
further interpretation of mass balance discontinuities. These can be detected in the ice core by visual, chemical
and isotopic analysis. Deciphering this unique record of past mass balance will require close chronological con-
trol to complement the available constraints from micro-radiocarbon dating15.
Just 0.7% of the long-term meteorological stations in mountain regions are located above 3000 m. Few of
the high elevation stations are located on summits. The majority of them are located in valleys and influenced
by orographic winds which blur climate trends. Because the ice caps to be studied are located on summits and
represent free atmosphere temperatures, Alpine ice core research can contribute significantly to the investigation
of elevation-dependent warming and related p rocesses52. The analysis of 200 years of equilibrium line variability
53
in the European Alps confirms the potential of the combination of glacier mass balance and HISTALP data for
process studies like ours to bridge the gap to Holocene climate and glacier processes.
Next steps in utilizing ice archives for reconstructing the local past climate are consistent sampling at dif-
ferent altitudes, a calibration of the link between instrumental climate records and ice core records by chrono-
sequencing annual accumulation history in the age-depth relation and intensified mass balance measurements
at the summits, in order to do analogue studies comparing modern to past extremes.
Revealing the pace of past glacier and climate changes is most important in the light of potentially rapid
warming during the coming decades. Elevation-dependent warming is assumed to have a great but so far unquan-
tified impact on biodiversity and hydrological regimes, and instrumental data will rarely be available for eleva-
tions above 3000 m.
Therefore, the preservation of summit ice and the analysis of mass balance, age sequences and pollen can
significantly support adaptation measures like planting climate-resilient protective forest species. This is key for
a sustainable future of people living the world’s mountain regions.
Methods
In situ mass balance. Point mass balance at Weißseespitze was measured by wooden stakes drilled into the
i ce54 and read several times during the ablation season. In addition to that, snow height was measured by probing
and continuously with a sonic ranging sensor at the AWS.
In total, six ablation stakes were distributed over the summit area (Fig. 1b, stakes a–f). Two ablation stakes
were installed in 2017 (c, f) at the summit. In 2018, stakes were added at locations a, b, d, e. In 2019, a stake was
placed in the hole of the ice coring.
Measurements of elevation change at the Kesselwandferner summit stake. The metal stakes
at KWF were repositioned annually. The initial and the final location of the stake were measured by means of
tachymetry prior to 2009 and since then by differential GPS 25. Stake L1 was drilled close to the summit of
Fluchthorn at an altitude of 3323.3 m (1968). There, mean annual horizontal flow velocity was 0.6 m/year, with
a maximum of 0.7 m. Flow velocities at stake L2 at an altitude of 3296.8 m in 1968 are higher, with an average of
1.7 m/year and a maximum of 2.8 m/year. For both stakes, no local measurements of snow and firn density are
available. Both records were the highest stake measurements in the Austrian Alps before the WSS stakes came
Scientific Reports | (2022) 12:1331 | https://doi.org/10.1038/s41598-021-04699-2 9
Vol.:(0123456789)www.nature.com/scientificreports/
into operation, and serve only as comparison and validation of the elevation changes recorded in the historical
maps.
Records of meteorological conditions and englacial temperatures at the WSS. An AWS was
installed in the summit region at an elevation of 3499 m (location, see Fig. 1) in October 2017. It mainly consists
of Campbell Scientific (CS) components and the data logger CR3000. Records of air temperature and humid-
ity (Rotronic-HC2S3), air pressure (CS225), wind speed and direction (Young-05103-45), the energy balance
(Huxeflux-NR01), snow accumulation and ice ablation by sonic ranging sensor (CS-SR50a) and ice tempera-
tures in four different depths (CS-225) are taken every minute and stored on 10-min intervals. The snow height
refers to the related ice surface at the end of the ablation season as zero. The ice temperature sensors were initially
installed in 2017 at the lower end of steam-drilled holes at depths of − 1 m, − 4 m, − 6 m and − 9 m, taking the
2017 ice surface as zero. The two stakes c and f, as well as the stake at the drilling site, are equipped with PT100
temperature probes.
Positioning. A Tocpon Hiper V DGPS was used to position the ground-penetrating radar (GPR) profiles
and stakes. The DGPS raw data, recorded per second, was corrected and adjusted in post-processing with the
four closest STPOS (South Tyrolean Reference Station Service) base stations Mals-Malles, Meran-Merano,
Bozen-Bolzano and Sterzing-Vipiteno. The achieved vertical and horizontal accuracy of the processed position-
ing data is within a range of ± 0.5 m. The synchronization of the GPR trace number with the DGPS data was done
via the GPS time under consideration of the current 18 leap seconds to the GSSI-recorded UTC time.
GPR and bedrock topography. The ice thickness at the Weißseespitze summit was measured with GPR
on 8 June 2017. Because of the expected low ice thicknesses, a GSSI 3102A antenna with a central frequency of
500 MHz was used. The radar sections were recorded at the uppermost area of the summit along several cross
profiles (Fig. 1, Supplementary Fig. S4) at an interval of 4 scans per second and 1024 samples per scan. The GPR
signal was processed with ReflexW software (see the radargrams in Fig. S5) and a time-to-depth conversion with
a mean signal velocity of 0.168 m/ns, arriving at an uncertainty of 10% of the ice t hickness55.
The bedrock topography of the summit was calculated from the GPR measurements and a bilinear interpola-
tion between the bedrock interpretation of the GPR profiles, the glacier outlines as zero ice thickness and taking
into account the surrounding ice-free topography from the 2018 DEM55. The bedrock elevation is consistent
with the ice core drillings. The vertical accuracy of the DGPS-measured surface elevation is ± 0.5 m, so that the
accuracy of the bedrock elevation is constrained by surface elevation uncertainty and the ice thickness uncer-
tainty of ± 10%.
Gridded surface elevation and thickness change data. Basic data for the calculation of past elevation
and volume changes are provided by different available DEMs as given in Table 1. DEMS prior to 2006, with a
pixel size of 5 × 5 m, are based on aerial photogrammetry and show vertical uncertainties better than ± 1.9 m56.
From 2006 onwards, the DEMs are based on high-resolution LiDAR data with 1 × 1 m pixel size. For the DEM
of 2006, the uncertainty is ± 0.1 m56. The standard deviation at control areas for the DEM of 2018 was 0.032 m57.
The effects of a seasonal snow cover, to be added to the nominal accuracy of the DEMs, can be estimated by the
maximum snow cover recorded at the AWS to be about 2 m.
The DoDs (DEM of Difference) were calculated in ArcMap with the “minus” tool and took into account the
basic resolution of the data and exact overlapping raster cells. The volume change of the summit ice cap was
calculated for the area where the bedrock is above the 3470 m.a.s.l. contour line by summing up the volume
changes in each pixel of the DoD grids.
Historical maps, photographs and climate data. For the time before 1969, elevation and shape of the
ice cap at Weißseespitze are recorded in historical maps and a number of photographs. Although this summit has
been more remote and less prominent than others (for example, nearby Weißkugel summit), the Gepatschferner
glacier has been subject to early glaciological surveys. The summit of Weißseespitze was also surveyed during
federal mapping campaigns and is named and indicated in maps from the third survey of Tyrol onwards, which
took place during 1870–1887 and quotes elevation for the rock outcrops and two edges leading down from
the summit. Although early measurements of elevation have been challenging and generally have uncertain-
ties of several metres, the data fits remarkably well to the historical photographs and today’s high-resolution
data at rock outcrops. Reprocessing the historical map of Hochjochferner based on the original photogram-
metric records returned a standard error in elevation of the primary observatory network (triangulation points)
of ± 0.21 m58, an uncertainty of ± 1–2 m at the glacier tongue, where tacheometry was applied, and an uncertainty
of ± 0.10 m at photogrammetrically processed upper parts of the glacier. For our analysis, we used maps where
tacheometric surveys are indicated by cartographic symbols.
We compared present meteorological conditions at the summit ice cap to homogenized HISTALP climate
data40 and the Jungfraujoch temperature records59 (Table S5). The gridded monthly mean HISTALP data sets
are available in 1° and 5ʹ spatial resolution and are based on 557 instrumental climate records dating back to
1760 AD. The 1° HISTALP grid point next to Weißseespitze is located at 46.83 N, 10.75 E, at an elevation of
3160 m, for the location of the 5ʹ resolution grid points NE, NW, SE, and SW, see Table S6. Temperatures at all
HISTALP grid points are higher than at the AWS, which is located at 3499 m, so that the temperatures had to
be extrapolated to the summit altitude.
Scientific Reports | (2022) 12:1331 | https://doi.org/10.1038/s41598-021-04699-2 10
Vol:.(1234567890)www.nature.com/scientificreports/
We extrapolated the HISTALP data to the AWS altitude in two ways, by adding the long-term difference to
Jungfraujoch records and by using the lapse rate derived from the HISTALP points at different altitudes60. The
respective lapse rates are listed in Table S6.
For the long-term station at Jungfraujoch in Switzerland (3571 m, 46° 32.9ʹ N, 7° 59.1ʹ E), homogenized
monthly mean temperatures are available from 1933 onwards. During summer months June, July and August in
the overlapping period 1933 to 2014, the difference between Jungfraujoch and Weißseespitze temperature means
is 2.3 °C, with a standard deviation of 0.2 °C. This difference was added to the HISTALP monthly mean for a first
rough estimate of melting conditions at the summit during the HISTALP period. For the summer means (June,
July, August), when most of the melt events occur, the Pearson correlation coefficient between Jungfraujoch and
the extrapolated HISTALP grid point is 0.94, for annual means 0.97. As the resulting extrapolated records are very
similar (Table S7, Figs. S2, S3), we can very confidently describe local climatology by the adapted HISTALP series.
Potential snow accumulation was calculated for the HISTALP grid point from the fraction of solid precipita-
tion and total precipitation, assuming that precipitation in December, January and February was eroded by winds
as is the case today. No correction to the altitude was applied to the amount of precipitation or the fraction of
solid precipitation.
Data availability
The DEMs of 2006 and 2018 have been published by the Federal Administration of Tyrol and available via
the open government portal data.tirol.gv.at. All other data are available via pangaea.de ( doi:10.1594/PAN-
GAEA.939817 and doi:10.1594/PANGAEA.939830 ).
Received: 6 July 2021; Accepted: 23 December 2021
References
1. Zemp, M. et al. Glacier monitoring to track warming. Nature 576, 39 (2019).
2. Zemp, M. et al. Historically unprecedented global glacier decline in the early 21st century. J. Glaciol. 61(228), 745–762. https://
doi.org/10.3189/2015JoG15J017 (2015).
3. Sommer, C. et al. Rapid glacier retreat and downwasting throughout the European Alps in the early 21st century. Nat. Commun.
11, 3209. https://doi.org/10.1038/s41467-020-16818-0 (2020).
4. Gärtner-Roer, I., Nussbaumer, S. U., Hüsler, F. & Zemp, M. Worldwide assessment of national glacier monitoring and future
perspectives. Mount. Res. Dev. 39, 2. https://doi.org/10.1659/MRD-JOURNAL-D-19-00021.1 (2019).
5. WGMS Global glacier change bulletin no. 3 (2016–2017). In ISC(WDS)/IUGG(IACS)/UNEP/UNESCO/WMO (eds Zemp, M. et
al.) 274 (World Glacier Monitoring Service, 2020).
6. Ivy-Ochs, S. et al. Chronology of the last glacial cycle in the European Alps. J. Quatern. Sci. 23, 559–573. https://doi.org/10.1002/
jqs.1202 (2008).
7. Joerin, U. E., Nicolussi, K., Fischer, A., Stocker, T. F. & Schlüchter, C. Holocene optimum events inferred from subglacial sediments
at Tschierva Glacier, Eastern Swiss Alps. Quatern. Sci. Rev. 27, 337–350. https://doi.org/10.1016/j.quascirev.2007.10.016 (2008).
8. Seguinot, J. et al. Modelling last glacial cycle ice dynamics in the Alps. Cryosphere 12, 3265–3285. https://doi.org/10.5194/tc-12-
3265-2018 (2018).
9. Penck, A. & Brückner, E. Die Alpen im Eiszeitalter 1–3 (Tauchnitz, 1909).
10. Fischer, H., Blunier, T. & Mulvaney, R. Ice cores: Archive of the climate system. In Glaciers and Ice Sheets in the Climate System
(eds Fowler, A. & Ng, F.) 279–325 (Springer, 2021).
11. Bohleber, P. Alpine Ice cores as climate and environmental archives. In Oxford Research Encyclopedia of Climate Science (ed.
Bohleber, P.) (Oxford University Press, 2019).
12. Wagenbach, D., Bohleber, P. & Preunkert, S. Cold, alpine ice bodies revisited: What may we learn from their impurity and isotope
content?. Geogr. Ann. Ser. B 94(2), 245–263 (2012).
13. Gabrielli, P. et al. Age of the Mt. Ortles ice cores, the Tyrolean Iceman and glaciation of the highest summit of South tyrol since
the Northern Hemisphere climatic optimum. Cryosphere 10(6), 2779–2797 (2016).
14. Bohleber, P., Hoffmann, H., Kerch, J., Sold, L. & Fischer, A. Investigating cold based summit glaciers through direct access to
theglacier base: A case study constraining the maximum age of Chli Titlis glacier, Switzerland. Cryosphere 12, 401–412 (2018).
15. Bohleber, P., Schwikowski, M., Stocker-Waldhuber, M., Fang, L. & Fischer, A. New glacier evidence for ice-free summits during
the life of the Tyrolean Iceman. Sci. Rep. 10, 20513. https://doi.org/10.1038/s41598-020-77518-9 (2020).
16. Festi, D., Schwikowski, M., Maggi, V., Oeggl, K. & Jenk, T. M. Significant mass loss in the accumulation area of the Adamello glacier
indicated by the chronology of a 46 m ice core. Cryosphere 15, 4135–4143. https://doi.org/10.5194/tc-15-4135-2021 (2021).
17. Licciulli, C. et al. A full Stokes ice-flow model to assist the interpretation of millennial-scale ice cores at the high-Alpine drilling
site Colle Gnifetti, Swiss/Italian Alps. J. Glaciol. 66, 35–48. https://doi.org/10.1017/jog.2019.82 (2020).
18. Schwerzmann, A. et al. A method to reconstruct past accumulation rates in alpine firn regions: A study on Fiescherhorn, Swiss
Alps. J. Geophys. Res. Earth Surf. 111, F01014. https://doi.org/10.1029/2005JF000283 (2006).
19. Charalampidis, C. et al. Mass-Budget Anomalies and Geometry Signals of Three Austrian Glaciers. Front. Earth Sci. 6, 218. https://
doi.org/10.3389/feart.2018.00218 (2018).
20. Zekollari, H., Huss, M. & Farinotti, D. On the imbalance and response time of glaciers in the European Alps. Geophys. Res. Lett.
47, e2019GL085578. https://doi.org/10.1029/2019GL085578 (2020).
21. Huss, M., Hock, R., Bauder, A. & Funk, M. Conventional versus reference-surface mass balance. J. Glaciol. 58(208), 278–286.
https://doi.org/10.3189/2012JoG11J216 (2012).
22. Fischer, A. Glaciers and climate change: Interpretation of 50 years of direct mass balance of Hintereisferner. Glob. Planet. Change
71(1–2), 13–26 (2010).
23. Vincent, C. et al. Common climatic signal from glaciers in the European Alps over the last 50 years. Geophys. Res. Lett. 44,
1376–1383. https://doi.org/10.1002/2016GL072094 (2017).
24. Huss, M., Dhulst, L. & Bauder, A. New long-term mass-balance series for the Swiss Alps. J. Glaciol. 61(227), 551–562. https://doi.
org/10.3189/2015JoG15J015 (2015).
25. Stocker-Waldhuber, M., Fischer, A., Helfricht, K. & Kuhn, M. Long-term records of glacier surface velocities in the Ötztal Alps
(Austria). Earth Syst. Sci. Data 11, 705–715. https://doi.org/10.5194/essd-11-705-2019 (2019).
26. Goldberger, J. Gletscherhaushalt und klimatische Umwelt des Hochköniggletschers 1965–1975. Wiss. Alpenvereinshefte 28, 63
(1986).
27. Finsterwalder, S. Begleitworte zur Karte des Gepatschferners. Z. für Gletscherkunde 16, 20–41 (1926).
Scientific Reports | (2022) 12:1331 | https://doi.org/10.1038/s41598-021-04699-2 11
Vol.:(0123456789)www.nature.com/scientificreports/
28. Haeberli, W., Schotterer, U., Wagenbach, D., Schwitter, H. & Bortenschlager, S. Accumulation characteristics on a cold, high-Alpine
Firn Saddle from a snow-pit study on Colle Gnifetti, Monte Rosa, Swiss Alps. J. Glaciol. 29(102), 260–271. https://d oi.o
rg/1 0.3 189/
S0022143000008315 (1983).
29. Vincent, C., Vallon, M., Pinglot, J., Funk, M. & Reynaud, L. Snow accumulation and ice flow at Dôme du Goûter (4300 m), Mont
Blanc, French Alps. J. Glaciol. 43(145), 513–521. https://doi.org/10.3189/S0022143000035127 (1997).
30. Suter, S., Hoelzle, M. & Ohmura, A. Energy balance at a cold Alpine firn saddle, Seserjoch, Monte Rosa. Int. J. Climatol. 24(11),
1423–1442. https://doi.org/10.1002/joc.1079 (2004).
31. Vincent, C. et al. Very high-elevation Mont Blanc glaciated areas not affected by the 20th century climate change. J. Geophys. Res.
Atmos. 112, D09120. https://doi.org/10.1029/2006JD007407 (2007).
32. Vincent, C. et al. Strong changes in englacial temperatures despite insignificant changes in ice thickness at Dôme du Goûter glacier
(Mont Blanc area). Cryosphere 14, 925–934. https://doi.org/10.5194/tc-14-925-2020 (2020).
33. Vincent, C. et al. Detection of a subglacial lake in Glacier de Tête Rousse (Mont Blanc area, France). J. Glaciol. 58(211), 866–878.
https://doi.org/10.3189/2012JoG11J179 (2012).
34. Brunner, K. Zur neuen Karte Gepatschferner 1971. Z. für Gletscherkunde Glazialgeol. 14(2), 133–151 (1978).
35. Simon, S. & Oetzthal, S. Map 1:50 000, Blatt IV (S Weisskugel) Edited by the Deutscher und Österreichischer Alpen-Verein, printed
by Giesecke and Devrient, Leipzig and Berlin (1893).
36. Fitz, J. Federal Austrian Map, Blatt Nauders, Zone 18 Kol. III (1914).
37. Fischer, A., Seiser, B., Stocker-Waldhuber, M., Mitterer, C. & Abermann, J. Tracing glacier changes in Austria from the little ice
age to the present using a lidar-based high-resolution glacier inventory in Austria. Cryosphere 9, 753–766. https://doi.org/10.5194/
tc-9-753-2015 (2015).
38. Ohmura, A. Physical Basis for the temperature-based melt-index method. J. Appl. Meteorol. 40(4), 753–761 (2001).
39. Six, D. & Vincent, C. Sensitivity of mass balance and equilibrium-line altitude to climate change in the French Alps. J. Glaciol. 60,
867–878. https://doi.org/10.3189/2014JoG14J014 (2014).
40. Auer, I. et al. HISTALP—Historical instrumental climatological surface time series of the greater Alpine region 1760–2003. Int. J.
Climatol. 27, 17–46 (2007).
41. Luterbacher, J. et al. European summer temperatures since Roman times. Environ. Res. Lett. 11, 024001 (2016).
42. Kaufman, D. et al. Holocene global mean surface temperature, a multi-method reconstruction approach. Sci. Data 7, 201. https://
doi.org/10.1038/s41597-020-0530-7 (2020).
43. Glantz, M. H. Forecasting by analogy: Local responses to global climate change. In Adapting to Climate Change (eds Smith, J. B.
et al.) (Springer, 1996).
44. Vannitsem, S. et al. Statistical postprocessing for weather forecasts: Review, challenges, and avenues in a big data world. Bull. Am.
Meteorol. Soc. 102(3), E681–E699 (2021).
45. Abermann, J., Kuhn, M. & Fischer, A. Climatic controls of glacier distribution and glacier changes in Austria. Ann. Glaciol. 52(59),
83–90. https://doi.org/10.3189/172756411799096222 (2011).
46. Patzelt, G. Das Bunte Moor in der Oberfernau (Stubaier Alpen, Tirol)—Ein neu bearbeitetes Schlüsselprofil für die Kenntnis der
nacheiszeitlichen Gletscherschwankungen der Ostalpen. Jahrb. Geol. Bundesanst. 156(1–4), 97–107 (2016).
47. Helfricht, K., Kuhn, M., Keuschnig, M. & Heilig, A. Lidar snow cover studies on glaciers in the Ötztal Alps (Austria): Comparison
with snow depths calculated from GPR measurements. Cryosphere 8, 41–57. https://doi.org/10.5194/tc-8-41-2014 (2014).
48. Ambach, W. & Eisner, H. Analysis of a 20 m. Firn Pit on the Kesselwandferner (Ötztal Alps). J. Glaciol. 6(44), 223–231. https://
doi.org/10.3189/S0022143000019237 (1966).
49. Feng, Z. et al. Dating glacier ice of the last millennium by quantum technology. PNAS https://doi.org/10.1073/pnas.1816468116
(2019).
50. Dahl-Jensen, D., Johnsen, S. J., Hammer, C. U., Clausen, H. B. & Jouzel, J. Past accumulation rates derived from observed annual
layers in the GRIP ice core from Summit, Central Greenland. In Ice in the Climate System (ed. Richard Peltier, W.) 517–532
(Springer, 1993).
51. Hormes, A., Müller, B. U. & Schlüchter, C. The Alps with little ice: evidence for eight Holocene phases of reduced glacier extent in
the Central Swiss Alps. The Holocene 11(3), 255–265. https://doi.org/10.1191/095968301675275728 (2001).
52. Mountain Research Initiative EDW Working Group. Elevation-dependent warming in mountain regions of the world. Nat. Clim.
Change 5, 424–430. https://doi.org/10.1038/nclimate2563 (2015).
53. Žebre, M. et al. 200 years of equilibrium-line altitude variability across the European Alps (1901–2100). Clim. Dyn. 56, 1183–1201.
https://doi.org/10.1007/s00382-020-05525-7 (2021).
54. Cogley, J. G. et al. Glossary of Glacier Mass Balance and Related Terms, IHP-VII Technicl Documents in Hydrology, No. 86, IACS
Contribution No. 2 (UNESCO-IHP, 2011).
55. Fischer, A. Calculation of glacier volume from sparse ice-thickness data, applied to Schaufelferner, Austria. J. Glaciol. 55(191),
453–460. https://doi.org/10.3189/002214309788816740 (2009).
56. Abermann, J., Lambrecht, A., Fischer, A. & Kuhn, M. Quantifying changes and trends in glacier area and volume in the Austrian
Ötztal Alps (1969–1997–2006). Cryosphere 3, 205–215 (2009).
57. Fischer, A., Schwaizer, G., Seiser, B., Helfricht, K. & Stocker-Waldhuber, M. High-resolution inventory to capture glacier disinte-
gration in the Austrian Silvretta. Cryosphere 15, 4637–4654. https://doi.org/10.5194/tc-15-4637-2021 (2021).
58. Haggrén, H. et al. Processing of old terrestrial photography for verifying the 1907 digital elevation model of Hochjochferner
Glacier. Z. Gletscherk. Glazialgeol. 41, 29–53 (2007).
59. Meteoswiss. Homogenized data series Jungfraujoch (2021). https://w ww.m eteos wiss.a dmin.c h/p
roduc t/o
utput/c limat e-d ata/h
omog
enous-monthly-data-processing/data/homog_mo_JUN.txt. Accessed 23 Dec 2021.
60. Bohleber, P., Wagenbach, D., Schöner, W. & Böhm, R. To what extent do water isotope records from low accumulation Alpine
ice cores reproduce instrumental temperature series?. Tellus B Chem. Phys. Meteorol. 65, 1. https://doi.org/10.3402/tellusb.v65i0.
20148 (2013).
Acknowledgements
This study was funded by the Austrian Science Fund (FWF): Project P 29256-N36. Financial support was pro-
vided to PB from the European Union’s Horizon2020 research and innovation programme under the Marie
Skłodowska-Curie Grant Agreement No. 790280. We thank the people in Kaunertal who were of great help
during field work, Oswald Heis for supporting the photography and Brigitte Scott for language editing. We are
grateful to Samuel Doyle and two anonymous reviewers who helped to improve the manuscript substantially.
Author contributions
A.F. and P.B. designed the study, M.F. provided historical photos, M.S.W. did the measurements and data analysis.
A.F., P.B. and M.S.W. contributed to the text.
Scientific Reports | (2022) 12:1331 | https://doi.org/10.1038/s41598-021-04699-2 12
Vol:.(1234567890)www.nature.com/scientificreports/
Competing interests
The authors declare no competing interests.
Additional information
Supplementary Information The online version contains supplementary material available at https://doi.org/
10.1038/s41598-021-04699-2.
Correspondence and requests for materials should be addressed to A.F.
Reprints and permissions information is available at www.nature.com/reprints.
Publisher’s note Springer Nature remains neutral with regard to jurisdictional claims in published maps and
institutional affiliations.
Open Access This article is licensed under a Creative Commons Attribution 4.0 International
License, which permits use, sharing, adaptation, distribution and reproduction in any medium or
format, as long as you give appropriate credit to the original author(s) and the source, provide a link to the
Creative Commons licence, and indicate if changes were made. The images or other third party material in this
article are included in the article’s Creative Commons licence, unless indicated otherwise in a credit line to the
material. If material is not included in the article’s Creative Commons licence and your intended use is not
permitted by statutory regulation or exceeds the permitted use, you will need to obtain permission directly from
the copyright holder. To view a copy of this licence, visit http://creativecommons.org/licenses/by/4.0/.
© The Author(s) 2022
Scientific Reports | (2022) 12:1331 | https://doi.org/10.1038/s41598-021-04699-2 13
Vol.:(0123456789)You can also read