Cyclostratigraphy of the Middle to Upper Ordovician successions of the Armorican Massif (western France) using portable X-ray fluorescence
←
→
Page content transcription
If your browser does not render page correctly, please read the page content below

Geochronology, 4, 251–267, 2022
https://doi.org/10.5194/gchron-4-251-2022
© Author(s) 2022. This work is distributed under
the Creative Commons Attribution 4.0 License.

Cyclostratigraphy of the Middle to Upper Ordovician
successions of the Armorican Massif (western France)
using portable X-ray fluorescence
Matthias Sinnesael1,2,3 , Alfredo Loi4 , Marie-Pierre Dabard5, , Thijs R. A. Vandenbroucke2 , and Philippe Claeys1
1 Analytical,
            Environmental and Geo-Chemistry, Vrije Universiteit Brussel, Pleinlaan 2, 1050 Brussels, Belgium
2 Department of Geology, Ghent University, Krijgslaan 281/S9, 9000 Ghent, Belgium
3 IMCCE, CNRS, Observatoire de Paris, PSL University, Sorbonne Université,

77 Avenue Denfert-Rochereau, 75014 Paris, France
4 Department of Chemical and Geological Sciences, University of Cagliari, Cittadella Universitaria,

Blocco A – 09042, Monserrato, Italy
5 Géosciences UMR6118 CNRS/Université Rennes, Campus de Beaulieu, 35042 Rennes CEDEX, France
 deceased

Correspondence: Matthias Sinnesael (matthias.sinnesael@obspm.fr)

Received: 22 December 2021 – Discussion started: 12 January 2022
Revised: 5 April 2022 – Accepted: 14 April 2022 – Published: 16 May 2022

Abstract. To expand traditional cyclostratigraphic numer-         ical cyclostratigraphic techniques on this siliciclastic storm-
ical methods beyond their common technical limitations            dominated shelf environment, a non-traditional sedimento-
and apply them to truly deep-time archives, we need to re-        logical setting for cyclostratigraphic analysis. In the parts of
flect on the development of new approaches to sedimentary         the section with a relatively homogeneous lithology, spectral
archives that are not traditionally targeted for cyclostrati-     power analyses and bandpass filtering hint towards a poten-
graphic analysis but that frequently occur in the impover-        tial astronomical imprint of some sedimentary cycles, but this
ished deep-time record. Siliciclastic storm-dominated shelf       needs further confirmation in the absence of more robust in-
environments are a good example of such records. Our case         dependent age constraints.
study focuses on the Middle to Upper Ordovician siliciclas-
tic successions of the Armorican Massif (western France)
that are well-studied examples in terms of sedimentology
and sequence stratigraphy. In addition, these sections are pro-   1   Introduction
tected geological heritage due to the extraordinary quality of
the outcrops. We therefore tested the performance of non-         Astronomical climate forcing is a major driver of natural cli-
destructive high-resolution (centimeter-scale) portable X-ray     mate change and its sedimentological expressions can of-
fluorescence and natural gamma-ray analyses on an outcrop         ten be identified in the stratigraphic record (Hinnov, 2018;
to obtain major and trace element compositions. Despite the       Meyers, 2019; Sinnesael et al., 2019; Laskar, 2020). Study-
challenging outcrop conditions in the tidal beach zone, our       ing past astronomical imprints is informative of past climate
geochemical analyses provide useful information regarding         dynamics and sedimentological processes. Moreover, due to
general lithology and several specific sedimentary features       the almost semi-periodic nature of the astronomical cycles
such as the detection of paleo-placers or the discrimination      of eccentricity, precession and obliquity, the identification of
between different types of diagenetic concretions such as         theses cycles (i.e., cyclostratigraphy) also provides highly re-
nodules. Secondly, these new high-resolution data are used        solved temporal constraints to sedimentary sequences (i.e.,
to experiment with the application of commonly used numer-        astrochronology). Cyclostratigraphic analyses are performed
                                                                  on a wide range of sedimentological settings (Meyers, 2019;

Published by Copernicus Publications on behalf of the European Geosciences Union.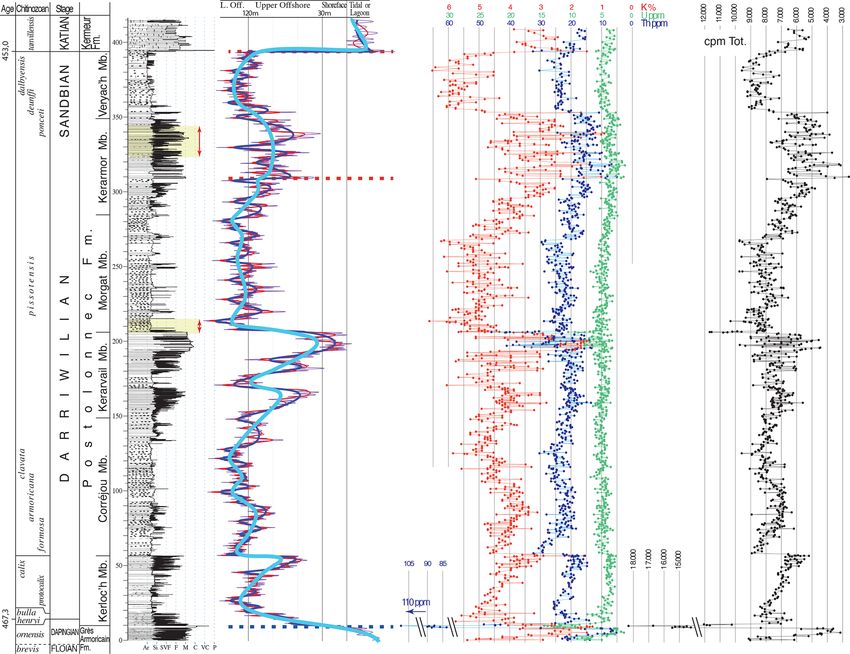
252                                                  M. Sinnesael et al.: Ordovician cyclostratigraphy of the Armorican Massif

Sinnesael et al., 2019). Nevertheless, most of the currently        nae and lenticular coquina beds (Fig. 3, Dabard et al., 2015).
used techniques for numerical analysis imply stringent un-          Sedimentary features like HCS and lenticular coquina beds
derlying assumptions regarding the nature of the record, i.e.,      reflect storm wave action, and overall these sediments were
complete continuous records without major changes in accu-          deposited in storm-dominated shelf environments.
mulation rates or depositional environments (Weedon, 2003;             The biostratigraphic calibration is based on a standard
Hilgen et al., 2015). Typically, open marine pelagic deposits       Gondwanan chitinozoan biozonation (Fig. 2; Paris, 1981,
are considered the ideal stratigraphic record for this type of      1990; Dabard et al., 2007, 2015). Desmochitina ornensis sup-
work (e.g., Westerhold et al., 2020). However, further back         ports a Dapingian position for the top of the Grès Armoricain
in geological time, fewer of these records are preserved,           Formation and the base of the Postolonnec Fm., while the
and they are virtually absent in the pre-Cretaceous record.         succeeding Belonechitina henryi Biozone of the lower Dar-
Therefore, there is a need to explore new ways of identi-           riwilian is found several meters above the base of the Pos-
fying astronomical cycles in less traditional archives using        tolonnec Fm. Other chitinozoan biozones found in the Cro-
a broader range of analysis techniques (Noorbergen et al.,          zon area supporting a lower Darriwilian position are Desmo-
2018; Lantink et al., 2019; Montanez, 2021).                        chitina bulla, Cyathochitina protocalix, and Siphonochitina
   This study compares numerical time series analysis (e.g.,        formosa. Specimens of Linochitina pissotensis are recorded
Weedon, 2003) with an alternative approach based on relative        in the Morgat Member (Mb.) and indicate the upper Darri-
sea-level interpretations (e.g., Cataneanu et al., 2009) applied    wilian Stage. The base of the Sandbian is correlated with
to a siliciclastic storm-dominated shelf environment, a set-        the Lagenochitina ponceti Biozone and the Veryac’h Mem-
ting not traditionally targeted by cyclostratigraphic studies.      ber, which also yields two younger Sandbian biozones: the
The Ordovician sections of the Crozon Peninsula (France;            Lagenochitina deunffi Biozone and the Lagenochitina dal-
Fig. 1) have been studied in detail for cyclic sedimentary          byensis Biozone. Overall, the Postolonnec Fm. spans roughly
expressions by interpreting stacked stratigraphic sequences         14 million years, starting close to the start of the Darriwilian
(Fig. 2; Dabard et al., 2015, and references therein). Pre-         Stage (∼ 467 Ma) and ending close to the end of Sandbian
vious work has resulted in detailed sea-level change recon-         Stage (∼ 453 Ma). No radioisotopic dating, chemostratigra-
structions based on sedimentological interpretations and low-       phy, or any other further constraints are currently available.
resolution (meter-scale) natural gamma-ray data (Dabard et
al., 2007, 2015). Backstripping was applied to identify sub-
sidence and several orders of sea-level change (Fig. 2).            3   Methods
The third- to fifth-order eustatic sea-level changes are hy-
pothesized to correspond to various frequencies related to          The coastal sections of Postolonnec are protected as valu-
astronomical forcing. Here, we expand the existing data             able geological and natural heritage. Therefore, we investi-
set with new medium-resolution (decimeter-scale) natural            gated the potential use of non-destructive NGR and pXRF
gamma-ray (NGR) data and high-resolution (centimeter-               measurements on outcrops for stratigraphic and geochemi-
scale) portable X-ray fluorescence (pXRF) data for two se-          cal characterizations. Next to common challenges of using
lected stratigraphical intervals with contrasting lithofacies.      pXRF on outcrops (surface weathering and need for flat sam-
The high-resolution pXRF data can be used for detailed              ple surface), a specific challenge for this beach section is that
time series analysis and provide additional geochemical in-         it is subject to large tidal ranges, which makes the outcrops
sights into specific sedimentological features like nodules         wet for most of the day and sometimes covered by organisms
and paleo-placer beds (Loi and Dabard, 2002; Dabard and             with carbonate shells (e.g., barnacles). Measurements were
Loi, 2012; Pistis et al., 2008, 2016, 2018).                        always performed during dry weather, after low tide, and on
                                                                    fresh uncovered outcrop surfaces. The potential added value
                                                                    of the pXRF compared to the handheld NGR is that pXRF
2   Geological setting and biostratigraphy                          gives a wider range of elemental analyses and has a finer
                                                                    spatial resolution regarding spot size (∼ 1 cm vs. ∼ 10 cm
The Middle to Upper Ordovician sections of the Crozon               resolution). Moreover, the unshielded NGR measurement de-
Peninsula area, Armorican Massif (Paris et al., 1999; Vi-           vice integrates the natural radioactive field beyond its actual
dal et al., 2011a), western France (Fig. 1a), were deposited        spot size (sphere with radius of several decimeters), which
on the continental terrigenous platform of Gondwana, lo-            is consequently influenced by the geometry of the outcrop at
cated at high paleo-latitudes (∼ 60◦ S). This study focuses         the point of measurement. Elemental variations measured by
on the Postolonnec Formation (Fm.) (Fig. 1b) as it out-             both instruments (e.g., potassium) can also be compared to
crops at the coastal cliffs of Postolonnec (48◦ 140 18.5000 N,      test the robustness of the signals. In contrast to the NGR, the
4◦ 270 59.7000 W; see Fig. 3 in Dabard et al., 2015). The section   pXRF centimeter-scale resolution allows us to measure fine-
is characterized by siliciclastic facies ranging from medium-       scale features such as individual nodules or paleo-placers
to coarse-grained sandstone beds with hummocky cross strat-         (Loi and Dabard, 2002; Dabard and Loi, 2012; Pistis et al.,
ification (HCS) to silty mudstones containing siltstone lami-       2016, 2018). Conversely, one has to keep in mind that be-

Geochronology, 4, 251–267, 2022                                                      https://doi.org/10.5194/gchron-4-251-2022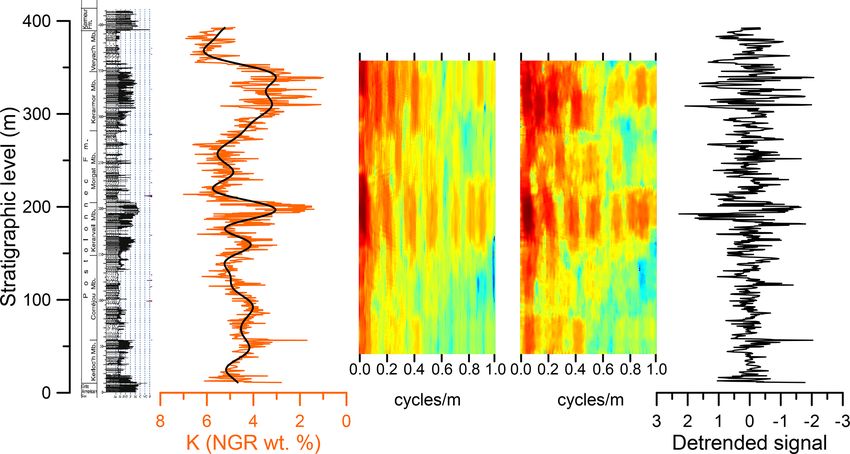
M. Sinnesael et al.: Ordovician cyclostratigraphy of the Armorican Massif                                                         253

Figure 1. (a) Location of the Postolonnec section on the Crozon Peninsula of the Armorican Massif. (b) Lithostratigraphic column of the
Ordovician succession on the Crozon Peninsula. Modified from Dabard et al. (2015).

cause of this fine spot size the result of the measurement            The stratigraphically higher ∼ 14 m thick interval in the Ker-
is very sensitive to the actual spot of analysis. For example,        armor Mb. is characterized by larger and more frequent vari-
in a coarse-grained heterogenous sandstone one could imag-            ations in lithology, ranging from mudstones to medium-sized
ine hitting a different mineralogy for different measurements         sandstones (Figs. 2–3). Both sections were logged at a 1 : 20
within the same bed. The comparison of the geochemical                scale and later transformed into a 1 cm resolution detailed
composition of the nodules and their immediately surround-            sedimentary log (presented in simplified forms in the lithol-
ing matrix, for example, could be useful to gain insights into        ogy columns of Fig. 4). The approach used in this work for
their genesis. For our study, we compiled the acquired pXRF,          the depositional sequence analyses and sea-level reconstruc-
NGR, and lithology data; evaluated how they compared to               tions are the same as those used in Dabard et al. (2015) with
each other; and tested if the pXRF indeed reflects lithological       the only difference being greater detail and a higher density
and geochemical changes in these challenging measurement              of NGR measurements in both sandy and clayey homolithic
conditions.                                                           facies in this study. Successively, we measured the sections
   Two field surveys were carried out analyzing two different         in high resolution with handheld NGR (10–20 cm resolution)
stratigraphic intervals with contrasting facies at centimeter         and pXRF (1–10 cm resolution) (Fig. 4). Dabard et al. (2015)
resolution. The stratigraphically lower ∼ 10 m thick inter-           measured NGR for the whole Postolonnec Fm. at a varying
val spans the transition from the shoreface facies Kerarvail          10–100 cm resolution according to the thickness and homo-
Member (Mb.) into the deeper marine Morgat Member that                geneity of the facies. Table 1 summarizes all available data.
is dominated by a deeper marine clay–silt facies (Figs. 2–3).         All data and detailed logs are provided in the Supplement.

https://doi.org/10.5194/gchron-4-251-2022                                                       Geochronology, 4, 251–267, 2022

254                                                    M. Sinnesael et al.: Ordovician cyclostratigraphy of the Armorican Massif

Figure 2. Stratigraphy of the Postolonnec Formation, including chitinozoan biostratigraphy, lithofacies interpretation, sequence stratigraphy
(very high-frequency sequences, purple and red curves; high-frequency or fourth-order sequences, blue curve; and third-order sequences,
pale blue curve), transgressive ravinement surfaces (dotted blue line), sharp-based surfaces (dotted red lines), and gamma-ray spectral logs
(cpm, count per minute). Orange arrows and shading indicate sections studied at high resolution in this study in the Morgat and Kerarmor
members. Modified from Dabard et al. (2015).

Table 1. Overview of available numerical data for the Postolonnec Formation. Stratigraphic intervals and members follow Dabard et
al. (2015). NGR stands for natural gamma-ray measurements, and pXRF stands for portable X-ray fluorescence.

                     Stratigraphic    Member                Data type     Resolution    points   Source (mm/yyyy)
                     Interval (m)                                              (cm)       (N)
                     0.0–409.0        Kerloc’h–Veryac’h     NGR              10–100       883    Dabard et al. (2015)
                     204.5–214.5      Morgat                Lithology           ∼1        991    This study (09/2017)
                     204.5–214.5      Morgat                NGR               10–20        69    This study (09/2017)
                     204.5–214.5      Morgat                pXRF               1–10       194    This study (09/2017)
                     324.6–338.6      Kerarmor              Lithology           ∼1       1371    This study (04/2016)
                     324.6–338.6      Kerarmor              NGR               10–20       107    This study (04/2016)
                     324.6–338.6      Kerarmor              pXRF               1–10       335    This study (04/2016)

Geochronology, 4, 251–267, 2022                                                            https://doi.org/10.5194/gchron-4-251-2022
M. Sinnesael et al.: Ordovician cyclostratigraphy of the Armorican Massif                                                             255

Figure 3. Postolonnec Formation outcrop images. (a) Overview basal Morgat Mb. (b) Overview of the upper half of the detailed logged
section in the Kerarmor Mb. (c) Detail of the condensed lithofacies of the Morgat Mb. with dark nodules and shell beds. White chalk numbers
indicate locations of pXRF analyses. (d) Detail of Kerarmor sandstones with white chalk circles indicating locations of NGR analyses. (e)
Modus operandi of the use of pXRF and NGR on the outcrop surface. (f) Detail of Fig. 3b illustrating the high-resolution measurement
strategy.

   The gamma-ray data were obtained using a portable spec-              The fundamental parameters method makes use of the theo-
trometer RS-230 (Radiation Solutions, Inc., Canada), the                retical relationship between X-ray fluorescence and material
same instrument used by Dabard et al. (2015). The measure-              composition as determined by Sherman (1956). The factory-
ments were taken with a stratigraphic interval of approxi-              calibrated quantification method of the pXRF uses this fun-
mately 10–20 cm and a counting time of 120 s. The counts                damental principle with a correction based on the matrix ef-
per minute in the selected energy windows are converted                 fect observed in soil and rock samples. All pXRF measure-
to concentrations of K (%), U (ppm), and Th (ppm). The                  ments are carried out by putting the pXRF nozzle directly on
pXRF measurements were done using a Bruker Tracer IV                    the dry and clean outcrop surface. All analyses had a mea-
handheld portable XRF device equipped with a 2WRh an-                   surement time of 45 s (de Winter et al., 2017). The pXRF
ode X-ray tube and a 10 mm2 silicon drift detector with a               measurements were not calibrated using external reference
resolution of 145 eV (Mn–Ka). The X-ray beam is focused                 materials. As such it is more relevant to consider relative
on a 6 mm by 8 mm integrated area using a Pd collimator.                variations in the elemental concentrations data rather than in-
X-ray spectra from the pXRF are deconvoluted and quanti-                terpreting absolute concentrations (Sinnesael et al., 2018a).
fied using the standard factory “soil fundamental parameters”           As a general principle the pXRF is also less suitable to mea-
method. With this technical setting, we could not reliably              sure very light (< Al) or heavy elements (> Ba) or elements
measure Si, as in the soil fundamental parameters method the            that only occur in trace amounts; this also depends on the
SiO2 mass fraction is used to sum the total weight to 100 %             instrument used (Beckhoff et al., 2006).
(this is explained in more detail in Sinnesael et al., 2018a).

https://doi.org/10.5194/gchron-4-251-2022                                                          Geochronology, 4, 251–267, 2022

256                                                   M. Sinnesael et al.: Ordovician cyclostratigraphy of the Armorican Massif

Figure 4. Sequence stratigraphy and geochemical results from the portable X-ray fluorescence (pXRF) and natural gamma-ray (NGR)
measurements. Several orders of sea-level change are interpreted in a sequence stratigraphic framework (very high-frequency sequences,
purple and red curves; high-frequency or fourth-order sequences, blue curve). The association with respective possible astronomical cycles
of precession, obliquity or eccentricity is only suggestive, sensu Dabard et al. (2015). Note that the pXRF concentrations are reported in
weight percent (wt %) as measured by the internal instrumental calibration (soil method), and are thus not accurate in the absence of an
additional external calibration. The pXRF measurements are more meaningfully interpreted in function of relative changes. The black stars
indicate the stratigraphic occurrence of paleo-placers.

   The sequence stratigraphic interpretations follow the               Formation (Fig. 1b). Despite their variability, all facies can
method outlined in Dabard et al. (2015) and are based on               be ascribed to depositional environments of a terrigenous
the study of depositional sequences at different frequencies           platform dominated by storms and tides (Guillocheau, 1983;
in combination with NGR measurements (e.g., Fig. 2). There             Guillocheau and Hoffert, 1988; Loi et al., 1999; Botquelen
is a variety of sedimentary and condensational facies that can         et al., 2006; Dabard et al., 2007, 2015; Pistis et al., 2008;
be encountered from the upper part of the Grès Armoricain              Vidal et al., 2011a, b). Analysis of sedimentary and conden-
Fm., throughout the Postolonnec Fm., and into the Kermeur              sation facies allowed the identification of genetic sequences

Geochronology, 4, 251–267, 2022                                                          https://doi.org/10.5194/gchron-4-251-2022
M. Sinnesael et al.: Ordovician cyclostratigraphy of the Armorican Massif                                                    257

by identifying the maximum regressive surface (MRS) and            4   Stratigraphic and geochemical results
maximum flooding surface (MFS) for all sequences of the
different hierarchical orders (Catuneanu et al., 2009; Dabard      The first type of data contains the facies analyses consider-
et al., 2015). Due to the high lithological contrast of the sed-   ing both sedimentary structures and variations in grain size
imentary facies in the upper offshore marine environment,          (Fig. 4). The Kerarmor Mb. is characterized by a much larger
it is easy to identify the MRS and MFS and its correspond-         stratonomic variation in grain size throughout the section
ing genetic units. In contrast, in sedimentary environments        than the Morgat Mb., with a large range of facies corre-
where facies are homogeneous, such as the shoreface and            sponding to various paleoenvironments, which makes it more
lower offshore, sequence recognition was mainly based on           straightforward to differentiate the different depositional se-
the identification of condensation facies. In deeper environ-      quences related to several orders of relative sea-level change.
ments, clayey successions are monotonous, and condensa-            The Morgat Mb. essentially consists of a continuous silty
tion facies, such as diagenetic nodular concretionary levels       mudstone facies, overlying the top of a thick sandstone unit
(Loi et al., 1999; Loi and Dabard, 1999, 2002; Dabard et al.,      of the upper Kerarvail Mb. The more homogeneous distribu-
2007; Dabard and Loi, 2012) or shell beds levels (Botquelen        tion of lithological compositions makes facies analysis and
et al., 2004, 2006), are the main markers that allow effective     high-frequency interpretation of possible changes of relative
sequential partitioning especially when coupled with NGR           sea level more difficult. In the lower offshore (
258                                                  M. Sinnesael et al.: Ordovician cyclostratigraphy of the Armorican Massif

   For both high-resolution stratigraphic logs, the first-degree    particularly useful. For example, combined elevated concen-
variations in lithology are well reflected in the K curves mea-     trations of U (NGR), Th (NGR), Zr (pXRF), and Ti (pXRF)
sured by both pXRF and NGR (Fig. 4). The mudstone inter-            are a very strong indicator of a paleo-placer. Around 6.5 m
vals have a larger clay content and correspond with higher          in the Kerarmor section there is an elevated Ti (and Ce) peak
K values and vice versa for the sandstone intervals. There is       for measurements performed at the base of a thick sandstone
also an excellent agreement between the low-resolution NGR          (Fig. 4). This level does, however, not show higher concen-
data published in Dabard et al. (2015) and the new high-            trations of Th, U, or Zr. Possibly the small spot of the pXRF
resolution NGR data (Supplement). While the relative varia-         hit a specific mineralogy, or represents “an outlier”. All data
tions in K for both the pXRF and NGR agree well, there is an        points measured in the field are reported in Fig. 4, without
offset in the reported absolute concentrations because of the       arbitrary screening for potential “outliers”. The pXRF ele-
lack of absolute concentration calibration for the pXRF mea-        mental analysis can thus be a fast and useful tool to per-
surements. The same pattern in mudstone vs. sandstones is           form multi-elemental analysis in the field and detect potential
also visible in the pXRF Rb profile, which again follows the        paleo-placers.
clay content (Supplement). For both stratigraphic profiles,            Various types and forms of concretions can be found
variations in NGR U and Th concentrations behave similarly          throughout the Postolonnec Fm. (e.g., Loi and Dabard, 2002;
overall and seem to follow the first-degree features of the         Dabard and Loi, 2012). The most common concretions are
NGR K record. However, the relative variations in NGR U             cemented by silica, phosphorus, or carbonate. Unfortunately,
and Th concentrations are less pronounced in amplitude and          due to the technical settings used for the pXRF measure-
show a less consistent relationship with the measured lithol-       ments, Si was not reliably reported (see Methods). Never-
ogy. For example, while U and Th are generally expected to          theless, the pXRF analysis still reveals useful information.
be enriched in shales and clays (Adams and Weaver, 1958),           Some concretions in the Morgat Mb. 8–10 m interval have
the thick sandstone unit on the top of the Kerarvail Mb. has        high Ca values and are most probably carbonate-cemented
the highest measured U and Th values (Fig. 4) due to the            concretions (Fig. 4). Some measured shell beds also show el-
presence of paleo-placers. The term “paleo-placer” refers to        evated Ca values, reflecting a preserved fraction of carbonate
heavy mineral-rich laminae that often occur on the top of           mineralogy of the original shells. These Ca-enriched nodules
thick sandstone units of the Postolonnec Fm. and other sim-         also have very low concentrations of K, Rb, and Ti. Another
ilar paleoenvironmental depositional settings (Pistis et al.,       group of concretions have elevated Ce values (although cau-
2008, 2016, 2018). In addition, the thick sandstones (> 12 m)       tion is required with respect to the quality of the measure-
at the top of the Kerarmor Mb. have elevated U and Th values        ment for this element) and K, Rb, and Ti values that are sim-
(with paleo-placers), while the sandstone unit around 11 m          ilar to their surrounding sediments. This group corresponds
has low U and Th values (without paleo-placers).                    with the phosphatic concretions as Ce is one of the elements
   The pXRF measurements also yielded two other groups              that is typically enriched in the phosphatic apatite. The nod-
of elements, whose variations in concentrations seem to be          ules can also be enriched in U (NGR), where it is linked
driven by sedimentological or diagenetic processes, i.e., as-       to the presence of organic matter, and at the same time of-
sociated with paleo-placers and concretions (nodules). A first      ten display low Th (NGR) concentrations. More systematic
group of elements measured with the pXRF relates to paleo-          work is needed, where the same nodules are analyzed with
placers (Zr, Ce, and Ti, Fig. 4). An example of such a paleo-       both pXRF and more robust analytical techniques (e.g., in-
placer-rich stratigraphic interval is the top of the thick Kerar-   ductively coupled plasma mass spectrometry), but these first
vail Mb. sandstone unit, which is characterized by high levels      results demonstrate the potential as a useful non-destructive
of natural radioactivity due to the presence of certain min-        screening tool usable in the field.
erals. Certain elements associated with this mineral assem-
blage (e.g., zircons, monazite, and titaniferous minerals, as
described by Pistis et al., 2016, 2018) can be detected by the      5   Cyclostratigraphic analysis
pXRF. This is most clearly reflected in the Zr and Ti profiles.
Our “single spot per bed” measurements do not allow for spe-        The cyclicity analysis of Dabard et al. (2015) was based on
cific mineralogical identifications, but an approach that com-      the identification of several orders of sea-level fluctuations.
bines multiple pXRF measurements for the same sample for            The most pronounced order of sea-level variations is the
coarse-grained igneous rocks has shown promising results            meter-to-decameter-thick “high-frequency cycle” (Fig. 2).
when extracting mineralogical information (Triantafyllou et         By taking the ratio between the number of identified high-
al., 2021). In theory, Ce should also show elevated values in       frequency cycles (n = 36) and the GTS2012-estimated dura-
the paleo-placers, but this element is potentially too heavy        tion for the Darriwilian (8.9 Myr, Cooper and Sadler, 2012;
(and can occur in too low concentrations) to be reliably de-        Cohen et al., 2013), a maximal duration estimate of 410 kyr
tected by the pXRF analysis. Some elements like Ti occur            per cycle was obtained. Therefore, this cycle was ascribed
in elevated concentrations in both paleo-placers and other fa-      to the ∼ 405 kyr long eccentricity cycle, which is theoreti-
cies. Considering both NGR and pXRF data together can be            cally the most stable astronomical cycle that is also recorded

Geochronology, 4, 251–267, 2022                                                     https://doi.org/10.5194/gchron-4-251-2022
M. Sinnesael et al.: Ordovician cyclostratigraphy of the Armorican Massif                                                          259

throughout the Phanerozoic (Laskar, 2020). The higher-order           ing whether the use of traditional spectral analysis tools is
frequency cycles were then respectively ascribed to the ∼             valid and of added value.
100 kyr eccentricity and ∼ 20 kyr precession cycles. The ab-              To investigate the most condensed part of the Morgat Mb.
sence of more precise temporal constraints (other than chiti-         high-resolution profile, we focus on the interval that does
nozoan biostratigraphy) prevents further robust testing of this       not contain any silt or sandy layers (from 3.5 m above the
hypothesis. Furthermore, it makes it difficult to clearly dis-        base of the profile up to the top at 10.0 m). The main sed-
tinguish a potential short-term Ordovician precession cycle           imentological information that could discriminate potential
(∼ 20 kyr) from an obliquity (∼ 30 kyr) cycle (Berger and             sequences here are the occurrence of shell beds, nodules (Loi
Loutre, 1994; Laskar et al., 2004; Waltham, 2015). Consid-            and Dabard, 2002), or variations in elemental concentrations
ering a potential obliquity cycle is especially relevant given        as measured by NGR and pXRF.
that the Darriwilian is also hypothesized to have featured                Let us first consider the medium-resolution NGR K signal
some of the earliest Ordovician glacial episodes (e.g., Van-          (Fig. 5b). The signal shows some fluctuations in concentra-
denbroucke et al., 2010; Dabard et al., 2015; Pohl et al.,            tions, varying between 5 % and 6.5 % K. Here, we use evolu-
2016; Rasmussen et al., 2016), with high-latitude glacial dy-         tive harmonic analysis (EHA) to evaluate the spectrum of the
namics typically being more sensitive to an obliquity forcing         signal as it evolves throughout the stratigraphy (Thomson,
(Hinnov, 2018). The long-term 1.2 Myr obliquity cycle has             1982). The frequencies that explain more variation within
been hypothesized to play a role in the Ordovician icehouse           the moving window will have higher spectral power and are
stratigraphic structures (Turner et al., 2012; Ghienne et al.,        shown by redder colors (Fig. 5b). This approach has the ad-
2014; Dabard et al., 2015). An important nuance is that the           vantage over a single periodogram or multi-taper spectrum
so-called very long 2.4 Myr eccentricity and 1.2 Myr obliq-           that it can also be used to evaluate the stratigraphic consis-
uity cycles do not necessarily have the same duration during          tency of a certain period. Spectral analyses indicate two main
the Ordovician due to the chaotic behavior of the solar sys-          periodicities: a longer one of ∼ 1.5–2.0 m (0.5–1.0 cycles per
tem (Laskar, 1989; Olsen et al., 2019; Hoang et al., 2021).           meter) and a shorter one around ∼ 0.5 m (1.8–2.2 cycles per
The highly variable sedimentation rates and potential (small)         meter) cycle thickness (as indicated by the dotted lines on
hiatuses also make it challenging to test for potential am-           Fig. 5a). The rest of the EHA shows little elevated spectral
plitude modulation patterns that could identify a unique as-          power for other frequencies. The data set is relatively short
tronomical imprint throughout the entire stratigraphy (Mey-           (6.5 m), with only 46 data points and an average sample res-
ers, 2015, 2019; Sinnesael et al., 2021). A further challenge         olution of 14 cm, and thus one must consider that there are
to consider is that the Ordovician geological timescale is            only few of the 1.5–2.0 m cycles in the record and that the
continuously evolving, with the most recent duration esti-            0.5 m cycle is close to the theoretical Nyquist frequency (stat-
mates for the Darriwilian being 11.2 Myr (GTS2020 grapto-             ing that you need at least two data points per cycle to be
lite composite) or 11.6 Myr (GTS2020 conodont composite)              able to detect it; in practice, it is often better to have even
vs. the GTS2012’s much shorter 8.9 Myr estimation (Gold-              more, e.g., Martinez et al., 2016). However, the bandpass fil-
man et al., 2020). These duration estimates vary up to 30 %,          ters of both periods show a good agreement with the raw sig-
which might not change the order of magnitude of the cy-              nal (Fig. 5c). Let us now consider the pXRF K signal that
cle duration estimates that much but certainly has implica-           has a higher average sampling resolution (6 cm) and more
tions for the potential completeness of the record. More-             data points (n = 106) for the same investigated stratigraphic
over, one has to consider the difficulty of precisely identi-         length (Fig. 5e). The spectral analysis of the pXRF K signal
fying the stage boundaries based on chitinozoan biozonation           again shows the ±1.5 m cycle, a less pronounced 0.5 m cycle,
solely. A last limitation relates to the difficulty to clearly dis-   and a new dominant cyclicity around 0.25 m (Fig. 5f). Com-
tinguish stacked patterns in the very condensed parts of the          pared to the NGR EHA, the pXRF EHA suggests additional
Postolonnec Fm. (Dabard et al., 2015). Rather than suggest-           frequencies with lower spectral power. These seem, however,
ing a number of cycles that agrees with certain stage duration        to be less stratigraphically continuous (Fig. 5). The bandpass
estimates, there is much more value in trying to identify the         filters of the NGR and pXRF signals demonstrate a similar
actual number of cycles clearly distinguishable and consider-         number of cycles, but they are not perfectly in phase with
ing the possibility of missing cycles. Especially in the shal-        each other (Fig. 5d). The pXRF 0.25 m periodicity bandpass
low marine shelf environments, it is reasonable to, for exam-         filter shows a pronounced amplitude modulation, which is
ple, consider periods of non-deposition or erosion. Although          consistent with the amplitude modulation in the 1.5 m peri-
many of the discussed challenges are inherent to the nature           odicity for the pXRF signal – although this is again not per-
of the record and lack of independent constraints, we con-            fectly in phase (Fig. 5c and d). The pattern of the amplitude
sider two additional elements to the cyclostratigraphic anal-         modulation in combination with the number of shorter cy-
ysis of the Postolonnec Fm.: (i) investigating whether new            cles (5–6) in the longer cycles is suggestive of a precession–
high-resolution pXRF data in the highly condensed interval            eccentricity signal. This signal is consistent with the ratio fit-
(Morgat Mb.) are complementary to the NGR data and can                ting of the 1.5, 0.5, and 0.25 m periodicities to the predicted
help with clearly distinguishing sequences and (ii) determin-         Ordovician duration of the astronomical cycles of short ec-

https://doi.org/10.5194/gchron-4-251-2022                                                        Geochronology, 4, 251–267, 2022
260                                                     M. Sinnesael et al.: Ordovician cyclostratigraphy of the Armorican Massif

Figure 5. Spectral analysis of the Morgat Member potassium records showing the measured data (b and e, orange lines), several bandpass
filters (c and d, black lines), and evolutive harmonic analysis (a and f, spectral plots with ranges of bandpass filters are indicated by dotted
rectangles). Panels(a–c) are based on the natural gamma-ray record and panels (d–f) are based on the portable X-ray fluorescence data. EHA
stands for evolutive harmonic analysis.

centricity, obliquity, and precession, respectively (Berger and           acterized by a larger variation in facies (Fig. 6). The power
Loutre, 1994; Laskar et al., 2004; Waltham, 2015), as well as             spectrum is dominated by a ∼ 0.5–2.0 m (0.5–2.0 cycles per
with the order of magnitude sedimentation rates estimated by              meter) cyclicity, apparently with thicker cycles in the more
Dabard et al. (2015) for this interval. In fact, it is of interest        sandstone dominated intervals (below 5 and above 10 m) and
that Dabard et al. (2015), independently of this study, inter-            thinner cycles within the clay and siltstone facies. One logi-
preted 405 kyr eccentricity minima roughly at the same strati-            cal interpretation could be that the same dominant sequences
graphic positions as we identify small amplitude variations               get thinner within the finer fractions. The bandpass filter of
in a potential precession signal. A precession–eccentricity               this frequency range does not show any pronounced ampli-
signal can also be statistically tested with the TimeOpt ap-              tude modulation. The bandpass filter output does show some
proach (Meyers, 2015, 2019). The TimeOpt results are close                resemblances to the independently constructed relative sea-
to our interpretation with the nominal TimeOpt outcome (as-               level reconstructions. The thick sandstone beds are identified
suming constant sedimentation rate over the whole record)                 by both methods as individual cycles, while they probably
that suggests the presence of five short eccentricity cycles              represent a single (or a few) depositional event(s). The se-
or a sedimentation rate of 12 m Myr−1 , whereas the evolu-                quence stratigraphic interpretation suggests the presence of a
tionary eTimeOpt analysis suggests slightly higher sedimen-               larger number of high-frequency cycles in the finer fractions
tation rates (15 m Myr−1 ) with a small increase in sedimen-              compared to the bandpass approach, which is limited by its
tation rate up section (R script for TimeOpt analyses pro-                user-defined frequency width. In the Dabard et al. (2015) in-
vided in the Supplement). It is hard to further demonstrate               terpretation, the highest-frequency relative sea-level changes
an astronomical origin of these variations in the absence of              were interpreted to correspond with the precession (or obliq-
more precise stratigraphic constraints. However, our obser-               uity) cycles and smoothed higher-order cycles with eccen-
vations based on a numerical approach using high-resolution               tricity cycles. Again, in the absence of better age control
geochemical data were consistent with those of Dabard et                  this hypothesis is difficult to test further. The numerical cy-
al. (2015), suggesting our new approach can be an additional              clostratigraphic analyses did not provide further indications
useful tool. The occurrences of the shell beds (mainly be-                of a potential astronomical origin of these sequences but did
tween 6.5 and 9.5 m) and nodules are not so clearly cyclically            offer another way of describing the variations within the sig-
distributed, making it difficult to robustly assess their usabil-         nal.
ity as tool for the assessment of “condensed sequences”. That                The detailed study of these two short sections indicates
nodules occur less systematically might be related to the in-             that the commonly used numerical cyclostratigraphical ap-
terplay of various boundary conditions that can lead to a var-            proach may work for the selected short and relatively litho-
ied sedimentological expression of a condensation interval                logically homogenous interval but might be challenged when
(as discussed in Loi and Dabard, 2002, and Dabard and Loi,                applied to intervals with more contrasting lithologies. To test
2012).                                                                    this idea further, we investigate the spectral analysis proper-
   We can now apply a similar approach to the pXRF K                      ties of the whole Postolonnec Fm. (11–393 m on the depth
record of the shallower marine Kerarmor section that is char-             scale of Dabard et al., 2015), based on the available low-

Geochronology, 4, 251–267, 2022                                                              https://doi.org/10.5194/gchron-4-251-2022
M. Sinnesael et al.: Ordovician cyclostratigraphy of the Armorican Massif                                                             261

Figure 6. Comparison of sequence and numerical cyclostratigraphic analyses for the Kerarmor Member based on the facies, potassium
from portable X-ray fluorescence, and bandpass filtering. EHA stands for evolutive harmonic analysis. Several orders of sea-level change
are interpreted in a sequence stratigraphic framework (very high-frequency sequences, purple and red curves; high-frequency or fourth-order
sequences, blue curve).

resolution (meter-scale) NGR data. The importance of sam-               mial trend or low-pass filtering. The challenge is finding the
pling resolution to potentially pick up smaller-scale cycles            delicate balance between removing what is long-term trend
was already illustrated by the difference in outcomes for the           and the signal to recover. Due to the potential large variation
NGR vs. pXRF data for the Morgat Mb. analysis. With an                  in sedimentation rates (up to an order of magnitude) and pa-
average sample rate of ∼ 0.5 m, it might be expected that               leoenvironments, this is a difficult balance to strike for this
shorter-term astronomical cycles such as precession or obliq-           data set. We have applied various levels of detrending using
uity cannot be recovered by numerical analysis of the low-              a low-pass filter to assess the robustness of the consecutive
resolution NGR record. The expression of such potential cy-             spectral analyses (evaluated between f = 0.01–0.05 m−1 or
cles in a relatively coarse siliciclastic facies may be very dif-       periods > 100–20 m). In Fig. 7 we compare the EHAs for
ferent (e.g., they might be much thicker and detectable with            a simple linear detrending and a low-pass filtered detrend-
a relatively low sampling rate). A first complication is that           ing (f = 0.033 m−1 or periods > 30 m). The detrending has
the amplitude of the variations of the NGR signal is much               decreased the difference in spectral power between different
larger in the sandstone-rich intervals (i.e., Kerarvail Mb. and         lithologies, but the overall pattern stays the same. Both the
Kerarmor Mb.) compared to the lithologically more homoge-               Kerarvail and Kerarmor sandstone members show a consis-
nous intervals, which makes the spectral power much higher              tent 4 and 2.5 m cycle. The longer-term cycles are less robust
in the sandstone intervals, masking potential smaller ampli-            to identify and partially depend on the level of detrending.
tude changes in the other intervals (Fig. 7). An additional             Applying the respective sedimentation rates of the Dabard
complication is that the very variable lithological succession          et al. (2015) interpretations for these stratigraphic intervals
results in quite a complex long-term trend in the NGR signal            would result in a ∼ 100 kyr (short eccentricity) duration for
that cannot be fully removed by subtracting a simple linear             the 4–2.5 m cycles. Interestingly, sometimes a 12 m thick cy-
trend (the most common and basic form of detrending a sig-              cle (∼ 400 kyr) also appears in the spectral analysis results
nal prior to spectral analysis). It is possible to perform more         but only in the most heavily detrended signals. Overall, this
complex ways of detrending, for instance by using a polyno-             is a more tentative and not fully independent interpretation,

https://doi.org/10.5194/gchron-4-251-2022                                                          Geochronology, 4, 251–267, 2022
262                                                 M. Sinnesael et al.: Ordovician cyclostratigraphy of the Armorican Massif

Figure 7. Spectral analysis results based on the potassium natural gamma-ray record for the whole Postolonnec Formation, demonstrating
the influence of detrending.

as Dabard et al. (2015) made their interpretations assuming          such cases where there are tens of millions of years worth of
an astronomical origin of their signal. Striking the balance         stratigraphy with poor chronological constraints.
between removing long-term trends and what is a poten-                  Alternatively, the “spectral moments” approach is de-
tial astronomical signal proves to be particularly challenging       signed to pick up potential first-order changes in pronounced
for this long record with a pronounced change in sedimen-            sedimentation rate changes in astronomically forced signals
tary environment. One could additionally analyze every sub-          (Sinnesael et al., 2018b). The main underlying idea of the ap-
section individually, for example with high-resolution pXRF          proach is that some of the main characteristics of the evolv-
data, but the absence of independent age controls remains. In        ing spectra (e.g., mean frequency and bandwidth) shift fre-
the absence of datable volcanic ash beds, one way forward            quencies with changing sedimentation rates. For the same
to obtain some numerical age constraints could be the dating         astronomical imprint under lower sedimentation rates (corre-
of detrital zircons. Even though detrital zircons do not give a      sponding to a sedimentary sequence evolving into more dis-
depositional age, recent technological advances make it pos-         tal sedimentary environments), the same cycles are respec-
sible to, for example, date a large number of detrital zircons       tively less thick and corresponding frequencies are higher.
(with laser ablation inductively coupled plasma mass spec-           In general, there is also a higher occurrence rate of event
trometry, LA-ICP-MS), after which the youngest zircons can           beds in more proximal and sandstone-dominated intervals,
be very precisely dated (with chemical abrasion isotope di-          which are most probably not astronomically influenced. In
lution thermal ionization mass spectrometry, CA-ID-TIMS)             our case, the appearance of additional higher-frequency cy-
to come to an informative “maximal depositional age” (e.g.,          cles in the sandstone intervals of the Postolonnec Fm. shifts
Karlstrom et al., 2019; Landing et al., 2021). A conceptu-           the spectral characteristic values to higher values, implying
ally related approach concerns the dating of prismatic zir-          lower sedimentation rates. This is the opposite signal than
cons in a Darriwilian limestone bed in Sweden (Lindskog et           expected (higher sedimentation rates for sandstone intervals
al., 2017; Liao et al., 2020). For both the detrital zircon and      compared to mudstone intervals) and can be explained by the
non-bentonite-associated prismatic zircon dating approaches          extra components that appear in the higher-frequency ranges
it is crucial to keep in mind that the numerical age from the        (e.g., around 0.55, 0.7 and 0.9 cycles m−1 in Fig. 7) compared
dating comes with an additional (larger) uncertainty on its          to the more condensed intervals, rather than changes in sed-
depositional age. Even when such uncertainties would be on           imentation rate. It is important to consider that the sedimen-
the order of millions of years, they can still be valuable in        tation rate of sandstone is very likely to be higher than con-
                                                                     densed mudstones, but sandstone intervals equally represent

Geochronology, 4, 251–267, 2022                                                       https://doi.org/10.5194/gchron-4-251-2022
M. Sinnesael et al.: Ordovician cyclostratigraphy of the Armorican Massif 263
a less complete or continuous sedimentary record. Therefore, surements trace lithological changes and several crucial sed-
a purely numerical approach to formulate a duration estimate imentary features such as the occurrence of paleo-placers or
for the studied section, for example, might be invalid and not condensation horizons, as reflected by the presence of differ-
necessarily more robust than the more qualitative approach ent types of diagenetic concretions such as nodules.
of Dabard et al. (2015), which is sometimes also applied in The relative variations in the pXRF K and NGR K are very
similar studies (e.g., Loi et al., 2010). Another consideration similar in the measured logs. A comparison with the NGR
is indicating a degree of (un)certainty: some intervals might high-resolution logs of this study and the low-resolution logs
show clearly distinguishable sedimentary cycles, while oth- presented in Dabard et al. (2015) shows that these NGR mea-
ers are less clearly interpretable. By explicitly formulating surements are robust and reproducible. An important reason
these types of uncertainties one can inform potential future for this reproducibility is the fact that the NGR measure-
studies and come to more informative duration estimations ments average out natural radioactivity within a radius of
(Cramer et al., 2015; Sinnesael et al., 2019). at least 10 cm. The pXRF analyses have a ∼ 1 cm spot size.
Formulating cyclostratigraphic uncertainties in a Paleo- This allows for a much higher sampling rate, the measure-
zoic integrated stratigraphic framework is not an easy task ment of individual nodules or paleo-placer beds, but this also
(e.g., Sinnesael et al., 2019; Ghobadi Pour et al., 2020). Stud- means that the measurements pick up more detailed small-
ies that similarly target less conventional facies in younger scale variations and are harder to reproduce over different
stratigraphical intervals might in general have more robust field visits. Another advantage of the pXRF is the multi-
independent age constraints (e.g., Noorbergen et al., 2018) or elemental nature of the analysis.
more reliable astronomical parameters like insolation curves The use of high-resolution pXRF measurements and tra-
available (e.g., Vaucher et al., 2021). This is much less the ditional cyclostratigraphic tools delivered promising results
case for the Paleozoic (e.g., Laskar, 2020), often resulting in to distinguish sedimentary cycles in the relatively homo-
looser temporal constraints on astronomical interpretations. geneous condensed mudstone facies. Application of com-
For example, Sinnesael et al. (2021) reinterpreted the expres- monly used spectral analysis tools for the whole record with
sion of astronomically forced Upper Ordovician sedimentary strongly varying facies is shown to be challenging, with it
cycles on Anticosti Island (Long, 2007; Elrick et al., 2013), having particular difficulty distinguishing longer-term trends
resulting in a different interpretation of the duration of the and potential astronomical signals. In the absence of precise
cycles by an order of magnitude. The use of correlations and independent age constraints, it is not possible to fully con-
ages that are only loosely constrained in order to imply astro- firm the astrochronological framework suggested in Dabard
nomical origins of sedimentary sequences is not uncommon et al. (2015). A potential astronomical signal is suggested in
when interpreting lower Paleozoic records (e.g., Sutcliffe et the more homogenous mudstone facies, while reliable cycle
al., 2000; Gambacorta et al., 2018). Another common prac- identification in the more proximal sandstone-dominated in-
tice is the application of spectral techniques on stratigraphic tervals proves to be challenging. More work is needed to ex-
records that might not be ideal for such type of analysis be- pand our toolboxes to also study non-traditional sedimentary
cause of, e.g., their variable lithologies and the associated archives in terms of astronomical climate forcing to advance
variable expression of the proxies used (e.g., Zhong et al., our knowledge of deep-time cyclostratigraphy.
2018). These challenges accentuate the need for tailored cy-
clostratigraphic methodologies that are not simply a copy of
what has been shown to work well for younger stratigraphic Code and data availability. All produced R code, sedimentary
intervals; instead we need techniques that are adapted to the logs, and geochemical data used for spectral analyses are provided
reality of both the more limited availability of accurate in- in the Supplement.
dependent age constraints and the absence of well-preserved
open marine pelagic sections that characterize the Paleozoic
sedimentary record. Supplement. The supplement related to this article is available
online at: https://doi.org/10.5194/gchron-4-251-2022-supplement.
6 Conclusions
Author contributions. MS, TRAV, and PC conceptualized the
research. MS, AL, and MPD performed the field surveys and
Using pXRF measurements directly on outcrops can be chal- geochemical measurements. AL performed sequence stratigraphic
lenging because of superficial weathering of the rocks and analyses. MS performed spectral analyses. MS wrote the original
the need for flat measurement surfaces for XRF. The pro- manuscript with contributions from all co-authors to the revised
tected Postolonnec beach section is characterized by strong drafts.
tidal ranges and coastal erosion. This creates fresh and
smooth surfaces but they are also prone to be covered by bi-
ological material. Despite the challenging nature of the out- Competing interests. The contact author has declared that nei-
crop, we demonstrate that the non-destructive pXRF mea- ther they nor their co-authors have any competing interests.
https://doi.org/10.5194/gchron-4-251-2022 Geochronology, 4, 251–267, 2022264 M. Sinnesael et al.: Ordovician cyclostratigraphy of the Armorican Massif
Disclaimer. Publisher’s note: Copernicus Publications remains et du Dévonien du Massif armoricain, C. R. Palevol., 3, 353–360,
neutral with regard to jurisdictional claims in published maps and https://doi.org/10.1016/j.crpv.2004.06.003, 2004.
institutional affiliations. Botquelen, A., Gourvennec, R., Loi, A., Pillola, G. L., and
Leone, F.: Replacements of benthic associations in a se-
quence stratigraphic framework, examples from the Up-
Acknowledgements. We would like to dedicate this study to per Ordovician of Sardinia and Lower Devonian of the
Marie-Pierre Dabard, whose knowledge and passion for the Pos- Massif Armoricain, Palaeogeogr. Palaeocl., 239, 286–310,
tolonnec was unprecedented and was taken away too soon. Matthias https://doi.org/10.1016/j.palaeo.2006.01.016, 2006.
Sinnesael thanks the Research Foundation – Flanders (PhD fel- Catuneanu, O., Abreu, V., Bhattachary, J. P., Blum, M., Dalrym-
lowship FWOTM782) and is funded by the European Research ple, R. W., Eriksson, P. G., Fielding, C. R., Fisher, W. L., Gal-
Council (ERC) under the European Union’s Horizon 2020 research loway, W. E., Gibling, M. R., Giles, K. A., Holbrook, J. M.,
and innovation programme (advanced grant no. AstroGeo-885250). Jordan, R., Kendall, C. G. S. C., Macurda, B., Martinsen, O. J.,
This work was supported by the Fondazione Banco di Sardegna Miall, A. D., Neal, J. E., Nummedal, D., Pomar, L., Posamen-
(grant nos. F74I19000960007 and F75F21001270007). Thijs Van- tier, H. W., Pratt, B. R., Sarg, J. F., Shanley, K. W., Steel, R. J.,
denbroucke thanks the Koning Boudewijnstichting (Professor T. Strasser, A., Tucker, M. E., and Winker, C.: Towards the stan-
Van Autenboer Fund) and the Bijzonder Onderzoeksfonds (BOF dardization of sequence stratigraphy, Earth-Sci. Rev., 92, 1–33,
– UGent-BOF17/STA/013) for funding. Philippe Claeys thanks https://doi.org/10.1016/j.earscirev.2008.10.003, 2009.
the VUB Strategic Research Program for funding and the FWO Cohen, K. M., Finney, S. M., Gibbard, P. L., and Fan, J.-X.: The ICS
Hercules foundation for financing the XRF analytical platform at International Chronostratigraphic Chart, Episodes, 36, 199–204,
the VUB. This work contributes to International Geoscience Pro- https://doi.org/10.18814/epiiugs/2013/v36i3/002, 2013.
gramme projects IGCP 652 (Reading geologic time in Paleozoic Cooper, R. A. and Sadler, P. M.: The Ordovician Period, in: The Ge-
sedimentary rocks) and IGCP 753 (Rocks and the Rise of Ordovi- ologic Time Scale 2012, edited by: Gradstein, F. M., Ogg, J. G.,
cian Life). Schmitz, M. D., and Ogg, G. M., Elsevier, Amsterdam, 489–523,
https://doi.org/10.1016/B978-0-444-59425-9.00020-2, 2012.
Cramer, B. D., Vandenbroucke, T. R. A., and Ludvigson, G. A.:
Financial support. This research has been supported by the High-Resolution Event Stratigraphy (HiRES) and the quantifica-
Fonds Wetenschappelijk Onderzoek (grant no. FWOTM782), tion of stratigraphic uncertainty: Silurian examples of the quest
the European Research Council (ERC) under the European for precision in stratigraphy, Earth-Sci. Rev., 141, 136–153,
Union’s Horizon 2020 research and innovation programme https://doi.org/10.1016/j.earscirev.2014.11.011, 2015.
(grant no. AstroGeo-885250), FWO Hercules foundation, the Dabard, M.-P. and Loi, A.: Environmental control on concretion-
Fondazione Banco di Sardegna (grant nos. F74I19000960007 forming processes: Examples from Paleozoic terrigenous sed-
and F75F21001270007), the Koning Boudewijnstichting (Pro- iments of the North Gondwana margin, Armorican Mas-
fessor T. Van Autenboer Fund), the Universiteit Gent (grant sif (Middle Ordovician and Middle Devonian) and SW Sar-
no. BOF17/STA/013), and the Vrije Universiteit Brussel (VUB dinia (Late Ordovician), Sediment. Geol., 267–268, 93–103,
Strategic Research Program). https://doi.org/10.1016/j.sedgeo.2012.05.013, 2012.
Dabard, M.-P., Loi, A., and Paris, F.: Relationship between phos-
phogenesis and sequence architecture: Sequence stratigraphy
and biostratigraphy in the Middle Ordovician of the Armori-
Review statement. This paper was edited by Peter Abbott and
can Massif (NW France), Palaeogeogr. Palaeocl., 248, 339–356,
reviewed by two anonymous referees.
https://doi.org/10.1016/j.palaeo.2006.12.011, 2007.
Dabard, M.-P., Loi, A., Paris, F., Ghienne, J. F., Pistis, M., and Vi-
dal, M.: Sea-level curve for the Middle to early Late Ordovi-
References cian in the Armorican Massif (western France): Icehouse third-
order glacio-eustatic cycles, Palaeogeogr. Palaeocl., 436, 96–
Adams, J. A. S. and Weaver, C. E.: Thorium-to-Uranium ra- 111, https://doi.org/10.1016/j.palaeo.2015.06.038, 2015.
tios as indicators of sedimentary processes: example of con- de Winter, N. J., Sinnesael, M., Makarona, C., Vansteenberge,
cept of geochemical facies, Am. Assoc. Petr. Geol. B., S., and Claeys, P.: Trace element analyses of carbon-
42, 387–430, https://doi.org/10.1306/0BDA5A89-16BD-11D7- ates using portable and micro-X-ray fluorescence: Per-
8645000102C1865D, 1958. formance and optimization of measurement parameters
Beckhoff, B., Kanngiesser, B., Langhoff, N., Wedell, R., and Wolff, and strategies, J. Anal. Atom. Spectrom., 32, 1211–1223,
H. (Eds.): Handbook of Practical X-Ray Fluorescence Analysis, https://doi.org/10.1039/C6JA00361C, 2017.
Springer, Berlin, New York, https://doi.org/10.1007/978-3-540- Elrick, M., Reardon, D., Labor, W., Martin, J., Desrochers, A.,
36722-2, 2006. and Pope, M.: Orbital-scale climate change and glacioeustasy
Berger, A. and Loutre, M. F.: Astronomical forcing through geo- during the early Late Ordovician (pre-Hirnantian) determined
logical time, in: Orbital Forcing and Cyclic Sequences, edited from δ 18 O values in marine apatite, Geology, 41, 775–778,
by: DeBoer, P. L. and Smith, D. G., Int. As. Sed., 15–24, https://doi.org/10.1130/G34363.1, 2013.
https://doi.org/10.1002/9781444304039.ch2, 1994. Gambacorta, G., Menichetti, E., Trincianti, E., and Torri-
Botquelen, A., Loi, A., Gourvennec, R., Leone, F., and Dabard, M.- celli, S.: Orbital control on cyclical primary productivity
P.: Formation et signification paléo-environnementale des con- and benthic anoxia: Astronomical tuning of the Telychian
centrations coquillières: exemples de l’Ordovicien de Sardaigne
Geochronology, 4, 251–267, 2022 https://doi.org/10.5194/gchron-4-251-2022You can also read