Autonomous methane seep site monitoring offshore western Svalbard: hourly to seasonal variability and associated oceanographic parameters
←
→
Page content transcription
If your browser does not render page correctly, please read the page content below

Ocean Sci., 18, 233–254, 2022
https://doi.org/10.5194/os-18-233-2022
© Author(s) 2022. This work is distributed under
the Creative Commons Attribution 4.0 License.

Autonomous methane seep site monitoring offshore western
Svalbard: hourly to seasonal variability and associated
oceanographic parameters
Knut Ola Dølven1 , Bénédicte Ferré1 , Anna Silyakova1 , Pär Jansson2, , Peter Linke3, , and Manuel Moser1,
1 Centrefor Arctic Gas Hydrate, Environment, and Climate, UiT The Arctic University of Norway, 9019 Tromsø, Norway
2 MulticonsultKyst og Marin, 9013 Tromsø, Norway
3 GEOMAR Helmholtz Centre for Ocean Research Kiel, 24148 Kiel, Germany
 These authors contributed equally to this work.

Correspondence: Knut Ola Dølven (knut.o.dolven@uit.no)

Received: 31 August 2021 – Discussion started: 13 September 2021
Revised: 12 January 2022 – Accepted: 13 January 2022 – Published: 18 February 2022

Abstract. Improved quantification techniques of natural          1   Introduction
sources are needed to explain variations in atmospheric
methane. In polar regions, high uncertainties in current esti-
mates of methane release from the seabed remain. We present      Unexplained changes in atmospheric methane (CH4 ) mole
unique 10- and 3-month time series of bottom water mea-          fraction motivate research in understanding and quantifying
surements of physical and chemical parameters from two au-       non-anthropogenic sources (Saunois et al., 2020). The atmo-
tonomous ocean observatories deployed at separate intense        spheric forcing of CH4 is particularly sensitive to changes
seabed methane seep sites (91 and 246 m depth) offshore          in emission rates due to its high warming potential and short
western Svalbard from 2015 to 2016. Results show high            lifetime. Improved knowledge about atmospheric CH4 fluxes
short-term (100–1000 nmol L−1 within hours) and seasonal         is therefore crucial to constrain future climate projections
variation, as well as higher (2–7 times) methane concentra-      (Pachauri and Meyer, 2014; Myhre et al., 2016b). These
tions compared to previous measurements. Rapid variability       properties of atmospheric CH4 also make reducing anthro-
is explained by uneven distribution of seepage and changing      pogenic CH4 emissions a potential solution for rapid climate
ocean current directions. No overt influence of tidal hydro-     change mitigation (Saunois et al., 2016). A global effort to
static pressure or water temperature variations on methane       cut greenhouse gas emissions through international agree-
concentration was observed, but an observed negative cor-        ments is, however, dependent on precise estimates of sources
relation with temperature at the 246 m site fits with hy-        and sinks to verify contributions from different nations.
pothesized seasonal blocking of lateral methane pathways            Seabed seepage is considered a minor source of atmo-
in the sediments. Negative correlation between bottom wa-        spheric CH4 , but there is high uncertainty in current and
ter methane concentration (and variability) and wind forc-       predicted emission estimates (Saunois et al., 2016). Current
ing, concomitant with signs of weaker water column strati-       estimates suggest a total contribution of 7 (5–10) Tg yr−1
fication, indicates increased potential for methane release to   (Etiope et al., 2019; Saunois et al., 2020), which is ∼ 1 %
the atmosphere in fall and winter. We present new informa-       of the total CH4 emissions to the atmosphere. Methane is re-
tion about short- and long-term methane variability and pro-     leased from the seabed as free gas (bubbles) and dissolved
vide a preliminary constraint on the uncertainties that arise    gas in sediment pore water. Bubbles rise quickly towards the
in methane inventory estimates from this variability.            sea surface, but most CH4 dissolves near the seafloor because
                                                                 of gas exchange across the bubble rims and bubble dissolu-
                                                                 tion (McGinnis et al., 2006; Jansson et al., 2019a). Dissolved
                                                                 CH4 is dispersed and advected by ocean currents (Silyakova

Published by Copernicus Publications on behalf of the European Geosciences Union.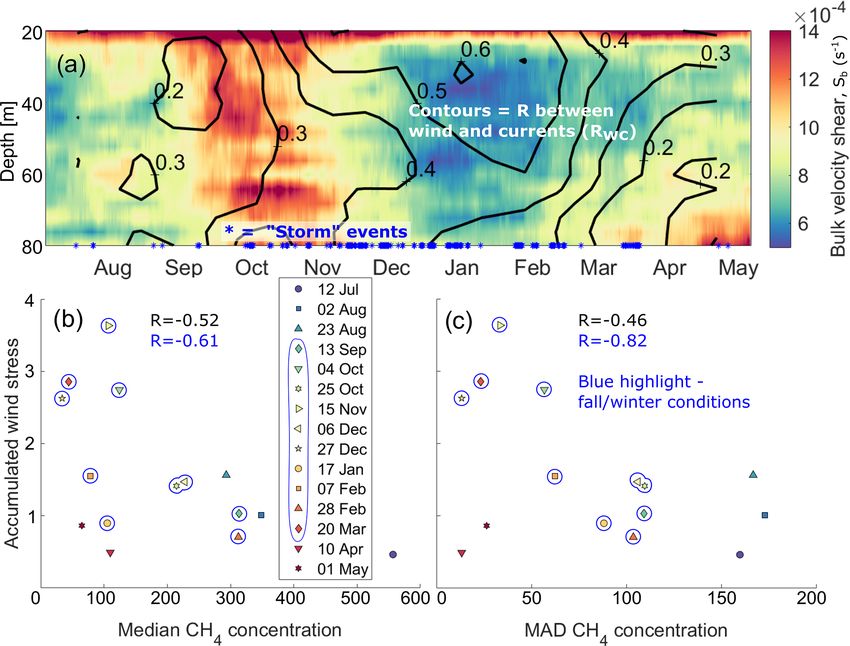
234                             K. O. Dølven et al.: Autonomous methane seep site monitoring offshore western Svalbard

et al., 2020) and is continuously transformed to carbon diox-      1.1   Regional settings
ide (CO2 ) by bacterial aerobic oxidation (Hanson and Han-
son, 1996; Reeburgh, 2007). These processes significantly          Two observatories (O91 and O246 ) were deployed from
limit the lifetime of CH4 in the water column, and the amount      June 2015 (CAGE 15-3 cruise) to May 2016 (CAGE 16-4
of CH4 that can reach the atmosphere is highly dependent on        cruise) from R/V Helmer Hanssen at the inter-trough shelf
the depth where the seepage occurs (McGinnis et al., 2006;         region between Isfjorden and Kongsfjorden, west of Prins
Graves et al., 2015). Intense CH4 seepage at shallow depths        Karls Forland. The O91 observatory was deployed at 91 m
in coastal areas and on continental shelves is therefore the       water depth on the continental shelf (78.561◦ N, 10.142◦ E),
main potential source of seabed CH4 to the atmosphere.             and the O246 observatory was deployed at 246 m water depth
   The shallow continental margins of the Arctic Ocean store       further offshore close to the shelf break (78.655◦ N, 9.433◦ E,
large amounts of CH4 as free gas, gas dissolved in pore wa-        Fig. 1).
ter fluid, and gas hydrates (James et al., 2016; Ruppel and           Both sites were located in areas with thousands of pre-
Kessler, 2017), i.e., clathrate structures composed of water       viously mapped CH4 gas seeps (e.g., Sahling et al., 2014;
trapped by hydrocarbon molecules formed and kept stable at         Veloso-Alarcón et al., 2019; Silyakova et al., 2020; this work;
low temperature and high pressure (Sloan, 1998). Increas-          see Fig. 1), often referred to as “flares” due to the appearance
ing bottom water temperature has the potential to liberate         of bubble streams in echo sounder data. Nonetheless, atmo-
methane from these reservoirs via various mechanisms, po-          spheric sampling in this region suggests that any emissions
tentially resulting in a positive climate feedback loop (West-     to the atmosphere are small (Platt et al., 2018). Gas accu-
brook et al., 2009; Shakhova et al., 2010; James et al., 2016).    mulation at the O246 seep site has been suggested to be a
   Studies on CH4 inventory, distribution and release in the       result of gas migration in permeable layers within the seabed
Arctic Ocean are mainly based on research cruise data from         from deeper free gas or hydrate reservoirs (Rajan et al., 2012;
late spring to early fall, when ice and weather conditions al-     Sarkar et al., 2012; Veloso-Alarcón et al., 2019), while seep-
low fieldwork in the region (Gentz et al., 2014; Sahling et al.,   age at site O91 has been attributed to thawing sub-sea per-
2014; Mau et al., 2017), whereas winter data are sparse. Bot-      mafrost due to ice sheet retreat at the end of the last glacia-
tom water temperature (Westbrook et al., 2009; Reagan et al.,      tion (Sahling et al., 2014; Portnov et al., 2016). Water sam-
2011; Ferré et al., 2012; Braga et al., 2020), water mass ori-     pling has indicated high temporal variability, with bottom
gins (Steinle et al., 2015), micro-seismicity (Franek et al.,      water concentrations (average) changing from 200 nmol L−1
2017) and hydrostatic pressure (Linke et al., 2009; Römer          within 1 week in July 2014 at O91 (Myhre et al., 2016a)
et al., 2016) have all been proposed to be linked with sources     and ∼ 80 nmol L−1 within 20 h (two single-point measure-
and sinks of CH4 in the water column. These processes act          ments) at O246 in August 2010 (Gentz et al., 2014). A con-
on a wide range of timescales, from hours (e.g., hydrostatic       sistent pattern of decreasing concentrations from the seafloor
pressure) to decades (bottom water temperature). Without a         to the sea surface at both sites (400 to < 8 nmol L−1 at O91 ,
better understanding of the spatial and temporal variability       Myhre et al., 2016a, and from > 500 to < 20 nmol L−1 at
of CH4 in Arctic seep sites, it is challenging to untangle         O246 , Gentz et al., 2014) has also been observed. Further off-
these processes. Unconstrained local variability in CH4 seep-      shore, continuous measurements from a towed fast-response
age and concentration also imposes a high degree of uncer-         underwater laser spectrometer also revealed very high spatial
tainty on CH4 inventory estimates (Saunois et al., 2020). The      CH4 variability (Jansson et al., 2019b).
combination of climate-sensitive CH4 storages, vast shal-             The local water masses are characterized by exchange
low ocean regions and limited data availability highlights the     and convergence of warm, saline Atlantic water (e.g., tem-
need for more understanding of seabed CH4 seepage on Arc-          perature T > 3 ◦ C and salinity SA > 34.9; Swift and Aa-
tic shelves.                                                       gaard, 1981) in the West Spitsbergen Current and colder,
   To assess the aforementioned challenges, we have ob-            fresher Arctic water (e.g., T < 0 ◦ C, 34.3 < SA < 34.8; Lo-
tained, analyzed and compared two unique long-term under-          eng, 1991) in the Coastal Current combined with sea-
water multi-parameter time series from seafloor observato-         sonal cooling, ice formation and freshwater input from land
ries deployed at two distinct intense CH4 seep sites on the        (Nilsen et al., 2016) (Fig. 1). Local mixing rates can be
western Svalbard continental shelf (Fig. 1) where no CH4           strongly affected by synoptic-scale weather systems, caus-
measurements have previously been done in winter season.           ing upwelling and disruption of the front between the two
We combine high-frequency physical (ocean currents, tem-           ocean currents (Saloranta and Svendsen, 2001; Cottier et al.,
perature, salinity, pressure) and chemical (O2 , CO2 , CH4 )       2007). Freshwater input in summer stratifies the water col-
data to perform hypothesis testing and provide new insights        umn, while cooling, storm activity and sea ice formation can
on CH4 distribution, content, and variability on short (min-       facilitate vertical mixing in winter (Saloranta and Svendsen,
utes) and long (seasonal) timescales and potential implica-        2001; Nilsen et al., 2016).
tions.

Ocean Sci., 18, 233–254, 2022                                                          https://doi.org/10.5194/os-18-233-2022
K. O. Dølven et al.: Autonomous methane seep site monitoring offshore western Svalbard                                              235

Figure 1. Bathymetry of the study area with the locations of the observatories O91 and O246 offshore western Svalbard. Flares detected by
single-beam echo sounder survey prior to recovering the observatories (May 2016, cruise CAGE 16-4) are indicated with red dots, and ship
tracks are shown as brown lines. The inset map shows the working area (red square) offshore Svalbard. WSC and CC refer to the warm West
Spitsbergen Current and cold Coastal Current, respectively.

2   Methods                                                            with polydimethylsiloxane (PDMS) membranes and Seabird
                                                                       SBE 5M pumps (see Appendix B).
The “K-Lander” ocean observatories were designed to mon-                  The high power consumption of the Contros HydroC CH4
itor CH4 release and associated physical and chemical pa-              and CO2 sensors required a power cycling mode to allow for
rameters in challenging environments (see Appendix A). A               long-term monitoring while simultaneously capturing rapid
launcher equipped with camera and telemetry allowed for                short-term variability. Partial pressure of CH4 and CO2 was
safe deployment at a site selected by visual control. Obser-           therefore measured continuously for 24 h every 21 d and for
vatory O91 recorded data from 2 July 2015 to 6 May 2016,               1 h every day (see Table B1). Methane concentration data
while O246 recorded data from 1 July until 3 October 2015,             were corrected for slow response time onto a 3 min interval
when data recording ceased due to an electrical malfunction.           grid and converted to absolute concentration following Døl-
   Both observatories were equipped with an acous-                     ven et al. (2021), which is the default “CH4 concentration”
tic Doppler current profiler (ADCP), a conductivity–                   discussed and described in this text (see Appendix B). Faulty
temperature–depth (CTD) profiler with an oxygen optode,                pumps in the CO2 sensors ambiguously increased the re-
and Contros HydroC CO2 II and HydroC Plus CH4 sensors                  sponse time, which prevented response time correction, mak-
(Fig. A1a; details about the instrumentation are provided in           ing CO2 data suitable only for long-term qualitative analysis.
Appendix B). The deployed HydroC CH4 , being a younger                    Uncertainty ranges for the CH4 sensor data are reported
iteration of the sensor, relies on a tunable diode laser ab-           as 95 % confidence intervals and typically vary between 5 %
sorption spectrometry (TDLAS) detector (rather than non-               and 20 % (Fig. B1b). We did not perform any post-validation
dispersive infrared spectrometry (NDIR)), while the CO2                and/or intermittent validation. Although always an advan-
sensors use NDIR detectors. Both sensors were equipped                 tage for all sensors in long-term deployments, such valida-

https://doi.org/10.5194/os-18-233-2022                                                                Ocean Sci., 18, 233–254, 2022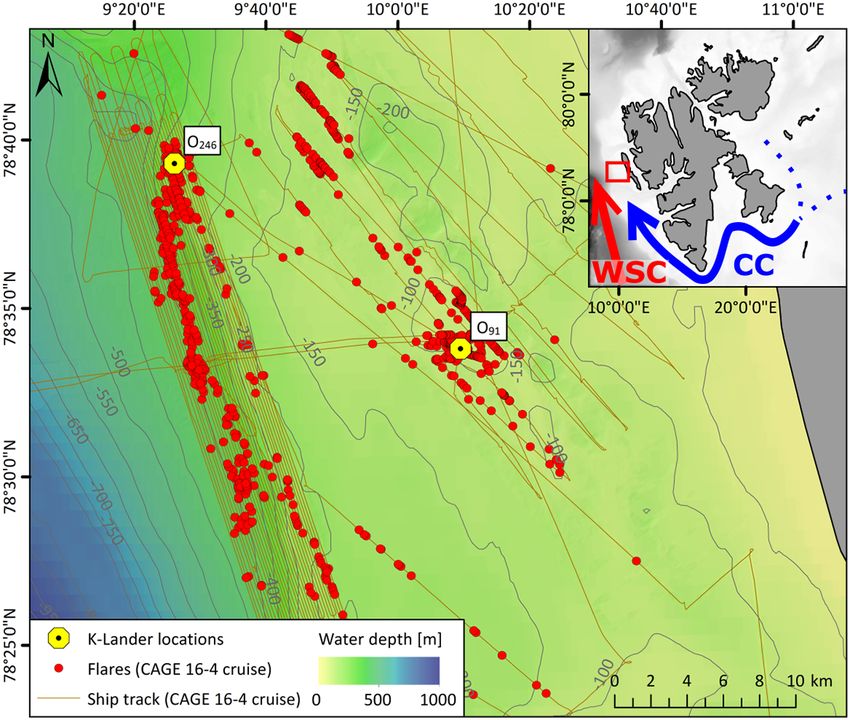
236                                  K. O. Dølven et al.: Autonomous methane seep site monitoring offshore western Svalbard

Table 1. Correlation coefficients between variables at O91 . The terms RTC CH4 and raw CH4 refer to response-time-corrected and untreated
CH4 data, respectively (Sect. 2 and Appendix B).

                          RTC CH4      Raw CH4    Temperature    Salinity   Oxygen     Pressure    Solubility   Wind speed      CO2
                           mol L−1      mol L−1           ◦C                mol L−1        dbar     mol L−1         m s−1       µatm
      RTC CH4                    1         0.91        −0.06       0.23        0.03       0.08         0.06          −0.33     −0.25
      Raw CH4                 0.91            1        −0.07       0.27        0.03       0.10         0.06          −0.37     −0.31
      Temperature           −0.06         −0.07            1       0.69       −0.94      −0.01        −0.99           0.37      0.29
      Salinity                0.23         0.27         0.69          1       −0.78      −0.06        −0.58           0.06      0.46
      Oxygen                  0.03         0.03        −0.94      −0.78           1       0.02         0.85          −0.33     −0.67
      Pressure                0.08         0.10        −0.01      −0.06        0.02          1         0.16           0.00     −0.10
      Solubility (CH4 )       0.06         0.06        −0.99      −0.58        0.85       0.16            1          −0.35     −0.30
      Wind speed             -0.33        −0.37         0.37       0.06       −0.33       0.00        −0.35              1      0.52
      CO2                   −0.25         −0.31         0.29       0.46       −0.67      −0.10        −0.30           0.52         1

tion is not a requirement for the TDLAS-based sensor (as op-           bution, with a mean and median of 227 and 165 nmol L−1 ,
posed to NDIR), due to its high long-term stability. Standard          respectively, and interquartile range of 88–334 nmol L−1 .
post-processing (e.g., inspection of metadata such as internal         Large variations (> 100 up to almost 1000 nmol L−1 ) in CH4
pressure and temperature) and evaluation of fit residuals in           concentration occurred on short timescales (< 1 h) through-
the response time correction procedure (see Appendix B and             out the measurement period (see Fig. 2a, d and all 24 h
Dølven et al., 2021) also indicated consistent sensor behav-           periods in Appendix C), with an average range for all 24 h
ior throughout the deployments. It is also worth noting that           periods of 840 nmol L−1 and a median rate of change (ROC)
the current paper is concerned with large changes and high             of 3.2 nmol L−1 min−1 . We also observe a long-term trend of
concentrations, and we are confident that the quality of the           decreasing running median (2-week window) concentrations
response-time-corrected Contros HydroC CH4 data is suffi-              towards winter, from 495 nmol L−1 in July–August 2015 to
cient to support the inferences described herein.                      53 nmol L−1 in January 2016 (Fig. 2). There was a relatively
   We calculated correlation coefficient (R) matrices to give          weak but significant negative correlation between the wind
a first-order overview of the linear relationships between the         speed and CH4 concentration (RRTC = −0.33) but otherwise
measured parameters. We mapped the flares in the area using            weak to non-existent linear relationships between CH4
single-beam echo sounder data collected during the observa-            concentration and the measured ocean parameters (Table 1).
tory recovery cruise in 2016 (CAGE 16-4, Fig. 1) and esti-                CO2 averaged 403 µatm with an increase towards mid-
mated gas flow rates using the FlareHunter software (Veloso            November 2015 (∼ 410 µatm) and then a decrease until
et al., 2015). Additionally, we obtained 10 m wind reanalysis          6 May (∼ 391 µatm) in 2016 (Fig. 2a). CO2 dropped to
data from the ERA-Interim database.                                    ∼ 305 µatm on 24 August, concurrent with a rapid decrease
   We calculated seawater density (McDougall and Barker,               in salinity (−0.5), increase in temperature and oxygen, and
2011) and CH4 solubility (Kossel et al., 2013) using the CTD           high CH4 concentration. The increase in oxygen rules out
data. A CTD cast (SBE plus 24 Hz) prior to the O91 recovery            methanogenesis. Instead, there might be at least two expla-
(6 May 2016) showed a salinity drift in the conductivity sen-          nations for the reduction of CO2 and enrichment of CH4 :
sor of around −0.4 (here and elsewhere in the paper, salinity          (i) water column mixing, which brings oxygen-rich, warm
values are practical salinity). Post-calibration inspection of         and fresh surface water to deeper depths (and with it CO2 -
the conductivity signal and potential water mass mixing end-           depleted water), or (ii) methane enrichment by zooplankton
members indicates that this might have been caused by mud              following the summer bloom.
pollution occurring in late 2015 or early 2016.                           Bottom water temperature increased steadily from ∼ 3 in
                                                                       July 2015 to ∼ 5.5 ◦ C in October–November 2015, with oc-
                                                                       casional sharp shifts (T ± 1 ◦ C) occurring within hours to
3     Results                                                          days (Fig. 2b). Temperature then decreased from the begin-
                                                                       ning of December 2015 to ∼ 1.8 ◦ C at the end of the de-
3.1     Time series at site O91                                        ployment in May 2016, showing more frequent and stronger
                                                                       episodes of rapid temperature shifts (T ± 2 ◦ C also occurring
Dissolved CH4 concentration at site O91 ranged                         over hours or days). Despite uncertainty in salinity data, it is
from 5 ± 3 nmol L−1 (6 December in 2015) to                            worth noting that these rapid shifts in temperature and salin-
1748 ± 142 nmol L−1 (20 August in 2015) (Fig. 2a and                   ity were reproduced by the Svalbard 800 model in the same
Appendix C), with 2.5 and 97.5 percentiles of 16 and                   area (Silyakova et al., 2020) by eddy activity.
785 nmol L−1 . The data follow a nearly lognormal distri-

Ocean Sci., 18, 233–254, 2022                                                               https://doi.org/10.5194/os-18-233-2022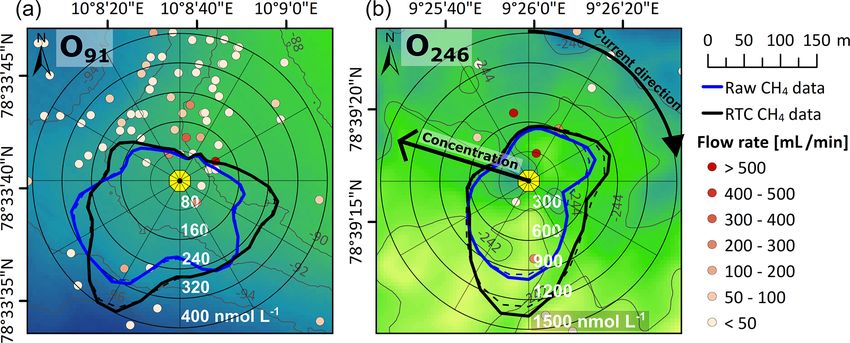
K. O. Dølven et al.: Autonomous methane seep site monitoring offshore western Svalbard 237
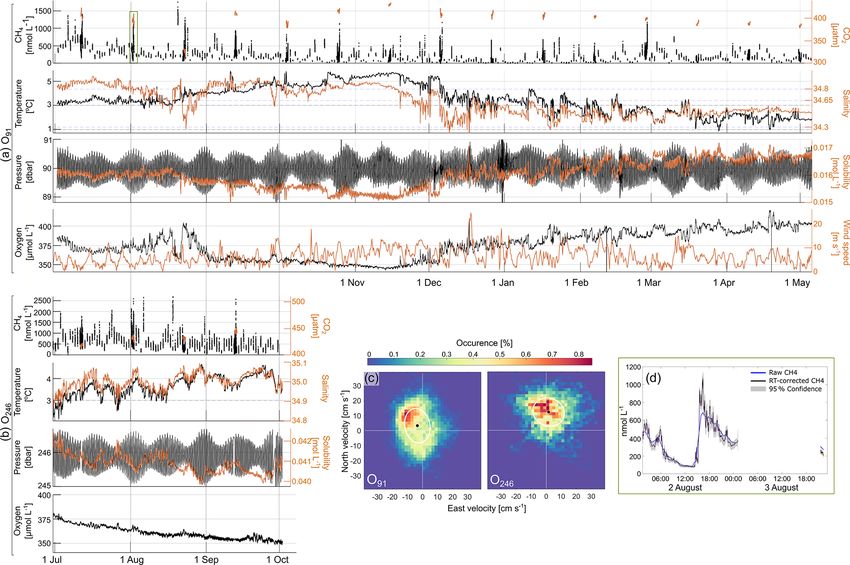
Figure 2. Time series from (a) O91 and (b) O246 showing response-time-corrected (see Appendix B) CH4 , CO2 , temperature, salinity,
pressure, CH4 solubility, oxygen and wind speed (10 m) data. The O246 data are truncated due to an electrical malfunction in the system on
3 October. (c) A 2 d histogram and 1 SD variance ellipse of bottom current velocity (81 m depth at O91 and 236 m depth at O246 ) and (d) an
example of 24 and 1 h (2 and 3 August) CH4 concentration measurement period from O91 (green box). All 24 h measurement periods are
shown in Appendix C. Note the different scales between O91 and O246 .
Hydrostatic pressure was mostly governed by tides (Fig. 2c). The current usually had one counterclockwise ro-
(94.5 % of variance) with a dominant semi-diurnal M2 tide tation every 23.93 h period, corresponding to the diurnal
(M2 refers to a tidal constituent with period 12.42 h; see, e.g., K1 tidal constituent (tide with period 23.93 h; see Gerkema,
Gerkema, 2019). Amplitudes varied from ∼ 1.2 to 1.5 m dur- 2019) with a secondary semi-diurnal (M2) modulation.
ing neap and spring cycles (Fig. 2c).
The calculated CH4 solubility decreased from 3.2 Time series at site O246
0.016 mol L−1 in July 2015 to 0.015 mol L−1 at the end
of November 2015 and increased to almost 0.017 mol L−1 CH4 concentration at site O246 ranged from 10 ± 3 nmol L−1
in May 2016 (Fig. 2c). This long-term trend was mainly on 21 September 2015 to 2727 ± 182 nmol L−1 on 18
caused by temperature variability (R = −0.99), while August 2015, with 2.5 and 97.5 percentiles of 107 and
tidal pressure changes caused a semi-diurnal variation of 1374 nmol L−1 . The data approximately follow log-
± ∼0.005 mol L−1 . normal distribution with average and median of 577
Dissolved O2 decreased from ∼ 385 µmol L−1 in and 600 nmol L−1 , respectively, and an interquartile
July 2015 to ∼ 350 µmol L−1 at the beginning of December range of 293–721 nmol L−1 . The median ROC of CH4
2015 and increased to ∼ 400 µmol L−1 towards 6 May 2016 (31 nmol L−1 min−1 ) was almost 20 times higher than
(Fig. 2d) and followed temperature inversely (R = −0.94), site O91 (Fig. 2b and Appendix C). There was also clear
with similar long- and short-term variability. diurnal periodicity in CH4 concentration at O246 . The
The averaged bottom water current (81 m above the long-term trend (2-week running mean) shows decreasing
seafloor) was 4 cm s−1 in a northwestward direction (321◦ N) concentrations until 3 October 2015 (end of the measuring
period, Fig. 2b). Dissolved O2 decreased from ∼ 380 to
https://doi.org/10.5194/os-18-233-2022 Ocean Sci., 18, 233–254, 2022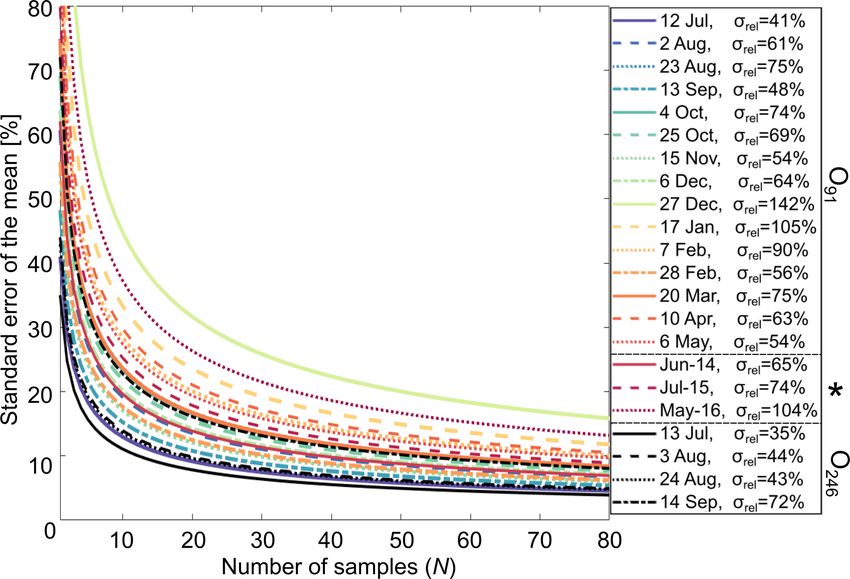
238                             K. O. Dølven et al.: Autonomous methane seep site monitoring offshore western Svalbard

∼ 300 µmol L−1 and was negatively correlated with water           most of the measuring period also shows that even though
temperature (R = −0.61; see Table 2 for the complete              observed average concentrations are lower in winter months,
correlation matrix).                                              the seep configuration did not change significantly from
   Temperature and salinity increased from ∼ 2.5 to ∼ 4.0 ◦ C     July 2015 to May 2016, and dissolved CH4 was efficiently
and ∼ 34.85 up to ∼ 35.0, respectively, from the deployment       dispersed in relatively high concentrations in the whole seep-
until October 2015 (Fig. 2b), with Atlantic water being domi-     age area.
nant throughout the measuring period. Rapid shifts of around         Furthermore, daily CH4 concentrations at site O91 were
± 1 ◦ C and 0.05 salinity occurred occasionally over a period     higher on average than the 24 h measurements (313 vs.
of hours to days.                                                 200 nmol L−1 ). This can be explained by the compara-
   Variance in hydrostatic pressure was mainly explained by       ble measurement periodicity (24 h) and tidal periodicity
the tides (95.2 %), which were mainly governed by the semi-       (23.93 h) in the ocean currents, resulting in predominantly
diurnal M2 tide, with weaker diurnal and fortnightly mod-         eastward advection during daily measurements, thus system-
ulation (Fig. 2b). Changes in pressure varied from ∼ 1.2 to       atically transferring water from a weak seepage area (Fig. 3).
∼ 1.5 m during periods of neap and spring tide.                   We did not observe this effect at site O246 , most likely due to
   Being governed mainly by temperature (R = −0.99), CH4          less tidal variance in the current direction (Fig. 2b). Nonethe-
solubility dropped from 0.042 to 0.040 mol L−1 from the de-       less, this systematic tide-induced bias on the daily measure-
ployment in July until October 2015, with a semi-diurnal          ments at site O91 highlights the importance of taking the
variation of ∼ 0.005 mol L−1 due to tidal changes in hydro-       oceanographic conditions into account to avoid misinterpre-
static pressure.                                                  tation of variability.
   The averaged current was ∼ 10 cm s−1 northward (7◦ N)             Since currents are mostly northward and seepage is mostly
(Fig. 2c). Variability in the along-slope current (−10◦ N di-     located to the north of both observatories, averaged mea-
rection) was strongly related to the semi-diurnal M2 tidal        sured CH4 concentrations are likely lower than the aver-
component, while the cross-slope currents were governed           age over the immediate surrounding area (Fig. 3). Despite
by the diurnal K1 frequency. The bottom water current ro-         this, the observatory data show higher average CH4 concen-
tated counterclockwise with a period of 23.93 h (K1 tidal         trations than previously reported. In the area surrounding
constituent) and semi-diurnal modulation in the along-slope       site O91 , Silyakova et al. (2020) reported average concen-
component. Dissolved CH4 concentration was weakly anti-           trations of 92, 70 and 61 nmol L−1 in June 2014, July 2015
correlated with wind speed (R = −0.29), temperature (R =          and May 2016, respectively, based on discrete water sam-
−0.31), and salinity (R = −0.24) and positively correlated        pling. Averaged CH4 concentrations measured at site O91
with CH4 solubility (R = 0.33) and oxygen (R = 0.3).              in July 2015 and May 2016 were 566 and 110 nmol L−1 ,
                                                                  respectively, i.e., around 8 and 2 times higher than values
                                                                  reported by Silyakova et al. (2020), respectively. The max-
4     Discussion                                                  imum CH4 concentration at O91 of 1748 ± 142 nmol L−1
                                                                  on 20 August 2015 also significantly exceeds the pre-
4.1    CH4 variability                                            viously maximum recorded concentration in the area of
                                                                  480 nmol L−1 (July 2014, Silyakova et al., 2020). At site
Combining mapped flares and flow rates from the recov-            O246 the August 2016 average (564 nmol L−1 ) was 8 times
ery cruise (May 2016) with bottom water current velocity          higher than what Gentz et al. (2014) found in August 2010
(9 m above the seafloor) reveals that CH4 concentration was       (70 nmol L−1 ) using an altimeter-controlled CTD towed at
strongly affected by whether water was advected from ar-          2 m above the seafloor. The maximum concentration in Au-
eas where we mapped strong or weak seepage in May 2016            gust 2016 also significantly exceeded previous observations,
(Fig. 3). Strong seeps (flow rate > 200 mL−1 min−1 ) were         with 2661 ± 163 nmol L−1 compared to 524 nmol L−1 mea-
mainly located between ∼ 30 and 80 m to the north or north-       sured by Gentz et al. (2014).
east of site O91 , and only weak and more distant seepage            These differences could be a result of temporal, local or
was observed southwest of the observatory (Fig. 3a). Con-         regional differences in CH4 concentration. However, strong
sequently, the averaged CH4 concentration from water com-         vertical gradients in dissolved CH4 are well documented at
ing from northeast was ∼ 440 nmol L−1 , while water from          both seep sites (Gentz et al., 2014), and our sensors mea-
the southwest averaged ∼ 100 nmol L−1 . Similarly, a strong       sured closer to the seafloor (1.2 m above seafloor) compared
CH4 seep (flow rate ∼ 1200 mL min−1 ) was mapped ∼ 40 m           to Gentz et al. (2014) (2 m above seafloor) and Silyakova et
north of site O246 , making water advected from this direction    al. (2020) (5 to 15 m above seafloor). Additionally, the ob-
highly elevated in CH4 , with an average of ∼ 1400 nmol L−1       servatories were deployed close to seeps using a launcher, as
compared to the overall average of 577 nmol L−1 (Fig. 3b).        opposed to “blind” water sampling from a shipborne rosette.
The rapid changes in dissolved CH4 can to a high degree           Methane was also measured in situ, thereby avoiding poten-
be explained by this relationship, due to the high variabil-      tial CH4 outgassing after retrieval of water samples (Schlüter
ity in ocean current velocity. That this relationship holds for   et al., 1998).

Ocean Sci., 18, 233–254, 2022                                                         https://doi.org/10.5194/os-18-233-2022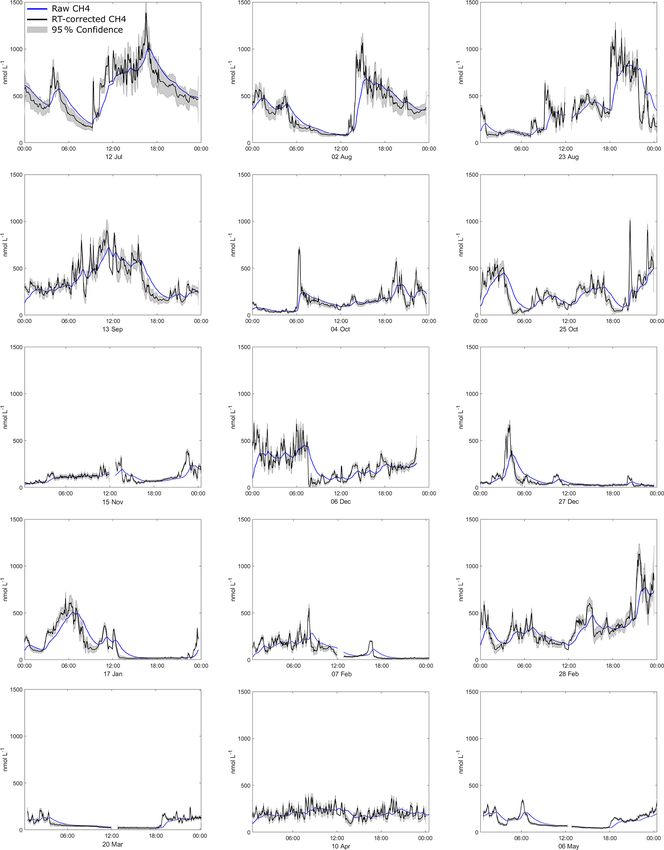
K. O. Dølven et al.: Autonomous methane seep site monitoring offshore western Svalbard                                              239

Table 2. Correlation coefficients between variables at O91 . The terms RTC CH4 and raw CH4 refer to response-time-corrected and untreated
CH4 (see Sect. 2 and Appendix B).

                       RTC CH4      Raw CH4      Temperature     Salinity   Oxygen     Pressure    Solubility   Wind speed      CO2
                        mol L−1      mol L−1             ◦C                 mol L−1        dbar     mol L−1         m s−1       µatm
   RTC CH4                     1         0.78          −0.31       −0.24       0.30       0.15         0.33          −0.29     −0.13
   Raw CH4                  0.78            1          −0.45        0.26       0.48       0.10         0.45          −0.44     −0.09
   Temperature             −0.31        −0.45              1        0.87      −0.61      −0.02        −0.99           0.38      0.22
   Salinity                −0.24        −0.26           0.87           1      −0.22      −0.03        −0.87           0.07      0.13
   Oxygen                   0.30         0.48          −0.61       −0.22          1       0.06         0.59          −0.65     −0.41
   Pressure                 0.15         0.01          −0.02       −0.03       0.06          1         0.16          −0.05      0.14
   Solubility (CH4 )        0.33         0.45          −0.99       −0.87       0.59       0.16            1           0.38     −0.20
   Wind speed              −0.29        −0.44           0.38        0.07      −0.65      −0.05         0.38              1      0.18
   CO2                     −0.13        −0.09           0.22        0.13      −0.41       0.14        −0.20           0.41         1

Figure 3. O91 (a) and O246 (b) location (yellow dot) and flow rates from flares mapped in their vicinity during CAGE 16-4 (color scale).
Background color (green and blue) illustrates seafloor bathymetry. The compass diagram shows the relationship between ocean current
direction (angle) and CH4 concentration (distance from center; black is response-time-corrected (RTC) data, and raw data are in blue).

   Dissolved CH4 within shallow seep sites where gas can               error can then be found by calculating the standard error of
bypass the oceanic sinks often present heterogeneous dis-              the mean (SEM) for a given number of samples N using the
tribution and rapid temporal variability (Gentz et al., 2014;          24 h time series as an underlying distribution representing the
Myhre et al., 2016a). Our results show that the temporal vari-         sub-daily variability of the seep site (Fig. 4; Appendix D con-
ability at the two seep sites is higher than previously reported       tains a detailed outline of the methodology). Even though
and that changing ocean currents and configuration of nearby           surveys often require more than 24 h to complete (2–3 d in
seeps are major contributors. This high short-term variability         Silyakova et al., 2020), a majority of processes causing short-
introduces a conceptual error in studies relying on discrete           term variability have periods below or at ∼ 24 h (for instance
water sampling (e.g., to calculate inventories) because the            tides and many turbulent eddies; see, e.g., Sect. 3.2 and 3.1
time required to conduct the survey (measured in days) is              and Talley et al., 2011), likely making the daily distribution
much longer than large temporal variations in concentration            relevant also for surveys with longer duration. We compared
(up to an order of 103 nmol L−1 within hours).                         SEM calculations based on the observatory 24 h time series
   We can obtain a first-order constraint on errors caused by          with SEM calculations for the bottom water (∼ 5 m above
short-term variability in a hypothetical water sampling sur-           the seafloor) discrete water sample data used for average
vey using the 24 h time series from the observatories. We as-          and inventory estimates of the O91 seep site in Silyakova et
sume the hypothetical survey seeks to find the average con-            al. (2020) (also included in Fig. 4).
centration in the bottom layer of the seep site. The expected

https://doi.org/10.5194/os-18-233-2022                                                                Ocean Sci., 18, 233–254, 2022
240                               K. O. Dølven et al.: Autonomous methane seep site monitoring offshore western Svalbard

Figure 4. Relative standard error of the mean for different numbers of samples N for O91 24 h data, data presented in Silyakova et al. (2020)
(“June-14”, “July-15”, “May-16”), and O246 24 h data (in black). Relative standard deviation (corresponding to the standard error with
N = 1) is given in the legend (σrel ). * Data from Silyakova et al. (2020) calculated assuming that the sample distribution resembles the
underlying distribution (see Appendix D).

   The absolute SEM (in nmol L−1 ) is generally higher for               can potentially explain some of the discrepancies in estimates
time series with higher averaged concentrations, making the              of oceanic CH4 inventories and fluxes.
relative SEM cluster well, with gradually diminishing range                 Our findings stress the importance of sufficiently dense
for increasing N (an inherent property of the SEM, e.g.,                 mapping and knowledge about the underlying seep condition
12 %–45 % for N = 10, 9 %–30 % for N = 30, Fig. 4). The                  when collecting water samples for inventory estimates. They
SEM of the data from Silyakova et al. (2020) is similar to               also highlight the advantage of towed or autonomous instru-
the SEM of the 24 h time series, with a common range of                  mentation capable of providing continuous CH4 data, giving
5 %–15 % expected error for surveys with N ∼ 60 samples                  considerably better coverage and representation of the CH4
(N = 64, 62, and 63 in Silyakova et al. 2020). It should                 distribution in less time (e.g., Sommer et al., 2015; Grilli
be noted that the comparison with data from Silyakova et                 et al., 2018; Canning et al., 2021). Assuming a distribution
al. (2020) has caveats, e.g., that the observatory data do not           that better reflects the uneven spread of CH4 when applying
contain errors due to spatial variability and an assumption of           interpolation and extrapolation techniques could also limit
representative short-term temporal variability at the observa-           estimation errors. Future studies should investigate how ini-
tory sites (see also Appendix D).                                        tial errors due to short-term and small-scale variability prop-
   Evidently, detailed surveys of individual seep sites, such as         agate via different upscaling techniques and how these errors
the study by Silyakova et al. (2020), can provide reasonable             can be mitigated.
estimates of local inventories (< 15 % uncertainty) despite
high short-term temporal variability. However, it is important           4.2   Hydrostatic pressure
to note that the area investigated in Silyakova et al. (2020)
was densely mapped and homogeneous in the sense that it is
                                                                         Tidal changes in hydrostatic pressure can trigger CH4 release
an area where seepage is well documented (Silyakova et al.,
                                                                         by build-up of CH4 in sediment pore water at rising tide and
2020). Interpolation or averaging across larger regions where
                                                                         subsequent release when pore pressure decreases at falling
the amount of seepage is mostly unknown can result in con-
                                                                         tide, as observed at the Hikurangi Margin (Linke et al., 2009)
siderable errors due to false interpolation assumptions and
                                                                         and Clayoquot Slope (Römer et al., 2016). Our study sites
amplification of individual measurement errors, which can
                                                                         differ from these sites in depth (they are >600 m) and in
be large (expected errors up to ∼ 140 % for single measure-
                                                                         tidal amplitude (4 m at Clayoquot Slope compared to 1.5 off-
ments; see listed standard deviations in Fig. 4). These effects
                                                                         shore Prins Karls Forland). Linke et al. (2009) and Römer

Ocean Sci., 18, 233–254, 2022                                                                  https://doi.org/10.5194/os-18-233-2022
K. O. Dølven et al.: Autonomous methane seep site monitoring offshore western Svalbard 241
et al. (2016) also observed bubbles hydro-acoustically, while
we measure dissolved CH4 , which is strongly affected by the
(also tidally dependent) current direction (Fig. 3).
To evaluate the effect that hydrostatic pressure changes
have on the in situ concentration, we need to constrain the
variance caused by changing current directions (since they
operate in the same frequency domain). To do this, we first
binned the CH4 concentration data into overlapping bins de-
fined by the current direction at the time when the measure-
ment was obtained and calculated standard scores (the num-
ber of standard deviations each value deviates from the sam-
ple mean; see, e.g., Kreyszig, 1979) for the data in each bin.
We used larger current direction intervals for O246 due to
the shorter data set, with a 12◦ window for O91 and a 30◦
window for O246 . This resulted in a data set (i.e., the stan-
dard scores from all bins) effectively unrelated to the cur-
rent direction. We then binned all the standard-scored CH4
data according to when the data were collected in relation to
Figure 5. Median and averaged standard scores of CH4 binned ac-
the M2 governed tidal cycle peak using overlapping 30 min cording to bottom water current direction and according to where
bins (the M2 tide explains 79.2 % and 80.3 % of the pressure the data were sampled in relation to the phase of the M2 pressure
variance at O91 and O246 , respectively). Average and median tide.
values were calculated for each bin, giving the averaged or
median normalized dissolved CH4 value (standard score) for
each current velocity defined data bin as a function of the M2 (390 m) and site O246 can suggest that these areas are fed by
tidal cycle (Fig. 5). This partial decoupling of variability in the same hydrocarbon source and that hydrates seasonally
hydrostatic pressure and current direction was possible since block the lateral pathways between these seep sites (Veloso-
the bottom water current and hydrostatic pressure changes Alarcón et al., 2019). This is in agreement with the ob-
had different dominant tidal constituents; i.e., the current was served long-term (∼ 3 months) negative correlation between
mainly dominated by the diurnal K1 constituent (∼ 23.91 h bottom water temperature and dissolved CH4 at site O246
period), while the M2 tide is semi-diurnal (12.42 h period). (R = −0.31). It should be noted that the same relationship
A strong effect of the hydrostatic pressure on local seep- is observed at O91 ; however, no geophysical data are avail-
age should elevate the standard scores at decreasing pressure able from this area due to the shallow depth.
(from 0 to 6.2 h, i.e., in the right half of Fig. 5), which we Tidal pressure variations can affect CH4 release via pore
observe at both observatories. However, we observe stronger water solubility (Sect. 4.2), but on longer timescales CH4
peaks at increasing hydrostatic pressure (−3 h) at site O91 solubility is almost exclusively a function of water temper-
and at the M2 peak (0 h) at site O246 , which contradicts this ature. Higher CH4 solubility implies more CH4 dissolved in
hypothesis. This does not mean that there is no effect of hy- pore water and within bubble streams, potentially increas-
drostatic pressure changes but rather that the seepage in the ing the amount of CH4 dissolved in bottom water. A small
area is widespread at both falling and rising tide conditions. but significant (R = 0.33) positive correlation between CH4
The high variability caused by the strong effect of current di- solubility and concentration at site O246 and site O91 (con-
rection also makes it particularly challenging to detect mod- sidering the same time period, i.e., until 3 October in 2015)
erate changes in seepage intensity. could indicate such an effect. This is also an alternative ex-
planation for the negative correlation between temperature
4.3 Bottom water temperature and CH4 concentration at site O246 .
Bottom water temperature can affect CH4 release by alter- 4.4 Pore water seepage
ing hydrate stability and CH4 solubility in pore water and the
water column (Sloan, 1998; Jansson et al., 2019a). Seasonal Short-term temperature increase further offshore (390 m
CH4 release variability resulting from temperature variations depth) has been linked with release of warm, CH4 -rich flu-
in the bottom water has been linked to migration of the gas ids from the sediments triggered by short-duration seis-
hydrate stability zone (GHSZ) and hydrate dissociation fur- mic events (Franek et al., 2017). This means that increased
ther offshore at ∼ 390 m water depth (Berndt et al., 2014; CH4 concentration should be accompanied by increased wa-
Ferré et al., 2020). Our observatories were deployed in areas ter temperature and reduced salinity due to admixture of
too shallow for gas hydrate to form. However, inversely vary- warmer, less saline pore water. We compared short-term
ing seepage intensity between seepage at the GHSZ depth anomalies (i.e., deviations from daily means) in these three
https://doi.org/10.5194/os-18-233-2022 Ocean Sci., 18, 233–254, 2022242 K. O. Dølven et al.: Autonomous methane seep site monitoring offshore western Svalbard
variables in the 24 h data sets at both seep sites but found no tion time series had generally lower MAD and median con-
corroborating evidence for this hypothesis. Instead, the co- centration. In this period, CH4 variability and median also
variance between current velocity and temperature and salin- showed a good statistical relationship with the 5 d accumu-
ity anomalies indicates that short-term variability is mainly lated wind stress (R = −0.82 for MAD and R = −0.61 for
caused by cross-shelf exchange of Atlantic water in the West median concentration), indicating that wind forcing has a
Spitsbergen Current and the colder, fresher Arctic water in deep impact on mixing and redistribution of CH4 in the water
the Coastal Current due to eddies (Hattermann et al., 2016). column (which also fits well with a high RWC ). The two last
It also indicates that CH4 release comes mainly from bubble 24 h CH4 time series (10 April and 1 May) had low median
dissolution and not from pore water seepage. concentration, which could be explained by the absence of
stratification (Silyakova et al., 2020) and generation of mix-
4.5 Seasonal variation of CH4 distribution at site O91 ing from the observed increase in Sb .
Accumulated wind stress, Sb and RWC are only limited
Low release of CH4 to the atmosphere from the O91 seep indicators of water column dispersion and mixing. Nonethe-
area during summer despite high seabed influx has been ex- less, the relationship between these parameters and the MAD
plained by suppression of vertical mixing by strong stratifi- and medians of the 24 h period CH4 time series gives a good
cation (Myhre et al., 2016a) or absence of mechanical forc- indication of the seasonal cycle of distribution and vertical
ing such as wind stress (Silyakova et al., 2020). However, in transport of CH4 : strong stratification, less wind forcing and
fall and winter, the water column offshore Prins Karls For- eddy activity in summer limit mixing and prevent CH4 from
land is expected to have more horizontal and vertical mixing reaching the atmosphere. However, in fall and winter, re-
due to weaker stratification from cooling or sea ice formation duced stratification makes the water column more prone to
(Tverberg et al., 2014), baroclinic instability in the frontal mixing, and distribution of CH4 seems to be strongly linked
structures of the West Spitsbergen Current (von Appen et al., with wind forcing from September to April.
2016; Hattermann et al., 2016), and more frequent storms
(Nilsen et al., 2016).
We expect lower CH4 variability and lower CH4 concen- 5 Conclusions
tration during periods of high mixing and dispersion due to
Time series of dissolved CH4 at both lander locations
weaker horizontal and vertical gradients and more efficient
show considerably higher CH4 concentrations (up to
dispersion of CH4 away from sources. We use three sets of
1748 ± 142 nmol L−1 at O91 and 2727 ± 182 nmol L−1 at
parameters to evaluate long-term changes in the amount of
O246 ) than previously found in ship-based water sampling
mixing in the water column (see Appendix E): (i) the 4-week
surveys (maximum of 482 near O91 and of 564 near O246 ).
averaged bulk velocity shear (Sb ), (ii) the two-dimensional
The time series also uncover high CH4 variability (up to
correlation between wind stress and current velocity (RWC ),
∼ 1000 nmol L−1 ) within short timescales (< 24 h), high-
and (iii) the number of stormy days as defined by persis-
lighting the potential uncertainty of flux and inventory es-
tent winds > 11 ms−1 lasting longer than 6 h (Fig. 6). Calm
timates based on interpolation and extrapolation techniques
weather and low Sb and RWC until mid-September 2015 indi-
relying on, e.g., an assumption of linearity. We calculated the
cate a stable water column with limited mixing in the bottom
standard error of a mean estimate based on a hypothetical
waters. From mid-September, Sb increased and stayed high
discrete water sampling survey based on a range of samples
until mid-November, together with a gradual increase in RWC
by using the 24 h time series as the underlying distribution.
that can be attributed to a gradual breakdown of stratification
The results aligned well with previous discrete water sam-
and increasing number of storm events (Fig. 6a). RWC re-
pling surveys in the area, giving a standard error of the mean
mained high (RWC > 0.5 at 60 m depth) until March 2016,
of 5 %–15 % for ∼ 60 samples.
indicating a significant effect of wind forcing in the water
Variability can be linked to directional ocean current vari-
column. From March until observatory retrieval, RWC de-
ations occurring at tidal timescales, which shows the impor-
creased to < 0.2 below 50 m depth while Sb increased be-
tance of taking the current direction and seep locations into
low 60 m depth, indicating available energy for mixing in the
account when interpreting intense seep site observations. The
bottom waters.
persistent relationship between current direction and loca-
We quantified CH4 variability during the 24 h measure-
tion of seeps during recovery shows that there was seepage
ments using the median absolute deviation (MAD) and
throughout the year and that the seep configuration was rela-
used the median as a measure of the amount of dissolved
tively constant.
CH4 . The three 24 h periods collected during the calmer
period prior to mid-September had high median concen-
tration (> 300 nmol L−1 ) and the overall highest variability
(MAD > 160 nmol L−1 ), as expected for low mixing condi-
tions (Fig. 6b and c). From mid-September until the end of
March (i.e., fall and winter seasons), the 24 h CH4 concentra-
Ocean Sci., 18, 233–254, 2022 https://doi.org/10.5194/os-18-233-2022K. O. Dølven et al.: Autonomous methane seep site monitoring offshore western Svalbard 243 Figure 6. (a) Bulk velocity shear (1H = 8 m) and two-dimensional correlation with wind stress (contours). Relationships between 5 d accumulated wind stress and median (b) and median absolute deviation (c) of CH4 concentration for 24 h data periods. Persistent wind events with speeds of more than 10 m s−1 in periods over 6 h are indicated with blue stars along the x axis of panel (a). Blue highlights fall and winter water column conditions as described in the text. We did not observe a direct effect of tidal pressure vari- ity. These constraints can either be direct knowledge about ations on CH4 release, but this could be hidden by the variability itself or how inventory and fluxes are affected by strong effect of variations in current direction. A negative related physical and/or chemical parameters. We observed (long-term) correlation between temperature and dissolved considerable temporal and spatial variability at the two seep CH4 at O246 is in agreement with the hypothesized seasonal sites that need to be taken into account to obtain meaningful blocking of lateral CH4 pathways in the sediments (Veloso- estimates of CH4 fluxes or inventories. That no strong direct Alarcón et al., 2019) but could also be explained by increased link was found with other oceanographic parameters illus- CH4 solubility in the water column. trates the nonlinearity of the system, making careful interpre- Short-term, small-scale variations in temperature and tation of measurements important. Future studies should aim salinity were not linked with increased amounts of dissolved to identify the errors that arise via different upscaling and in- CH4 , but rather with cross-frontal exchange of water masses terpolation techniques and how these errors can be mitigated. due to eddies. Based on our observations, we suggest that uncertainties in We observed a seasonal cycle in the characteristics of the CH4 inventory and seep estimates can be mitigated by tak- 24 h time series that fits with seasonal changes in dispersion ing the local seep configuration, ocean currents and mixing and mixing characteristics of the water column. Higher CH4 rates into account and employing autonomous instrumenta- concentration and variability in early fall, when stratification tion capable of resolving the steep horizontal gradients in dis- was strong, was followed by lower median concentrations solved CH4 . This, alongside direct measurements of seepage and variability in late fall and winter when the water col- by, e.g., acoustic instrumentation, can help constrain future umn was more affected by mixing. In late fall and winter, estimates of CH4 flux to the atmosphere from seabed seep- wind forcing was statistically coupled to the concentration age. and variability of CH4 , probably due to weaker water col- umn stratification. When estimating the atmospheric impact of a particular CH4 source based on sparse measurements, it is crucial to have some constraints on the temporal and spatial variabil- https://doi.org/10.5194/os-18-233-2022 Ocean Sci., 18, 233–254, 2022
244                               K. O. Dølven et al.: Autonomous methane seep site monitoring offshore western Svalbard

Appendix A: The K-Lander

Figure A1. (a) The K-Lander is a 1.6 m high and 3.6 m wide trawl-proof stainless steel frame with multiple instrument mounts and batteries.
The side panels are perforated to allow unobstructed water flow to the instruments inside the structure. See Appendix B for details on
instrumentation. (b) One of the K-Landers during deployment with a launcher mounted on top and camera system mounted on a boom for
visual control of landing area. (c) The two K-landers before deployment.

Ocean Sci., 18, 233–254, 2022                                                                 https://doi.org/10.5194/os-18-233-2022
K. O. Dølven et al.: Autonomous methane seep site monitoring offshore western Svalbard                                        245

Appendix B: Measurement intervals, general                         calibration not necessary) and are unaffected by dissolved
post-processing and data                                           oxygen content (unless via complete depletion). Biofouling
                                                                   was also minimal at retrieval (due to the cold water and lo-
The CTD (oxygen sensor) and ADCP conducted measure-                cal setting), and the PDMS membranes are almost unaffected
ments every 4 and 9 min, respectively, during the continu-         by cold water. Generally, we did no observations indicating
ous monitoring of CH4 and CO2 measurements and every 21            issues with any of the sensors except for what has already
and 29 min, respectively, during the rest of the deployment        been mentioned regarding the conductivity probe and electri-
period (see Table B1 for acronyms, description and measure-        cal malfunction of O246 . Furthermore, we discarded all data
ment accuracy). Salinity was measured on the practical salin-      recorded during instrument warm-up (i.e., when internal tem-
ity scale.                                                         perature was below correct operating temperature) before the
   The upward-mounted ADCP measured ocean currents in              individual measurement periods (the instruments were turned
1 m bins with a bottom 7 m blank distance, where the topmost       on ∼ 35 min prior to recording the data used in the analysis).
20 % of the water column was disregarded due to side lobe             In the Contros HydroC CH4 and CO2 sensors, dissolved
interference. The high resolution, relatively short ensemble       gases diffuse through a hydrophobic membrane into a gas
time (1 min) and potential presence of CH4 bubbles in the          chamber and equilibrate with the ambient environment. This
water resulted in noisy data. We dampened the noise by first       results in the slow response time (e.g., τ63 ∼50 min under
removing any data points with error velocities exceeding one       certain conditions for our membrane and pump setup for the
short-term (1 week) standard deviation, smoothed the data          CH4 sensor) and poor representation of the rapid changes
using a second-order Butterworth low-pass filter with a 3 h        in CH4 we expected in our study area (Gentz et al., 2014;
cutoff period and a spatial (i.e., vertical) moving average fil-   Myhre et al., 2016a). We therefore performed a response time
ter with a 5 m Hann window (increasing the blank distance          correction for the dissolved CH4 data following the method-
to 10 m). The accuracy of the ADCP data is therefore not           ology presented in Dølven et al. (2021), modulating the re-
explicitly constrained and is based on comparing current ve-       sponse time using the temperature data (effects of salinity
locity frequency spectra before and after filtering, combined      on membrane permeability were not taken into account since
with averaged error velocity of the raw data (Table B1).           these are negligible for the local ranges; see Robb, 1968).
   Since sensors were recording at different frequencies,          The CO2 sensors had a faulty pump, which ambiguously in-
chronological alignment of the data was carried out by iden-       creased the response time of the sensors, making response
tifying nearest neighbor data points or by resampling. For         time correction impossible.
correlation coefficients, histograms and Fourier analysis, the        The response time correction was performed for each pe-
data sets were resampled to a uniform 15 min or 1 h mea-           riod individually (1 and 24 h, i.e., 377 periods), using the
suring interval depending on the sample frequency of the           stated measurement accuracy of the instrument (2 µatm or
raw data, using a poly-phase anti-aliasing filter. Due to the      3 % of measured value, whichever is higher) as input uncer-
power-cycling mode of the CH4 and CO2 sensors and dif-             tainty. We first identified the ideal 1t according to the max-
fering sampling frequencies, some statistics were based on         imum curvature point in the L curves of the 24 h measure-
more data points than others (outlined in Table B1). Daily         ment periods. These varied slightly between each measure-
measurements of CH4 were excluded from these statistics            ment period but averaged close to 180 s (176.4 s). To keep
due to the high probability of systematic errors induced by        the same measuring interval for all the CH4 data, we there-
periodic diurnal effects.                                          fore corrected all the data with a specified 1t of 180 s, which
   Harmonic analysis of hydrostatic pressure and ocean cur-        falls well within the bend of the L curve and should there-
rents was done using t_tide (see Pawlowicz et al., 2002) and       fore safeguard a good balance between noise and model error
the fast Fourier transform.                                        (Fig. B1a). Inspection of model fit residuals showed a slight
   We calculated the rate of change (ROC) in CH4 concen-           modulation following the variance in the signal, which is ex-
tration using the response-time-corrected CH4 data and the         plained by our choice to use the same 3 min measurement
absolute value of the three-point (9 min) finite differences to    grid across a relatively wide variance range, but the resid-
limit the effect of noise on the calculation.                      uals were otherwise Gaussian. Although this is expected, it
   The absolute concentration of CH4 in the water                  indicates that errors might be slightly overestimated for low-
(nmol L−1 ) was estimated from the partial pressure of CH4 ,       variance sections of the time series and vice versa for high-
pressure, temperature and salinity using Henry’s law and           variance sections.
Henry constants obtained from Harvey (1996) and the prac-             The uncertainty estimate varies depending on the amount
tical molar volume and gamma term from Duan and Mao                of CH4 measured by the TDLAS unit in the measurement
(2006).                                                            chamber of the instrument. The distribution of the uncer-
   The CH4 sensors were calibrated to relevant water tem-          tainty estimates is shown as percentages in Fig. B1b. Es-
peratures prior to deployment. The TDLAS detectors (Con-           timated uncertainty ranged from 3 to 205 nmol L−1 (95 %
tros GmbH, 2018) provide measurements with good selectiv-          confidence, high for high concentrations in the measurement
ity (fit for purpose) and high long-term stability (intermittent   chamber and vice versa) or usually between 5 % and 20 %, al-

https://doi.org/10.5194/os-18-233-2022                                                           Ocean Sci., 18, 233–254, 2022
246 K. O. Dølven et al.: Autonomous methane seep site monitoring offshore western Svalbard
though there were some outliers when the concentration was
low and uncertainty estimate was high (Fig. B1b).
Table B1. Instruments mounted on O91 and O246 (see Fig. A1), measured parameters, height in meters above seafloor (masf), and stated
accuracy. ADCP stands for acoustic Doppler current profiler. N shows the number of data points used for later multi-variable analysis of O91
and O246 .
Instrument Parameter(s) masf N Accuracy
Teledyne RDI ADCP WHLM75-3000 Current velocity profile 1.6 17 438/4731 ∼ 3 cm s−1
Contros HydroC CH4 pCH4 (instrument output)∗ 1.2 1491/281 ∼ 5 %–20 % (RTC)∗∗∗
xCH4 (reported)∗∗
Contros HydroC CO2 pCO2 1.2 1491/281 n/a (no pump)
Seabird SBE16 plus V2 Conductivity–Temperature–Depth 1.2 29 660/9065 0.0005 Sm−1 /0.005 ◦ C,
/0.02 % of range
Seabird SBE63 oxygen optode Dissolved oxygen 1.2 29 660/9065 3 µmol kg−1 or ± 2 %
∗ The Contros HydroC CH outputs partial pressure from the internal gas chamber. ∗∗ We report absolute concentration in seawater (nmol L−1 ) using Henry’s law.
4
∗∗∗ We report accuracy only for response-time-corrected (RTC) concentrations (see Fig. B1) since the accuracy for untreated CH concentration data is ambiguous due
4
to the slow response time. n/a: not applicable.
Figure B1. (a) L curve for response time correction of CH4 data showing the location of the chosen 1t (180 s) for 6 May at O91. (b) Esti-
mated relative (%) uncertainty for response-time-corrected CH4 data (both observatories).
Ocean Sci., 18, 233–254, 2022 https://doi.org/10.5194/os-18-233-2022You can also read