Deep Sub-Wavelength Focusing Metalens at Terahertz Frequency
←
→
Page content transcription
If your browser does not render page correctly, please read the page content below
hv
             photonics

Communication
Deep Sub–Wavelength Focusing Metalens at Terahertz Frequency
Mengyu Yang             , Xin Shen and Zhongquan Wen *

                                         Key Lab of Optoelectronic Technology and Systems, Ministry of Education, Chongqing University,
                                         Chongqing 400044, China
                                         * Correspondence: wenzq@cqu.edu.cn

                                         Abstract: With the benefits of non–invasive and low radiation, terahertz radiation has shown great
                                         potential in biomedical imaging applications. However, the low spatial resolution of the imaging
                                         system significantly affects its application in these fields. Although immersion techniques and super–
                                         oscillation theory have achieved considerable success in improving the resolution of imaging systems,
                                         there are still problems with large focal spot sizes or large sidebands. Herein, a solid immersion lens
                                         based on super–oscillation is proposed to reduce the focal spot size when illuminated with circularly
                                         polarized light at a wavelength of 118.8 µm. The simulation results show that the lens can compress
                                         the full widths at half–maxima down to deep sub–wavelength scales, as small as 0.232 λ. At the same
                                         time, the maximum side–lobe ratio was 16.8%, which ensured that the device had a large field of
                                         view. The proposed method reveals new ideas in the field of super–resolution imaging.

                                         Keywords: solid immersion lens; optical super–oscillation; deep sub–wavelength focusing

                                         1. Introduction
                                              Owing to its high penetrability, low radiation and fingerprint characteristics, the
                                         application of terahertz (THz) (0.1 to 10 THz) imaging is paving the way for a new era
                                         in a wide range of fields [1], such as medical imaging and biological diagnosis [2–4].
                                         These fields, specifically the differentiation and localization of health issues and malignant
                                         tumors of various diseases, have made great progress in the past decades [5,6]. The high
                                         penetration and low radiation of THz enable it to penetrate the epidermis of an animal to a
                                         depth of hundreds of microns without damaging the epidermis, so that the surface tissue
                                         can be imaged. However, THz imaging systems are often restricted in biological imaging
Citation: Yang, M.; Shen, X.; Wen, Z.
                                         because of their low resolution. Additionally, in order to obtain clearer medical images,
Deep Sub–Wavelength Focusing
                                         deep sub–wavelength resolution is required.
Metalens at Terahertz Frequency.
Photonics 2023, 10, 222. https://
                                              Immersion techniques are commonly used to increase the spatial resolution of imaging
doi.org/10.3390/photonics10020222
                                         systems by introducing a layer of liquid or solid material between the objective lens and
                                         the sample. Different from common liquid immersion microscopes, solid immersion micro-
Received: 12 January 2023                scopes choose solid immersion lenses made of higher refractive index materials instead of
Revised: 11 February 2023
                                         liquids to further improve the resolution of the microscope system. The traditional solid im-
Accepted: 16 February 2023
                                         mersion technique uses a plano–convex lens as the objective lens, which has problems such
Published: 19 February 2023
                                         as difficult processing, large volume, and difficulty in cascading [7,8]. With the advantages
                                         of easy processing, small volume, light weight, and easy integration, metasurface lenses
                                         have provided potential solutions to these problems [9–12]. The metasurface has unique
Copyright: © 2023 by the authors.
                                         advantages in phase, amplitude and polarization regulation [13–17]. Among them, studies
Licensee MDPI, Basel, Switzerland.
                                         on polynomial [18] and hyperboloid phase distributions [19] are also used in immersion
This article is an open access article   techniques, respectively, and the minimum FWHM of the focal spot is 0.4 λ. However,
distributed under the terms and          their FWHM needs to be further compressed to obtain a clearer image of biological tissue.
conditions of the Creative Commons       The super–oscillation, which can form arbitrarily small optical features, presents a new
Attribution (CC BY) license (https://    solution to this problem [20–24]. By combining it with the immersion technique, deep
creativecommons.org/licenses/by/         focusing in the subwavelength range should be achieved. Using this method, a focal spot
4.0/).                                   with a FWHM of 0.289 λ in the focal plane was achieved [25]. However, the central peak

Photonics 2023, 10, 222. https://doi.org/10.3390/photonics10020222                                       https://www.mdpi.com/journal/photonics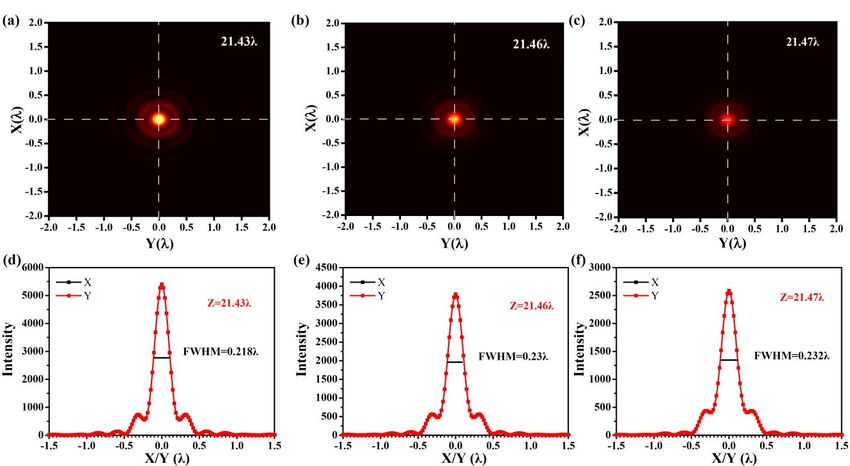
Photonics 2023, 10, x FOR PEER REVIEW 2 of 8
features, presents a new solution to this problem [20–24]. By combining it with the immer-
Photonics 2023, 10, 222 2 of 8
sion technique, deep focusing in the subwavelength range should be achieved. Using this
method, a focal spot with a FWHM of 0.289 λ in the focal plane was achieved [25]. How-
ever, the central peak of the focal spot is surrounded by a large side lobe, resulting in a
of theof
field focal
view spot is surrounded
of ~0.6 by a large
λ. Conventionally, theside lobe, resulting
immersion in a field
lenses have of view
suffered from ofeither
~0.6 λ.a
Conventionally,
large focal spot or a large side lobe, which severely limits the focusing performance.large
the immersion lenses have suffered from either a large focal spot or a
side lobe,
In thewhich severely
present work,limits the focusing
the phase modulationperformance.
structure is optimized to focus light from
In the present work, the phase modulation structure is immersion
air into a dielectric material to create a super–oscillation optimized to focus
lens. light
The from
incident
air into a dielectric material to create a super–oscillation immersion
plane wave is modulated by the phase–modulation structure and propagates through thelens. The incident
plane wavesilicon,
dielectric is modulated byinthe
resulting phase–modulation
deep sub–wavelengthstructure
focusingand
withpropagates throughratio
a small side–lobe the
dielectric silicon,
(SLR) in air. resulting
To verify thisinproposal,
deep sub–wavelength focusing with a smallmetalens
a deep sub–wavelength–focusing side–lobewith
ratioa
(SLR) in air. To verify this proposal, a deep sub–wavelength–focusing metalens with a
radius of 50 λ and a focal length of 21.43 λ was designed at a wavelength of λ = 118.8 μm.
radius of 50 λ and a focal length of 21.43 λ was designed at a wavelength of λ = 118.8 µm.
Numerical results showed that the FWHM of the focal spot is less than 0.25 λ and the
Numerical results showed that the FWHM of the focal spot is less than 0.25 λ and the
maximum side–lobe ratio within 0.04 λ of the exit surface is 16.8%.
maximum side–lobe ratio within 0.04 λ of the exit surface is 16.8%.
2. Design
2. Design andand Theoretical
Theoretical Analysis
Analysis
Thesolid
The solid immersion
immersion lens lens optimized
optimized basedbased on on aa super–oscillation
super–oscillation for for circularly
circularly polar-
polar-
ized light is illustrated in Figure 1. Since the proposed metalens is
ized light is illustrated in Figure 1. Since the proposed metalens is planned to be applied in planned to be applied
in subsequent
subsequent studiesstudies
and and the FIRL100
the FIRL100 laser (Edinburgh
laser (Edinburgh Instruments
Instruments Ltd., Edinburgh,
Ltd., Edinburgh, UK) is
UK) is available in the laboratory, its corresponding wavelength
available in the laboratory, its corresponding wavelength of 118.8 µm is chosen. of 118.8 μm is chosen.
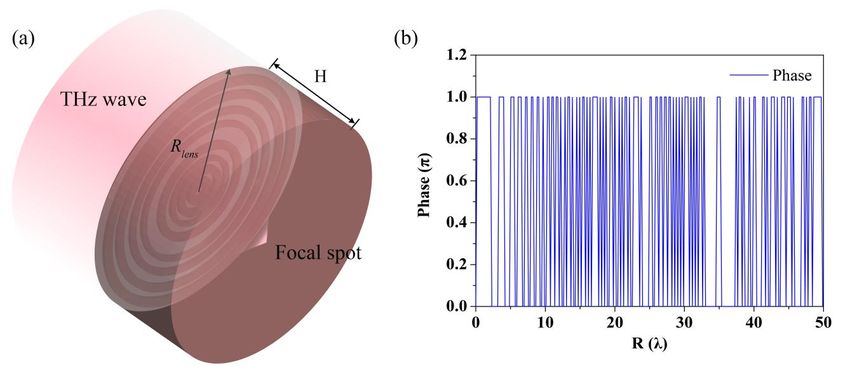
Figure 1a
Figure the
shows 1a shows
schematic the schematic
diagram of diagram of the principle
the principle of operation of operation
of the solid of the solid immer-
immersion lens.
sionbeam
The lens. is
The beam in
focused is focused in acolumn
a dielectric dielectric column
after passing after passing
through through a super–oscil-
a super–oscillating phase
latingand
mask phase maskinto
emitted andthe emitted intowavelength
air. The the air. Theofwavelength
the plane wave of theinplane wave in column
the dielectric the die-
lectric column
theoretically theoretically
equal to 1/n timesequal to 1/n
that times
in air, as isthat
theinvolume
air, as is
ofthe
thevolume
evanescentof thefield
evanescent
behind
it [26]. Therefore, at a small distance from the flat surface of the truncated silicontruncated
field behind it [26]. Therefore, at a small distance from the flat surface of the column,
silicon
we column,
can obtain we can terahertz
a smaller obtain a smaller
beam. Rterahertz beam. Rlens represents the radius of the
lens represents the radius of the solid immersion
solidand
lens immersion
H is the lens and Hofisthe
thickness the dielectric
thickness column.
of the dielectric column. High–resistance
High–resistance silicon was chosen sili-
con
as was
the chosenofasthe
material thesolid
material of the solid
immersion immersion
lens because lens
of its because
high of its index
refractive high refractive
and low
index and low
absorption in the absorption
THz band. in the THz band.
Figure 1. (a) Schematic diagram of solid immersion lens with beam focused in air. (b) Binary phase
Figure 1. (a) Schematic diagram of solid immersion lens with beam focused in air. (b) Binary phase
distribution of the solid immersion lens.
distribution of the solid immersion lens.
According to the vectorial angular spectrum theory, the component of the electric field
at any point of the plane z in the silicon column can be calculated as follows:
s∞
Ex ( x, y, z) = s0 A x f x , f y exp j2π x f x + y f y + z f z d f x d f y
∞
Ey ( x, y, z) = 0 Ay f x , f y exp j2π x f x + y f y + z fz d fx d fy
s∞ A x ( f x , f y ) f x + Ay ( f x , f y ) f y (1)
Ez ( x, y, z) = 0 − fz Ax f x , f y
exp j2π x f x + y f y + z f z d fx d fy
Photonics 2023, 10, 222 3 of 8
where A x = FT ( E x ) and Ay = FT ( Ey ) represent the angular spectrum. f x and f y are
q 2
the spatial frequency of plane waves, f z = (nSi /λ)2 − ( f x )2 − f y , nSi is the refrac-
2
tive index of the propagating medium. If ( f x )2 + f y > (nSi /λ)2 , f z is imaginary. It
means that the amplitude of these components decays exponentially in the z direction. If
2
( f x )2 + f y < (nSi /λ)2 , then f z is real, thus representing the propagation factor of a plane
wave. All of the above analysis revealed that the vector angular spectrum can express
the transmission mode and evanescent mode, respectively. Obviously, the vector angular
spectrum diffraction theory can accurately calculate the intensity distribution of the light
field on the propagation plane after phase regulation.
Next, the focusing results of the solid immersion lens in a two–layer medium (Si–air)
are investigated. The numerical aperture of the metalens is as large as possible while
considering the lens performance, so the thickness of the silicon column is set to 21.43 λ. To
conveniently describe the transverse electric field through the Si–air interface, we transform
the transverse electric field along the axial direction of the Cartesian coordinate system into
the corresponding components in the cylindrical coordinate system. The corresponding
component of the angular spectrum is expressed as follows:
Ap A x cosϕ + Ay sinϕ cosθ1 − Azsinθ1
As = − A x sinϕ + Ay cosϕ (2)
Aξ A x cosϕ + Ay sinϕ sinθ1 + Azcosθ1
where θ1 is the angle of the wave vector of the beam in Si. The coordinates are defined under
the condition eξ = 0, so that Aξ = 0. As the beam propagates from the silicon column
into the air, transmission and reflection of the beam may occur at the Si–air interface.
Some beams have total reflection due to the transmission of a silicon medium with a
high refractive index into the air. The Fresnel transmission coefficient ts tp and reflection
coefficient rs rp of the electric field at the interface can be calculated. Then, the electric field
in the air in Cartesian coordinate system can be obtained as:
R R∞
E1x = R R −∞ A p t p cosθ2 cosϕ − As ts sinϕ d f x d f y
∞
E = A p t p cosθ2 sinϕ + As ts cosϕ d f x d f y (3)
1y R R −∞∞
E1z = −∞ − A p t p sinθ 2 d f x d f y
The electric field reflected back into the silicon column can be written as:
R R∞
E2x = R R −∞ A p r p cosθ2 cosϕ − As rs sinϕ d f x d f y
∞
E = A p r p cosθ2 sinϕ + As rs cosϕ d f x d f y (4)
2y R R −∞∞
E2z = −∞ − A p r p sinθ2 d f x d f y
where θ2 is the angle of the wave vector of the beam in air. According to Equations (2)–(4),
the electric field distribution near the interface can be obtained. Based on E2x , E2y , and E2z ,
the electric field in the air after the light exiting from the silicon column can be calculated
through the vector angle spectrum.
Combined with the above formula and particle swarm optimization algorithm [27],
the intensity and FWHM of the focal spot were optimized. The light intensity distribution
at the design position was calculated by Equations (1)–(4), and it was compared with the
intensity distribution of the target light field to determine whether the optimal design
of the metalens needs to be completed. Then, the corresponding super–oscillation phase
distribution was obtained. Since super–oscillation is often accompanied by a large side–
lobe ratio, we also add the side–lobe ratio to the optimization goal. After evaluating the
focusing performance of the lens and the available high–resistance silicon–processing
technology, we set the period of the ring to 25 µm. By optimizing the phase distribution of
the lens, a deep sub–wavelength focusing lens with a small side–lobe ratio at λ = 118.8 µm
is designed. The optimized structure of the lens with a radius of 50 λ and a focal length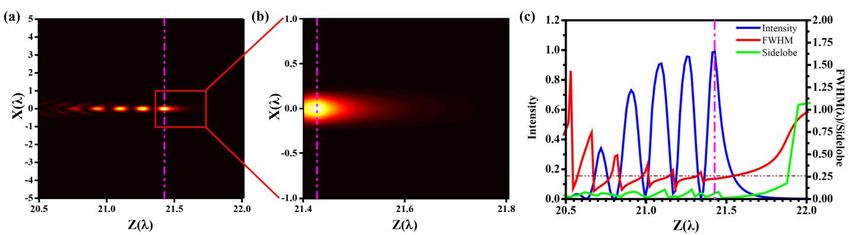
Photonics 2023, 10, 222 4 of 8
of 21.43 λ is shown in Figure 1a, which consists of a series of concentric silicon ring belts.
Due to the existence of adjacent rings with the same phase, these rings can be combined
so that the width of each ring band is an integer multiple of 25 µm. Combined with the
existing microstructure–processing process, the desired structure can be achieved by UV
lithography combined with dry etching. The etched rings are used to implement the
optimized binary phase modulation shown in Figure 1b, and the depths 0 and h of the rings
correspond to phase delays of π and 0. The h, which corresponds to the phase difference π,
is calculated according to the following formula: h =∆ϕ × λ/[2π (n Si −1)], where ∆ϕ is
the phase difference π. The refractive index of silicon nSi at a wavelength of 118.8 µm is
3.418, and h is calculated as 24.56 µm.
Figure 2a illustrates the electric field intensity distribution of the focused beam formed
by the solid immersion lens near the Si–air interface (rose dotted line), as calculated by
Formulas (1)–(4). There are multiple spots inside the silicon column due to the coherent
superposition of the incident beam and the reflection of the beam at the Si–air interface.
By magnifying the light intensity distribution at the interface, as shown in Figure 2b, it
is obvious that the beam exhibits the phenomenon of intensity attenuation. To further
investigate the focusing performance of this lens, the normalized electric field intensity
profile, FWHM, and the maximum side–lobe ratio corresponding to the propagation direc-
tion are plotted, as shown in Figure 2c. It can be clearly seen that the beam has significant
attenuation as the distance from the interface of the truncated silicon column increases.
Considering its application in subsequent research, its working distance is chosen to be
half of its maximum intensity, i.e., 0.04 λ. The FWHM and side–lobe ratio of the beam
Photonics 2023, 10, x FOR PEER REVIEW
are
5 of 8
stable in this range and their values are less than 0.25 λ and 16.8%, respectively. Beyond
this range, the FWHM of the THz beam increases significantly.
Figure
Figure 2.2. The
The design
designresults:
results:characterization
characterizationofofsolid
solidimmersion
immersionlens. (a)(a)
lens. Intensity distribution
Intensity distributionof
the light
of the beam
light along
beam the the
along propagation direction.
propagation (b) Intensity
direction. distribution
(b) Intensity near the
distribution silicon–air
near inter-
the silicon–air
face. (c) Intensity (blue line), FWHM (red line) and side lobe (green line) electric field curves in the
interface. (c) Intensity (blue line), FWHM (red line) and side lobe (green line) electric field curves in
propagation direction.
the propagation direction.
3. Simulation Results and Discussion
To evaluate the the performance
performanceofofthe thedesigned
designedlens, lens,we we simulated
simulated thethe
device
deviceusing fi-
using
nite–difference
finite–differencetime–domain
time–domainsoftware
software(FDTD(FDTDSolutions,
Solutions, Lumerical,
Lumerical, Inc., Vancouver,
Inc., Vancouver,Can-BC,
ada.). Terahertz
Canada.). Terahertzwaves
waves come in from
come in fromthethestructure
structure ofofthe therings
ringsand
andoutoutfrom
from the
the silicon
column surface.
surface. The
The results
results ofof focusing
focusing on on the
the XZ plane
plane of the solid immersion lens are
shown in in Figure
Figure 3a.
3a. ItItcan
canbebeseen
seenthat
thatthethedistribution
distribution trendtrend of of
thethe
focal
focalspot
spotis close to
is close
the design
to the designresult. For For
result. comparison,
comparison, the the
electric fieldfield
electric intensity
intensitydistribution curves
distribution of the
curves of
design
the design(red(red
line)line)
andandsimulation
simulation(black line)line)
(black are are
given in Figure
given in Figure3b. 3b.
Although
Although there are
there
are some
some minor minor differences
differences inelectric
in the the electric
fieldfield intensity
intensity inside inside the dielectric
the dielectric column,
column, the
the elec-
electric
tric fieldfield intensity
intensity distribution
distribution in in
airair obtained
obtained fromthe
from thesimulation
simulationisisconsistent
consistent with
with the
design results, which implies the validity of our design method. To To further illustrate this
phenomenon, the the intensity
intensitydistributions
distributionsrelated
relatedtotothethefocal
focalplaneplane(XY(XYplane)
plane)areare
shown
shown in
Figure 4. Figure 4a–c depict the intensity distribution of the focal
in Figure 4. Figure 4a–c depict the intensity distribution of the focal spot in the XY planespot in the XY plane at
at z = 21.43 λ, z = 21.46 λ, and z = 21.47 λ, respectively. Symmetric circular spots are gen-
erated in the figures. The intensity of the spots decreases significantly with the increase in
the light propagation. In Figure 4d–f, the corresponding intensity curves are shown in the
x–direction (black) and y–direction (red) through the centers of the hot spots. The FWHM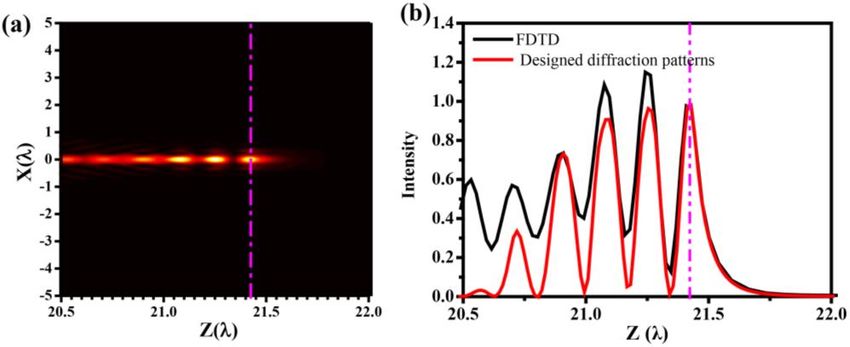
shown in Figure 3a. It can be seen that the distribution trend of the focal spot is close to
the design result. For comparison, the electric field intensity distribution curves of the
design (red line) and simulation (black line) are given in Figure 3b. Although there are
some minor differences in the electric field intensity inside the dielectric column, the elec-
tric field intensity distribution in air obtained from the simulation is consistent with the
Photonics 2023, 10, 222 design results, which implies the validity of our design method. To further illustrate5this of 8
phenomenon, the intensity distributions related to the focal plane (XY plane) are shown
in Figure 4. Figure 4a–c depict the intensity distribution of the focal spot in the XY plane
zat=z21.43
= 21.43λ, zλ,=z21.46
= 21.46 λ, and
λ, and z = z21.47
= 21.47 λ, respectively.
λ, respectively. Symmetric
Symmetric circularcircular
spotsspots are gen-
are generated
in the figures.
erated The intensity
in the figures. of theof
The intensity spots decreases
the spots significantly
decreases withwith
significantly the increase in the
the increase in
light propagation.
the light propagation. In Figure
In Figure4d–f, thethe
4d–f, corresponding
correspondingintensity
intensitycurves
curvesareareshown
shownin in the
the
x–direction
x–direction (black)
(black) and
and y–direction
y–direction (red)(red) through
through thethe centers
centers ofof the
the hot
hot spots.
spots. The FWHM
is 0.218 λ, 0.228 λ, and 0.232 λ, and the corresponding side–lobe
is 0.218 λ, 0.228 λ, and 0.232 λ, and the corresponding side–lobe ratio is 13.65%,ratio is 13.65%, 14.94%, and
14.94%,
16.85%, respectively. This means that the deep sub–wavelength focusing
and 16.85%, respectively. This means that the deep sub–wavelength focusing can be real- can be realized
with the small
ized with side side
the small lobe lobe
in air.
inAtair.the
At same time,
the same the the
time, electric intensity
electric of the
intensity focal
of the spot
focal in
spot
the XYXY
in the plane at zat=z21.47
plane λ attenuates
= 21.47 λ attenuates to half of the
to half intensity
of the at z at
intensity = 21.43 λ. Considering
z = 21.43 λ. Consideringthe
intensity of the
the intensity of focal spot,spot,
the focal its working
its working range is defined
range fromfrom
is defined 21.4321.43
λ to λ21.47 λ. λ.
to 21.47
Figure 3.
Figure
Photonics 2023, 10, x FOR PEER REVIEW
3. The
The characterization
characterizationofofthe
thepropagation
propagationofof the
the solid
solid immersion
immersion lens.
lens. (a)(a) Intensity
Intensity distribu-
distribution
6 of 8
tion
of of light
light beam beam along
along the the propagation
propagation direction.
direction. (b)(b) Numericalsimulation
Numerical simulation(red
(redline)
line) and
and FDTD
FDTD
simulation (blue line) of the intensity distribution curve of the electric field.
simulation (blue line) of the intensity distribution curve of the electric field.
Figure 4.
Figure 4. The
The intensity
intensityobtained
obtainedbybyFDTD
FDTDinin
thethe focal
focal plane
plane at zat= z21.43
= 21.43 λ (a),
λ (a), 21.4621.46
λ (b),λ and
(b), 21.47
and 21.47
λ (c),
λ (c), respectively. The intensity curves obtained by FDTD at z = 21.43 λ (d), 21.46 λ (e), and 21.47 λ
respectively. The intensity curves obtained by FDTD at z = 21.43 λ (d), 21.46 λ (e), and 21.47 λ (f) on
(f) on the x–axis and y–axis.
the x–axis and y–axis.
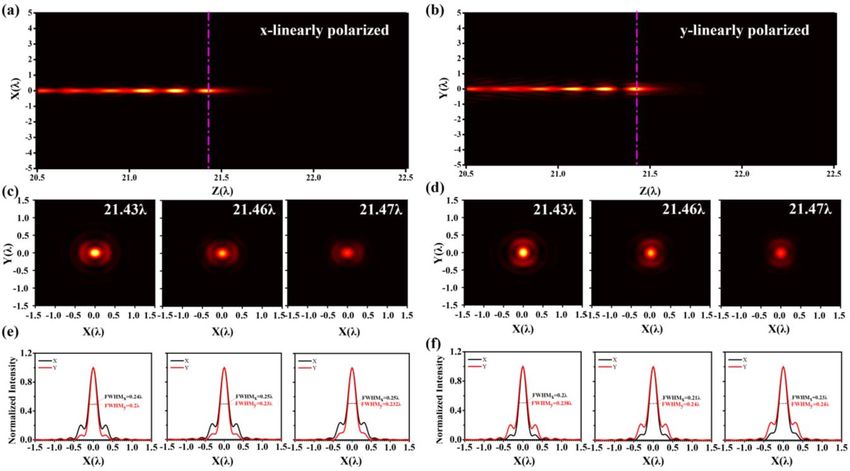
Since the
Since the linearly
linearly polarized
polarized wave
wave is
is the
the superposition
superposition of the left–
of the left– and
and right–circular
right–circular
polarized components
polarized componentsdescribed
describedabove,
above,thethe
as–designed solid
as–designed immersion
solid immersionlenslens
is also
is suit-
also
able for linearly polarized light. The focusing performance of the lens with x–polarized
suitable for linearly polarized light. The focusing performance of the lens with x–polarized
light and y–polarized light is shown in Figure 5. Figure 5a,b show the optical intensity
distribution along the propagation plane under x–polarized and y–polarized incidence,
respectively. They are consistent with the distribution trend of optical intensity under cir-
cularly polarized light. Figure 5c,d give the two–dimensional light intensity distribution
on the focal plane at positions z = 21.43 λ, 21.46 λ, and 21.47 λ in air. As can be seen fromPhotonics 2023, 10, 222 6 of 8
light and y–polarized light is shown in Figure 5. Figure 5a,b show the optical intensity
distribution along the propagation plane under x–polarized and y–polarized incidence,
respectively. They are consistent with the distribution trend of optical intensity under
circularly polarized light. Figure 5c,d give the two–dimensional light intensity distribution
on the focal plane at positions z = 21.43 λ, 21.46 λ, and 21.47 λ in air. As can be seen from
the figures, the focused spots have distinct side lobes in the direction that coincides with
the polarization. The corresponding intensity curves in x– and y– directions are presented
in Figure 5e,f, and the corresponding parameters are listed in Table 1. The FWHMs in
x–direction at z = 21.43 λ, 21.46 λ, and 21.47 λ are 0.24 λ, 0.25 λ, and 0.25 λ, respectively,
which are slightly larger than the FWHM at the circular incidence. Additionally, the values
in y–direction are 0.2 λ, 0.23 λ, and 0.232 λ, respectively, which are close to the FWHM
at circular polarization. The FWHM in the x–direction is slightly larger than that in the
y–direction, but it is still less than 0.25 λ. The side–lobe ratio of the x–axis is approximately
three times that of the y–axis, 20.57% and 6.70%, 22% and 7.87%, and 24.19% and 9.50%,
Photonics 2023, 10, x FOR PEER REVIEW 7 of 8
respectively. The same phenomenon occurs when the incident light is y–polarized, the
direction with the larger side lobe of the focal spot is changed to the y direction. This result
proves that we can use y–polarization or x–polarization in subsequent applications without
21.47 1293.78 0.25 λ 0.232
polarization λ 24.19which
conversion, 9.50
further 1293.9 0.23
simplifies the λ 0.24steps.
application λ 9.51 24.20
Figure 5.5. Intensity distribution
distribution of
of the light field in the XZ plane when illuminated by x–linearly
polarized plane
polarized plane wave
wave(a)(a)and
andy–linearly
y–linearlypolarized
polarizedplane
planewave
wave(b).
(b).(c,d)
(c) and (d) intensity
are the are the intensity dis-
distribution
tribution of the light field in the XY plane when illuminated with the x–linearly polarized
of the light field in the XY plane when illuminated with the x–linearly polarized plane wave and plane
wave and y–linearly polarized plane wave, respectively. (e,f) are the intensity distribution curves
y–linearly polarized plane wave, respectively. (e,f) are the intensity distribution curves in the x and y
in the x and y directions corresponding to (c,d).
directions corresponding to (c,d).
4. Conclusions
Table 1. Parameters of the focal spot on the focal plane at different z for x– and y–polarized light.
In summary, a solid immersion lens was designed based on super–oscillation at a
wavelength of 118.8Light
x Linearly Polarized μm. The lens consists of concentric rings
y Linearly on a Light
Polarized silicon column that
Z(λ) Intensity FWHMx focus circularly polarized light to a deep
FWHMy SLRx (%) SLRy (%) Intensity FWHMx sub–wavelength FWHMy SLRx side–lobe
with a small (%) SLRyratio.
(%)
21.43 2701.09 0.24 λ Numerical
0.2 λ simulations
20.57 showed
6.70 that the maximum
2701.38 FWHM
0.2 λ is about
0.238 λ 0.232
6.75 and the
λ, max-
20.14
21.46 1893.29 0.25 λ imum0.23side–lobe
λ ratio
22 is 16.85%.
7.87 When the lens is0.21
1893.5 irradiated
λ with
0.24 λ x– (or7.87
y–) polarization,
22
21.47 1293.78 0.25 λ the focal
0.232spot 24.19 in the9.50
λ widens 1293.9 0.23 0.24 9.51
corresponding direction, but its FWHMs are still only
λ λ 24.20
about
a quarter wavelength. The proposed solid immersion metalens can be used as an objective
lens of microscopy, which provides a pathway for microscopic THz imaging and shows
promise for applications in biomedicine.
Author Contributions: Conceptualization, M.Y.; methodology, M.Y.; software, M.Y.; validation,Photonics 2023, 10, 222 7 of 8
4. Conclusions
In summary, a solid immersion lens was designed based on super–oscillation at a
wavelength of 118.8 µm. The lens consists of concentric rings on a silicon column that focus
circularly polarized light to a deep sub–wavelength with a small side–lobe ratio. Numerical
simulations showed that the maximum FWHM is about 0.232 λ, and the maximum side–
lobe ratio is 16.85%. When the lens is irradiated with x– (or y–) polarization, the focal
spot widens in the corresponding direction, but its FWHMs are still only about a quarter
wavelength. The proposed solid immersion metalens can be used as an objective lens of
microscopy, which provides a pathway for microscopic THz imaging and shows promise
for applications in biomedicine.
Author Contributions: Conceptualization, M.Y.; methodology, M.Y.; software, M.Y.; validation, M.Y.
and X.S.; writing—original draft preparation, M.Y.; writing—review and editing, M.Y., Z.W. and
X.S.; supervision, Z.W. and X.S. All authors have read and agreed to the published version of the
manuscript.
Funding: This research was funded by the Natural Science Foundation of Chongqing, grant number
cstc2019jcyj-msxmX0315.
Institutional Review Board Statement: Not applicable.
Informed Consent Statement: Not applicable.
Data Availability Statement: Not applicable.
Conflicts of Interest: The authors declare no conflict of interest.
References
1. Ako, R.T.; Upadhyay, A.; Withayachumnankul, W.; Bhaskaran, M.; Sriram, S. Dielectrics for Terahertz Metasurfaces: Material
Selection and Fabrication Techniques. Adv. Opt. Mater. 2019, 8, 1900750. [CrossRef]
2. Woodward, R.M.; Cole, B.E.; Wallace, V.P.; Pye, R.J.; Arnone, D.D.; Linfield, E.H.; Pepper, M. Terahertz pulse imaging in reflection
geometry of human skin cancer and skin tissue. Phys. Med. Biol. 2002, 47, 3853–3863. [CrossRef]
3. Pickwell, E.; Wallace, V.P. Biomedical applications of terahertz technology. J. Phys. D Appl. Phys. 2006, 39, R301–R310. [CrossRef]
4. Yu, C.; Fan, S.; Sun, Y. Pickwell-Macpherson, E. The potential of terahertz imaging for cancer diagnosis: A review of investigations
to date. Quant. Imaging Med. Surg. 2012, 2, 33–45.
5. Nikitkina, A.I.; Bikmulina, P.Y.; Gafarova, E.R.; Kosheleva, N.V.; Efremov, Y.M.; Bezrukov, E.A.; Butnaru, D.V.; Dolganova,
I.N.; Chernomyrdin, N.V.; Cherkasova, O.P.; et al. Terahertz radiation and the skin: A review. J. Biomed. Opt. 2021, 26, 043005.
[CrossRef]
6. Peralta, X.G.; Lipscomb, D.; Wilmink, G.J.; Echchgadda, I. Terahertz spectroscopy of human skin tissue models with different
melanin content. Biomed. Opt. Express 2019, 10, 2942. [CrossRef]
7. Chernomyrdin, N.V.; Schadko, A.O.; Lebedev, S.P.; Tolstoguzov, V.L.; Kurlov, V.N.; Reshetov, I.V.; Spektor, I.E.; Skorobogatiy, M.;
Yurchenko, S.O.; Zaytsev, K.I. Solid immersion terahertz imaging with sub–wavelength resolution. Appl. Phys. Lett. 2017, 110,
221109.
8. Kurvits, J.A.; Jiang, M.; Zia, R. Comparative analysis of imaging configurations and objectives for Fourier microscopy. J. Opt. Soc.
Am. A 2015, 32, 2082–2092. [CrossRef]
9. Huo, P.; Zhang, S.; Liang, Y.; Lu, Y.; Xu, T. Hyperbolic Metamaterials and Metasurfaces: Fundamentals and Applications. Adv.
Opt. Mater. 2019, 7, 1801616. [CrossRef]
10. Jiang, X.; Chen, H.; Li, Z.; Yuan, H.; Cao, L.; Luo, Z.; Zhang, K.; Zhang, Z.; Wen, Z.; Zhu, L.; et al. All–dielectric metalens for
terahertz wave imaging. Opt. Express 2018, 26, 14132. [CrossRef] [PubMed]
11. Hong, X.; Feng, S.; Guo, H.; Li, C. A small–spot–size and polarization–insensitive flat lens employing dielectric metasurface in the
terahertz region. Opt. Commun. 2020, 459, 125083. [CrossRef]
12. Chen, H.; Wu, Z.; Li, Z.; Luo, Z.; Jiang, X.; Wen, Z.; Zhu, L.; Zhou, X.; Li, H.; Shang, Z.; et al. Sub–wavelength tight–focusing of
terahertz waves by polarization–independent high–numerical–aperture dielectric metalens. Opt. Express 2018, 26, 29817–29825.
[CrossRef] [PubMed]
13. Danila, O. Polyvinylidene Fluoride–Based Metasurface for High–Quality Active Switching and Spectrum Shaping in the Terahertz
G–Band. Polymers 2021, 13, 1860. [CrossRef]
14. Liang, Y.; Wei, Z.; Guo, J.; Wang, F.; Meng, H.; Liu, H. Metalenses Based on Symmetric Slab Waveguide and c–TiO2 : Efficient
Polarization–Insensitive Focusing at Visible Wavelengths. Nanomaterials 2018, 8, 699. [CrossRef]
15. Dănilă, O.; Mănăilă-Maximean, D.; Bărar, A.; Loiko, V.A. Non–Layered Gold–Silicon and All–Silicon Frequency–Selective
Metasurfaces for Potential Mid–Infrared Sensing Applications. Sensors 2021, 21, 5600. [CrossRef]Photonics 2023, 10, 222 8 of 8
16. Liu, Y.; Sun, J.; Shu, Y.; Wu, L.; Lu, L.; Qi, K.; Che, Y.; Li, L.; Yin, H. High numerical aperture and large focusing efficiency metalens
based on multilayer transmitarray elements. Opt. Laser. Eng. 2021, 147, 106734. [CrossRef]
17. Liang, Y.; Liu, H.; Wang, F.; Meng, H.; Guo, J.; Li, J.; Wei, Z. High–Efficiency, Near–Diffraction Limited, Dielectric Metasurface
Lenses Based on Crystalline Titanium Dioxide at Visible Wavelengths. Nanomaterials 2018, 8, 288. [CrossRef]
18. Chen, W.T.; Zhu, A.Y.; Khorasaninejad, M.; Shi, Z.; Sanjeev, V.; Capasso, F. Immersion Meta–Lenses at Visible Wavelengths for
Nanoscale Imaging. Nano Lett. 2017, 17, 3188–3194. [CrossRef]
19. Liang, H.; Lin, Q.; Xie, X.; Sun, Q.; Wang, Y.; Zhou, L.; Liu, L.; Yu, X.; Zhou, J.; Krauss, T.F.; et al. Ultrahigh Numerical Aperture
Metalens at Visible Wavelengths. Nano Lett. 2018, 18, 4460–4466. [CrossRef]
20. Yang, M.; Ruan, D.; Du, L.; Qin, C.; Li, Z.; Lin, C.; Chen, G.; Wen, Z. Subdiffraction focusing of total electric fields of terahertz
wave. Opt. Commun. 2020, 458, 124764. [CrossRef]
21. Ruan, D.; Li, Z.; Du, L.; Zhou, X.; Zhu, L.; Lin, C.; Yang, M.; Chen, G.; Yuan, W.; Liang, G.; et al. Realizing a terahertz far–field
sub–diffraction optical needle with sub–wavelength concentric ring structure array. Appl. Optics. 2018, 57, 7905–7909. [CrossRef]
22. Yuan, G.H.; Lin, Y.H.; Tsai, D.P.; Zheludev, N.I. Superoscillatory quartz lens with effective numerical aperture greater than one.
Appl. Phys. Lett. 2020, 117, 021106. [CrossRef]
23. Huang, K.; Liu, H.; Garcia-Vidal, F.J.; Hong, M.; Luk Yanchuk, B.; Teng, J.; Qiu, C. Ultrahigh–capacity non–periodic photon sieves
operating in visible light. Nat. Commun. 2015, 6, 7059. [CrossRef]
24. Rogers, E.T.F.; Lindberg, J.; Roy, T.; Savo, S.; Chad, J.E.; Dennis, M.R.; Zheludev, N.I. A super–oscillatory lens optical microscope
for subwavelength imaging. Nat. Mater. 2012, 11, 432–435. [CrossRef]
25. Li, M.; Li, W.; Li, H.; Zhu, Y.; Yu, Y. Controllable design of super–oscillatory lenses with multiple sub–diffraction–limit foci. Sci.
Rep. 2017, 7, 1335. [CrossRef] [PubMed]
26. Mansfield, S.M.; Kino, G.S. Solid Immersion Microscopy. Appl. Phys. Lett. 1990, 57, 2615–2616. [CrossRef]
27. Liu, T.; Tan, J.; Liu, J.; Wang, H. Vectorial design of super–oscillatory lens. Opt. Express 2013, 21, 15090. [CrossRef]
Disclaimer/Publisher’s Note: The statements, opinions and data contained in all publications are solely those of the individual
author(s) and contributor(s) and not of MDPI and/or the editor(s). MDPI and/or the editor(s) disclaim responsibility for any injury to
people or property resulting from any ideas, methods, instructions or products referred to in the content.You can also read