BICYCLE SAFETY STUDY FOR THE GOLDEN GATE BRIDGE - Prepared By: Alta Planning + Design 304 12th Street, Suite 2A Oakland, CA 94607
←
→
Page content transcription
If your browser does not render page correctly, please read the page content below

ATTACHMENT

BICYCLE SAFETY STUDY FOR THE
GOLDEN GATE BRIDGE
October 1, 2020

Prepared By:

Alta Planning + Design
304 12th Street, Suite 2A
Oakland, CA 94607

                                         27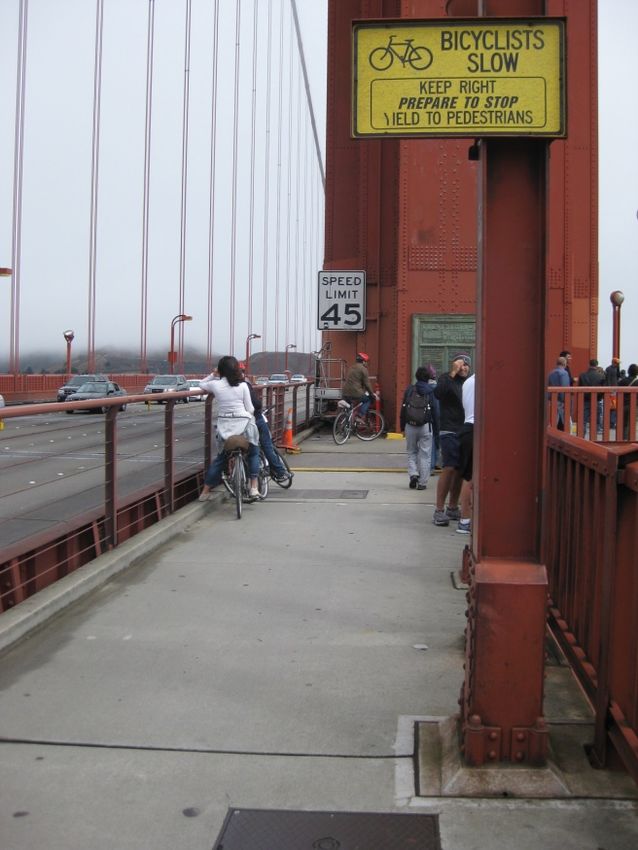
BICYCLE SAFETY STUDY FOR THE GOLDEN GATE BRIDGE

Table of Contents
TABLE OF CONTENTS .................................................................................................................................... I

1.      INTRODUCTION ................................................................................................................................. 2

2.      EXISTING CONDITIONS ...................................................................................................................... 2
        Bridge Sidewalk Conditions & Regulations ................................................................................................. 2

              Bridge Access Rules ..................................................................................................................................... 2

        Existing Bicycle and Pedestrian Count Data ............................................................................................... 4

              Peak Hour .................................................................................................................................................... 4

              Daily Volumes .............................................................................................................................................. 5

        Existing Bicycle Speeds ............................................................................................................................... 8

              West Side Bicycle Speeds ............................................................................................................................ 8

              East Side Bicycle Speeds .............................................................................................................................. 9

        Bicycle and Pedestrian Collision Analysis ................................................................................................. 10

              Annual Collision Trends ............................................................................................................................. 11

              Collisions by Month ................................................................................................................................... 11

              Collisions by Hour ...................................................................................................................................... 12

              Role of Speed in Collisions ......................................................................................................................... 12

              Collision Location ....................................................................................................................................... 14

              Collision Type ............................................................................................................................................. 16

3.      SAFETY RECOMMENDATIONS .......................................................................................................... 17
        Recommendation 1: Establish Bicycle Speed Limit .................................................................................. 17

        Recommendation 2: Continue Signage and Pavement Markings Delineating Space .............................. 18

        Recommendation 3: Continue Radar Speed Signs ................................................................................... 19

        Recommendation 4: Electric Bicycles ....................................................................................................... 20

        Recommendation 5: Other User Groups and Devices.............................................................................. 20

                                                                                    i
                                                                                                                                                                                 28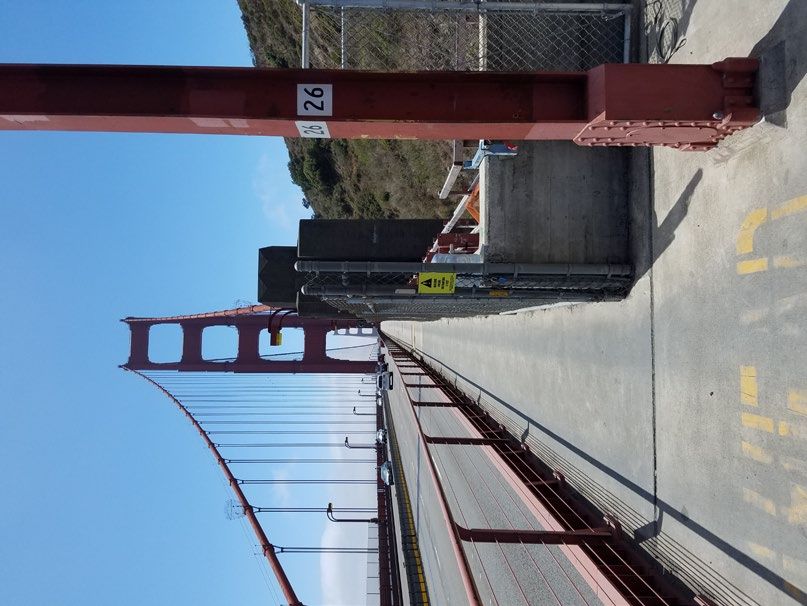
1.                   Introduction
This report presents a study of bicycle safety issues on the Golden Gate Bridge (Bridge) sidewalks including the
rules of operation, bicycle and pedestrian user counts, bicycle collision history, and bicycle speeds. The report
provides recommendations to reduce accidents on the Bridge sidewalks – solo bicycle, bicycle-bicycle, and
bicycle-pedestrian. The study area of this report includes both the east and west sidewalks between the north
and south entry gates; other sections of pathway or roadway approaching the Bridge (e.g. Conzelman Road)
are not included in this study.

2.                   Existing Conditions
Bridge Sidewalk Conditions &
Regulations
The sidewalks on the Golden Gate Bridge allow for bicycle
and pedestrian access across the Bridge, subject to
certain regulations on different times and days of the
week. The sidewalks are approximately 10 feet wide
across most of the span. The 10-foot effective width is
reduced at light poles and at other areas where
maintenance equipment is stored along the outside
railing. At their narrowest point the sidewalks are 5.5 feet             Figure 1: A narrow section of the sidewalk
wide around the Bridge pylons, shown in Figure 1. At the                    adjacent to a pylon on the east side
Bridge towers the sidewalks narrow to approximately 7.5
feet in width. The sidewalks are separated from the
adjacent vehicular travel lanes by a curb and a steel
safety barrier. The rise in elevation across the Bridge
roadway is 84.4 feet. 1

Bridge Access Rules
Signs are posted at each sidewalk entry point that define
the schedule for bicycle and pedestrian use on the two
sides of the Bridge. Figure 2 and Figure 3 show the
existing signs posted on the east and west sides
displaying the sidewalk rules. These rules are intended to
provide safe travel and separation for non-motorized
users. Bicyclists and pedestrians use different sides of the
                                                                          Figure 2: Golden Gate Bridge Rules and
Bridge during most peak periods. Skateboards, skating,                          Restrictions Sign –East Side

1
    https://www.goldengate.org/bridge/history-research/statistics-data/faqs/ Accessed on 2/7/2020

Golden Gate Bridge Bicycle Safety Study                                                                               2
October 2020                                                                                                              29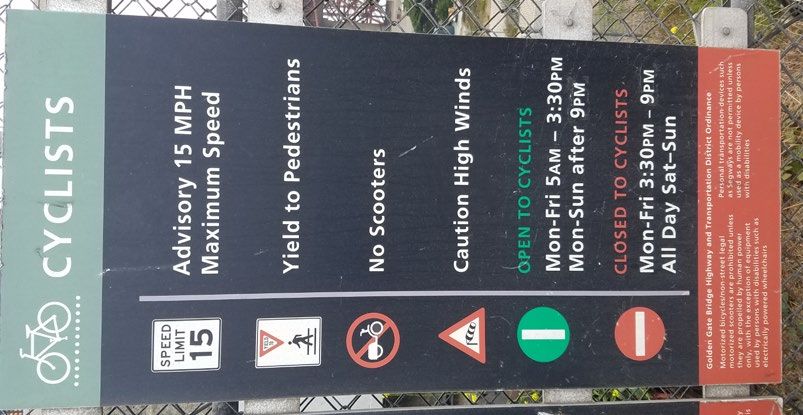
and scooters are not permitted on the sidewalks. 2 More details
regarding the access rules are in the following two sections.

Pedestrians
Pedestrians and wheelchairs are allowed only on the east
sidewalk, which is open daily. Roller blades, skateboards, and roller
skates are not permitted. Dogs are not permitted on the sidewalk
except for service animals. Pedestrians are allowed on the east
sidewalk from 5 AM to 6:30 PM during Pacific Standard Time, and
from 5 AM to 9 PM during Pacific Daylight Time. Hours are
enforced by automatically-controlled gates that open and close at
the appropriate times.                                                          Figure 3: Golden Gate Bridge Rules and
                                                                                     Restrictions Sign – West Side
Bicycles
Bicyclists currently have toll-free access to the Bridge's sidewalks at all times. Bicyclists are instructed to yield
to pedestrians and are advised to use caution in the areas of the towers where sight distances are constrained
and there is limited space to maneuver. Motor-driven cycles and motorized bicycles (mopeds), as defined by
California Vehicle Code sections 405 and 406, may be pushed or ridden on the bridge sidewalks, provided the
engines or motors are not in operation and the motor-driven cycle or motorized bicycle is propelled by human
power only. The District’s Master Ordinance currently does not address electric bicycles, as defined by
California Vehicle Code section 312.5 (established in 2016). District officials report their intention to address
electric bicycles from a policy perspective as part of this greater effort to study and improve safety on the
Bridge sidewalks.

Bicycle access is as follows:

Pacific Daylight Time (second Monday in March to first Sunday in November)
Weekdays

       •    Bicyclists use the east sidewalk between 5 AM to 3:30 PM, sharing it with pedestrians and the west
            sidewalk from 3:30 PM to 9 PM.
       •    Bicyclists use the east sidewalk 9 PM to 5 AM via remotely controlled security gates located at both
            ends of the sidewalk. Cyclists press the "buzzer" located near the closed security gate. After security
            staff identifies the cyclist on a security camera, the gate is opened remotely. Cyclists repeat this
            procedure to exit through the security gate at the other end.

Weekends and Holidays

       •    Bicyclists use the west sidewalk from 5 AM to 9 PM.
       •    Bicyclists use the east sidewalk from 9 PM to 5 AM, using remotely controlled security gate system
            described above.

2   https://www.goldengate.org/bridge/visiting-the-bridge/bikes-pedestrians/ Accessed on 2/7/2020

Golden Gate Bridge Bicycle Safety Study                                                                             3
October 2020                                                                                                             30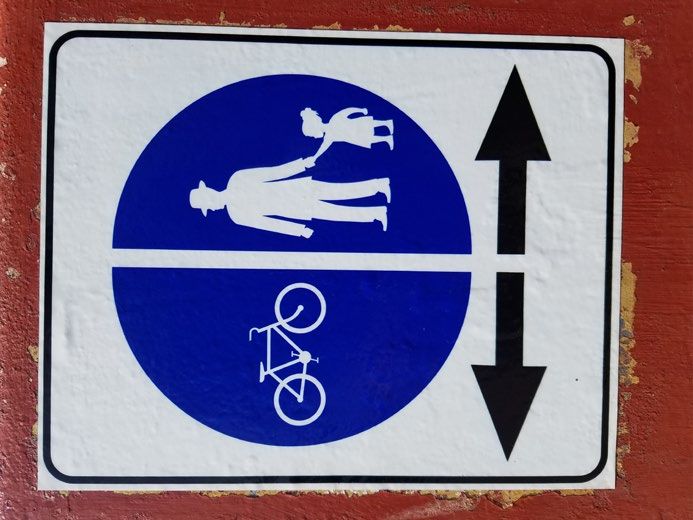
Pacific Standard Time (first Sunday in November to second Monday in March)
Weekdays

    •   Bicyclists use the east sidewalk between 5 AM to 3:30 pm, sharing it with pedestrians and the west
        sidewalk from 3:30 PM to 6:30 PM.
    •   Bicyclists use the east sidewalk 6:30 PM to 5 AM via remotely controlled security gates located at
        both ends of the sidewalk. Cyclists press the "buzzer" located near the closed security gate. After
        security staff identifies the cyclist on a security camera, the gate is opened remotely. Cyclists repeat
        this procedure to exit through the security gate at the other end.

Weekends and Holidays

    •   Bicyclists use the west sidewalk 5 AM to 6:30 PM.
    •   Bicyclists use the east sidewalk from 6:30 PM to 5 AM, using the remotely controlled security gate
        system described above.

Existing Bicycle and Pedestrian Count Data
To better understand the safety issues on the Golden Gate Bridge, the Bridge District performed a series of
bicycle and pedestrian counts on the Bridge. The counts were conducted using a “screenline” methodology
where all bicyclists and pedestrians were counted when entering the Bridge as they crossed an imaginary line
perpendicular to the sidewalks at each of the four Bridge entry points. Only people entering the Bridge were
counted (i.e. traveling north from the San Francisco side, or traveling south from the Marin side). Counts were
conducted on a Saturday (September 12, 2015), a Sunday (September 13, 2015), and two weekdays (Tuesday,
September 15, 2015 and Wednesday, September 16, 2015). Counts were collected on all four days on the east
side of the Bridge from 5:00 AM to 9:00 PM and on the west side of the Bridge from 4 PM to 9:00 PM during
the weekday and from 5:00 AM to 9:00 PM during both weekend days. This methodology took account of the
fact that not all pedestrians or bicyclists cross the Bridge in its entirety on the sidewalks. While some bicyclists
and pedestrians enter at one end and leave from the other, others enter from the south and leave from there
too.

Peak Hour
Table 1 presents the peak hour times and counts of bicyclists and pedestrians on both sides of the Bridge, as
well as the daily total number and percentage of bicyclists on the Bridge for the four days surveyed. Findings
include:

    •   The San Francisco side of the Bridge (both east and west sidewalks) has higher overall volumes of
        people entering the Bridge sidewalks. This is likely due to the higher concentration of visitors
        accessing the Bridge from San Francisco. Nearly 64 percent of visitors during peak hour on the west
        side of the Bridge entered from the south. 58 percent of visitors during peak hour on the east side of
        the Bridge entered from the south.
    •   The highest hourly volumes counted on one sidewalk were on the east sidewalk on Tuesday from
        11:30 AM – 12:30 PM, a time when the west sidewalk is closed to bicyclists. 431 (38.2 percent) of
        east sidewalk users at this time were bicyclists.

Golden Gate Bridge Bicycle Safety Study                                                                            4
October 2020                                                                                                           31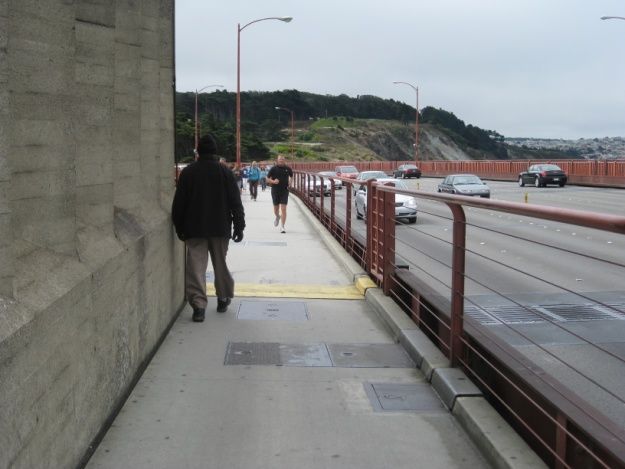
•    A small number of bicyclists use the east sidewalk when the west sidewalk is open, and a small
         number of pedestrians use the west sidewalk
    •    Peak hours on the east sidewalk are between 1:00 PM and 4:30 PM on weekends and on weekday
         mornings, when there are high volumes of both pedestrians and bicyclists.
    •    Peak hours on the west sidewalk are evening commute hours (4:00 PM – 5:00 PM) and midday
         weekends (11:30 AM – 12:45 PM).
    •    There are nearly twice as many daily users on the Bridge sidewalks on the weekend than during
         weekdays. This differential is consistent for both pedestrians and bicyclists.

                     Table 1: Golden Gate Bridge Peak Hour Bicycle and Pedestrian Use

                                                     East Sidewalk
                                     Peak Hour                                          16 Hour Total
        Day          Time            Pedestrians       Bicyclists    Both Pedestrians          Bicyclists     Both
    Weekday 11:30 AM -12:30 PM        697 (61.8%)     431 (38.2%)    1,128   4,591 (67.2%)    2,240 (32.8%)   6,831
    Saturday   3:30 PM - 4:30 PM      983 (99.8%)       2 (0.2%)     985     8,147 (99.7%)      26 (0.3%)     8,173
    Sunday     1:15 PM - 2:15 PM     1,120 (99.6%)      4 (0.4%)     1,124   7,545 (99.4%)      42 (0.6%)     7,587

                                                     West Sidewalk
                                      Peak Hour                                            16 hour Total
        Day          Time            Pedestrians        Bicyclists    Both Pedestrians         Bicyclists     Both
    Weekday     4:00 PM - 5:00 PM       9 (3.8%)       229 (96.2%)     238     28 (3.8%)       718 (96.2%)    746
    Saturday   11:30 AM - 12:30 PM     40 (4.9%)       782 (95.1%)     822     213 (3.7%)     5,536 (96.3%)   5,749
    Sunday     11:45 AM - 12:45 PM     21 (2.3%)       892 (97.7%)     913     225 (3.8%)     5,753 (96.2%)   5,978

Daily Volumes
Pedestrian and bicycle volumes vary on the Golden Gate Bridge throughout the day. Figure 4 and Figure 5
present weekday bicycle and pedestrian volumes on the east and west sidewalks in half-hour increments.
Bicycles and pedestrians have similar use patterns on weekdays.

Figure 6 and Figure 7 present Sunday bicycle and pedestrian volumes on both sides of the Bridge divided into
half-hour increments. Sunday volumes are presented because Sunday peak hour counts were higher than
Saturday’s (Table 1). Large volumes of pedestrians enter the Bridge in the mornings around 9:00 or 10:00 AM,
depending on the day, and volumes remain high until 7:30 PM. Both pedestrian and bicycle volumes are high
during the afternoon, and bicyclists have a prominent peak period on the west sidewalk at midday on
weekends.

Golden Gate Bridge Bicycle Safety Study                                                                               5
October 2020                                                                                                              32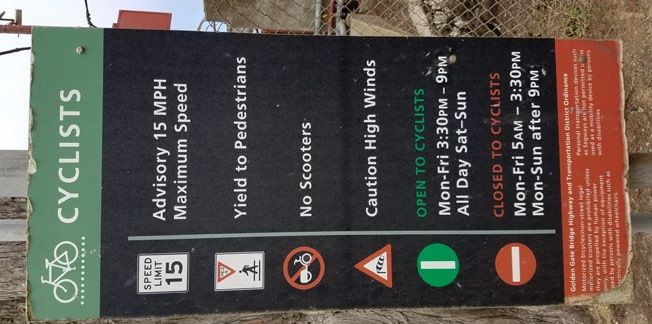
Ped             Bike
       400
       350                                                                    Totals:
       300                                                                    4,591 Pedestrians
       250
                                                                              2,240 Bicyclists
       200
       150
       100
        50
         0
               8:30-9:00
               5:30-6:00
               6:00-6:30
               6:30-7:00
               7:00-7:30
               7:30-8:00
               8:00-8:30
               8:30-9:00
               9:00-9:30
              9:30-10:00
             10:00-10:30
             10:30-11:00
             11:00-11:30
             11:30-12:00
             12:00-12:30
              12:30-1:00
               1:00-1:30
               1:30-2:00
               2:00-2:30
               2:30-3:00
               3:00-3:30
               3:30-4:00
               4:00-4:30
               4:30-5:00
               5:00-5:30
               5:30-6:00
               6:00-6:30
               6:30-7:00
               7:00-7:30
               7:30-8:00
               8:00-8:30
               8:30-9:00
                           AM                                      PM

                  Figure 4: Weekday East Sidewalk Pedestrian and Bicycle Volumes

                                               Ped          Bike

                     140
                     120                          Totals:
                     100                          28 Pedestrians
                      80                          718 Bicyclists
                      60
                      40
                      20
                       0

                 Figure 5: Weekday West Sidewalk Pedestrian and Bicycle Volumes

Golden Gate Bridge Bicycle Safety Study                                                           6
October 2020                                                                                          33
October 2020
0
50
100
150
200
250
300
350
400
450
500
0
100
200
300
400
500
600
8:30-9:00 8:30-9:00
5:30-6:00 5:30-6:00
6:00-6:30 6:00-6:30
6:30-7:00 6:30-7:00
7:00-7:30 7:00-7:30
7:30-8:00 7:30-8:00
8:00-8:30 8:00-8:30
AM
AM
8:30-9:00 8:30-9:00
9:00-9:30 9:00-9:30
9:30-10:00 9:30-10:00
Golden Gate Bridge Bicycle Safety Study
10:00-10:30 10:00-10:30
10:30-11:00 10:30-11:00
11:00-11:30 11:00-11:30
11:30-12:00 11:30-12:00
Ped
Ped
12:00-12:30 12:00-12:30
12:30-1:00 12:30-1:00
1:00-1:30 1:00-1:30
1:30-2:00 1:30-2:00
2:00-2:30 2:00-2:30
Bike
Bike
2:30-3:00 2:30-3:00
3:00-3:30 3:00-3:30
3:30-4:00 3:30-4:00
4:00-4:30 4:00-4:30
PM
PM
4:30-5:00 4:30-5:00
5:00-5:30 5:00-5:30
Figure 6: Sunday East Sidewalk Pedestrian and Bicycle Volumes
Figure 7: Sunday West Sidewalk Pedestrian and Bicycle Volumes
5:30-6:00 5:30-6:00
6:00-6:30 6:00-6:30
Totals:
6:30-7:00 6:30-7:00
Totals:
7:00-7:30 7:00-7:30
42 Bicyclists
7:30-8:00 7:30-8:00
8:00-8:30 8:00-8:30
7,545 Pedestrians
5,753 Bicyclists
225 Pedestrians
8:30-9:00 8:30-9:00
7
34Existing Bicycle Speeds
Bicycle speeds are measured, displayed and recorded by radar speed signs located on the Bridge sidewalks.
Bicycle speed survey data was gathered from the speed sign located on light pole 30 on the west side of the
Bridge which captures the downhill speeds of cyclists traveling northbound to Marin County and a second
speed sign located on light pole 111 on the east side of the Bridge which captures downhill speeds of cyclists
traveling southbound towards San Francisco.
The Bridge District provided the following four reports of data captured by the speed signs:
• Two reports containing 24 hours of speed data captured on Monday, July 1, 2019 for each side of the
bridge, aggregated by hour of day.
• One report containing speed data captured from June 3, 2019 to June 30, 2019 on the west sidewalk,
aggregated by hour of day.
• One report containing speed data captured from June 12, 2019 to June 30, 2019 on the east sidewalk,
aggregated by hour of day.
The speed signs occasionally capture the speeds of non-bicyclists, including vehicles traveling at high speeds
over the bridge. Speeds of bicyclists traveling at speeds lower than 8 mph are not recorded by the signs. These
factors are likely to artificially raise the average recorded speeds, especially on the east side of the Bridge
during peak hours when it becomes crowded with tourists and bicyclists are forced to travel particularly slow.
It should be noted that despite these issues with the data, the average recorded speeds are consistent with
those collected in a 2011 speed study, which did not use radar to gather speed data and the samples sizes are
large and the estimated number of errant data points are low at less than 1%. The following speed analysis
focuses on the multi-week reports, which provide a more complete picture of average bicyclist speeds for each
hour of the day.
Speed of bicyclists on the west and east sides of the Golden Gate Bridge vary. Generally, bicyclists travel faster
on the bicycle-only west side than on the east sidewalk shared with pedestrians. Speeds also vary by section
of the Bridge, slower on the up slopes and faster on the down slopes. Based on observations, the highest speeds
and greatest potential for speed-related collisions comes from road cyclists (i.e., non-tourist, experienced
recreational cyclist) who may travel up to 10 mph faster on average than other types of bicyclists. These faster
riders generally account for about 10 percent of bicyclists on the Bridge, with higher percentages at certain
times, such as Saturday mornings when many group rides leave from San Francisco and head into Marin.
West Side Bicycle Speeds
The west side of the Golden Gate Bridge is open to bicyclists on weekdays from 3:30 PM to 6:30 PM and on
weekends from 5:00 AM to 6:30 PM during Pacific Standard Time. Weekday and weekend closing hours on the
west side of the Bridge are extended to 9 PM during Pacific Daylight Time. Generally, bicyclists travel faster on
the west side than the east side of the Bridge because there are no pedestrians affecting the flow of bicycle
traffic. The greatest potential conflict arises when the bicyclists traveling at higher speeds attempt to pass
bicyclists riding at slower speeds. This can include groups of bicyclists passing other groups of bicyclists and can
occur in both the northbound and southbound directions. This is especially challenging when the pathway
narrows at the pylons and towers.
Golden Gate Bridge Bicycle Safety Study 8
October 2020 35Speeds of bicyclists riding downhill towards Marin County are measured and recorded by the radar speed sign
at light pole 30. Table 2 shows the hourly average speeds recorded from June 3, 2019 to June 30, 2019. It is
important to note that these recorded averages may be slightly higher than actual travel speeds as the speed
signs do not record bicyclists traveling below 8 mph, and because the signs occasionally record the speeds of
vehicles traveling over the bridge at high speeds. The overall average speed on the west sidewalk for the data
period was 17 mph and the 85th percentile speed for the period was calculated to be 20 mph.
Table 2: Bicyclist Speeds on the West Side of the Bridge
Hour Average Speed
5:00 AM - 6:00 AM 17 mph
6:00 AM - 7:00 AM 17 mph
7:00 AM - 8:00 AM 17 mph
8:00 AM - 9:00 AM 18 mph
9:00 AM - 10:00 AM 17 mph
10:00 AM - 11:00 AM 17 mph
11:00 AM - 12:00 PM 17 mph
12:00 PM - 1:00 PM 15 mph
1:00 PM - 2:00 PM 17 mph
2:00 PM - 3:00 PM 16 mph
3:00 PM - 4:00 PM 17 mph
4:00 PM - 5:00 PM 18 mph
5:00 PM - 6:00 PM 18 mph
6:00 PM - 7:00 PM 18 mph
7:00 PM - 8:00 PM 17 mph
8:00 PM - 9:00 PM 21 mph
East Side Bicycle Speeds
The east side of the Bridge is open to bicyclists on weekdays from 5:00 AM until 3:30 PM, and every night
during the hours that the west side of the Bridge is closed. Bicyclists using the east side of the Bridge during
the day must share the sidewalk space with pedestrians. The greater number of users creates congestion, and
this “friction” forces bicyclists to travel at slower speeds for much of the Bridge span. The greatest potential
conflict occurs when faster moving bicyclists attempt to pass other cyclists or pedestrians. Pedestrians and
bicyclists, including slower moving tourists and faster moving tourists and recreational bicyclists, must occupy
the same area on the Bridge. The chance for conflict is greatest at the pylons and towers where the path width
is constrained, and when bicyclists are traveling down slope and their speeds are highest. Like the west side,
speeds vary by section of the Bridge, slower on the up slopes and faster on the down slopes. Bicyclists typically
ride slower than 10 mph on the up slopes, but may travel up to approximately 28 mph on the down slopes.
Speeds of bicyclists riding downhill towards San Francisco are measured and recorded by the radar speed sign
at light pole 111. Table 3 shows the hourly average speeds recorded from June 12, 2019 to June 30. It is
Golden Gate Bridge Bicycle Safety Study 9
October 2020 36important to note that these recorded averages may be slightly higher than actual travel speeds as the speed
signs do not record bicyclists traveling below 8 mph, and because the signs occasionally record the speeds of
vehicles traveling over the bridge at high speeds. The overall average speed on the east sidewalk for the data
period was 13 mph and the 85th percentile speed for the entire period was calculated to be 17 mph.
Table 3: Bicyclist Speeds on the East Side of the Bridge
Hour Average Speed
12:00 AM - 1:00 AM 13 mph
1:00 AM - 2:00 AM 16 mph
2:00 AM - 3:00 AM 17 mph
3:00 AM - 4:00 AM 16 mph
4:00 AM - 5:00 AM 16 mph
5:00 AM - 6:00 AM 16 mph
6:00 AM - 7:00 AM 17 mph
7:00 AM - 8:00 AM 15 mph
8:00 AM - 9:00 AM 14 mph
9:00 AM - 10:00 AM 11 mph
10:00 AM - 11:00 AM 11 mph
11:00 AM - 12:00 PM 10 mph
12:00 PM - 1:00 PM 11 mph
1:00 PM - 2:00 PM 10 mph
2:00 PM - 3:00 PM 9 mph
3:00 PM - 4:00 PM 9 mph
East side closed to cyclists from 3:30 to 9:00 PM
9:00 PM - 10:00 PM 16 mph
10:00 PM - 11:00 PM 17 mph
11:00 PM - 12:00 AM 15 mph
The average speeds are higher at night and in the early morning, but drop off as the sidewalk becomes
congested with tourists and pedestrians. Note that the average speeds on the east side of the bridge are
generally lower than those on the west side of the bridge, especially as large numbers of people visit the bridge
from the morning to peak hours in the afternoon.
Bicycle and Pedestrian Collision Analysis
The Golden Gate Bridge District maintains record of all bicycle collisions occurring on the Bridge that result in
Bridge Patrol Officers being dispatched and responding to render aid. This section reviews the most recent
collision data available from Golden Gate Bridge staff. Collisions included in this analysis are only those that
occurred on the Bridge sidewalks, and not on connecting paths, roads or parking areas adjacent to the Bridge.
Between 2010 and 2019, there were 241 reported collisions involving bicyclists on the Golden Gate Bridge
sidewalks. These 241 collisions resulted in 258 injuries. 140 of the collisions (58 percent of total) resulted in at
least one party being transported by ambulance for off-site medical care.
Golden Gate Bridge Bicycle Safety Study 10
October 2020 37The most common type of bicycle collision on the Bridge sidewalks were solo bicycle collisions. There were
approximately 19 times as many solo bicycle collisions as there were bicycle-pedestrian collisions during the
study period. A nearly equal amount of collisions occurred on each side of the bridge.
Annual Collision Trends
Figure 8 shows the number of bicycle related collisions on the Golden Gate Bridge from 2010 - 2019. During
2013-2015 there were a higher number of collisions than other years during the study period.
0 5 10 15 20 25 30 35
2010 22
2011 15
2012 24
2013 31
2014 33
2015 33
2016 19
2017 19
2018 21
2019 24
Figure 8: Bicycle Related Collisions on the Golden Gate Bridge
Collisions by Month
Figure 9 shows the number of bicycle collisions on the Bridge by month, from 2010-2019. With the exception
of January, there were fewer reported collisions during the winter months. There were 12 reported collisions
in November, December, and February, and 14 in March, while all other months had 20 or more collisions.
0 5 10 15 20 25 30 35
January 23
February 12
March 14
April 20
May 21
June 28
July 30
August 23
September 20
October 26
November 12
December 12
Figure 9: Bicycle Related Collisions on the Golden Gate Bridge by month
Golden Gate Bridge Bicycle Safety Study 11
October 2020 38Collisions by Hour
Figure 10 below shows the number of collisions by hour of day. The highest frequency of these collisions
occurred between 11:00 AM and 5:00 PM over the ten-year span. The increase in number of collisions in
midday to late afternoon is likely due to the higher volumes of users present on the Bridge during these times.
40
35 33 34
30 28
26
24
25 22
20
15 13 13
10 10 10 9
10
5 2 1 3
1 1 1
0
12:00 - 1:00
1:00 - 2:00
2:00 - 3:00
3:00 - 4:00
4:00 - 5:00
5:00 - 6:00
6:00 - 7:00
7:00 - 8:00
11:00 - 12:00
12:00 - 1:00
8:00 -9:00
1:00 - 2:00
2:00 - 3:00
3:00 - 4:00
4:00 - 5:00
5:00 - 6:00
6:00 - 7:00
7:00 - 8:00
8:00 - 9:00
9:00 - 10:00
10:00 - 11:00
9:00 - 10:00
10:00 - 11:00
11:00 - 12:00
AM PM
Figure 10: Bicycle Related Collisions on the Golden Gate Bridge Hourly Frequency
Role of Speed in Collisions
Figure 11 shows that speed was recorded as a
Speed not
factor in nearly 21 percent of collisions, “not a
a factor
factor” in 2 percent of collisions, and “unknown” 2%
for the majority (77 percent) of collisions. It is
Speed a
important to note that all of the reported bicycle factor
collisions involved at least one injury. Many bicycle 21%
collisions on the Bridge sidewalks occur at low
speeds, are minor, do not involve any serious
injury, and are never reported. Bicycling at slower Unknown
77%
speeds reduces stopping distance, and increases
the amount of time bicyclists and pedestrians have
to react and avoid collisions. In this sense, speed is
a factor in all collisions.
Figure 11: Proportion of crashes where speed was
a recorded factor
Golden Gate Bridge Bicycle Safety Study 12
October 2020 39Collisions Requiring Medical Treatment
The only record of crash severity in the data provided by the Bridge District whether or not a victim(s) was
transported by ambulance for off-site medical care. Ambulances are called when a collision results in a more
serious injury and victims require immediate medical care. Transportation by ambulance away from the scene
is indicative of more severe injuries as compared to on-scene medical treatment and release. Figure 12 shows
that victims were transported by ambulance as a result of 58% of recorded collisions between 2010 and 2019.
Figure 13 shows that a victim was transported by ambulance more often than not in collisions where speed
was recorded as a factor in the collision. Higher speed collisions often result in injuries that are more severe.
100.0% 2.1% 2.0%
90.0% 15.8%
24.3%
80.0%
Victim Not 70.0%
Transported
Victim 60.0%
42%
Transported 50.0%
58%
40.0% 82.2%
73.6%
30.0%
20.0%
10.0%
0.0% Unknown Speed a factor Speed not a factor
Victim Transported No Victim Transported
Figure 12: Proportion of recorded Figure 13: Proportion of collisions where speed was
collisions where a victim was transported a factor, comparing collisions where a victim was
by ambulance transported by ambulance to collisions where no
victim was transported by ambulance
Golden Gate Bridge Bicycle Safety Study 13
October 2020 40As shown in the prior section, the west side is 140
closed to pedestrians, and with less congestion 120
the average bicyclist speed is higher than on the
east side. Higher speeds likely lead to a higher 100 40
61
rate of collisions that result in a severe injury 80
requiring an ambulance. Figure 14 shows that a
victim was transported by ambulance in a higher 60
number and proportion of crashes on the west
40 80
side than the east side of the Bridge. 60
20
0
West East
Transport by Ambulance No Transport by Ambulance
Figure 14: Number of collisions on the east and west
sidewalks of the Bridge, broken down by whether or
not transportation by ambulance resulted.
Collision Location
The officer responding to a collision pinpoints the incident to the nearest Golden Gate Bridge light pole. Even-
numbered light poles are on the west side and odd-numbered light poles are on the east side.
Figure 15 shows the number of collisions occurring on each section of the bridge, based on the Bridge side
and light pole numbers listed in the collision data. As shown, a nearly equal number of crashes happen on
each side of the bridge. There were 121 collisions on the east sidewalk, and 120 collisions on the west
sidewalk during the study period. The highest number of collisions (10 collisions) occurred at light pole 26,
which is a point on the Bridge where the sidewalk narrows at one of the north end pylons, and which is also
adjacent to a mid-bridge entrance/exit to the Marin Headlands. These factors likely cause greater conflict
amongst Bridge users. Figure 16 shows a photo of the sidewalk narrowing at light pole 26.
Golden Gate Bridge Bicycle Safety Study 14
October 2020 41Figure 15: Bicycle Collisions at Light Poles Golden Gate Bridge Bicycle Safety Study 15 October 2020 42
Seven collisions, the second highest number, occurred at light pole 42, which
is adjacent to the Marin Tower, a point in the Bridge where visibility is
reduced as the sidewalk wraps around the tower. The need for bicyclists to
navigate around the tower may result in more collisions. Five collisions
occurred near light poles 27, 29, and 31, which are on the east side of the
Bridge and near the North end Pylons where the sidewalk narrows. This
constrained sidewalk configuration could result in more user conflicts. Many
incidents also occur at the south end of the Bridge, especially between light
poles 111 and 127. There are obstacles here that may result in increased
collisions: The sidewalk narrows around the south end pylons between light
posts 113 and 120 and then the sidewalk turns to navigate around the Toll
Plaza. Pedestrian activity is also highest on this section of the Bridge, which
might explain increased conflict on the east side of the Bridge.

                                                                                    Figure 16: The sidewalk narrows
                                                                                            at light pole 26.
Collision Type
Of the 241 reported collisions between 2010-2019, 144 of these were solo bicycle collisions; 65 were bicycle-
bicycle collisions; 28 were bicycle-pedestrian collisions; 2 were bicycle-motorist collisions; and, 2 were
unknown or other types of collisions. Figure 17 shows the number of collisions categorized on each side of the
Bridge, segmented by type. Bicycle-bicycle collisions happen 150 percent more frequently on the west sidewalk
than on the east sidewalk.

About 93 percent of bicycle/pedestrian collisions occurred on weekdays, and all but four of these incidents
occurred on the east sidewalk. During the weekends bicycles have full use of the west sidewalk so there are far
fewer interactions with pedestrians on the east side of the Bridge as a result.

                              Solo   Bike and Bike    Bike and Pedestrian   Bike and Motorist    Other

                       East                      69                           26                24       2

                      West                           75                              39              42

                              0         20            40         60          80           100        120     140

           Figure 17: Number of collisions on each side of the bridge, segmented by collision type.

Golden Gate Bridge Bicycle Safety Study                                                                        16
October 2020                                                                                                          43
3. Safety Recommendations Five recommendations are proposed to enhance safety for bicyclists and pedestrians on the Bridge. These recommendations are: establishing a bicycle speed limit, separating cyclists and pedestrians with the use of signs and pavement markings, continuing the use of radar speed signs, incorporating e-bikes into the District’s Master Ordinance, and continuing the restriction of other user groups. Discussions for each of these recommendations are described in this section. Recommendation 1: Establish Bicycle Speed Limit There is currently no bicycle speed limit posted on the Golden Gate Bridge sidewalks. Based on our observations and measurements of existing bicyclist speeds, this report recommends a speed limit of 15 mph. Although modern bicycles, especially e-bikes, are capable of speeds much greater than this, the narrow sidewalks coupled with high mixed-use congestion (mix of bicycles and pedestrians, as well as a mix of slower and faster cyclists), opposing traffic flows, and often high winds and other unfavorable weather conditions support a speed limit of 15 mph. This is consistent with the speed limits on other shared use pathways adjacent to the Bridge, around the Bay Area, and nationally. Additionally, a 15 mph speed limit is consistent with the 85th percentile speeds observed in the speed study and is not likely to limit the ability of commuters to traverse the span by bicycle quickly during favorable weather and traffic conditions. The 15 mph speed limit should be posted on both existing entrance signs to the sidewalk. Signs should also be posted on Bridge signs not interfering with the existing motorist speed limit signs. Additionally, the speed limit should be stenciled clearly on the sidewalk, as shown in Figure 20. Around the towers the speed limit should be decreased to 5 mph, also clearly signed. At all times, people should continue to travel at speeds that are safe for the conditions of the trail. Golden Gate Bridge Bicycle Safety Study 17 October 2020 44
Recommendation 2: Continue Signage and Pavement
Markings Delineating Space
Signage and pavement markings will help to delineate
specific space on the sidewalk for bicyclists and
pedestrians. Currently, during the times of the day when
the sidewalk is shared, pedestrians tend to walk on the
outside (water side) of the sidewalk and bicyclists tend
to ride on the inside (traffic side), no matter what
direction they are traveling. The greatest potential for
conflict occurs where this “informal” segregation breaks
down. Groups of pedestrians may walk across the entire
pathway width and blocking bicyclists or bicyclists may
weave from right to left through pedestrians
Many multi-use paths address such safety conflicts by
segregating users, either providing completely separate       Figure 18: Current Bridge Bicycle/Pedestrian
pathways for bicyclists and pedestrians, or striping                      Separation Signage
separate space for users on the same path (e.g. bikes
stay left, pedestrians stay right). Obviously with the
Golden Gate Bridge there is no additional space to add a
new path, and the 10-foot sidewalk width is not
sufficient to stripe a centerline or other division for its
entire length.

We recommend the use of pavement markings placed at
intervals that illustrate the general separation of
bicycles to the inside and pedestrians to the outside.
While this would not create a “defined” space as would
an unbroken dividing stripe, it would reinforce the
informal bikes inside / pedestrians outside segregation
that currently occurs and results in the smoothest
observed flows.

This segregation is observed only on the straightaways;
there is such heavy congestion around the towers with
pedestrians standing on both sides and extremely
limited sightlines that the area is seen as a special zone
of mixed, extremely slow speed bicyclist travel.

Signage                                                       Figure 19: Existing Bicycle Sign on the Bridge
                                                                                  Towers
Continued use of signage is recommended on the
Golden Gate Bridge to help inform bicyclists and
pedestrians where they should be while using the
sidewalk. Figure 18 presents the signs currently in use.

Golden Gate Bridge Bicycle Safety Study                                                                        18
October 2020                                                                                                        45
These are recommended for the light posts, similar to how the existing BICYCLISTS SLOW signs are posted
(Figure 19). If needed, the color of the signs can be modified to match the existing yellow bicycle sign placards.
Pavement Markings
Pavement markings are recommended on the shared bicycle and pedestrian sidewalk. The pavement markings,
or stencils, inform bicyclists and pedestrians where they should be while on the sidewalk. The markings, as
Figure 20 presents in a photo simulation, reflects the same division as the recommended signs- the inside of
the sidewalk for bicyclists and the outside for pedestrians. The bicycle section of the sidewalk is split from the
pedestrian section with a white solid line that extends only the length of the markings. The markings should be
placed approximately every 500 feet on sections of the sidewalk that are 10 feet wide.
Figure 20: Recommended Pavement Markings
Recommendation 3: Continue Radar Speed Signs
In early 2020, Bridge Communications Technicians upgraded the existing radar speed signs to Wi-Fi enabled
units that continually upload speed data observations to a cloud-based data storage and reporting solution.
The project also included the addition of four new speed signs at mid-span so that cyclists receive feedback
Golden Gate Bridge Bicycle Safety Study 19
October 2020 46regarding their speed of travel and observations are recorded at those locations as well. We recommend continued maintenance and utilization of the speed signs going forward. This will offer cyclists feedback on their speed of travel as most bicycles do not have speedometers and continued monitoring of observed speed data will provide insight regarding traffic patterns and safety conditions on the Bridge sidewalks. Recommendation 4: Electric Bicycles Electric bikes or e-bikes are growing in popularity, and many bicycle rental companies now offer and promote e-bikes for use by visitors riding across the Golden Gate Bridge and many recreational cyclists and commuters have adopted e-bikes to extend their range of travel and enhance the cycling experience. Currently the Bridge does not specifically regulate e-bikes because the District’s ordinances were crafted prior to the advent and popularization of the technology. The State of California regulates e-bikes based on three different classifications, although local jurisdictions can adopt their own regulations. Under the State law Class 1 e-bikes are pedal-assist with a top motor-assisted speed of 20 mph, and can be operated on any multi-use path or roadway in California. Class 2 e-bikes have a throttle that can be operated without pedaling, a top motor-assisted speed of 20 mph, and are also allowed on any bike path or roadway. Class 3 e-bikes are pedal assist with a top motorized speed of 28 mph, and can only be operated in on-street facilities (bike lanes, routes, or cycle tracks) and are prohibited on multi-use paths. Consistent with other jurisdictions, the District should allow only Class 1 and Class 2 e-bikes on the Bridge sidewalks, meaning pedal-assist bikes with a top speed of 20 mph. However, because e-bikes look similar regardless of which Class of bike they are, it is important to consider the reality of enforcement. It would be nearly impossible for a law enforcement officer to discern whether a person was riding a Class 1 pedal-assist or a Class 3, since the only difference is the top speed. Therefore having a mechanism to regulate the speeds of bicycles through an established bicycle speed limit will be important to the practical management of e-bikes on the Bridge and ensuring that bicyclists are maintaining speeds compatible with the conditions on the sidewalk. Recommendation 5: Other User Groups and Devices The Bridge currently prohibits rolling type pedestrian conveyances such as roller / inline skates, skateboards, and scooters along with animals such as dogs (except service animals) and horses. These prohibitions should continue as these user groups are not compatible with the high levels of pedestrian and bicycle use experienced on the Bridge sidewalks. Our research into multi-use trail regulations of unicyclists yielded no results; this user group is simply so unique and infrequent that trail and pathway management agencies do not regulate them as a special group. In terms of safety, a “tall bike” (a custom built bike where the seat is situated at a height that may be 5 or more feet off the ground) poses a safety risk to the user from toppling over safety railings. Because the safety rail stands 4’6” tall, prohibition of bicycles or unicycles whose seats are more than 4 feet off the ground might make sense so that no riders topple over the safety railing. Consistent with the District’s stated policy of encouraging alternative forms of commute and recreational travel, we recommend that Bridge officials continue to monitor technology developments and potentially adjust ordinances to allow future alternative technologies, beyond e-bikes, to use the Bridge if they prove to be viable alternatives to personal auto travel and can be accommodated safely on the sidewalks. Golden Gate Bridge Bicycle Safety Study 20 October 2020 47
THIS PAGE INTENTIONALLY LEFT BLANK

                                     48
You can also read