Distinct gut microbiomes in two polar bear subpopulations inhabiting different sea ice ecoregions
←
→
Page content transcription
If your browser does not render page correctly, please read the page content below
www.nature.com/scientificreports
OPEN Distinct gut microbiomes in two
polar bear subpopulations
inhabiting different sea ice
ecoregions
Megan Franz1, Lyle Whyte1, Todd C. Atwood2, Kristin L. Laidre3,4, Denis Roy1,
Sophie E. Watson5, Esteban Góngora1 & Melissa A. McKinney1*
Gut microbiomes were analyzed by 16S rRNA gene metabarcoding for polar bears (Ursus maritimus)
from the southern Beaufort Sea (SB), where sea ice loss has led to increased use of land-based food
resources by bears, and from East Greenland (EG), where persistent sea ice has allowed hunting of ice-
associated prey nearly year-round. SB polar bears showed a higher number of total (940 vs. 742) and
unique (387 vs. 189) amplicon sequence variants and higher inter-individual variation compared to EG
polar bears. Gut microbiome composition differed significantly between the two subpopulations and
among sex/age classes, likely driven by diet variation and ontogenetic shifts in the gut microbiome.
Dietary tracer analysis using fatty acid signatures for SB polar bears showed that diet explained more
intrapopulation variation in gut microbiome composition and diversity than other tested variables,
i.e., sex/age class, body condition, and capture year. Substantial differences in the SB gut microbiome
relative to EG polar bears, and associations between SB gut microbiome and diet, suggest that the
shifting foraging habits of SB polar bears tied to sea ice loss may be altering their gut microbiome,
with potential consequences for nutrition and physiology.
Many metabolic and immune system processes of higher-order organisms are carried out by an assemblage of
microbes—predominantly bacteria—found within their gastrointestinal systems1,2. Thus, the gut microbiome
influences host nutrition, health, and resistance to enteric pathogenic d iseases1,3,4. Although far less studied than
those of human, laboratory, or domestic animals5, the gut microbiomes of many wild animal species have recently
been characterized6. Many of these species host Firmicutes, Bacteroidetes, Proteobacteria, Actinobacteria and
Verrucomicrobia as the major bacterial phyla1. Yet, differences in the species composition within phyla among
host species appears to be the n orm7. In mammalian wildlife, variation in bacterial community composition
among host species has been attributed to a combination of host phylogeny, habitat, and d iet2,8,9; however, diet
appears to be a predominant driver of interspecific variation in gut bacterial community composition and of
intraspecific variation10–12.
Recent research has argued that inter-individual variation can provide insight into the adaptive potential of
wildlife species faced with environmental s tressors13,14. Yet, the role of multiple drivers (i.e., host sex, age, diet,
and body condition) on inter-individual and inter-population variation among wild animal hosts in terms of
their gut bacterial communities is u nderstudied8,9,15,16. In a small study on wild bears, for example, four indi-
vidual grizzly bears (Ursus arctos) from a population in Alberta, Canada, feeding in part on agricultural subsidies
(cereals, domestic animals) showed significant differences in genus-level bacterial abundance compared to four
grizzly bears from a population hunting wild prey (e.g., ungulates); both populations also showed wide variation
among individuals and differences in gut bacteria compared to two captive grizzly bears17. In 16 individuals of U.
arctos from Europe, changes in individual gut bacterial diversity and composition occurred among individuals
between hibernation and active periods18. Thus, differences in the gut microbial community both within and
among populations can shed light into the consequences of changes in habitat use—such as exposure to different
1
Department of Natural Resource Sciences, McGill University, Sainte‑Anne‑de‑Bellevue, QC H9X 3V9,
Canada. 2United States Geological Survey (USGS), Alaska Science Center, University Drive, Anchorage, AK 99508,
USA. 3Polar Science Center, Applied Physics Laboratory, University of Washington, Seattle, WA, USA. 4Greenland
Institute of Natural Resources, P.O. Box 570, Nuuk, Greenland. 5School of Biosciences, Cardiff University, The Sir
Martin Evans Building, Museum Avenue, Cardiff, UK. *email: melissa.mckinney@mcgill.ca
Scientific Reports | (2022) 12:522 | https://doi.org/10.1038/s41598-021-04340-2 1
Vol.:(0123456789)
www.nature.com/scientificreports/
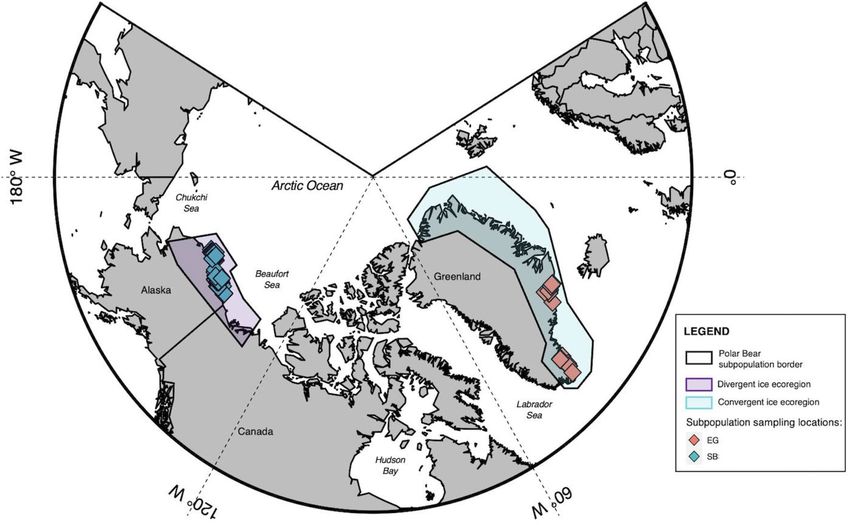
Figure 1. Map of sampling locations for the two polar bear subpopulations in this study. The East Greenland
(EG) subpopulation is distributed along the east Greenland shoreline and occurs in a convergent ice ecoregion
(blue), while the Southern Beaufort Sea (SB) polar bear subpopulation is distributed along the northern shore
of Alaska and Canada and occurs in a divergent ice ecoregion (purple). Map made with R Studio using the
PlotSvalbard package in R (V. 4.0.3).
environmental microbes, macrofauna, and climate factors that can influence microbial presence/abundance in
a region—as well as differences in feeding habits within wild species.
Polar bears (Ursus maritimus) are distributed across the circumpolar Arctic in nineteen spatially segregated
subpopulations19. Similarity in habitats among some of these subpopulations has allowed for their classification
into ecoregions, each of which has distinct sea ice characteristics that influence polar bear seasonal movements,
foraging activities, and d iets20–22. The ‘convergent ecoregion’ tends to receive supplemental sea ice formed within
other regions and the Arctic Basin, providing polar bears, such as the East Greenland (EG) subpopulation, with
near year-round access to sea ice and to the ice seals that comprise most of their diet20,23. Within the divergent
ecoregion, including polar bears in the Southern Beaufort Sea (SB) subpopulation, sea ice was present year-round
before the 1 980s24 (Fig. 1). However, with climate change-mediated loss of sea ice over the last four decades, SB
polar bears now spend longer periods of time onshore during the reduced ice season25,26. This has led to increased
access to onshore foods, including blubber, meat, and bones of bowhead whales leftover from local subsistence
harvests (‘bone piles’), as well as carcasses of fish, caribou, and birds left nearby27.
The distinct sea ice conditions that result in differing habitat use and feeding habits for EG and SB polar bears
provides a unique opportunity to explore inter-population variation in the gut microbiota of a wild animal species
and could provide insight into the ability of polar bears to cope with added environmental stressors introduced by
climate change. Preliminary findings on the gut microbiota of a single polar bear subpopulation using 16S rRNA
gene clone libraries detected just one phylum, Firmicutes, suggesting low gut bacterial diversity relative to other
mammalian species28. However, more recently, 16S rRNA metataxonomics using Illumina technology approaches
found 25 bacterial phyla in the SB subpopulation and greater gut bacterial diversity for bears that spend part of
the year onshore and that likely have a more diverse terrestrial-based diet relative to bears remaining offshore
with likely narrower diets consisting largely of ice seals29. In this study, we use high-throughput 16S rRNA gene
amplicon sequencing techniques to assess inter-population variation in gut microbial composition and diversity
between EG and SB polar bears using samples collected during the same season (late-winter/early spring). We
also explore how sex/age class, body mass (as an indicator of body condition), and (for SB bears) dietary patterns
based on fatty acid (FA) s ignatures30, are associated with inter-and (for SB bears) intra-population variation in
gut microbial communities in two wild polar bear subpopulations. Given the evidence of dietary alterations
occurring in the SB subpopulation and the distinct ice ecoregion differences that force some SB polar bears to
spend greater amounts of time on land, we predict that SB gut microbiota will be more diverse and that we will
see a higher degree of interindividual variation and a greater number of overall and unique bacterial species in
the SB subpopulation compared to EG. We also expect that diet will be a significant driver of both gut bacterial
diversity and composition in the subset of SB polar bears for which FA data was available.
Scientific Reports | (2022) 12:522 | https://doi.org/10.1038/s41598-021-04340-2 2
Vol:.(1234567890)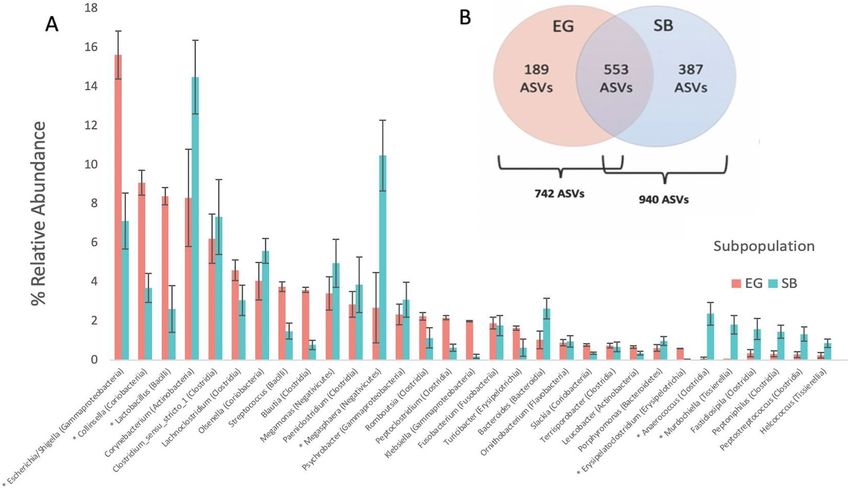
www.nature.com/scientificreports/

                                  Phylum-level                    Analysis of Variance Table
                                                                  Df   SumsOfSqs     MeanSqs   F.Model   R2      Pr(> F)
                                  Sex/age class                   3    0.270         0.090     1.370     0.044   0.210
                                  Subpopulation                   1    0.141         0.141     2.143     0.023   0.103
                                  Body Condition                  1    0.053         0.053     0.802     0.008   0.485
                                  Subpopulation: Body Condition   1    0.087         0.087     1.320     0.014   0.268
                                  Residuals                       86   5.653         0.066     NA        0.911   NA
                                  Total                           92   6.203         NA        NA        1.000   NA
                                  Class-level                     Analysis of Variance Table
                                                                  Df   SumsOfSqs     MeanSqs   F.Model   R2      Pr(> F)
                                  Sex/age class                   3    1.058         0.353     2.511     0.076   0.004
                                  Subpopulation                   1    0.481         0.481     3.429     0.035   0.008
                                  Body Condition                  1    0.089         0.089     0.635     0.006   0.665
                                  Subpopulation: Body Condition   1    0.240         0.240     1.712     0.017   0.136
                                  Residuals                       86   12.073        0.140     NA        0.866   NA
                                  Total                           92   13.942        NA        NA        1.000   NA
                                  Genus-level                     Analysis of Variance Table
                                                                  Df   SumsOfSqs     MeanSqs   F.Model   R2      Pr(> F)
                                  Sex/age class                   3    2.077         0.692     2.658     0.079   < 0.001
                                  Subpopulation                   1    1.212         1.212     4.654     0.046   < 0.001
                                  Body Condition                  1    0.151         0.151     0.579     0.006   0.881
                                  Subpopulation: Body Condition   1    0.328         0.328     1.261     0.013   0.219
                                  Residuals                       86   22.400        0.260     NA        0.856   NA
                                  Total                           92   26.168        NA        NA        1.000   NA
                                  ASV-level                       Analysis of Variance Table
                                                                  Df   SumsOfSqs     MeanSqs   F.Model   R2      Pr(> F)
                                  Sex/age class                   3    2.172         0.724     2.731     0.081   < 0.001
                                  Subpopulation                   1    1.391         1.391     5.246     0.052   < 0.001
                                  Body Condition                  1    0.157         0.157     0.592     0.006   0.852
                                  Subpopulation: Body Condition   1    0.299         0.299     1.129     0.011   0.321
                                  Residuals                       86   22.798        0.265     NA        0.850   NA
                                  Total                           92   26.817        NA        NA        1.000   NA

                                 Table 1.  Summary of permutational analysis of variance (PERMANOVA) results* assessing differences in gut
                                 bacterial composition at bacterial phylum, class, genus, and ASV levels for East Greenland (EG) and Southern
                                 Beaufort Sea (SB) polar bear subpopulations using Bray–Curtis distance method. *Significant terms are in
                                 bold.

                                 Results
                                 Gut bacterial diversity and composition of EG and SB polar bears. A total of 12,294,006 reads were
                                 obtained for both EG (n = 34) and SB (n = 59) samples combined, with an average of 81,960 reads per sample.
                                 Following DADA2 processing, 6,172 amplicon sequence variants (ASVs) were identified overall, which were
                                 then further reduced to 1129 ASVs after removing ASVs with less than two counts and zero variance across all
                                 samples.
                                     Although mean alpha diversity was qualitatively higher in SB than in EG polar bears for Shannon (SB: 2.74
                                 +/− 0.06; EG: 2.65 +/− 0.07), Inverse Simpson (SB: 9.2 +/− 0.6; EG: 8.3 +/− 0.6), and Faith’s Phylogenetic Diversity
                                 (SB: 13.3 +/− 0.4; EG: 12.9 +/− 0.5) (Supplementary Fig. S1), linear models showed no effect of subpopulation
                                 for any of these alpha diversity indices (Supplementary Table S1).
                                     Differences in composition between EG and SB polar bears were assessed at multiple bacterial taxonomic
                                 levels—Phylum, Class, Genus, and ASV—and found to differ significantly at bacterial class (R2 = 0.035, F1,93 = 3.43,
                                 p = 0.008), genus (R2 = 0.046, F1,93 = 4.62, p < 0.001), and ASV-levels (R2 = 0.052, F1,93 = 5.20, p < 0.001) (Table 1).
                                 Of the seventeen detected phyla, five were predominant comprising ~ 97% of the total reads (Fig. 2A). Of the
                                 24 classes detected, eight accounted for 99% of total reads in both polar bear subpopulations and varied in their
                                 proportional contributions among the two subpopulations (Fig. 2B). Post-hoc analysis of composition with bias
                                 correction (ANCOMBC) testing found that the abundances of two bacterial classes, Bacilli and Coriobacteria,
                                 differed significantly between EG and SB polar bears (Fig. 3, Supplementary Table S2).
                                     Of 203 total genera detected, 31 (the combined top 25 genera from each subpopulation) comprised ~ 90% of
                                 all reads for EG and SB bears and 12 were unique to EG while 51 were unique to SB. Despite observable inter-
                                 individual variation at the genuslevel for both EG and SB polar bears (Fig. 4, Table 1) post-hoc ANCOMBC
                                 analysis found that the abundances of seven of the top 31 most abundant genera still differed significantly between

Scientific Reports |   (2022) 12:522 |                  https://doi.org/10.1038/s41598-021-04340-2                                                     3

                                                                                                                                                  Vol.:(0123456789)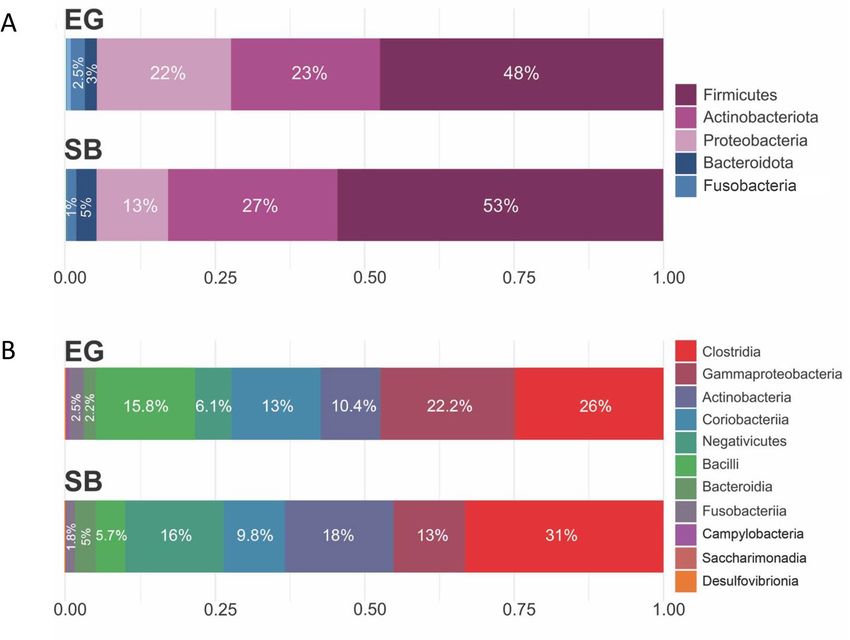
www.nature.com/scientificreports/

                                           Figure 2.  (A) Relative abundance bar plot showing the five most abundant bacterial phyla, averaged across all
                                           samples within each subpopulation (East Greenland [EG] and Southern Beaufort Sea [SB]) and (B) Relative
                                           abundance bar plot showing the eight most abundant bacterial classes, averaged across all samples within each
                                           subpopulation.

                                           Figure 3.  Boxplots of log-transformed counts for bacterial classes showing differential abundances of (A)
                                           Bacilli, significantly higher in East Greenland (EG) than Southern Beaufort Sea (SB) polar bears (Group means:
                                           EG: 13.0 ± 0.3; SB: 10.5 ± 0.3) (B) Coriobacteria, significantly higher in EG than in SB polar bears (Group
                                           means: EG: 13.1 ± 0.2; SB: 12.0 ± 0.3). Analysis of composition with bias correction (ANCOM-BC) test results
                                           summarized in Supplementary Table S2.

          Scientific Reports |   (2022) 12:522 |               https://doi.org/10.1038/s41598-021-04340-2                                                   4

Vol:.(1234567890)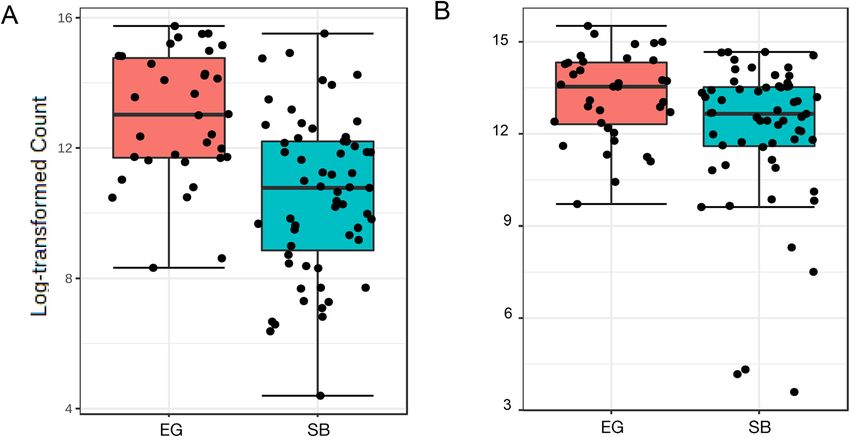
www.nature.com/scientificreports/

                                 Figure 4.  Relative abundance bar plots at genus level showing extent of interindividual variation among polar
                                 bears in the (A) East Greenland (EG) and (B) Southern Beaufort Sea (SB) subpopulations.

                                 Figure 5.  (A) Grouped bar plot showing the top 31 most abundant bacterial genera detected in East
                                 Greenland (EG) and Southern Beaufort Sea (SB) polar bear subpopulations (associated bacterial class noted
                                 in parentheses). Relative abundances were averaged across all samples within each subpopulation (EG and
                                 SB). Asterisks (*) indicate genera with significantly different abundances between the two subpopulations
                                 (see Supplementary Table S3 for statistical results obtained using analysis of composition with bias correction
                                 (ANCOM-BC) approach). (B) Venn diagram insert showing number of shared, unique, and total amplicon
                                 sequence variants (ASVs) detected in EG and SB polar bear subpopulations.

                                 EG and SB bears (Fig. 5A, Supplementary Table S3). The remaining 13 differentially abundant genera are listed
                                 in Supplementary Table S3.
                                     A total of 742 ASVs were detected in EG polar bears and 940 ASVs were found for SB polar bears (Fig. 5B).
                                 Of the 553 shared ASVs, 48 differed significantly in their abundances between subpopulations (Supplementary
                                 Table S4). Significant differences in composition at the ASV level were found between subpopulations using
                                 both Bray–Curtis distances (PERMANOVA: R2 = 0.052, F1,93 = 5.20, p < 0.001) (Fig. 6A) and the phylogenetic

Scientific Reports |   (2022) 12:522 |                https://doi.org/10.1038/s41598-021-04340-2                                                   5

                                                                                                                                            Vol.:(0123456789)
www.nature.com/scientificreports/
Figure 6. Non-metric multi-dimensional scaling (NMDS) plots showing gut bacterial communities for East
Greenland (EG) and Southern Beaufort Sea (SB) polar bear subpopulations with color denoting subpopulation
affiliation and shapes denoting Sex/Age Classes (adult females [AF], adult males [AM] and subadults [S]
compared to cubs [C]) determined using (A) Bray–Curtis (Stress = 0.26; PERMANOVA: R2 = 0.06, p = 0.001;
PERMDISP: p = 0.5) and (B) weighted UniFrac distances (Stress = 0.16; PERMANOVA: R2 = 0.06, p = 0.001;
PERMDISP: p = 0.5) calculated at amplicon sequence variant (ASV)-level. Points represent individual fecal
samples.
Weighted UniFrac Distances (PERMANOVA: R2 = 0.065, F1,93 = 6.49, p = 0.001) (Fig. 6B). These results were not
confounded by heterogeneity of subpopulation group dispersions (Bray–Curtis: PERMDISP: F1,93 = 0.75, p = 0.39;
Weighted UniFrac: PERMDISP: F1,93 = 0.61, p = 0.44).
Influence of sex/age class and body condition on gut bacterial diversity and composition in
EG and SB polar bears. Neither sex/age class, body condition, nor any interaction terms significantly
explained variation in Shannon and Inverse Simpson alpha diversity, although sex/age class was found to be a
near-significant term in the linear model explaining variation in Faith’s Phylogenetic Diversity (Supplementary
Table S1, Supplementary Fig. S2).
Significant differences in gut bacterial composition were found between polar bears of different sex/age
classes (i.e. adult females [AF], adult males [AM], subadults [S], and cubs [C]) at the class (PERMANOVA:
R2 = 0.076, F1,93 = 2.51, p = 0.004), genus (R2 = 0.079, F1,93 = 2.66, p < 0.001) and ASV-levels (Bray–Curtis distance:
R2 = 0.081, F1,93 = 2.73, p < 0.001; Weighted UniFrac distance: R2 = 0.079, F1,93 = 2.53, p = 0.002) (Table 1, Sup-
plementary Fig. S3). However, the assumption of homogeneity of multivariate group dispersions for the sex/
age class groups was not met for either the Bray–Curtis or Weighted UniFrac indices at ASV-level (PERMDISP:
p = 0.005 and p = 0.041, respectively), so results should be interpreted with some caution. Post-hoc ANCOMBC
results showed that the abundances of three bacterial classes (Bacilli, Parcubacteria, and Saccharimonadia)
(Supplementary Fig. S4), 21 bacterial genera and 65 ASVs differed significantly among the different sex/age class
groups (Supplementary Tables S5, S6 and S7). There were no significant effects of body condition or any of the
interaction terms at any taxonomic level (Table 1).
Influence of diet as a driver of gut bacterial diversity and composition in SB polar bears. For a
subset of SB polar bears (n = 46), diet data was obtained using fatty acid (FA) signature analysis. The proportions
of key dietary FAs were used in a principal components analysis (PCA) to reduce the number of variables from
the fatty acids to just two principal components, which explained 83.3% of the total variation in polar bear FA
signatures. Diet was represented in subsequent microbiome models by the individual’s scores along FA_PC1 and
FA_PC2 (Supplementary Fig. S5). PERMANOVAs and multiple linear regression models were run to assess how
diet influences gut bacterial diversity and composition, respectively. FA_PC1 was a significant term in models
explaining variation in Shannon and Inverse Simpson indices of alpha diversity for these bears and FA_PC2
was also a nearly-significant term in the model explaining differences in composition (Table 2, Supplementary
Table S8). Athough diet did not explain variation in gut bacterial composition at class-level, significant effects of
diet (FA_PC1 and FA_PC2) were found at bacterial genus-level and ASV-levels (Table 3).
Similar to the analyses including both EG and SB subpopulations, sex/age class significantly explained vari-
ation in gut bacterial diversity and composition among SB polar bears (Tables 2, 3, see Supplementary Text 1).
Additionally, body condition was found to be a nearly-significant term in the Shannon alpha diversity model
and capture year was found to be a significant term in the model for the Bray–Curtis NMDS2 axis (Table 2,
Supplementary Table S8). Capture year was also found to be a significant term in composition PERMANOVAs
Scientific Reports | (2022) 12:522 | https://doi.org/10.1038/s41598-021-04340-2 6
Vol:.(1234567890)www.nature.com/scientificreports/
Diversity index Top Model F P Mult R2 Adj. R2
Shannon ~ Sex/age class* + Body Condition + FA_PC1* + FA_PC2 2.73 0.033 0.25 0.16
Inverse Simpson ~ FA_PC1* + FA_PC2 3.51 0.039 0.14 0.10
Faiths Phylogenetic Diversity ~ Sex/age class* + FA_PC1 5.48 0.003 0.28 0.23
Bray Curtis (NMDS1) ~ Sex/age class * 5.58 0.007 0.21 0.17
Bray Curtis (NMDS2) ~ FA_PC2 . + Capture year 3.16 0.035 0.18 0.13
Weighted UniFrac (NMDS1) ~ 1 (NULL) – – – –
Weighted UniFrac (NMDS2) ~ 1 (NULL) – – – –
Table 2. Summary of top models showing influence of diet (FA_PC1 and FA_PC2 axes) and other relevant
metadata on variation in alpha diversity indices (Shannon, Inverse Simpson, Faith’s phylogenetic distance)
and beta diversity indices (Bray–Curtis and weighted UniFrac distances) for the subset of Southern Beaufort
Sea (SB) polar bears for which diet data was available. There were no significant terms in models explaining
variation using weighted UniFrac beta diversity axes.
Class-level Analysis of Variance Table
Df SumsOfSqs MeanSqs F.Model R2 Pr(> F)
Sex/age class 2 0.319 0.160 1.274 0.053 0.233
Body Condition 1 0.209 0.209 1.670 0.035 0.142
FA_PC1 1 0.126 0.126 1.005 0.021 0.411
FA_PC2 1 0.262 0.262 2.092 0.043 0.085
Capture year 1 0.261 0.261 2.080 0.043 0.074
Residuals 39 4.886 0.125 0.806
Total 45 6.063 1
Genus-level Analysis of Variance Table
Df SumsOfSqs MeanSqs F.Model R2 Pr(> F)
Sex/age class 2 0.810 0.405 1.776 0.071 0.023
Body Condition 1 0.209 0.208 0.914 0.018 0.527
FA_PC1 1 0.504 0.504 2.208 0.044 0.024
FA_PC2 1 0.439 0.439 1.925 0.039 0.034
Capture year 1 0.483 0.483 2.118 0.043 0.019
Residuals 39 8.895 0.228 0.784
Total 45 11.339 1
ASV-level Analysis of Variance Table
Df SumsOfSqs MeanSqs F.Model R2 Pr(> F)
Sex/age class 2 0.719 0.359 1.568 0.063 0.057
Body Condition 1 0.205 0.205 0.894 0.018 0.519
FA_PC1 1 0.557 0.557 2.431 0.049 0.009
FA_PC2 1 0.442 0.442 1.927 0.039 0.023
Capture year 1 0.485 0.485 2.116 0.043 0.024
Residuals 39 8.937 0.229 0.788
Total 45 11.344 1
Table 3. Summary of permutational analysis of variance (PERMANOVA) results* assessing differences in gut
bacterial composition at bacterial class, genus, and amplicon sequence variant (ASV)-levels for the subset of
Southern Beaufort Sea (SB) polar bears using Bray–Curtis distances. *Significant terms are in bold.
using Bray–Curtis distance method (Table 3). There were no significant terms in models explaining variation in
the Weighted UniFrac NMDS axes (Table 2, Supplementary Table S8).
Discussion
Polar bears from the SB subpopulation showed significant differences in gut bacterial composition at multiple
bacterial taxonomic levels compared to EG polar bears and an overall greater number of unique and total bacte-
rial genera and ASVs. The particular bacterial classes and genera which were elevated in one subpopulation versus
the other were consistent with a potentially altered and more varied gut microbiota in the more land-associated
SB subpopulation relative to the more sea ice-based EG subpopulation. Relative to SB polar bears, those in the EG
subpopulation had higher levels of bacteria from the class Bacilli, which has been suggested to play an important
role in restoring gut health and maintaining gut homeostasis31 and from the class Coriobacteria which is a typical
Scientific Reports | (2022) 12:522 | https://doi.org/10.1038/s41598-021-04340-2 7
Vol.:(0123456789)www.nature.com/scientificreports/
taxonomic group found in the human gut and known to play a role in gut microbiome h ealth32. Although many
of the most abundant bacterial genera were shared between the two subpopulations, some genera were signifi-
cantly higher in EG bears compared to SB bears. Specifically, Collinsella, Lactobacillus, Erysipelatoclostridium,
and Escherichia-Shigella were higher in EG, and some of these genera have important probiotic properties, at
least based on human studies33–36. Bacteria from class Coriobacteria (e.g. Collinsella) have been suggested to aid
with lipid metabolism in human studies37 and with cholesterol metabolism in controlled studies on hamsters38.
These differences could imply that EG bears have a healthier ‘baseline’ gut microbiome compared to SB bears, a
reflection of their likely narrower dietary niche breadth and continued access to traditional lipid-rich prey spe-
cies, however this is difficult to conclude given the lack of studies on functional roles of these bacteria in wildlife5.
Alternatively, the differential bacterial classes and genera between SB and EG bears could simply reflect local
regional adaptations based on differences in food availability and other geographic and ecosystem variables such
as exposure to sea ice vs. terrestrial habitat, exposure to different macro- and micro- fauna, etc.
Some bacterial classes and genera were elevated in SB polar bears compared to EG polar bears. Two genera
Megasphaera and Megamonas, which contributed to ~ 15% of class Negativicutes reads within the SB subpopu-
lation, were elevated in SB compared to EG polar bears (Megasphaera was significantly elevated) and may be
important components of rumen microbiomes. Further, some Negativicutes species have metabolic properties
related to the breakdown of polysaccharides and lactate into short chain fatty acids (SCFAs) which have been sug-
gested to promote gut health39–42. This observation of elevated Negativicutes could potentially indicate increases
in carbohydrates or starches in SB diets related to inputs from terrestrial foods, such as berries, which polar bears
have been observed to eat while onshore43,44. Bacteroidia were also elevated in SB relative to EG polar bears. Two
genera of Bacteroidia comprised ~ 4% of reads for SB bears (compared to ~ 1.6% in EG bears): Bacteroidetes and
Porphyromonas. Bacteroidetes have been described in human microbiome studies as having complex metabolic
roles covering plant and polysaccharide degradation, protein metabolism, or just as a component of healthy adult
gut microbiota45. Changes in abundance (i.e., increases or decreases) of Bacteroidetes have also been associated
with several GI tract diseases, such as obesity and irritable bowel syndrome in h umans46–49. Porphyromonas
species are asaccharolytic and are often associated with the oral microbiome and can occasionally become
pathogenic50–52. Finally, a few genera that were significantly higher in SB compared to EG bears, (e.g., Megas-
phaera, Anaerococcus) are typically part of the commensal microbiota. However, Anaerococcus has been linked to
polymicrobial infections and can become pathogenic in humans or human-associated microbiomes53–56. While
some of these bacterial genera that are more abundant in SB bears compared to EG bears have been previously
linked to adverse health effects in human and controlled studies, they could also simply reflect a more varied
and diverse diet for SB polar bears which would necessitate a shift in metabolic function of the gut microbiome.
In general, the characteristics and functions of specific bacteria can vary depending on host species. As such,
these bacteria might serve different functional roles in the polar bear gut microbiome compared to what has
been shown in studies on the gut microbiomes of humans and other mammalian species. Further, higher or
lower gut bacterial diversity and the presence or introduction of novel bacterial species could ultimately lead to
the development of an adaptive gut microbiome, particularly when considering potential shifts toward protein
and carbohydrate metabolism type functions of the bacterial species that are increased in the SB subpopulation.
Alternatively, it could lead to gut dysbiosis and negative health consequences for an individual, population, or
species57. While it is difficult to predict any long-term consequences that could result from these observed dif-
ferences in bacterial composition and diversity between the SB and EG subpopulations, it will be important to
continue to monitor such changes and investigate their health consequences.
Additional factors could be contributing to these compositional differences between subpopulations, such as
host phylogeny, immune system effects, and environmental differences (biogeography, variety of cohabitating
species present in the region, etc.)1,4,58–60. Although our dataset did not contain a sufficient number of capture
years for both subpopulations to evaluate climate and ecological variation that could influence temporal trends
in the gut microbiota, future work with additional years of collection data should assess this relationship. None-
theless, differences in diet are likely important in explaining much of the differences in the gut microbiome
between EG and SB bears, given the importance of diet in driving gut microbiome composition and separate
studies pointing to dietary differences between these s ubpopulations2,8–10,17. In response to climate change, SB
bears show increased use of terrestrial habitat and terrestrially-based food resources in the late summer and fall
months61–63. Reduced access to ice seal prey has been tied to declines in the SB polar bear p opulation64 and other
studies speculate that alternative food resources will likely be nutritionally insufficient for polar b ears26,63 which
could have serious implications for long-term persistence of the species. Any changes in the gut microbiome
could potentially impact immune functioning or impair nutrient uptake for polar bears in this region, further
exacerbating these existing stressors faced by the SB subpopulation in a period of continued sea ice decline and
habitat loss. Consumption of non-traditional prey species and tissue types also likely exposes them to novel
pathogens (Watson et al., submitted) and gut microbiota, either via contact with other scavenging species or
through changes in macronutrients of their p rey63,65.
This hypothesis is supported by findings of higher gut bacterial diversity in onshore versus offshore polar bears
in the SB subpopulation29. Although we did not have seasonal metadata distinguishing onshore vs. offshore SB
bears as all fecal samples were collected in the spring before sea ice breakup, these differences in inter-individual
foraging behavior likely contribute to increased rare/unique ASVs detected and overall larger variance in beta
diversity within the SB subpopulation compared to the EG subpopulation. FA signatures from adipose samples
collected in winter-spring of 1984–2011 suggests that EG polar bears mainly consume ice seals, and probably
largely in the form of seal blubber. This is despite the proportion of Arctic seals such as ringed seals (Pusa hispida)
declining, while the proportion of northward range-shifting sub-Arctic seals such as harp seals (Phoca groen-
landica) and hooded seals (Crystophora cristata), increased30. Thus, while there is evidence that EG polar bears
show decreased consumption of traditional ringed seal prey, the overall change in macronutrient composition
Scientific Reports | (2022) 12:522 | https://doi.org/10.1038/s41598-021-04340-2 8
Vol:.(1234567890)www.nature.com/scientificreports/
between these prey types may be low (i.e., still predominantly blubber lipids) and could partially explain the
detection of fewer bacterial genera and ASVs in EG compared to SB polar bears.
Further support for our hypothesis that diet is a driver of intra-species differences in the polar bear gut
microbiome comes from the results that focused on the SB polar bears, for which we determined dietary pat-
terns using FA signatures. For these polar bears, the FA-PC scores explained the largest amount of the variance
in gut bacteria alpha diversity of all explanatory variables considered. These FA-PC scores also explained large
amounts of variation in gut bacterial composition at most bacterial taxonomic levels, particularly at the ASV-
level. Other studies on wildlife have identified diet as an important long and short term driver of gut bacterial
composition and diversity8,9, however the stable isotope diet analysis methods employed in previous wildlife
work may not offer the resolution of dietary information relative to F As66. Thus, our use of FA signatures to pro-
vide insight into variation in gut microbiome composition and diversity within and among wildlife populations
shows considerable promise and suggest that future gut microbiome research could benefit from this approach.
For example, quantitative fatty acid signature analysis (QFASA) and molecular-based diet analysis methods can
provide species-level information on the diets of wild, free-ranging species which could enhance our understand-
ing of how consumption of particular prey types influence the gut m icrobiome67–69.
In both humans and animals, sex/age class has been shown to impact gut bacterial composition and
diversity15,18,70,71. Although the assumption of homogeneity of multivariate group dispersions for sex/age class
groups was not met and we advise some caution in the interpretation of significant between-group differences,
it is also possible that these differences in group dispersions could be related to important life history differences
among polar bear sex/age classes. We found that bacteria from the class Negativicutes were higher in adult males
compared to adult females, subadults, and cubs, while Saccharimonadia and Bacilli were higher in adult females
and cubs compared to adult males and subadults. In addition to the probable health benefits of Bacilli discussed
earlier, Bacilli may also be higher in females and cubs due to more Lactobacillus in the vaginal microbiome and
in relation to milk production and lactation58, and other studies have detected higher levels of Lactobacillus in
females compared to males as well72. Some human and mouse model studies have also demonstrated strong
interactions between sex-specific hormones and commensal gut bacteria, which could also be driving a portion
of the sex/age class differences observed h ere73–75. In addition, considering the varied foraging behavior among
polar bear sex/age classes, these compositional differences likely have underlying associations with dietary dif-
ferences just as for subpopulation and the two factors may also interact21,76. For example, adult male polar bears
are much larger in body size and can more easily take down larger prey (bearded seal, beluga whale, etc.) when
they are available, while adult females and subadults likely preferentially forage on smaller-bodied prey, such as
ringed seal30,77. Additionally, for the SB subpopulation in particular, it has also been shown that adult male polar
bears use bowhead whale ‘bone piles’ more frequently than other sex/age classes78, and consume higher amounts
of bowhead whales compared to adult f emales61. Cubs of the year generally have a different diet entirely, as they
rely on high-fat milk from their mothers. Further, we found lower Faith’s phylogenetic diversity in subadults
compared to adult females which could be due to gut microbiomes of younger individuals being underdeveloped
relative to adult microbiomes15. In general, diversity differences among sex/age classes likely reflect gut bacterial
compositional differences that are tied to life history, physiological and diet differences among the sex/age classes.
We found no effect of body condition on variation in gut bacterial composition and diversity for SB and
EG polar bears. It is possible that by choosing body mass as our indicator of body condition our results are
confounded by other factors known to influence body mass of polar bears, such as sex and age class. However,
to account for this, interaction terms were included in all models testing for associations between body condi-
tion and gut microbiota but none were found to be significant. While body condition has been identified as an
important factor in some gut microbiome studies and potentially linked to d iet79, other studies have similarly
found minimal or no importance of BMI on gut microbiome composition and diversity80,81. Other biological
and environmental factors could also contribute to differences in gut bacterial composition and diversity for EG
and SB polar bears, including region-specific differences in contaminants, parasite types or loads, and differing
interspecific interactions29,65,82–84. We were not able to account for these in our study, but such associations may
be relevant to study in future work.
We found observable inter-individual variation within each subpopulation, which likely contributed to most
(~ 85–90%) of the remaining unexplained variation in gut bacterial composition between the two subpopulations.
However, it is important to note that other potential unmeasured biological factors and general stochasticity
of the gut microbiome could also contribute to this unexplained v ariation9,85. Despite a greater number of total
and unique ASVs within the SB relative to EG subpopulation, the lack of significant subpopulation differences
in any of the alpha diversity indices measured could also reflect that high inter-individual variation is typical.
Other studies have also noted a lack of intra-species or inter-population differences in alpha diversity, while still
detecting significant compositional differences between g roups12,60. Host phylogeny is another strong driver of
gut bacterial composition and diversity and might, in part, explain the large overlap in bacterial species detected
among EG and SB polar bears, the low separation between subpopulations along beta diversity NMDS axes,
and the large amount of unexplained variation in gut bacterial composition and diversity1,2 as it has been sug-
gested that gut microbiota are vertically transmitted and coevolve with their host s pecies86. Additional metrics
we were unable to account for in our study but that could be useful to include in future studies include cortisol
levels as an indicator of stress-levels87,88, female reproductive status89, immune status of individuals by measuring
cytokines90,91, assessment of individual contaminant loads92–94, etc. Many studies on the gut microbiome have
also found high proportions of unexplained variation which can reflect the convoluted nature of microbiome
data2,85. Given this typically is the case, and the fact that high inter-individual variation can sometimes mask
generalized group differences, we can conclude there are relatively strong compositional differences in the gut
bacteria for EG and SB polar bears.
Scientific Reports | (2022) 12:522 | https://doi.org/10.1038/s41598-021-04340-2 9
Vol.:(0123456789)www.nature.com/scientificreports/
Overall, this study showed differences in gut composition and diversity between two geographically distant
polar bear subpopulations facing distinct sea ice conditions and prey availability. The SB subpopulation showed
more rare and unique ASVs and bacterial genera present compared to the EG subpopulation and indications of
greater inter-individual diversity. These findings likely, in part, reflect the use of onshore foods for some members
of the population during the reduced ice s eason62,95. This interpretation is supported by the SB subset results
indicating diet and intraspecific variation among polar bear sex/age classes are likely linked, and are key drivers
of alpha diversity and gut bacterial composition within the subpopulation, This study highlights the importance
of considering both inter-population and inter-individual variation in gut bacterial composition, given the direct
links between gut microbiota and host physiology, nutrition, and overall health96,97. Nonetheless, because there
are many variables that influence the gut bacterial community, it can be challenging to assess the influence of
each in isolation, or to make direct conclusions when certain factors are unavailable for assessment. Polar bears
are facing a myriad of anthropogenic stressors posing threats to their continued survival as a species. Moving
forward, assessing the impacts of such stressors on the gut microbiome will likely be an important aspect of
monitoring polar bear health.
Materials and methods
Collection of polar bear fecal and adipose tissue. Fecal samples were collected from 34 EG polar
bears in March–April of 2017 and from 59 SB polar bears in March–April of 2015, 2016, 2018, and 2019 (Fig. 1).
Polar bears were immobilized from a helicopter and tissue samples were collected as part of long-term popula-
tion assessments in each region. Biometric measurements were recorded, including sex and body mass. Ages
were quantitatively estimated via growth layer groups from a vestigial premolar tooth sampled on first capture98.
Fecal samples were collected from the rectum of polar bears using sterile latex gloves placed in sterile whirlpak
bags. Due to limitations imposed by the COVID-19 pandemic, only adipose tissue samples from SB polar bears
could be shipped and analyzed for fatty acid-based assessment of diet. Adipose tissue biopsies were collected
from 46 SB polar bears, representing a subset of the same SB individuals for which fecal samples were taken.
Fecal and adipose samples were kept at -20 °C during the field season and then shipped on dry ice to McGill
and stored at -80 °C prior to laboratory analysis. Samples were collected from SB polar bears as part of the U.S.
Geological Survey (USGS) Polar Bear Research Program (U.S. Fish and Wildlife Service Permit# MA690038 to
T.C.A) under capture protocols approved by the USGS Institutional Animal Care and Use Committee. Samples
were collected from EG polar bears under case nr. 2017-5446, document 4710596 from the Department of Fish-
eries and Hunting, as part of a long-term monitoring program by the Greenland Institute of Natural Resources.
Fecal DNA extraction. Fecal samples were extracted in random order at McGill University according to
the same procedures previously described for samples from 2009 to 2013 from the SB polar bear s ubpopulation29.
Briefly, feces from the glove were swabbed with a sterile cotton-tipped applicator. Tips were transferred to a tube
of 1 mL phosphate-buffered saline (PBS), vortexed, and spun down after removing the cotton tip to obtain a pel-
let. After adding a stainless-steel bead (Qiagen; Hilden, Germany) and lysis buffer (see Watson et al.29), samples
were homogenized at 37 °C in a shaking water bath. The extraction protocol then continued at step 2 of the
QIAamp Mini Kit Buccal Swab Spin Protocol (QIAamp DNA Mini and Blood Mini Handbook). Samples were
spun down in a final volume of 100 μL elution buffer (Buffer AE) and 30 μL of each extract was aliquoted among
two 96-well plates to facilitate downstream PCR reaction setup. For each batch of extractions, a separate sterile
swab control was run alongside samples as a blank and stored with corresponding samples on the same 96-well
plate. All DNA extracts were stored at −20 °C until further analysis.
16S rRNA gene amplification and sequencing. Gene amplification was performed as per previous
analyses on SB polar bears29 with minor modifications. In brief, a ~ 460 base pair (bp) region of the 16S rRNA
gene was amplified using the universal bacterial primer set 341F (5′-CCTACGG GNGGCWGCAG-3′) and
805Rmod (5’-GACTACNVGGGTWTCTAATCC-3’) with overhanging Illumina adaptors. PCR reaction wells
contained 6.5 μL of Rnase free H2O, 0.5 μL of 20 mg mL−1 BSA (bovine serum albumin), 1.5 μL of 10 μg μL−1 of
both 341F and 805Rmod primers, 12.5 μL of 2X Kapa Hifi Hot Start Ready Mix (Roche Diagnostics), and 2.5 μL
template DNA with PCR cycling conditions as described29. Amplified DNA was purified using AMPure beads
(0.8 bead to sample ratio; Beckman Coulter, Brea, CA, USA) according to the manufacturer’s instructions. Illu-
mina® Nextera XT indices and sequencing adaptors (Illumina®, San Diego, CA) were annealed to PCR product
in a subsequent 8-cycle PCR run as specified in the Illumina® 16S Library Preparation guide and purified again
using AMPure beads (1.12 bead to sample ratio). Final indexed samples and negative controls were quantified
using a Qubit fluorometer (Invitrogen, Thermo Fisher Scientific, USA) and pooled at 4 nM to create the final
library, which was then characterized and validated using the Agilent 2100 Bioanalyzer (Agilent Technologies)
confirming uniform amplicon size (~ 600 bp) before sequencing on a 2 × 250 bp paired-end run with v2 chemis-
try on an Illumina® MiSeq platform at McGill University.
Fatty acid analysis. The 46 SB adipose tissue biopsies were processed for FA signatures to provide insight
into feeding patterns according to methods previously used for SB polar bears from 2004 to 2 01661,69. In short,
lipids were extracted and then FAs were converted to fatty acid methyl esters (FAMEs) using the Hilditch rea-
gent. FAMEs within each sample were then separated and analyzed on an Agilent (Santa Clara, CA, USA) 8860
gas chromatograph with flame ionization detector and quantified using OpenLab CDS Data Analysis software
(V. 2.5; Agilent, Santa Clara, CA, USA) as mass percent of total FAME. FAs were abbreviated according to their
carbon chain length (A), number of double bonds (B), and position of the first double bond counting from the
methyl end of the carbon chain (X) as A:BnX.
Scientific Reports | (2022) 12:522 | https://doi.org/10.1038/s41598-021-04340-2 10
Vol:.(1234567890)www.nature.com/scientificreports/
FA signatures as dietary indicators. A principal components analysis (PCA) was conducted using
selected FAs to reduce dimensionality of the diet data, and the significant PC axes were then used as explanatory
variables in PERMANOVA and multiple linear regression models explaining variation in gut bacterial compo-
sition and diversity. Of the 70 marine-associated FAs that were detected and quantified, 30 FAs thought to be
present in polar bear adipose tissue predominately due to dietary uptake and used in previous polar bear diet
studies were initially s elected21,99. We did not include 20:1n11, as it has recently been suggested that this FA may
not be informative in delineating polar bear feeding p atterns100. We further only included the major dietary FAs,
or those comprising on average > 1% of total FAME, to reduce the possible influence on FA proportions related
to instrumental analytical variation101. The final set of nine FAs allowed us to meet the recommended 5:1 sample
to variable ratio for conducting PCA a nalysis102. Prior to PCA analysis, the FA proportions were log-ratio trans-
formed as recommended to normalize the multivariate data102,103.
Microbial data analyses. Unless stated otherwise, all analyses were performed using R 4.0.3104. Sequenc-
ing data was filtered, trimmed, de-replicated, and paired ends were merged using DADA2105. The inferred ampli-
con sequence variants (ASVs) were taxonomically assigned using the SILVA reference database (version 132) as
described in the DADA2 tutorial. D econtam106 was used to identify and filter out any contaminant ASVs, (i.e.,
those detected in both sample PCR negative controls and in extraction kit blanks). MicrobiomeAnalystR107 was
then used to remove ASVs with less than 2 counts and zero variance and the resulting phyloseq object output
was extracted and integrated into subsequent p hyloseq108 and MicrobiomeAnalystR w orkflows107,108. All samples
produced > 10,000 reads and so none were eliminated. As recommended, data rarefaction was not performed109.
MicrobiomeAnalyst was used to visually compare gut microbial composition between EG and SB polar bears
at varying bacterial taxonomic levels. Shannon, Inverse Simpson, and Faith’s phylogenetic alpha diversity indices
were calculated separately for EG and SB polar bears at ASV-level and subsequently using MicrobiomeAnalyst
Web version (as per Watson et al.29). To provide insight into the biological and ecological variables responsible
for differences in bacterial community composition (at bacterial phylum, class, genus, and ASV-level) within
and among the EG and SB polar bears, permutational multivariate analysis of variance (PERMANOVA) tests
were performed using the ‘adonis’ function in the vegan package in R110. The Bray–Curtis distance method
was used for all bacterial taxonomic levels to assess compositional patterns at multiple levels, and Weighted
UniFrac distance was used at just the ASV-level to incorporate the influence of bacterial phylogeny in our com-
munity composition comparisons. Homogeneity of group dispersions (PERMDISP111) for compared groups was
checked prior to interpretation of PERMANOVA results. Subsequent analysis of composition with bias correction
(ANCOMBC112) tests were done to compare differential abundances of specific bacterial classes, genera, and
ASVs contributing to compositional differences.
Both multiple linear regression models and PERMANOVAs were used to test for other ecological effects on
alpha diversity indices as well as compositional differences (i.e., beta diversity differences). For both the PER-
MANOVAs and the linear models (LMs), the additional explanatory variables included subpopulation, sex/age
class, body mass (as an indicator of body condition;113), and all biologically-relevant first-order interactions. The
sex/age classes used were adult female (AF, n = 36), adult male (AM, n = 32), subadult (S, n = 15), and cub (C,
n = 10). Year of capture was not included as an explanatory variable as EG bears were only captured in a single
year and years did not overlap for the two subpopulations. When categorical explanatory variables were found
to be significant in the PERMANOVAs or LMs, post-hoc univariate tests (ANOVAs) and ANCOMBC tests were
performed to determine which means and bacterial classes, genera, and ASVs significantly differed between
groups (e.g., sex/age classes).
Given that we only had FA signatures for SB polar bears, separate PERMANOVAs using the Bray–Curtis
distance method (and post-hoc univariate tests, as appropriate) were also run to examine associations of bacterial
composition with diet, using the significant PCs from the FA analysis (as described above), while also including
sex/age class, body mass, and capture year (2016, 2017, and 2018). The sex/age classes used were adult female
(AF, n = 16), adult male (AM, n = 24), and subadult (S, n = 6). Cubs are not included as adipose biopsies were
not collected from this age class. Multiple linear regression models were run to test for ecological and dietary
effects on gut bacterial alpha and beta diversity (represented by Bray–Curtis and Weighted UniFrac NMDS axes)
indices for SB polar bears. Top models were selected using backwards model selection and Akaike information
criterion (AIC) scores adjusted for smaller sample sizes114. The backwards model selection process was conducted
via step-wise dropping of terms in the model and AIC calculation. If dropping a term decreased the AIC it was
removed and this process repeated until removal of variables did not result in lowering of the AIC score of the
overall model.
Data availability
The 16S sequencing data have been deposited in the NCBI Short Read Archive under project number
PRJNA773176. The fatty acid data are available as a Supporting Information file.
Received: 29 July 2021; Accepted: 13 December 2021
References
1. Ley, R. E. et al. Evolution of mammals and their gut microbes. Science 320, 1647–1651. https://doi.org/10.1126/science.11557
25 (2008).
2. Hale, V. L. et al. Diet versus phylogeny: a comparison of gut microbiota in captive colobine monkey species. Microb. Ecol. 75,
515–527. https://doi.org/10.1007/s00248-017-1041-8 (2018).
Scientific Reports | (2022) 12:522 | https://doi.org/10.1038/s41598-021-04340-2 11
Vol.:(0123456789)www.nature.com/scientificreports/
3. Pickard, J. M., Zeng, M. Y., Caruso, R. & Núñez, G. Gut microbiota: role in pathogen colonization, immune responses, and
inflammatory disease. Immunol. Rev. 279, 70–89 (2017).
4. Ley, R. E., Peterson, D. A. & Gordon, J. I. Ecological and evolutionary forces shaping microbial diversity in the human intestine.
Cell 124, 837–848 (2006).
5. Pascoe, E. L., Hauffe, H. C., Marchesi, J. R. & Perkins, S. E. Network analysis of gut microbiota literature: an overview of the
research landscape in non-human animal studies. ISME J. 11, 2644–2651. https://doi.org/10.1038/ismej.2017.133 (2017).
6. Hauffe, H. C. & Barelli, C. Conserve the germs: the gut microbiota and adaptive potential. Conserv. Genet. 20, 19–27. https://
doi.org/10.1007/s10592-019-01150-y (2019).
7. Ellegaard, K. M. & Engel, P. Beyond 16S rRNA Community profiling: intra-species diversity in the gut microbiota. Front. Micro-
biol. 7, doi:https://doi.org/10.3389/fmicb.2016.01475 (2016).
8. Sugden, S., Sanderson, D., Ford, K., Stein, L. Y. & St. Clair, C. C. An altered microbiome in urban coyotes mediates relationships
between anthropogenic diet and poor health. Sci. Rep. 10, 22207, doi:https://doi.org/10.1038/s41598-020-78891-1 (2020).
9. Góngora, E., Elliott, K. H. & Whyte, L. Gut microbiome is affected by inter-sexual and inter-seasonal variation in diet for thick-
billed murres (Uria lomvia). Sci. Rep. 11, 1200. https://doi.org/10.1038/s41598-020-80557-x (2021).
10. Muegge, B. D. et al. Diet drives convergence in gut microbiome functions across mammalian phylogeny and within humans.
Science 332, 970. https://doi.org/10.1126/science.1198719 (2011).
11. Bik, E. M. et al. Marine mammals harbor unique microbiotas shaped by and yet distinct from the sea. Nature Commun 7, 10516
(2016).
12. McKenzie, V. J. et al. The effects of captivity on the mammalian gut microbiome. Integr. Comp. Biol. 57, 690–704 (2017).
13. Des Roches, S. et al. The ecological importance of intraspecific variation. Nat. Ecol. Evol. 2, 57–64, doi:https://doi.org/10.1038/
s41559-017-0402-5 (2018).
14. Des Roches, S., Pendleton, L. H., Shapiro, B. & Palkovacs, E. P. Conserving intraspecific variation for nature’s contributions to
people. Nat. Ecol. Evol. 5, 574–582, doi:https://doi.org/10.1038/s41559-021-01403-5 (2021).
15. Wasimuddin, et al. Gut microbiomes of free-ranging and captive Namibian cheetahs: diversity, putative functions and occur-
rence of potential pathogens. Mol. Ecol. 26, 5515–5527. https://doi.org/10.1111/mec.14278 (2017).
16. Alfano, N. et al. Variation in koala microbiomes within and between individuals: effect of body region and captivity status. Sci.
Rep. 5, 10189. https://doi.org/10.1038/srep10189 (2015).
17. Schwab, C., Cristescu, B., Northrup, J. M., Stenhouse, G. B. & Gänzle, M. Diet and environment shape fecal bacterial microbiota
composition and enteric pathogen load of grizzly bears. Plos One 6, e27905 (2011).
18. Sommer, F. et al. The gut microbiota modulates energy metabolism in the hibernating brown bear Ursus arctos. Cell Rep 14,
1655–1661 (2016).
19. Durner, G., Laidre, K. & York, G. Polar Bears: Proceedings of the 18th Working Meeting of the IUCN/SSC Polar Bear Specialist
Group, 7–11 June 2016, Anchorage, Alaska. Gland, Switzerland and Cambridge, UK: IUCN. xxx+ 207pp (2018).
20. Amstrup, S. C., Marcot, B. G. & Douglas, D. C. in Arctic sea ice decline: Observations, projections, mechanisms, and implications
Geophysics monograph series (eds E.T. DeWeaver, C.M. Bitz, & L.-B. Tremblay) 213–268 (AGU, 2008).
21. Thiemann, G. W., Iverson, S. J. & Stirling, I. Polar bear diets and arctic marine food webs: Insights from fatty acid analysis. Ecol.
Monogr 78, 591–613 (2008).
22. McKinney, M. A. et al. Regional contamination versus regional dietary differences: Understanding geographic variation in
brominated and chlorinated contaminant levels in polar bears. Environ. Sci. Technol. 45, 896–902 (2011).
23. Laidre, K. L. et al. Arctic marine mammal population status, sea ice habitat loss, and conservation recommendations for the
21st century. Conserv. Biol. 29, 724–737 (2015).
24. Stern, H. L. & Laidre, K. L. Sea-ice indicators of polar bear habitat. Cryosphere 10, 2027–2041. https://doi.org/10.5194/tc-10-
2027-2016 (2016).
25. Atwood, T. C. et al. Rapid environmental change drives increased land use by an Arctic marine predator. PLoS ONE 11, e0155932
(2016).
26. Rode, K. D., Robbins, C. T., Nelson, L. & Amstrup, S. C. Can polar bears use terrestrial foods to offset lost ice-based hunting
opportunities?. Front. Ecol. Environ. 13, 138–145 (2015).
27. Herreman, J. K. & Peacock, E. Polar bear use of a persistent food subsidy: insights from non-invasive genetic sampling in Alaska.
Ursus 24, 148–163 (2013).
28. Glad, T. et al. Bacterial diversity in faeces from polar bear (Ursus maritimus) in Arctic Svalbard. BMC Microbiol. 10, doi:https://
doi.org/10.1186/1471-2180-10-10 (2010).
29. Watson, S. E. et al. Global change-driven use of onshore habitat impacts polar bear faecal microbiota. ISME J. https://doi.org/
10.1038/s41396-019-0480-2 (2019).
30. McKinney, M. A. et al. Global change effects on the long-term feeding ecology and contaminant exposures of East Greenland
polar bears. Glob. Change Biol. 19, 2360–2372. https://doi.org/10.1111/gcb.12241 (2013).
31. Ilinskaya, O. N., Ulyanova, V. V., Yarullina, D. R. & Gataullin, I. G. Secretome of Intestinal Bacilli: A Natural Guard against
Pathologies. Front. Microbiol. 8, doi:https://doi.org/10.3389/fmicb.2017.01666 (2017).
32. Cho, G.-S. et al. Quantification of Slackia and Eggerthella spp. in Human Feces and Adhesion of Representatives Strains to
Caco-2 Cells. Front. Microbiol. 7, doi:https://doi.org/10.3389/fmicb.2016.00658 (2016).
33. Astbury, S. et al. Lower gut microbiome diversity and higher abundance of proinflammatory genus Collinsella are associated
with biopsy-proven nonalcoholic steatohepatitis. Gut Microbes 11, 569–580. https://doi.org/10.1080/19490976.2019.1681861
(2020).
34. Gomez-Arango, L. F. et al. Low dietary fiber intake increases Collinsella abundance in the gut microbiota of overweight and
obese pregnant women. Gut Microbes 9, 189–201 (2018).
35. Jeong, Y. et al. Gut microbial composition and function are altered in patients with early rheumatoid arthritis. J. Clin. Med. 8,
693 (2019).
36. Liu, X. et al. Blautia-a new functional genus with potential probiotic properties?. Gut microbes 13, 1–21. https://d oi.o
rg/1 0.1 080/
19490976.2021.1875796 (2021).
37. Claus, S. P. et al. Colonization-induced host-gut microbial metabolic interaction. MBio 2, e00271-e210 (2011).
38. Martínez, I. et al. Diet-induced metabolic improvements in a hamster model of hypercholesterolemia are strongly linked to
alterations of the gut microbiota. Appl. Environ. Microbiol. 75, 4175–4184 (2009).
39. Sergeant, M. J. et al. Extensive microbial and functional diversity within the chicken cecal microbiome. PLoS One 9, e91941
(2014).
40. Zhang, X. et al. Human gut microbiota changes reveal the progression of glucose intolerance. PLoS One 8, e71108 (2013).
41. Shetty, S. A., Marathe, N. P., Lanjekar, V., Ranade, D. & Shouche, Y. S. Comparative genome analysis of Megasphaera sp. reveals
niche specialization and its potential role in the human gut. PLoS One 8, e79353 (2013).
42. Jiang, X.-L., Su, Y. & Zhu, W.-Y. Fermentation characteristics of Megasphaera elsdenii J6 derived from pig feces on different
lactate isomers. J. Integr. Agric. 15, 1575–1583. https://doi.org/10.1016/S2095-3119(15)61236-9 (2016).
43. Hobson, K. A. & Stirling, I. Low variation in blood delta C-13 among Hudson Bay polar bears: implications for metabolism and
tracing terrestrial foraging. Mar. Mammal Sci 13, 359–367 (1997).
Scientific Reports | (2022) 12:522 | https://doi.org/10.1038/s41598-021-04340-2 12
Vol:.(1234567890)You can also read


