Effects of Composition Type and Activator on Fly Ash-Based Alkali Activated Materials
←
→
Page content transcription
If your browser does not render page correctly, please read the page content below
polymers
Article
Effects of Composition Type and Activator on Fly Ash-Based
Alkali Activated Materials
Chan-Yi Lin and Tai-An Chen *
                                          Department of Harbor and River Engineering, National Taiwan Ocean University, Keelung City 202301, Taiwan;
                                          james980227@gmail.com
                                          * Correspondence: tachen@mail.ntou.edu.tw; Tel.: +886-2-2462-2192

                                          Abstract: The compressive strengths of fly ash-based alkali-activated materials (AAM), produced
                                          using various activators of only sodium hydroxide, were measured. Fly ash-based AAM specimens,
                                          produced by mixing different kinds of fly ash and ground granulated blast-furnace slag (GGBFs)
                                          with an activator containing only sodium hydroxide, were cured at ambient temperature, and then
                                          placed in air for different numbers of days. The short- and long-term compressive strengths and
                                          shrinkage of fly ash-based AAM were measured and compared to one another. The effects of type of
                                          fly ash, alkali-equivalent content, GGBFs replace percentage, and ages on the compressive strengths
                                          and shrinkage of fly ash-based AAM were investigated. Even when different fly ash was used as the
                                          raw material for AAM, a similar compressive strength can be achieved by alkali-equivalent content,
                                          GGBFs replaces percentage. However, the performance of shrinkage due to different types of fly ash
                                          differed significantly.

                                          Keywords: alkali-activated materials; fly ash; GGBFs; alkali-equivalent content; amorphous;
                                          compressive strength; shrinkage


Citation: Lin, C.-Y.; Chen, T.-A.
Effects of Composition Type and
                                          1. Introduction
Activator on Fly Ash-Based Alkali               The latest UN figures suggest that despite current government commitments to reduce
Activated Materials. Polymers 2022,       greenhouse gas emissions, atmospheric concentrations continue to rise, keeping the earth
14, 63. https://doi.org/10.3390/          on a trajectory to levels of warming that will precipitate further environmental, social, and
polym14010063                             economic disruption and suffering on unprecedented scales [1]. Global GHG emissions
Academic Editors: Wei-Hao Lee,
                                          increased by 1.5-fold since 1990. With several greenhouse gases in the atmosphere, includ-
Yung-Ching Ding and Kae-Long Lin          ing methane, nitrous oxide, and ozone-depleting substances, and greatly reducing CO2 is
                                          the most straightforward method to solve the continuous rise of air temperature [2]. As
Received: 20 November 2021                a major emitter of CO2 in the United States, the top three industries of CO2 emission are
Accepted: 22 December 2021
                                          transportation, electricity, and manufacturing and building industry, which contribute 35%,
Published: 24 December 2021
                                          31%, and 16% of CO2 emissions, respectively, meaning the three industries account for
Publisher’s Note: MDPI stays neutral      more than 80% of total CO2 emissions [3].
with regard to jurisdictional claims in         Concrete is an extensively used construction material, and Portland cement is the
published maps and institutional affil-   foremost binder material, as well as the main source of concrete hydraulicity. However,
iations.                                  a lot of CO2 is generated during the production process of any type of cement, which
                                          adversely affects the environment. Therefore, research is needed to find a substitute cement
                                          and reduce carbon emissions [4–6].
                                                Geopolymer technology is a very effective industrial innovation, which uses the mate-
Copyright: © 2021 by the authors.
                                          rial made of aluminosilicate mineral and alkaline activity bath reaction, wherein most of the
Licensee MDPI, Basel, Switzerland.
                                          silicate mineral can be replaced by industrial waste. It was named “geopolymer” by Joseph
This article is an open access article
                                          Davidovits in 1979 [7]; the amorphous semicrystalline tri-dimensional alumino-silicates can
distributed under the terms and
                                          rapidly form natural alumino-silicates solid materials under normal temperature through
conditions of the Creative Commons
                                          alkali reactivity. In addition, the geopolymer has an excellent heat resistance and fire resis-
Attribution (CC BY) license (https://
creativecommons.org/licenses/by/
                                          tance, and its carbon emission is lower than that of the conventional Portland cement [8].
4.0/).
                                          Hence, it is regarded as a potential substitute building material that can be extensively

Polymers 2022, 14, 63. https://doi.org/10.3390/polym14010063                                              https://www.mdpi.com/journal/polymers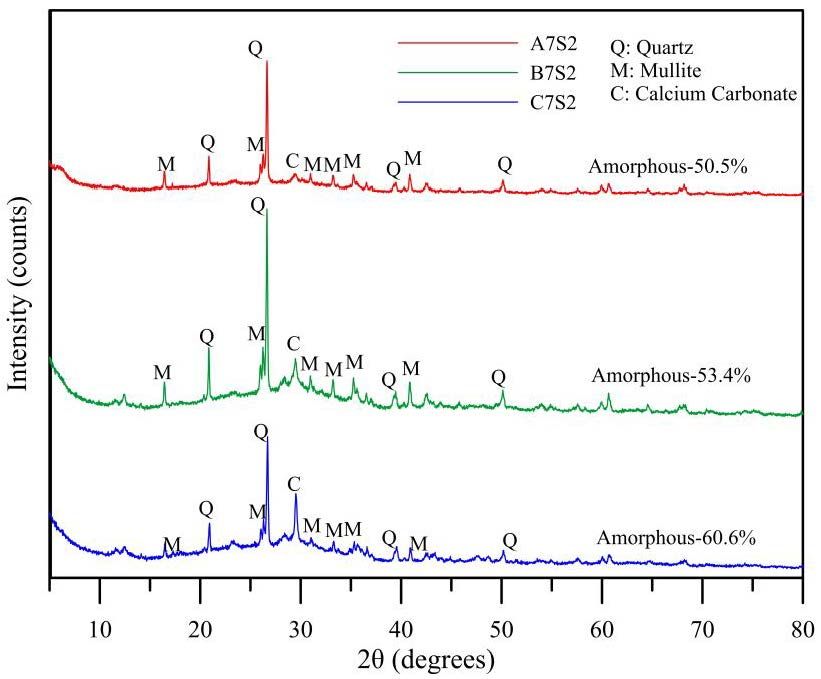
Polymers 2022, 14, 63                                                                                                      2 of 15

                                used in industries, including construction in the future [9]. Many researchers also used
                                alkali-activated materials (AAM) as a substitute for geopolymers. The difference between
                                the chemical composition of geopolymers and AAMs is the calcium content, as calcium
                                silicate hydrate does not become part of the polymerization product [10].
                                      There are diverse raw materials of AAM, the industrial waste is usually used as raw
                                material to save cost and reduce waste. The majority of the present solid wastes is the fly
                                ash produced by coal-fired power plants, and the proportion of green power generation
                                increases continuously; nevertheless, the coal-fired power generation still has marketability.
                                Since the environmental pollution prevention strategies were established, people have used
                                coal fly ash as a valuable material [11]. The fly ash can be transformed by an alkali-activated
                                technique from waste into a construction material helpful to the environment [12]. The
                                quality of coal fly ash varies with the composition and fineness of coal, fly ash collection
                                form, and its storage method. Being the key to the quality of AAM, it is necessary to analyze
                                the basic physical properties of each kind of fly ash.
                                      The fly ash generally contains high amounts of Al-Si glass phases and a few crystal
                                phases. With a high content of amorphous SiO2 and alumina, coal fly ash can react with
                                alkaline solution rapidly [13], making it a suitable raw material of AAM.
                                      The geopolymer is mainly composed of Si-O-Al structure, and its amorphous struc-
                                ture is different from synthetic zeolites. The geopolymerization mechanism involves the
                                dissolution, migration, and polymerization of Si and Al precursors, and the addition of
                                soluble silicate can accelerate the polymerization [14].
                                      A major problem with alkali-activated materials is durability: if the degree of shrinkage
                                is too severe, this may lead to cracks. Research findings indicated that alkali-activated high
                                Ca substances usually have more severe drying shrinkage than cement matrix [15,16], and
                                the physical properties of raw material are the key factor in the degree of dry shrinkage. This
                                study employed three kinds of fly ash for a series of the same tests, aiming to distinguish
                                heterogeneous fly ash.

                                2. Materials and Methods
                                2.1. Raw Materials
                                     In this study, we used three types of fly ash and their chemical properties are presented
                                in Table 1. The X-ray diffraction (XRD) patterns of the powder shown in Figure 1, which
                                were obtained at a scanning rate of 2θ/min and over a scanning range of 10◦ –80◦ , revealed
                                different amorphous characteristics. The amorphous percentage of the four raw materials
                                were 46.2, 56.7, 67.8, and 94.9%, respectively. The size distribution of the fly ash, as
                                characterized using an INSITEC laser diffraction particle size analyzer, is shown in Figure 2.
                                The mean geometric sizes of the three fly ash kinds were estimated to be 21.01 µm, 27.1 µm,
                                and 26.5 µm, with standard deviations of 3.897, 3.568, and 5.758 respectively.

                                Table 1. Chemical properties of fly ash produced and ground granulated blast-furnace slag (GGBFs)
                                in this study.

                                                                                                                      Unit: %
      Material          SiO2    Fe2 O3     Al2 O3      CaO       MgO        TiO2       K2 O       SrO        SO3        LOI
      Fly ash A         49.89    24.71       7.01      6.31         -        4.97       2.42      0.92       0.43        1.6
      Fly ash B         41.68    19.56      10.09     16.88         -        5.05       2.81      1.54       0.52       1.87
      Fly ash C         35.53     30.5       4.89     15.95         -        4.97       3.43      1.72       1.07       4.89
       GGBFs            33.53     0.27      14.85     40.53       7.17         -          -         -          -        0.08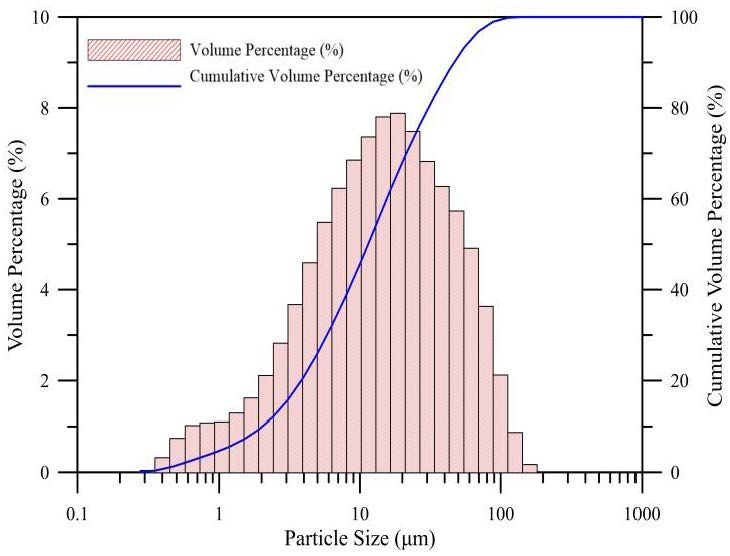
Polymers 2022,14,
Polymers2022,  14,63
                   x FOR PEER REVIEW                                                                                                     33 of
                                                                                                                                            of 15
                                                                                                                                               16
   Polymers 2022, 14, x FOR PEER REVIEW                                                                                              3 of 16

                                  Figure
                                  Figure 1.1.X-ray
                                   Figure1.  X-ray diffraction
                                              X-raydiffraction  (XRD)patterns
                                                   diffraction (XRD) patternsof
                                                                     patterns offly
                                                                              of  flyash
                                                                                 fly  ashand
                                                                                      ash and
                                                                                          and  ground
                                                                                              ground
                                                                                             ground   granulated
                                                                                                     granulated
                                                                                                    granulated    blast-furnace
                                                                                                                 blast-furnace
                                                                                                               blast-furnace     slag.
                                                                                                                                slag.
                                                                                                                             slag.

                                                                    (a)
                                                                     (a)

                                  (b)                                                                  (c)
                                   Figure2.2.Particle
                                 (b)
                                  Figure      Particle size
                                                       size distribution
                                                            distribution of
                                                                         offly
                                                                            flyash
                                                                                ashobtained
                                                                                    obtainedfrom a laser
                                                                                              from       diffraction
                                                                                                   a laser(c)        particle
                                                                                                            diffraction       sizesize
                                                                                                                        particle   analyzer.
                                                                                                                                       analyzer.
                                    (a) Fly ash A, (b) fly ash B, and (c) fly ash C.
                                  (a) Fly ash
                                   Figure      A, (b) fly
                                           2. Particle    ash
                                                       size   B, and (c) fly
                                                            distribution      ashash
                                                                           of fly C. obtained from a laser diffraction particle size analyzer.
                                   (a) Fly ash A, (b) fly ash B, and (c) fly ash C.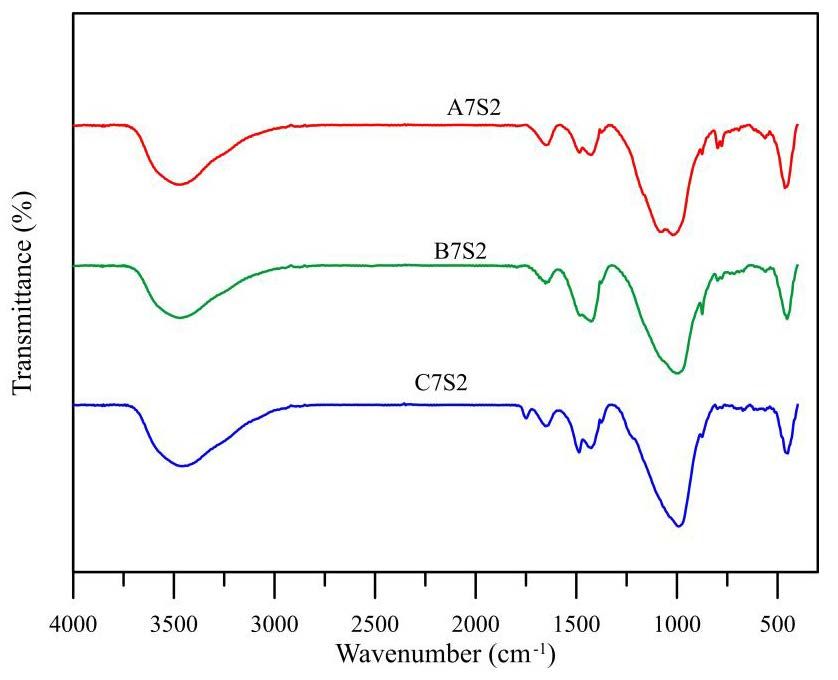
Polymers 2022, 14, 63                                                                                      4 of 15

                        2.2. Activator
                             The fly ash and ground granulated blast-furnace slag (GGBFs) were alkali-activated
                        by mixing with an activator in the production of AAM. The activator used here was a
                        mixture of water and sodium hydroxide (NaOH) (reagent grade, 97% purity: Showa
                        Chemical Industry Co., LTD, Tokyo, Japan). The chemical reaction, microstructure, and
                        properties of an AAM can be affected dramatically by the amount of water in an activator.
                        Therefore, the water/solid ratio was fixed at 0.3 for all fly ash-based AAM specimens.
                        Only alkali-equivalent content parameters were employed in this study. The water/solid
                        ratio (W/S) is the weight ratio of water to the sum of solid (includes powders and NaOH).
                        The alkali-equivalent content, denoted by AE%, is defined as the weight fraction of Na2 O
                        to powders.

                        2.3. Sample Preparation, Mixing, and Curing
                              The activator plays an important role in determining the microstructure and proper-
                        ties of fly ash-based AAM specimens. To evaluate the effects of NaOH on the compres-
                        sive strengths of fly ash-based AAM, activators with various alkali-equivalent content of
                        AE% = 3%, 4%, 5%, 6%, 7%, and 8% were used in the production of fly ash-based AAM
                        specimens, and replaced by 10%, 20% and 30% slag with a water/solid ratio of 0.3. The
                        specimen proportions example is given in Table 2.

                        Table 2. Example of proportion at AE% = 8%.

                                                                                                       Unit: g
                            Mix
                                         Water        NaOH        Fly Ash A   Fly Ash B   Fly Ash C   GGBFs
                         Designation
                            AS1           165.5         51.6          450         -           -          50
                            AS2           165.5         51.6          400         -           -         100
                            AS3           165.5         51.6          350         -           -         150
                             BS1          165.5         51.6           -        450           -         50
                             BS2          165.5         51.6           -        400           -         100
                             BS3          165.5         51.6           -        350           -         150
                             CS1          165.5         51.6           -          -          450         50
                             CS2          165.5         51.6           -          -          400        100
                             CS3          165.5         51.6           -          -          350        150

                             For each activator, the required amounts of NaOH, and water were weighed, mixed,
                        and then placed in a container until room temperature was reached. Next, powders were
                        added to the container and stirred vigorously for 2 min in a 5L Hobart mixer. After
                        complete mixing, the AAM paste was poured into 3 × 3 × 3 cm steel molds, with a total
                        of 18 cubes cast of each mix for the compressive strength tests and further compacted
                        on a vibrating table (CONTROLS, frequency of 60 Hz) to get rid of any air bubbles. The
                        steel molds were covered with plastic wrap to prevent the evaporation of moisture and
                        then cured at an ambient temperature. The specimen size used for the shrinkage test
                        was 25 × 25 × 285 mm, mixed, molded, and cured as same as above, with a total of three
                        samples for each proportion. One day later, the specimens were demolded.

                        2.4. Pozzolanic Strength Activity Index
                            This test was carried out by reference to ASTM C311 [17], in which the 7- and 28-day
                        compressive strengths of mortar cubes with a 20% mass replacement of cement by fly ash
                        were compared to those of control without fly ash, at constant flow conditions. This was
                        used to investigate the activity of different types of raw materials.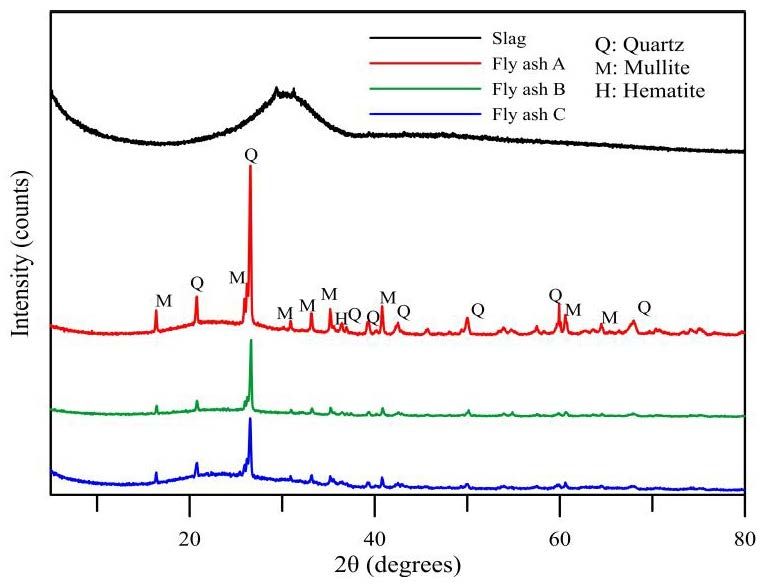
Polymers 2022, 14, 63                                                                                           5 of 15

                        2.5. Workability
                             According to the mixing conditions in Section 2.3, the flow test was performed for
                        the mixed specimen referring to ASTM C230 [18]. The paste was poured into the top split
                        conical ring, and the flow table was bounced 25 times within 15 s after the conical ring
                        was removed to measure the flowability of the mixture. The influence of the flowability
                        of different slag substitution amounts was observed in different alkali-equivalent content
                        conditions on workability.

                        2.6. Setting Time Test (Vicat Needle)
                             Firstly, in line with Section 2.3, AAM pasteis mixed by pouring in the conical ring
                        (a height of 40 mm, an inside diameter at the bottom of 70 mm, and an inside diameter
                        at the top of 60 mm). Periodic penetration tests are performed on this paste by allowing
                        a 1 mm Vicat needle to settle into this paste. The Vicat initial time of setting is the time
                        elapsed between the initial contact of cement and water and the time when the penetration
                        is measured or calculated to be 25 mm. The Vicat’s final time of setting is the time elapsed
                        between initial contact of cement and water and the time when the needle does not leave
                        a complete circular impression in the paste surface. Since the setting time test is quite
                        sensitive, the sample needed to be placed at a temperature of 23 ◦ C and relative humidity
                        of not less than 95%.

                        2.7. Compressive Strength Test
                             To determine the influence of the mixtures of different mix proportions on compressive
                        strength, the specimens of all mix proportions were mixed according to Section 2.3 and
                        made into a 3 × 3 × 3 cm specimen, which was hardened and cured under normal
                        temperature. The compressive strength tests were carried out with reference to ASTM
                        C109 [19]. The specimen was placed into the compression tester according to the curing
                        ages of days 3, 7, 14, 28, 56, and 91 for compressive strength tests, and the strength was
                        measured and recorded. The average of three specimens was used for each test.

                        2.8. Drying Shrinkage Test
                             The alkali-activated cementing material always has problems in volume stability,
                        especially the alkali-activated slag, its dry shrinkage is quite large. Besides using fly ash
                        as a base to produce AAM, this study also adopted a small amount of slag to replace fly
                        ash. Therefore, it was necessary to measure the long-term volume stability. The drying
                        shrinkage mold used in this study was a 25 × 25 × 285 mm steel die, and the measurement
                        ages included days 3, 7, 14, 28, 56, and 91. The drying shrinkage test result showed that the
                        volume stability of materials is very important for the usability of materials.

                        2.9. Microscopic Test
                              The raw materials were mixed according to Section 2.3. The reaction of fly ash in the
                        specimen was considered more complete and the structure was more intact after 91 days of
                        curing; hence, the specimen was cured at room temperature until 91 days as a microscopic
                        test sample. The specimens made of three different materials were extracted from the mix
                        proportion with the maximum compressive strength for microscopic test analysis. Firstly,
                        the samples were pulverized and then vacuum dried until they reached a constant weight.
                        Then, a portion of the sample was analyzed by XRD to determine the mineral components
                        of the products. The XRD measurement was done with a D4 (Bruker) using a Co-Tube
                        and equipped with a LynxEye detector. The settings were fixed divergence slits (0.5◦ ),
                        0.04 rad Soller slits, and a step size of 0.02. The other part of the sample was placed on the
                        Fourier transform infrared (FTIR) spectrometer for the recording of their infrared spectrum.
                        The FTIR spectrum was recorded using a BRUKER, TENSOR II FT-IR Spectrometer over
                        the wavelength range of 400 cm−1 to 4000 cm−1 . The resolution of the measurement was
                        4 cm−1 . After extracting and crushing some of the specimens, the fine particle samples
                        were dried in a vacuum environment until they reached a constant weight. They were then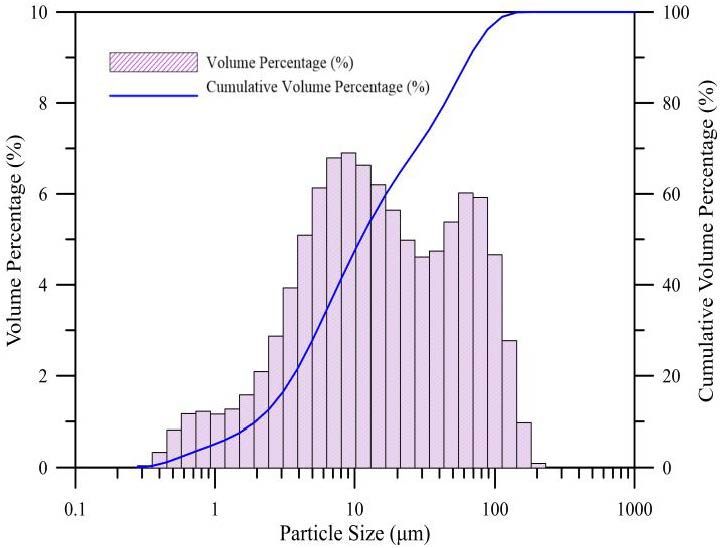
Polymers 2022, 14, 63                                                                                                     6 of 15

                        placed in the Scanning Electron Microscope (SEM) to observe the extent of reaction of fly
                        ash and the pore structure of products.

                        3. Results and Discussion
                        3.1. Pozzolanic Strength Activity Index
                             The test was performed referring to ASTM C311 [17], and the result is shown in Table 3.
                        The activity indexes of the three kinds of fly ash exceeded 95% on Day 7, proving good
                        activity, and the activity indexes were excellent at 117%, 125%, and 127% on Day 28. The
                        activity index of GGBFS on Day 7 was 96%, and on Day 28 was 117%, meeting the Grade
                        120 furnace slag of ASTM C989 [20]. Data in Table 3 indicate that fly ash C has the highest
                        activity index of all materials at 28 days and all three kinds of fly ash activity index are
                        greater than GGBFs.

                        Table 3. Pozzolanic strength activity index and Blaine Specific surface area for each material.

                          Pozzolanic Strength                                                           Blaine Specific
                                                          7 Days                   28 Days
                            Activity Index                                                              Surface (m2 /kg)
                               Fly ash A                   104%                      118%                      417
                               Fly ash B                   104%                      125%                      357
                               Fly ash C                   95%                       127%                      627
                                GGBFs                       96%                      117%                      580

                        3.2. Flowability
                              The flow of mix proportions of AE% = 3, 5, and 8% of the three kinds of fly ash was
                        tested as shown in Figure 3. As the setting time of fly ash C was much longer than that
                        of fly ash A and B, it is less likely to cure and has a much higher flow rate than the other
                        two kinds of fly ash. The flowability of various pastes increased with the alkali-equivalent
                        content, because in the case of the same total mixing amount, the mixture with higher
                        alkali-equivalent content has a lower total content of aggregate, and the flow of paste
                        increased slightly with the slag substitution amount. However, when AE = 5 and 8%, and
                        the slag replacement rate increased to 20%, the flow decreased because the rapid setting
                        reaction of slag [21] reduced the flowability. However, when the slag replacement was 10%,
                        the effect of slag on workability might be slighter than the effect of fly ash, as the fineness
                        of the three kinds of fly ash was much lower than that of slag.

                        3.3. Setting Time
                              The setting time of mix proportions of AE% = 3, 5, and 8% of the three kinds of fly ash
                        was tested. Wang et al. [21] reported a rapid setting problem of the slag. Consequently, our
                        research modified the overlong setting time of pure fly ash.
                              As shown in Figure 4, the setting time of the AAM made of fly ash C was apparently
                        longer than that of the other two kinds of fly ash, which results from different properties
                        of the raw materials. Therefore, according to the XRF of the raw materials in Table 1, the
                        CaO content in the fly ash C was 15.95%. This might not were caused by the insufficient
                        CaO content to form AAM or other C-S-H colloids with silicates. Mortureux et al. [22]
                        mentioned that the alkali-activated colloid in Ca form is likely to form in the case of high
                        NaOH concentration; however, the colloid types formed by geopolymerization at a low
                        alkali liquor concentration in this study were SiO4 and AlO4 -tetrahedral structures. After
                        QXRD by Rietveld quantitative analysis, the composition of the feed material is known, as
                        shown in Section 2.1, the amorphous content of fly ash C was the highest at 67.8%, and that
                        of fly ash B and fly ash A were 56.7% and 46.2%, respectively. This might be because the
                        amorphous content was too high. In the case of low alkali liquor concentration and slag
                        replacement rate, the originally unlikely polymerization was difficult to happen, and the
                        paste could not be hardened. When AE% = 5 and 8%, as shown in Figure 4c–f, when the
                        slag replacement rate was 20%, the mixture setting time could be shortened greatly. When
                        the slag replacement rate was 30%, its effect on shortening the setting time was slighter.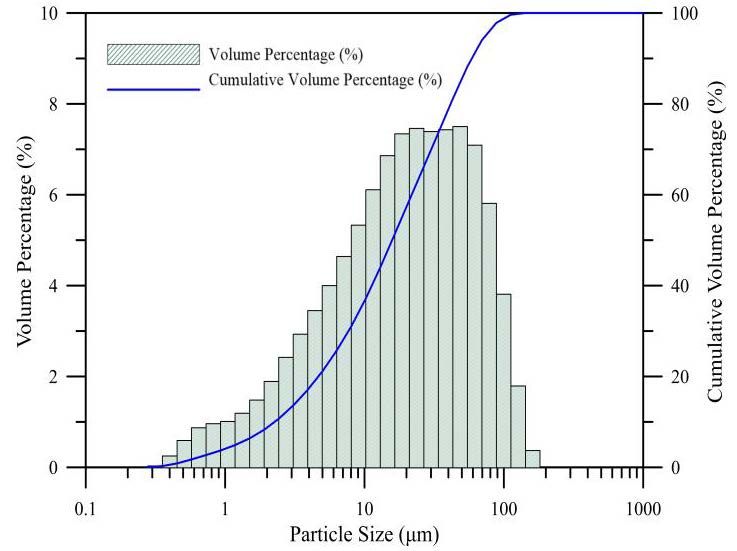
content, because in the case of the same total mixing amount, the mixture with higher
alkali-equivalent content has a lower total content of aggregate, and the flow of paste in-
creased slightly with the slag substitution amount. However, when AE = 5 and 8%, and
the slag replacement rate increased to 20%, the flow decreased because the rapid setting
Polymers 2022, 14, 63 reaction of slag [21] reduced the flowability. However, when the slag replacement was 7 of 15
10%, the effect of slag on workability might be slighter than the effect of fly ash, as the
fineness of the three kinds of fly ash was much lower than that of slag.
Polymers 2022, 14, x FOR PEER REVIEW 7 of 16
(a)
(b) (c)
Figure 3. Flowability between different
Figure alkali-equivalents
3. Flowability betweenand different
different GGBFs replacements.
alkali-equivalents (a) AE% GGBFs
and different = 3%; (b)replacements.
AE% =
5%; (c) AE% = 8%.
(a) AE% = 3%; (b) AE% = 5%; (c) AE% = 8%.
3.3. Setting Timeto the increasing alkali equivalent concentration, when AE% = 8%, as shown
According
The 4e,f,
in Figure setting
thetime of setting
overall mix proportions of AE%than
time was shorter = 3,that
5, and 8% of
of AE% the three
= 3%, kinds ofthe
corroborating fly
result
ash was of tested.
Gebreziabiher
Wang et et al.al.
[21][23], whichaindicated
reported thatproblem
rapid setting the setting time
of the canConsequently,
slag. be shortened
by
ourusing
researchhighmodified
concentration alkaline
the overlong activator.
setting time When
of puretheflyalkali-equivalent
ash. content was
increased
As shownto AE% = 8%, 4,
in Figure thethe paste of this
setting timestudy
of thehad
AAM themade
fastest
of polymerization, and the
fly ash C was apparently
reaction rate increased with the slag replacement ratio. When AE%
longer than that of the other two kinds of fly ash, which results from different properties = 8% and the slag
replacement rate was 30%, the initial setting time of the pastes made
of the raw materials. Therefore, according to the XRF of the raw materials in Table 1, the of fly ash A, fly ash B,
and
CaOfly ash C in
content wasthe50,
fly65, and
ash C was50 min, respectively;
15.95%. This mightthus,notthere
werewere fewby
caused differences in the
the insufficient
setting time oftothe
CaO content three
form kindsorofother
AAM fly ash fromcolloids
C-S-H differentwith
plants.
silicates. Mortureux et al. [22]
mentioned that the alkali-activated colloid in Ca form is likely to form in the case of high
3.4. Compressive Strength
NaOH concentration; however, the colloid types formed by geopolymerization at a low
alkaliThe compressive
liquor strength
concentration of all
in this mixtures
study were SiOwas4 and
tested.
AlO When AE% = 3%,
4-tetrahedral as shown
structures. in
After
Figure 5a, the compressive strengths of fly ash A were 16.15,
QXRD by Rietveld quantitative analysis, the composition of the feed material is known,19.84, and 25.33 MPa with
standard
as showndeviations of 1.96,
in Section 2.1, 2.17, and 1.03
the amorphous at theof
content slag
fly replacement
ash C was the rates of 10%,
highest 20%, and
at 67.8%, and
30%
that on Day
of fly 28.BAfter
ash and flyDay 28,Athe
ash compressive
were 56.7% andstrength weakened as This
46.2%, respectively. the age increased.
might The
be because
compressive
the amorphous strengths
content were
was too9.25, 15.82,
high. andcase
In the 19.51
of MPa with liquor
low alkali standard deviationsand
concentration of 1.22,
slag
1.27, and 2.4 on Day 91. The strength of fly ash B still increased when the
replacement rate, the originally unlikely polymerization was difficult to happen, and the paste slag replacement
could not be hardened. When AE% = 5 and 8%, as shown in Figure 4c–f, when the slag re-
placement rate was 20%, the mixture setting time could be shortened greatly. When the
slag replacement rate was 30%, its effect on shortening the setting time was slighter.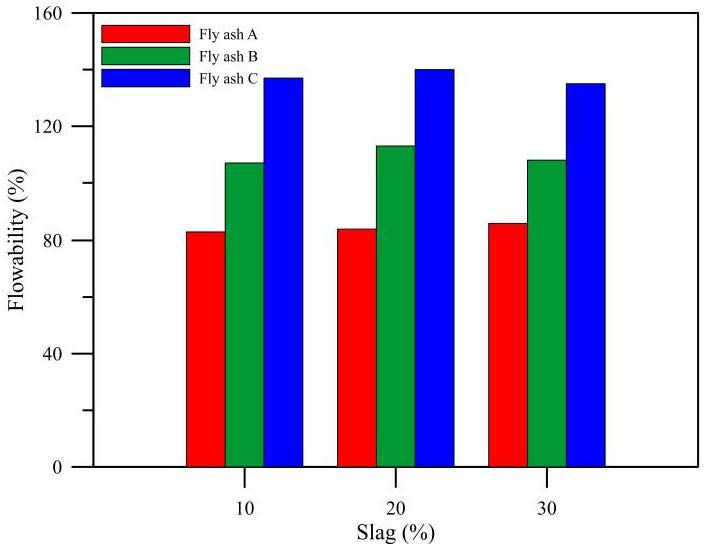
Polymers 2022, 14, 63                                                                                          8 of 15

                        rate was 30% on Day 91, while the strength of replacement rate of 10% or 20% decreased
                        slightly on Day 91. This is because the optimum amount of alkali required for fly ash differs
                        from that required for slag, and there was no excess free alkali at 30% slag replacement to
                        cause a late strength decline. The fly ash C had better compressive strength than the other
                        two kinds when the slag replacement rates were 20% and 30%, with compressive strengths
                        were 30.24 and 28.88 MPa, standard deviations of 2.34 and 1.27 on Day 91. However, when
                        the slag replacement rate was 10%, the strength was much lower than that of the same mix
                        proportion of the other two kinds of fly ash, with a compressive strength of 6.79 MPa and
                        a standard deviation of 0.88. Based on the setting time of the mix proportions shown in
                        Figure 4, it was suspected to be because the paste does not have adequate alkali content,
                        resulting in inadequate reaction and polymerization and that the incompletely reacted
                        alkali-activated liquid in the paste could not be retained. As a result, the strength did not
                        yet improve after a longer age.
                              When AE% = 4%, as shown in Figure 5b, the strength development of various mix
                        proportions became slow after Day 28. Except for the strength of fly ash B in the mix
                        proportion of slag substitution amount of 10% decreased slightly during Day 56 to Day 91,
                        with a compressive strength of 14.58 MPa at 56 days, a standard deviation of 0.82, and
                        11.05 MPa at 91 days, a standard deviation of 1.51. The other mix proportions did not have
                        an obvious uptrend or downtrend. When AE = 5%, as shown in Figure 5c, the strength of
                        various mix proportions was smooth after Day 56. Contrary to the smooth development in
                        the strength when AE% = 4% on Day 28, the strength increased in the later stage with the
                        increase in alkali-equivalent content.
                              When the alkali equivalent concentration was AE% = 6%, as shown in Figure 5d,
                        the strength of various mix proportions increased with age. The strength of various mix
                        proportions of fly ash A still increased significantly on Day 91, the compressive strengths
                        of 24.53, 33.12, and 37.22 MPa with standard deviations of 1.35, 1.48 and 1.49 at the slag
                        replacement rates of 10%, 20%, and 30% on Day 91. When AE% = 7 and 8%, as shown
                        in Figure 5e,f, the optimum alkali-equivalent content of mix proportion of fly ash A was
                        achieved. When AE% = 7% and the slag substitution amounts were 10%, 20%, and 30%, the
                        strengths at 91 days were 30.75, 38.59, and 33.02 MPa, standard deviations of 2.11, 1.23 and
                        2.35, respectively, and increased gradually with age. When AE% = 8%, the strength began
                        to decrease on Day 56. The compressive strengths were 27.84, 33.09, and 31.27 MPa with
                        standard deviations of 2.47, 2.11, and 2.4 at the slag replacement rates of 10%, 20%, and
                        30% on Day 56, and 25.48, 32.19, and 30.17 MPa with standard deviations of 1.83, 2.37, and
                        1.21 on Day 91. The specimens of the mix proportions of fly ash B and fly ash C still had
                        a good increase amplitude in the case of AE 8% from Day 56 to Day 91, and the strength
                        could be increased by increasing the alkali equivalent concentration.

                        3.5. Drying Shrinkage
                             This study employed AE% = 3, 5, and 8% and the alkali-equivalent content in Figure 6
                        for the drying shrinkage test. When AE% = 5%, as shown in Figure 6b, and the slag
                        replacement rate was 10%, the fly ash B expanded acutely and shrank gradually after the
                        age of 14 days. In the mix proportions of fly ashes A and C, the shrinkage amplitude
                        increased gradually with age; the shrinkage amplitude was larger than that of AE 3%.
                        When AE% = 8% as shown in Figure 6c, and the slag replacement rate of the fly ash B was
                        10%, the fly ash B exhibited more severe expansion than AE 5%, and the expansivity was
                        0.5813% at the age of 91 days.
                             The mix proportion of fly ash C had a severe shrinkage. At the age of 91 days, for
                        AE% = 3% as shown in Figure 6a, when the slag substitution amounts were 10, 20, and
                        30%, the amounts of change in length were −1.718%, −2.315%, and −2.497%, respectively.
                             The shrinkage of mix proportion of fly ash A was next to fly ash C, when AE% = 3%
                        and the slag substitution amounts were 10, 20, and 30%, the amounts of change in length
                        are −1.1893%, −1.768%, and −2.309%, respectively.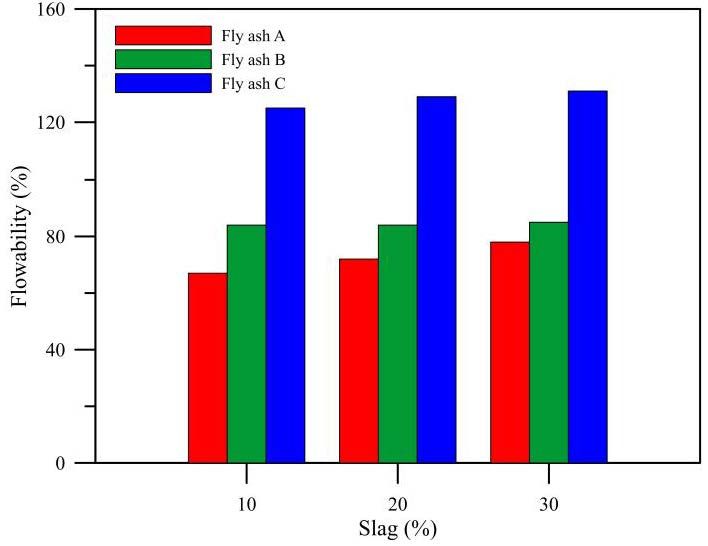
Polymers2022,
Polymers        14,x63
          2022,14,   FOR PEER REVIEW                                                                                               9 8ofof1516

                               (a)                                                                   (b)

                               (c)                                                                   (d)

                               (e)                                                                    (f)
                                 Figure 4. Initial and final setting times for different alkali equivalents and GGBFs replacements. (a)
                                  Figure 4. Initial and final setting times for different alkali equivalents and GGBFs replacements.
                                 AE% = 3% initial setting times, (b) AE% = 3% final setting times, (c) AE% = 5% initial setting times,
                                  (a) AE% = 3% initial setting times, (b) AE% = 3% final setting times, (c) AE% = 5% initial setting times,
                                 (d) AE% = 5% final setting times, (e) AE% = 8% initial setting times, (f) AE% = 8% final setting times.
                                  (d) AE% = 5% final setting times, (e) AE% = 8% initial setting times, (f) AE% = 8% final setting times.

                                      According to the increasing alkali equivalent concentration, when AE% = 8%, as
                                 shown in Figure 4e,f, the overall setting time was shorter than that of AE% = 3%, corrob-
                                 orating the result of Gebreziabiher et al. [23], which indicated that the setting time can be
                                 shortened by using high concentration alkaline activator. When the alkali-equivalent con-
                                 tent was increased to AE% = 8%, the paste of this study had the fastest polymerization,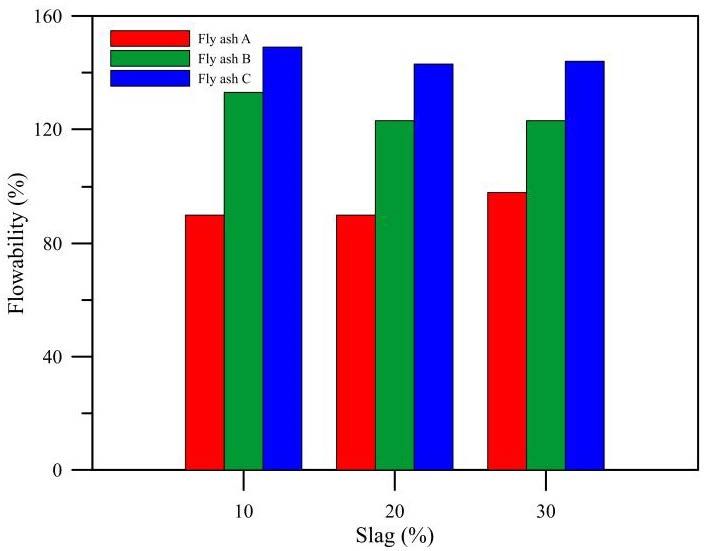
portion of slag substitution amount of 10% decreased slightly during Day 56 to Day 91,
                                 with a compressive strength of 14.58 MPa at 56 days, a standard deviation of 0.82, and
                                 11.05 MPa at 91 days, a standard deviation of 1.51. The other mix proportions did not have
                                 an obvious uptrend or downtrend. When AE = 5%, as shown in Figure 5c, the strength of
                                 various mix proportions was smooth after Day 56. Contrary to the smooth development
Polymers 2022, 14, 63                                                                                                10 of 15
                                 in the strength when AE% = 4% on Day 28, the strength increased in the later stage with
                                 the increase in alkali-equivalent content.

Polymers 2022, 14, x FOR PEER REVIEW                                                                                         10 of 16

                               (a)                                                               (b)

                                (c)                                                               (d)

                                (e)                                                               (f)
      Figure 5. Compressive strength at different alkali equivalents for each proportion at different ages. (a) AE% = 3%, (b) AE%
                                Figure 5. Compressive strength at different alkali equivalents for each proportion at different ages.
      = 4%, (c) AE% = 5%, (d) AE% = 6%, (e) AE% = 7%, (f) AE% = 8%.
                                (a) AE% = 3%, (b) AE% = 4%, (c) AE% = 5%, (d) AE% = 6%, (e) AE% = 7%, (f) AE% = 8%.

                                      When the alkali equivalent concentration was AE% = 6%, as shown in Figure 5d, the
                                 strength of various mix proportions increased with age. The strength of various mix pro-
                                 portions of fly ash A still increased significantly on Day 91, the compressive strengths of
                                 24.53, 33.12, and 37.22 MPa with standard deviations of 1.35, 1.48 and 1.49 at the slag re-
                                 placement rates of 10%, 20%, and 30% on Day 91. When AE% = 7 and 8%, as shown in
                                 Figure 5e,f, the optimum alkali-equivalent content of mix proportion of fly ash A was
for the drying shrinkage test. When AE% = 5%, as shown in Figure 6b, and the slag re-
placement rate was 10%, the fly ash B expanded acutely and shrank gradually after the
age of 14 days. In the mix proportions of fly ashes A and C, the shrinkage amplitude in-
creased gradually with age; the shrinkage amplitude was larger than that of AE 3%. When
AE% = 8% as shown in Figure 6c, and the slag replacement rate of the fly ash B was 10%,
Polymers 2022, 14, 63 11 of 15
the fly ash B exhibited more severe expansion than AE 5%, and the expansivity was
0.5813% at the age of 91 days.
(a)
(b) (c)
Figure 6. Drying and shrinkage of various proportions with age at different alkali equivalents. (a)
Figure 6. Drying and shrinkage of various proportions with age at different alkali equivalents.
AE% = 3%, (b) AE% = 5%, (c) AE% = 8%.
(a) AE% = 3%, (b) AE% = 5%, (c) AE% = 8%.
The mix proportion
According to the testofresult,
fly ashtheC higher
had a severe shrinkage.
the GGBFs At the rate
replacement age of 91 the
was, days, for
more
AE% = 3% as shown in Figure 6a, when the slag substitution amounts were
severe the shrinkage, which is due to the very large degree of autogenous shrinkage of the 10, 20, and
30%,
stone the amounts
itself ofhigher
[24]. The changethe in alkali-equivalent
length were −1.718%, −2.315%,
content andC−2.497%,
of fly ash respectively.
and fly ash A was, the
larger the amount of deformation from shrinkage was. However, the expansionAE%
The shrinkage of mix proportion of fly ash A was next to fly ash C, when of fly= ash
3%
and the slag substitution amounts were 10, 20, and 30%, the amounts
B increased with alkali-equivalent content. According to the compound composition ofof change in length
are −1.1893%,
various −1.768%,inand
raw materials −2.309%,
Table respectively.
1, the highest CaO content was in fly ash C at 16.88%, so its
According
expansion may beto the test result,
the volume the higher
expansion the GGBFs
resulting from replacement
the reaction ofrate was,content
a high the more of
severe
F-CaO andthe shrinkage,
water. which is due to the very large degree of autogenous shrinkage of
the stone itself [24]. The higher the alkali-equivalent content of fly ash C and fly ash A
3.6. X-ray Diffraction Analysis
The maximum compressive strength of the specimens in this study occurred in the fly
ash A specimen when AE% = 7% and slag replacement rate was 20%; hence, the specimens
of three kinds of fly ash and the same mix proportion were extracted for XRD analysis.
Figure 7 shows the diffractograms of three results. When 2θ = 25◦ –26◦ , there was an obvious
quartz mineral diffraction peak, forming the mineral components of the main crystal with
Mullite. When 2θ = 28◦ , the presence of calcium carbonate was detected, meaning that Ca
in the raw material had not fully entered into polymerization to generate strong minerals.ysis. Figure 7 shows the diffractograms of three results. When 2θ = 25°–26
obvious quartz mineral diffraction peak, forming the mineral componen
crystal with Mullite. When 2θ = 28°, the presence of calcium carbonate
Polymers 2022, 14, 63 meaning that Ca in the raw material had not fully entered into polymerizat
12 of 15
strong minerals.
Figure
Figure 7. 7.XRD
XRDanalysis
analysis
of of different
different flymixtures
fly ash ash mixtures
at alkaliatequivalent
alkali equivalent
= 7% and =20%
7% and 2
GGBFs replacement.
placement.
3.7. Scanning Electron Microscopy Observation
3.7.The
Scanning Electron
mixture of Microscopy
three different materialsObservation
in the same mix proportion was cured under
ordinary temperature for 91 days before SEM tests. As shown in Figure 8, the fly ash
The mixture of three different materials in the same mix proportion wa
A sample exhibited fewer residual fly ash particles than fly ash B and fly ash C, and its
ordinary
texture temperature
was denser. This result for
is the91 days
same before
as the SEM
result of tests. As
compressive shown
strength in Figure
in Figure 5. 8
The fly ashexhibited
sample A exhibitedfewer
the highest compressive
residual fly ashstrength.
particlesAs than
fly ashfly
C contained
ash B and thefly ash
most unreacted fly ash, the alkali-activated liquid was suspected to increase continuously,
ture was denser. This result is the same as the result of compressive streng
the more spherical vitreous surface of fly ash could be damaged to dissolve the internal
Thesilica
rich fly ash A exhibited
constituent, the highest
and a higher strength compressive
specimen could strength.
possibly be As fly ash C cont
polymerized.
Subsequently, different kinds of fly ash possessed different optimum
unreacted fly ash, the alkali-activated liquid was suspected to increase con alkali-equivalent
contents, and the reactive fly ash contents in the same mix proportion were different.
more spherical vitreous surface of fly ash could be damaged to dissolve th
silica
3.8. FTIRconstituent,
Analysis and a higher strength specimen could possibly be polym
quently,
Figure 9different
shows the kinds
infraredof fly ash possessed
spectrogram of the threedifferent
specimens.optimum alkali-equiv
An apparent peak
was observed at 1020 cm−1 , which represents the Si-O and Si-O-Si stretching vibration
and the reactive fly ash contents in the same mix proportion were differen
absorption peak [25]. There is a micro peak at 875 cm−1 , wherein the absorption band
and 1400 cm−1 are recognized as the vibration of the O-C-O bond of carbonate [26]. As
the raw material was free of carbonate, certain carbonization might have occurred during
the polymerization process. This result matched with the carbonate product in the XRD
analysis shown in Figure 7, it is universally regarded as the cause for deterioration of the
geopolymerization product [27].Polymers2022,
Polymers 14,x 63
2022,14, FOR PEER REVIEW 13 of 16 13 of 15
Polymers 2022, 14, x FOR PEER REVIEW 14 of 16
Figure 8. of
Figure 8. Scanning Electron Microscope Scanning
differentElectron Microscope
fly ash mixtures of different
at alkali fly
equivalent ashand
= 7% mixtures at alkali
20% GGBFs equivalent = 7% and
replacement.
20%
(a) Fly ash A, (b) fly ash B, and GGBFs
(c) fly replacement. (a) Fly ash A, (b) fly ash B, and (c) fly ash C.
ash C.
3.8. FTIR Analysis
Figure 9 shows the infrared spectrogram of the three specimens. An apparent peak
was observed at 1020 cm−1, which represents the Si-O and Si-O-Si stretching vibration ab-
sorption peak [25]. There is a micro peak at 875 cm−1, wherein the absorption band and
1400 cm−1 are recognized as the vibration of the O-C-O bond of carbonate [26]. As the raw
material was free of carbonate, certain carbonization might have occurred during the
polymerization process. This result matched with the carbonate product in the XRD anal-
ysis shown in Figure 7, it is universally regarded as the cause for deterioration of the ge-
opolymerization product [27].
Figure 9.
Figure 9. Fourier
Fourier Transform
TransformInfrared
InfraredSpectroscopy
Spectroscopyanalysis of different
analysis fly fly
of different ash ash
mixtures at alkali
mixtures at alkali
equivalent = 7% and 20% GGBFs replacement.
equivalent = 7% and 20% GGBFs replacement.
4. Conclusions
(1) The ultimate strength of specimens occurred in the specimen of fly ash A in this study.
The activity index on Day 28 of fly ash A was only 117%, and the amorphous form was
the lowest among the three raw materials, indicating the activity index and amorphousPolymers 2022, 14, 63 14 of 15
4. Conclusions
(1) The ultimate strength of specimens occurred in the specimen of fly ash A in this
study. The activity index on Day 28 of fly ash A was only 117%, and the amorphous
form was the lowest among the three raw materials, indicating the activity index and
amorphous content are not in absolute relation to AAM strength.
(2) The optimum alkali-equivalent content in fly ash A was AE% = 7%, with the best
compressive strength 38.58 MPa at 20% slag substitution amount. The mix proportion
with the second-best compressive strength occurred in fly ash C, at AE% = 8%. The
compressive strength was 36.63 MPa when the slag substitution amount was 20%.
The fly ash B exhibited the lowest strength. The compressive strength was 33.77 MPa
when AE% = 7% and the slag substitution amount was 30%.
(3) The fly ash C had the longest setting time and was the most amorphous. Without
adequate alkali-equivalent content and slag substitution amount, the polymerization
was harder to happen.
(4) According to the drying shrinkage test, the AAM of fly ash C had very large shrinkage
because it was unlikely to set. The AAM of fly ash B exhibited too high f-CaO content,
as it reacts with water and expands. Therefore, the fly ash material greatly influences
the basic properties.
(5) The mixtures made of heterogeneous fly ash have their optimal mix proportions, with
appropriate alkali-equivalent content and slag substitution amount, any kind of fly
ash can form higher strength AAM specimens.
Author Contributions: Conceptualization, T.-A.C.; methodology, T.-A.C.; validation, T.-A.C.; investi-
gation, C.-Y.L.; resources, T.-A.C.; data curation, T.-A.C.; writing—original draft preparation, C.-Y.L.;
writing—review and editing, T.-A.C.; visualization, T.-A.C.; supervision, T.-A.C.; project administra-
tion, T.-A.C.; funding acquisition, T.-A.C. All authors have read and agreed to the published version
of the manuscript.
Funding: This research was funded by the Ministry of Science and Technology, Taiwan, ROC,
under grant MOST 109-2622-E-019-008. And The APC was funded by the Ministry of Science and
Technology, Taiwan, ROC.
Institutional Review Board Statement: Not applicable.
Informed Consent Statement: Not applicable.
Acknowledgments: Financial support from the Ministry of Science and Technology, Taiwan, ROC,
under grant MOST 109-2622-E-019-008 is gratefully acknowledged.
Conflicts of Interest: The authors declare no conflict of interest.
References
1. Special Report: Global Warming of 1.5 ◦ C. Available online: https://www.ipcc.ch/sr15 (accessed on 10 November 2021).
2. Hoegh-Guldberg, O.; Jacob, D.; Taylor, M.; Bolaños, T.G.; Bindi, M.; Brown, S.; Camilloni, I.A.; Diedhiou, A.; Djalante, R.; Ebi, K.; et al.
The human imperative of stabilizing global climate change at 1.5 C. Science 2019, 365, 1–13. [CrossRef] [PubMed]
3. Overview of Greenhouse Gases. Available online: https://www.epa.gov/ghgemissions/overview-greenhouse-gases#carbon-
dioxide (accessed on 10 November 2021).
4. Dueramae, S.; Tangchirapat, W.; Chindaprasirt, P.; Jaturapitakkul, C.; Sukontasukkul, P. Autogenous and drying shrinkages of
mortars and pore structure of pastes made with activated binder of calcium carbide residue and fly ash. Constr. Build. Mater.
2020, 230, 116962. [CrossRef]
5. Namarak, C.; Tangchirapat, W.; Jaturapitakkul, C. Bar-concrete bond in mixes containing calcium carbide residue, fly ash and
recycled concrete aggregate. Cem. Concr. Compos. 2018, 89, 31–40. [CrossRef]
6. Gholampour, A.; Ho, V.D.; Ozbakkaloglu, T. Ambient-cured geopolymer mortars prepared with waste-based sands: Mechanical
and durability-related properties and microstructure. Compos. Part B Eng. 2019, 160, 519–534. [CrossRef]
7. Davidovits, J. Years of successes and failures in geopolymer applications. Market trends and potential breakthroughs. In
Proceedings of the Geopolymer 2002 Conference, Saint-Quentin, France, 28–29 October 2002; Geopolymer Institute: Melbourne,
Australia, 2002; Volume 28, p. 29.Polymers 2022, 14, 63 15 of 15
8. Deb, P.S.; Nath, P.; Sarker, P.K. The effects of ground granulated blast-furnace slag blending with fly ash and activator content
on the workability and strength properties of geopolymer concrete cured at ambient temperature. Mater. Des. 2014, 62, 32–39.
[CrossRef]
9. Giannopoulou, I.; Dimas, D.; Maragkos, I.; Panias, D. Utilization of metallurgical solid by-products for the development of
inorganic polymeric construction materials. Glob. NEST J. 2009, 11, 127–136. [CrossRef]
10. Mehta, A.; Siddique, R.; Ozbakkaloglu, T.; Shaikh, F.U.A.; Belarbi, R. Fly ash and ground granulated blast furnace slag-based
alkali-activated concrete: Mechanical, transport and microstructural properties. Constr. Build. Mater. 2020, 257, 119548. [CrossRef]
11. Álvarez-Ayuso, E.; Querol, X.; Plana, F.; Alastuey, A.; Moreno, N.; Izquierdo, M.; Font, O.; Moreno, T.; Diez, S.; Vázquez, E.; et al.
Environmental, physical and structural characterisation of geopolymer matrixes synthesised from coal (co-) combustion fly ashes.
J. Hazard. Mater. 2008, 154, 175–183. [CrossRef] [PubMed]
12. Diaz, E.I.; Allouche, E.N.; Eklund, S. Factors affecting the suitability of fly ash as source material for geopolymers. Fuel 2010,
89, 992–996. [CrossRef]
13. Rattanasak, U.; Chindaprasirt, P. Influence of NaOH solution on the synthesis of fly ash geopolymer. Miner. Eng. 2009,
22, 1073–1078. [CrossRef]
14. Pereira, C.F.; Luna, Y.; Querol, X.; Antenucci, D.; Vale, J. Waste stabilization/solidification of an electric arc furnace dust using fly
ash-based geopolymers. Fuel 2009, 88, 1185–1193. [CrossRef]
15. Collins, F.; Sanjayan, J.G. Effect of pore size distribution on drying shrinking of alkali-activated slag concrete. Cem. Concr. Res.
2000, 30, 1401–1406. [CrossRef]
16. Neto, A.A.M.; Cincotto, M.A.; Repette, W. Drying and autogenous shrinkage of pastes and mortars with activated slag cement.
Cem. Concr. Res. 2008, 38, 565–574. [CrossRef]
17. ASTM C311M-18Standard Test Methods for Sampling and Testing Fly Ash or Natural Pozzolans for Use in Portland-Cement Concrete,
ASTM International: West Conshohocken, PA, USA, 2018.
18. ASTM C230M-21Standard Specification for Flow Table for Use in Tests of Hydraulic Cement, ASTM International: West Conshohocken,
PA, USA, 2021.
19. ASTM C109M-21Standard Test Method for Compressive Strength of Hydraulic Cement Mortars (Using 2-in. or [50-mm] Cube Specimens),
ASTM International: West Conshohocken, PA, USA, 2021.
20. ASTM C989M-18aStandard Specification for Slag Cement for Use in Concrete and Mortars, ASTM International: West Conshohocken,
PA, USA, 2018.
21. Wang, S.D.; Pu, X.C.; Scrivener, K.L.; Pratt, P.L. Alkali-activated slag cement and concrete: A review of properties and problems.
Adv. Cem. Res. 1995, 7, 93–102. [CrossRef]
22. Mortureux, B.; Hornain, H.; Gautier, E.; Regourd, M. Comparaison de la réactivité de différentes pouzzolanes. In Proceedings of
the 7th International Conference on the Chemistry of Cement, Paris, France, 6–8 April 1980; Cement Research Institute of India:
New Delhi, India, 1980; pp. 110–115.
23. Gebregziabiher, B.S.; Thomas, R.J.; Peethamparan, S. Temperature and activator effect on early-age reaction kinetics of alkali-
activated slag binders. Constr. Build. Mater. 2016, 113, 783–793. [CrossRef]
24. Hojati, M.; Radlińska, A. Shrinkage and strength development of alkali-activated fly ash-slag binary cements. Constr. Build. Mater.
2017, 150, 808–816. [CrossRef]
25. Hajimohammadi, A.; Provis, J.L.; van Deventer, J.S. Time-resolved and spatially-resolved infrared spectroscopic observation of
seeded nucleation controlling geopolymer gel formation. J. Colloid Interface Sci. 2011, 357, 384–392. [CrossRef] [PubMed]
26. Bernal, S.A.; Provis, J.L.; Rose, V.; de Gutierrez, R.M. Evolution of binder structure in sodium silicate-activated slag-metakaolin
blends. Cem. Concr. Compos. 2011, 33, 46–54. [CrossRef]
27. Chen, T.A. Optimum curing temperature and duration of alkali-activated glass inorganic binders. J. Chin. Inst. Eng. 2020,
43, 592–602. [CrossRef]You can also read