Evaluation of aerosol optical depths and clear-sky radiative fluxes of the CERES Edition 4.1 SYN1deg data product
←
→
Page content transcription
If your browser does not render page correctly, please read the page content below
Research article
Atmos. Chem. Phys., 22, 10115–10137, 2022
https://doi.org/10.5194/acp-22-10115-2022
© Author(s) 2022. This work is distributed under
the Creative Commons Attribution 4.0 License.

                       Evaluation of aerosol optical depths and
                       clear-sky radiative fluxes of the CERES
                          Edition 4.1 SYN1deg data product
              David W. Fillmore1 , David A. Rutan2 , Seiji Kato3 , Fred G. Rose2 , and Thomas E. Caldwell2
         1 Atmospheric   Chemistry Observations & Modeling Lab, University Corporation for Atmospheric Research,
                                                  Boulder, CO 80307, USA
                            2 Science Systems and Applications (SSAI), Hampton, VA 23666, USA
                                 3 NASA Langley Research Center, Hampton, VA 23666, USA

                              Correspondence: David W. Fillmore (david.w.fillmore@ucar.edu)

                                     Received: 6 April 2021 – Discussion started: 14 June 2021
                             Revised: 9 May 2022 – Accepted: 29 June 2022 – Published: 8 August 2022

       Abstract. Aerosol optical depths (AODs) used for the Edition 4.1 Clouds and the Earth’s Radiant Energy Sys-
       tem (CERES) Synoptic 1◦ (SYN1deg) product are evaluated. AODs are derived from Moderate Resolution Imag-
       ing Spectroradiometer (MODIS) observations and assimilated by an aerosol transport model (the Model for At-
       mospheric Transport and Chemistry – MATCH). As a consequence, clear-sky AODs closely match with those
       derived from MODIS instruments. AODs under all-sky conditions are larger than AODs under clear-sky condi-
       tions, which is supported by ground-based AErosol RObotic NETwork (AERONET) observations. When all-sky
       MATCH AODs are compared with Modern-Era Retrospective analysis for Research and Applications (Version
       2; MERRA-2) AODs, MATCH AODs are generally larger than MERRA-2 AODs, especially over convective re-
       gions (e.g., the Amazon, central Africa, and eastern Asia). This variation is largely due to the differing methods of
       assimilating the MODIS AOD data product and the use of quality flags in our assimilation. Including AODs with
       larger retrieval uncertainty makes AODs over the convective regions larger. When AODs are used for clear-sky
       irradiance computations and computed downward shortwave irradiances are compared with ground-based obser-
       vations, the computed instantaneous irradiances are 1 %–2 % larger than observed irradiances. The comparison
       of top-of-atmosphere clear-sky irradiances with those derived from CERES observations suggests that AODs
       used for surface radiation observation sites are 0.01–0.03 larger, which is within the uncertainty of instantaneous
       MODIS AODs. However, the comparison with AERONET AODs suggests that AODs used for computations
       over desert sites are 0.08 larger. The cause of positive biases in downward shortwave irradiance and in AOD
       for the desert sites is possibly due to the dust particle size and distribution, as defined by the MATCH transport
       model, and the transfer of that information into the radiative transfer model.

1   Introduction                                                    and the surface, which in turn governs the atmospheric cir-
                                                                    culation and the hydrological cycle (e.g., Stephens et al.,
Accurate estimates of the radiative effects of clouds and           2020; L’Ecuyer et al., 2015). Under the Earth Observing Sys-
aerosols are essential for an understanding the radiative forc-     tem (EOS) program, the National Aeronautics and Space
ing to the Earth’s climate system (Bauer and Menon, 2012;           Administration (NASA) has placed into orbit a series of
Boucher et al., 2013). In addition, through the reflection          satellites devoted to long-term observations of the climate
and absorption of solar radiation as well as the absorp-            state. Among these are Terra and Aqua, the flagship satel-
tion and emission of terrestrial thermal radiation, clouds and      lites of the EOS. Central to observation of climate evolu-
aerosols affect the radiative heating of both the atmosphere        tion are the Moderate Resolution Imaging Spectroradiome-

Published by Copernicus Publications on behalf of the European Geosciences Union.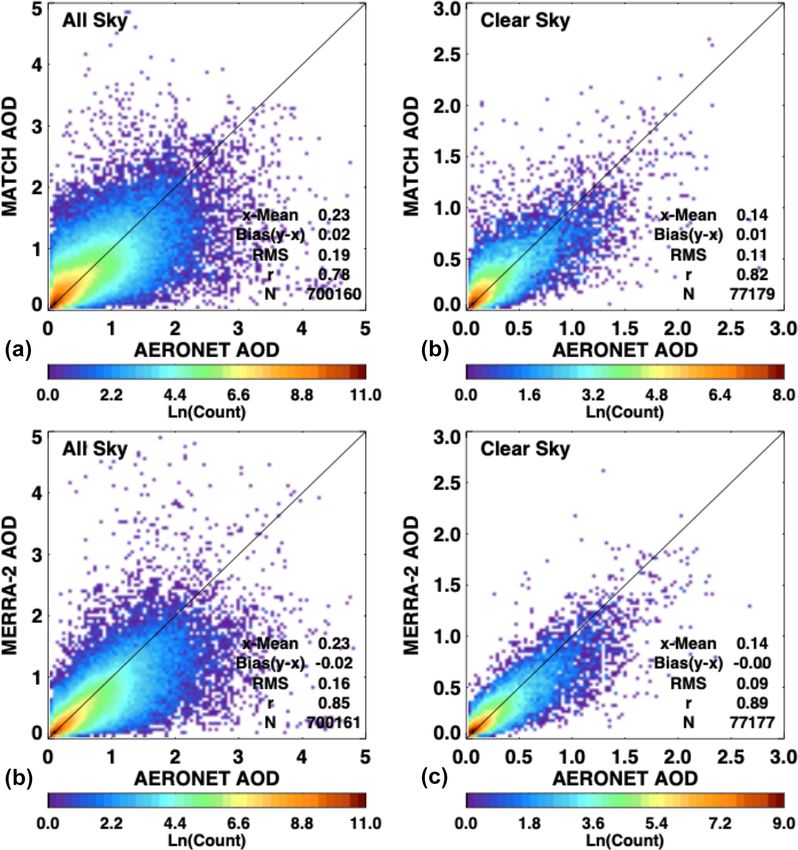
10116              D. W. Fillmore et al.: Evaluation of AOD and clear-sky radiative fluxes of the CERES SYN1deg product

ter (MODIS) and the Clouds and the Earth’s Radiant Energy         is the first attempt by the CERES team to evaluate clear-
System (CERES) instrument pairs that fly on both the Terra        sky surface irradiances provided by its data products. One
(March 2000–present) and Aqua (July 2002–present) plat-           of the essential variables in computing clear-sky irradiances
forms (Wielicki et al., 1996). Additional CERES instruments       is AOD. In this paper, we evaluate the AOD used for irra-
have been launched (October 2011) upon the Suomi Na-              diance computations in the CERES project and analyze how
tional Polar-orbiting Partnership (NPP) satellite along with      the error propagates to clear-sky surface irradiances. Com-
the MODIS successor, the Visible Infrared Imager Radiome-         putations of surface irradiances provided by the Edition 4.1
ter Suite (VIIRS), and on the NOAA-20 satellite (Novem-           SYN1deg data products use AOD derived by a chemical
ber 2017). In addition to observations from these satellites,     transport model (the Model for Atmospheric Transport and
the CERES mission also integrates observations from the           Chemistry – MATCH; Collins et al., 2001) that assimilates
Geostationary Operational Environmental Satellites (GOES)         MODIS-derived AOD. In Sect. 2, we explain in the MATCH
(West and East), as well as other geostationary satellites        aerosol transport model and the assimilation of AOD with
around the globe, for full diurnal coverage of clouds and ra-     MODIS. We then compare MATCH AOD to the MODIS and
diation.                                                          Modern-Era Retrospective analysis for Research and Appli-
   The CERES instruments measure broadband radiances              cations (Version 2; MERRA-2) aerosol products as well as
over the solar spectrum (shortwave), the thermal infrared         to AOD from the AErosol RObotic NETwork (AERONET;
(longwave radiance is obtained from a total channel minus         Holben et al., 1998). Section 3 discusses differences found
the shortwave channel), and the near-infrared atmospheric         between the various estimates of AOD. Section 4 looks at
window, with frequent onboard calibration. CERES mea-             clear-sky surface irradiance calculations from the SYN1deg
surements, in conjunction with MODIS information, are used        product compared to observed values as well as the impact
to infer broadband irradiances through empirical angular dis-     of AOD and particle size on the results. Conclusions are pre-
tribution models (ADMs). Geosynchronous satellite imagery         sented in Sect. 5.
observes the diurnal cycle of clouds, which is not fully sam-
pled by the polar-orbiting satellites upon which CERES and
MODIS reside.                                                     2   Description of the MATCH transport model
   While top-of-atmosphere (TOA) irradiances are derived
from broadband radiances measured by CERES instruments            The Model for Atmospheric Transport and Chem-
(Loeb et al., 2005; Su et al., 2015a, b), surface and at-         istry (MATCH) is a transport model of intermediate
mospheric irradiances are computed with a radiative trans-        complexity driven by off-line meteorological fields from
fer model. Inputs used for the computations include cloud         the National Centers for Environmental Prediction (NCEP)
properties derived from MODIS and geostationary satellites,       reanalysis. It is run on a 194 × 96 (1.9◦ × 1.9◦ ) spatial grid
aerosol optical depth (AOD) derived from MODIS radiances,         with a vertical resolution of 28 σ –p levels. Temporally,
and surface albedo derived from MODIS and CERES obser-            the meteorological fields are linearly interpolated to 30 min
vations (Rutan et al., 2009). Temperature and humidity pro-       time steps at which time the chemical processes are run.
files are provided by a reanalysis product produced by the        One exception is that the sulfur model is interpolated again
NASA Goddard Modeling and Assimilation Office (GMAO).             to run at 2 min subscale time steps. MATCH is one of
   Irradiances at the surface produced by the CERES team          the many aerosol transport models that participated in the
have been compared with surface observations (Rutan et al.,       AeroCom model intercomparison project (Textor et al.,
2015; Kato et al., 2013, 2018). These comparisons are for all-    2006, 2007; Kinne et al., 2006) and the AeroCom carbon
sky conditions (i.e., including any clouds). Irradiances under    intercomparison project (Koch et al., 2009; Huneeus et al.,
clear-sky conditions are not explicitly separated from all-sky    2011).
conditions in the evaluations. There are several factors that        Aerosol types included in MATCH are dust, sulfate, sea
impede efforts at rigorous validation of clear-sky irradiances    salt, soot, sulfates, carbon, and volcanic particles (Table 1).
with surface observations: (1) a clear-sky condition at a given   Model physics included in MATCH are parameterizations for
site does not persist over a long time period (e.g., a month or   convection and boundary layer processes that include prog-
longer), (2) there are mismatches between clear-sky condi-        nostic cloud and precipitation schemes for aqueous chem-
tions determined by satellite- and ground-based instruments,      istry and the scavenging of soluble species. MATCH also in-
and (3) the field-of-view size between CERES instruments          cludes the ability to resolve the transport of aerosols via con-
and ground-based radiometers differ.                              vection, boundary layer transport, and scavenging and de-
   Despite difficulties in evaluating computed clear-sky irra-    position of soluble gases and aerosols. MATCH can simu-
diances, they play an important role in quantifying aerosol       late most cloud processes currently in use in a global climate
and cloud radiative effects (Loeb and Su, 2010; Soden and         model (GCM) (e.g., cloud fraction, cloud water and ice con-
Chung, 2017). Therefore, the uncertainty in surface irradi-       tent, fraction of water converted to rain and snow, and evapo-
ances needs to be understood in order to assess the uncer-        ration of condensate and precipitate). It also includes vertical
tainty in the aerosol and cloud radiative effect. This work       turbulent-eddy processes. These processes are then used for

Atmos. Chem. Phys., 22, 10115–10137, 2022                                         https://doi.org/10.5194/acp-22-10115-2022
D. W. Fillmore et al.: Evaluation of AOD and clear-sky radiative fluxes of the CERES SYN1deg product                                  10117

Table 1. Aerosol types and climatological sources.

                     Aerosol type           Source                                 Description
                     Sea salt               Blanchard and Woodcock (1980)          Wind driven
                     Dust                   Ginoux et al. (2001);                  NCEP soil moisture, wind driven
                                            Zender et al. (2003)
                     Sulfate (natural       Benkovitz et al. (1996);               Monthly climatological
                     and anthropogenic)     Barth et al. (2000)
                     Carbon (organic        Liousse et al. (1996)                  Monthly climatological
                     and soot)
                     Volcanic               Episodic inclusion of sulfur dioxide   Processed by model

convective transport, wet scavenging, wet deposition, and dry
deposition of the MATCH aerosols. These various parame-
terizations were originally developed for the NCAR Commu-
nity Climate Model (CCM) and subsequently incorporated
into the MATCH model. Descriptions of these parameter-
izations are given by Rasch et al. (1997, 2001), Collins et
al. (2001), and additional papers described therein.
   The MATCH aerosol suite includes a detailed mineral dust
scheme in the Dust Entrainment and Deposition model (Zen-
der et al., 2003) and a diagnostic parameterization for sea
salt aerosol based on the 10 m wind speed (Blanchard and
Woodcock, 1980). The sulfur cycle and the chemical reac-
tions for sulfate aerosol creation rely on monthly climatolog-         Figure 1. The single-scattering albedo (SSA) and asymmetry pa-
ical oxidant fields and emission inventories (Table 1) for sul-        rameter (ASY) for the seven aerosol types available in the Langley
fur oxides and oceanic dimethyl sulfide (photochemistry and            Fu–Liou model SYN1deg calculations. Only those that vary with
nitrate aerosol are omitted). The reaction scheme is similar           relative humidity are plotted; others are listed as constants. All val-
to that of the Model for Ozone and Related Chemical Trac-              ues are for properties at 550 µm. (Dust particle size refers to reff .)
ers (MOZART; Emmons et al., 2010). Carbon aerosols (both
organic compounds and soot) evolve with simple mean life-
time e foldings from surface fluxes specified through natural,         the LFLRT code at 500 µm. Constituents with constant SSA
biomass burning, and fossil fuel burning emission inventories          and/or ASY are given as numbers, whereas those that vary
(monthly climatologies sources are given in Table 1).                  with relative humidity are plotted. The spectral properties for
   The optical properties of the various aerosol types                 sea salt shown in Fig. 1 were taken directly from tables in
(e.g., mass extinction coefficient and single-scattering               d’Almeida et al. (1991). Note that the asymmetry parameter
albedo), which are key parameters for aerosol assimilation,            of maritime aerosol decreases with humidity. This is likely an
are drawn from the standard Optical Properties of Clouds               error in the original Table A.30 of d’Almeida et al. (1991).
and Aerosols (OPAC; Hess et al., 1998) database. However,              We also note that large dust particles (> 0.5 µm reff ) modeled
scattering properties of maritime and dust aerosols used in            by MATCH are aggregated into a single set of optical prop-
the radiative transfer calculations in the SYN1deg product             erties in the LFLRT. The optical properties are themselves an
are not from MATCH. Instead, aerosol types from MATCH                  integrated estimate from a range of dust particle properties.
are mapped to a similar set of scattering properties (see Ta-          This is a potential source of error, particularly for regions
ble 2) embedded in the Langley Fu–Liou radiative trans-                where large dust particles are common.
fer (LFLRT) code (Fu and Liou, 1993; Fu et al., 1998; Rose
et al., 2013). These include OPAC, as in MATCH, for all but            2.1    MATCH assimilation of MODIS AODs
the small and large dust particles. Dust scattering and ab-
sorption properties in the LFLRT code are from Sinyuk et               One major advantage of the MATCH model is its ability to
al. (2003).                                                            reliably assimilate satellite-based retrievals of AOD to con-
   Figure 1 shows the single-scattering albedo (SSA) and               strain the climatologically forced aerosols generated within
asymmetry parameter (ASY) for the seven constituents in                the chemical transport portion of the code. Edition 4 MATCH
                                                                       algorithms ingest MODIS Collection 6.1 AOD (Remer et al.,

https://doi.org/10.5194/acp-22-10115-2022                                            Atmos. Chem. Phys., 22, 10115–10137, 2022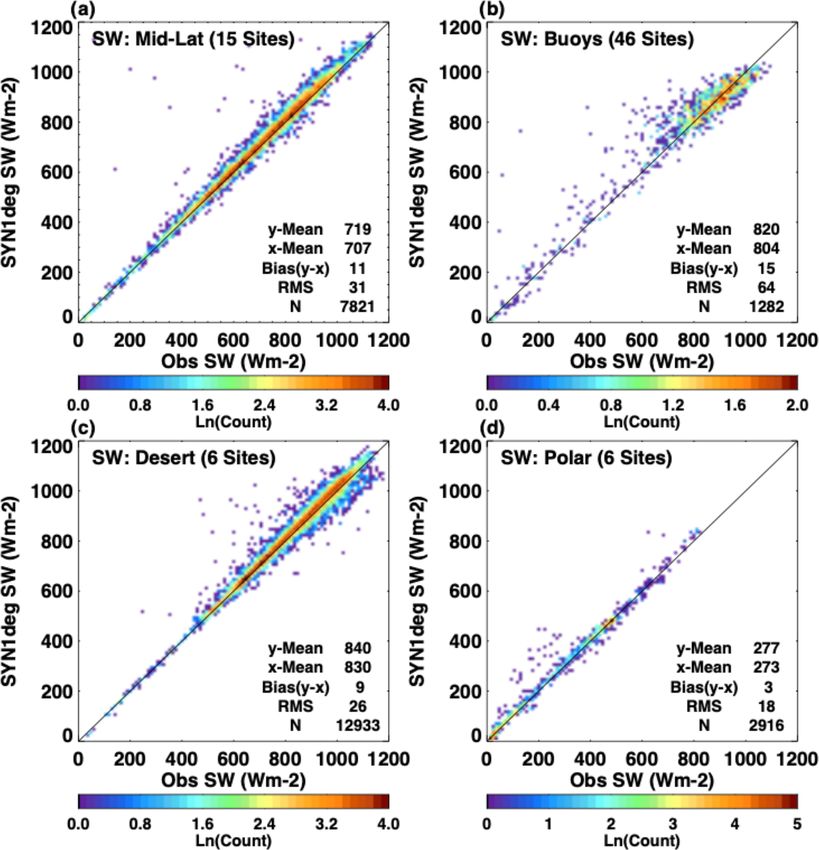
10118               D. W. Fillmore et al.: Evaluation of AOD and clear-sky radiative fluxes of the CERES SYN1deg product

Table 2. Mapping of MATCH aerosol types into radiative transfer code.

                            MATCH constituent             Langley Fu–Liou               Langley Fu–Liou
                                                          constituent                   spectral properties
                            Sea salt                      Maritime                      d’Almeida (1991)
                            Hydrophobic organic carbon    Insoluble                     OPAC
                            Hydrophilic black carbon
                                                          Soot                          OPAC
                            Hydrophobic black carbon
                            Hydrophilic organic carbon
                                                          Water soluble (WASO)          OPAC
                            Tropospheric sulfate
                            Volcanic
                                                          Suspended organic (SUSO)      OPAC
                            Stratospheric sulfate
                            Dust < 0.6 µm∗                “Small” dust                  Sinyuk et al. (2003)
                            Dust 0.5–1.25 µm∗
                            Dust 1.25–2.5 µm∗             “Large” dust                  Sinyuk et al. (2003)
                            Dust 2.5–5.0 µm∗
                          ∗ Effective radius.

Figure 2. The difference in MATCH AOD due to the assimilation of MODIS AOD. Panel (a) shows 04:00 UT minus 03:00 UT on 1 Febru-
ary 2020, and panel (b) shows 10:00 UT minus 09:00 UT on 1 February 2020. AOD is adjusted at the local solar noon within the 15◦
longitudinal band by the MODIS AOD assimilation. Wind-blown dust and sea salt differences are also apparent outside the 15◦ longitudinal
band.

2005), beginning in March 2000 from the Terra satellite and                The assimilation process begins by combining the Dark
June 2002 from both the Terra and Aqua satellites. MATCH                Target and Deep Blue AOD from MODIS (both Terra
assimilates MODIS AOD at the green wavelength of 550 nm,                and Aqua when available) and creating daily averages. As
and it combines AOD derived by the Dark Target (Levy et al.,            MATCH progresses through time, the AODs at local solar
2013) and Deep Blue algorithms (Hsu et al., 2006). A global             noon are assimilated by taking a 15◦ longitude width of re-
daily mean AOD in a 1.9◦ × 1.9◦ grid is derived from Terra              trieved AOD from the daily mean map. Examples of the mag-
and Aqua observations by simply averaging available Terra               nitude of AOD adjustments by the assimilation are shown
and Aqua AODs derived from Dark Target and Deep Blue in                 in Fig. 2. Figure 2a shows hourly AOD field differences for
a grid box. Unlike the Dark Target and Deep Blue merged                 04:00 UT minus 03:00 UT on 1 February 2020. Similarly,
product (MOD08), we do not use a quality assurance confi-               Fig. 2b shows 10:00 UT minus 09:00 UT of the same day.
dence (QAC) score to screen AOD.                                        The 15◦ vertical band is clearly visible, where red (blue)
                                                                        colors indicate that total column aerosol is increased (de-

Atmos. Chem. Phys., 22, 10115–10137, 2022                                              https://doi.org/10.5194/acp-22-10115-2022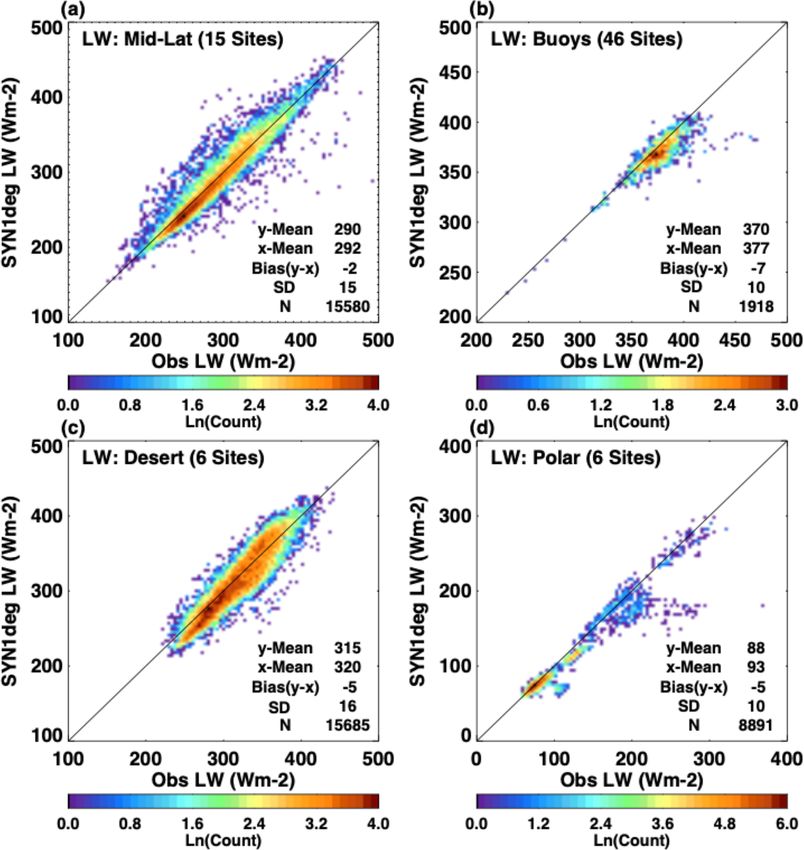
D. W. Fillmore et al.: Evaluation of AOD and clear-sky radiative fluxes of the CERES SYN1deg product                           10119

Figure 3. Climatological mean aerosol optical depth (AOD, i.e., hAODclr
                                                                    MODIS i; see Sect. 2.2 for the definition and an explanation of the
notation used) difference in (a) MERRA-2 − MODIS and (b) MATCH − MODIS averaged over the period from March 2000 through Febru-
ary 2020. MERRA-2 and MATCH daily mean AODs are sampled when the daily mean MODIS AOD from the same 1◦ ×1◦ grid is available.
Sampled daily mean AODs are subsequently averaged. MODIS AODs are averages of the MODIS Dark Target and Deep Blue algorithms
from both the Terra (MOD08) and Aqua (MYD08) data products.

creased) by the MODIS AOD assimilation. Following the                 grid box at Terra and Aqua overpass time); second, MATCH
AOD adjustment, aerosol masses in the atmospheric column              and MERRA-2 AODs are compared under all-sky condi-
through the troposphere are scaled to closely match the AOD           tions, which is only possible with modeled AODs.
derived from MODIS. Neither the vertical profile nor the                 Figure 3 shows differences in the climatological mean
relative abundance of the aerosol species is adjusted. Once           AOD between MERRA-2 and MODIS (panel a) and
aerosol mass is adjusted at the local noon for the regions            MATCH and MODIS (panel b). To compute the monthly
where MODIS AOD is available, the adjusted aerosol mass               mean AOD differences, both MERRA-2 and MATCH daily
is carried on to the next time step. Besides the MODIS ad-            mean AODs are sampled when daily mean MODIS AOD
justments, wind-driven sea salt creation and deposition are           (MODIS products MOD08 and MYD08) from the same
found along frontal boundaries in the North Atlantic and              1◦ × 1◦ grid is available (hereinafter AODclr
                                                                                                                  MODIS ). Sampled
southern oceans. The maps also indicate hourly increases and          daily mean AODs (AODclr   MODIS ) are  subsequently   averaged
decreases in high-aerosol-loading areas, such as those found          (hereinafter hAODclrMODIS i, where  the  angle   brackets indi-
around China and Southeast Asia. Episodic events such as in-          cate a simple arithmetic mean). Although both products as-
tense fires or volcanic eruptions are not specifically included       similate MODIS observations, each shows fairly significant
in the MATCH aerosol package. Such events are captured by             differences from MODIS values. Differences arise because
the assimilation of MODIS AOD, and total column aerosol               MODIS daily mean AOD is a clear-sky product at the Terra
loading is adjusted upward. The adjustment is applied to              and Aqua overpass times, whereas MERRA-2 and MATCH
AOD only. The aerosol type (and, thus, scattering proper-             daily mean AOD includes the AOD from other times of
ties) is not adjusted to reflect the reality of the scattering or     the day. When the non-overpass time is also clear, MATCH
absorbing aerosol during such an event.                               AODclr                                       clr
                                                                            MODIS should be close to MODIS AODMODIS ; however,
                                                                      when clouds are present in MATCH during non-overpass
                                                                      times, modeled AOD are used. Hence, the daily mean AOD
2.2   MATCH and MERRA-2 comparison                                    can deviate from MODIS AODclr   MODIS . In addition, AOD dif-
In this section, we compare AODs between MATCH and                    ferences for MERRA-2 at Terra and Aqua overpass times
MERRA-2 (Randles et al., 2017) in which MODIS clear-                  might be larger than MATCH even under clear-sky condi-
sky radiances are assimilated. MERRA-2 also assimilates               tions as MERRA-2 assimilates observed AOD data other
surface-observed AOD from AERONET; ship-based AOD                     than MODIS AOD when and where these events might occur.
observations; and Advanced Very High Resolution Radiome-                 While MATCH shows large positive differences over land,
ter (AVHRR) and Multi-angle Imaging SpectroRadiometer                 especially China and Southeast Asia, Australia, the Ama-
(MISR) retrievals for the years 2000–2002 and 2000–2014,              zon, and North Africa, MERRA-2 shows significant nega-
respectively. We compare AODs in two different ways: first,           tive differences over the major rain forest regions of South
MATCH and MERRA-2 AODs are compared with MODIS                        America, Africa, and the tropical western Pacific. Both
AODs, which tests the consistency of daily means when                 products are closer to MODIS AOD over ocean compared
MODIS AOD is available (i.e., clear sky somewhere in the              with hAODclrMODIS i over land except that MERRA-2 shows

https://doi.org/10.5194/acp-22-10115-2022                                          Atmos. Chem. Phys., 22, 10115–10137, 2022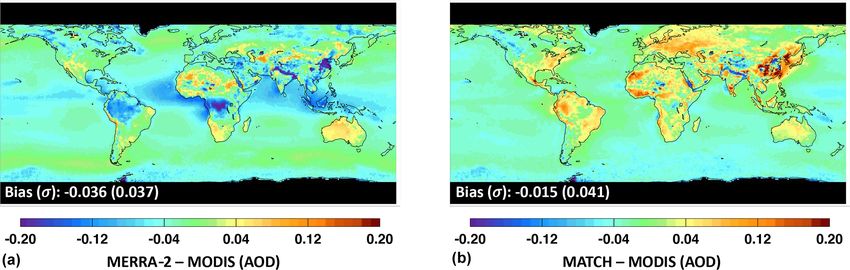
10120 D. W. Fillmore et al.: Evaluation of AOD and clear-sky radiative fluxes of the CERES SYN1deg product
a negative difference across the Indian Ocean and off the AODclr
MODIS . The larger difference between MATCH and
west coast of Africa in the Atlantic Ocean. When MODIS MERRA-2 AODall over convective regions originated from
AODclr MODIS is available in the grid box, MATCH weighs the merged AOD product used for the assimilation. Of pri-
MODIS AOD heavily in its assimilation at local solar noon mary importance to radiative transfer calculations within the
so that MATCH AOD is nearly identical to MODIS AOD SYN1deg product is the ability of the MATCH model to ac-
at the local noon in clear-sky regions. Consequently, the curately represent the total column AOD. To test the overall
difference in the climatological global mean MATCH and accuracy, we use observations from the AERosol RObotic
MODIS AODclr MODIS (−0.015) is smaller than the difference NETwork (AERONET). AERONET is a global federation of
in MERRA-2 and MODIS AODclr MODIS (−0.036). ground-based remote sensing sites developed by NASA and
Figure 4 shows the difference in AODclr MODIS more clearly. now supported by a number of institutions around the world
In Fig. 4, AODclrMODIS values are compared directly using a (Holben et al.. 1998). Each site maintains a CIMEL sun pho-
log-density plot, where each point represents a comparison tometer that scans the daytime sky every 20 min. Collected
for the daily average of a given grid box: MERRA-2 versus data are processed according to standards of calibration and
MODIS is shown in Fig. 4a, and MATCH versus MODIS is processing maintained by the AERONET project. Here, we
shown in Fig. 4b. Figure 4 indicates that MATCH AODclr MODIS utilize Level 2.0, data that have been screened for clouds and
has a smaller bias with respect to the MODIS AOD than the quality assured (Smirnov et al., 2000).
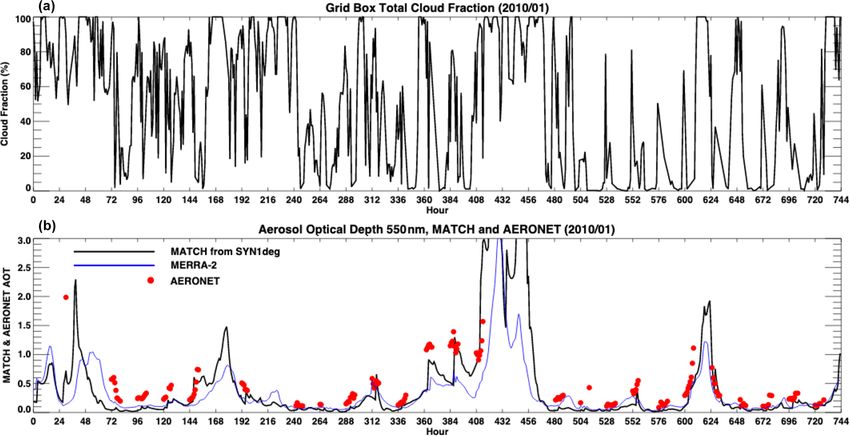
MERRA-2 AOD but has approximately the same root-mean- Figure 6 shows an hourly time series of AOD from
square (RMS) difference as the MERRA-2 AODclr MODIS . MATCH, MERRA-2, and AERONET for January 2010 at
We now consider the differences between the MATCH and the Beijing (China) AERONET site. Figure 6a shows the
MERRA-2 climatological AOD fields for all-sky and esti- cloud fraction time series derived from MODIS and geo-
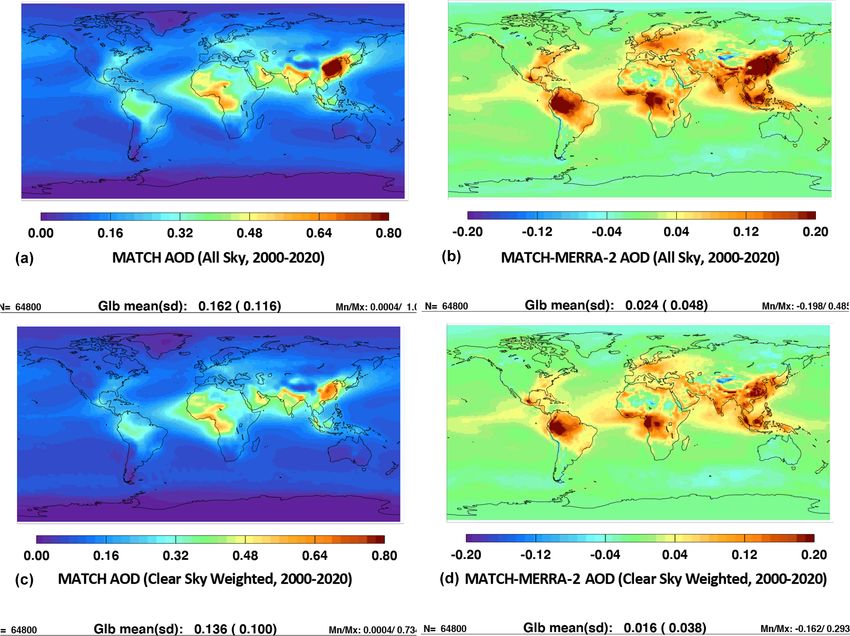
mated clear-sky conditions more directly. Figure 5 shows stationary imagers (GEOS) from the SYN1deg Edition 4.1
1◦ × 1◦ climatological mean maps of MATCH AOD (pan- product (Rutan et al., 2015), and Fig. 6b shows the AOD time
els a and c) and its difference from MERRA-2 (panels b series. Generally, both models produce a large variability in
and d) for all-sky (panels a and b) and estimated clear-sky AOD at this site fairly well over the course of the month.
(panels c and d) conditions for March 2000 through Febru- While both MERRA-2 and MATCH AODs increase near
ary 2020. A clear-sky-area-weighted monthly mean AOD is times when the cloud fraction approaches 100 %, the increase
derived by averaging the daily mean AOD weighted by the in the MATCH AOD, which correlates relatively well with
clear fraction (hereinafter AODclrMODIS , where the overbar in- the increase in AERONET AOD, is larger than the increase
dicates a monthly mean); here, the clear fraction is derived in MERRA-2 AOD. Although the temporal correlation co-
from MODIS on Terra and Aqua (Loeb et al., 2020; Min- efficient of the MATCH and AERONET AODs is smaller at
nis et al., 2020). MATCH all-sky AOD (hereinafter AODall ) this site during summer months than during winter months
is larger than MERRA-2 AODall , particularly over the rain (not shown), a good temporal correlation between MATCH
forest regions of the globe as well as India and China. Al- and AERONET AODs is consistent across most of the lo-
cations and times that we considered. To show this statisti-
though the difference is smaller, the difference in AODclr
MODIS cally, in the following, we extend this analysis to a number
shows a similar spatial pattern (Fig. 5d) to the all-sky differ-
of AERONET sites grouped geographically based on general
ence. This is consistent with Fig. 3, showing that MERRA-
aerosol type.
2 AODclr MODIS underestimates AOD with respect to MODIS AODs from AERONET are nominally provided at eight
AODclr MODIS . A larger difference in MATCH AOD over con- spectral channels every 20 min, given favorable conditions.
vective regions (e.g., the Amazon, central Africa, and South-
We use two channels to derive observed AOD at 550 nm for
east Asia) is caused by how Dark Target and Deep Blue
comparison with the AOD provided by the MATCH model.
AOD are merged. As mentioned earlier, we do not use QAC
Because the SYN1deg radiative transfer calculation is done
to screen AOD. Convective clouds introduce a larger uncer-
hourly, we average any observations within a given hour pe-
tainty to AOD because of a 3D radiative effect or poor fit
riod centered on the 30th minute for each site co-located
to observations with retrieved AOD (Robert Levy, personal
within a SYN1deg grid box. The AERONET sites chosen
communication, 2020). For these situations, AODs associ-
are shown in Fig. 7, with a complete listing of all sites given
ated with QAC scores less than two are screened out in the
in Appendix A. Although we examine 55 sites over more
MOD08 Dark Target and Deep Blue merged product (Levy
than 20 years, we aggregate the statistics within continen-
et al., 2013).
tal regions which naturally isolates them by general climatic
conditions. Tables 3 and 4 show comparisons for each site
grouping for clear-sky (less than 1 % cloud identified by
2.3 Comparison with AERONET MODIS and geostationary satellites in the SYN1deg grid
The above results indicate that both MATCH AODclr box) conditions and for all-sky (any cloud condition within
MODIS and
the SYN1deg grid box) conditions, respectively. Using clear-
MERRA-2 AODclr
MODIS are generally smaller than MODIS
Atmos. Chem. Phys., 22, 10115–10137, 2022 https://doi.org/10.5194/acp-22-10115-2022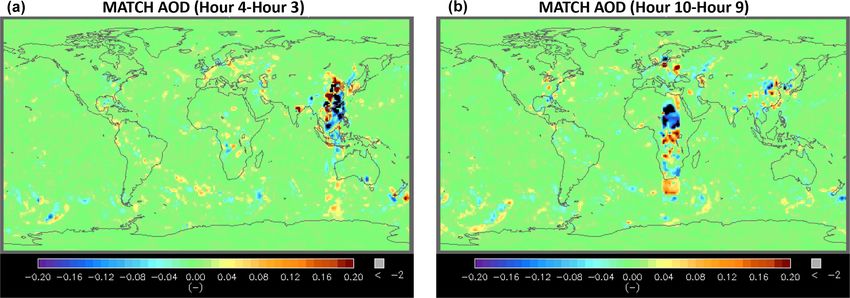
D. W. Fillmore et al.: Evaluation of AOD and clear-sky radiative fluxes of the CERES SYN1deg product                             10121

Figure 4. Scatterplot of daily 1◦ ×1◦ mean AOD from (a) MERRA-2 and (b) MATCH versus AOD derived from MODIS on Terra and Aqua
for March 2000 through February 2020. MODIS AODs are 1◦ × 1◦ daily averages derived by the Dark Target and Deep Blue algorithms.
Only days and grid boxes that have MODIS AOD (i.e., AODclr
                                                       MODIS , as defined in the text) are used.

Figure 5. (a, c) Climatological mean AOD from MATCH and (b, d) the difference between MATCH and MERRA-2 (MATCH − MERRA-
2). Panels (a) and (b) show the all-sky results (AODall
                                                      MODIS ), and panels (c) and (d) show maps of the clear-sky-area-weighted average of
            clr
AOD (AODMODIS ). Clear-sky-weighted monthly mean AOD is derived by averaging the daily mean AOD weighted by the daily 1◦ × 1◦
gridded mean clear fraction, where the clear fraction is derived from the MODIS-based cloud fraction on Terra and Aqua.

https://doi.org/10.5194/acp-22-10115-2022                                           Atmos. Chem. Phys., 22, 10115–10137, 2022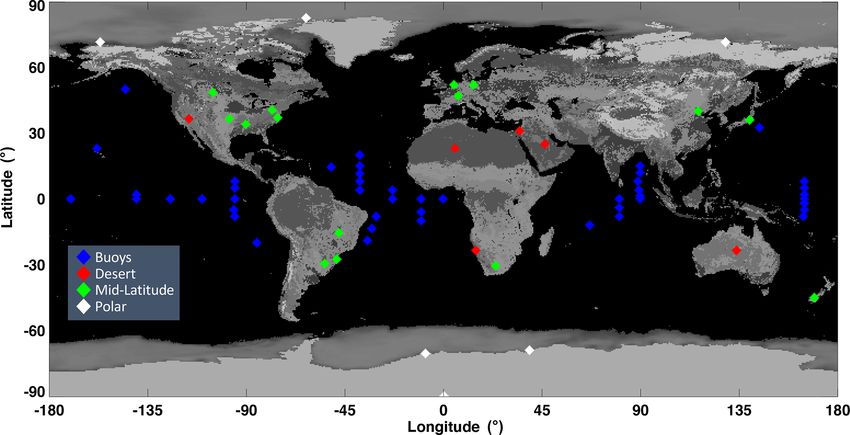
10122              D. W. Fillmore et al.: Evaluation of AOD and clear-sky radiative fluxes of the CERES SYN1deg product

Figure 6. Hourly time series of the (a) grid box cloud fraction from the SYN1deg Edition 4.1 CERES product and (b) AOD. Results are
from the grid box containing the AERONET Beijing (China) site. The black line represents MATCH, the blue line represents MERRA-2,
and the red dots represent AERONET observations. MATCH and, to a lesser degree, MERRA-2 often have large increases in AOD when the
cloud fraction nears 100 %.

Figure 7. The location of AERONET sites and how they are grouped for calculations of the mean, bias, and RMS with respect to the MATCH
and MERRA-2 optical depths found in Tables 3 and 4.

sky scenes identified by MODIS only gives the same sta-              February 2020. For comparison purposes, we show the same
tistical results with a lower number of samples. Statistics          statistics derived from observations compared to MERRA-
shown in Tables 3 and 4 are the average observed value, mean         2 AODs using the identical hours. We note, however, that
bias (MATCH − observation), root-mean-square (RMS) dif-              MERRA-2 assimilates AERONET, whereas MATCH AODs
ference, and the correlation coefficient (R) over the time pe-       are independent of AERONET AODs. MATCH AOD for the
riod from March 2000 through February 2020. The actual               Brazil group is biased high by 0.02, and the China/Korea
time period varies depending on the site due to AERONET              group has no appreciable bias compared with AERONET
data availability. The RMS difference and correlation coef-          AODs. These two regions have a relatively large bias in
ficient are computed by each site with hourly mean values            hAODclr MODIS i from MATCH compared with MODIS AODs
where observations are available from March 2000 through             (Fig. 3b). In contrast, the negative bias values of MERRA-

Atmos. Chem. Phys., 22, 10115–10137, 2022                                             https://doi.org/10.5194/acp-22-10115-2022
D. W. Fillmore et al.: Evaluation of AOD and clear-sky radiative fluxes of the CERES SYN1deg product 10123
2 AODs compared with AERONET AODs for Brazil, cen- AODs because MATCH AODs are positively biased and
tral Africa, and China/Korea groups are consistent with the MERRA-2 AODs are negatively biased for the Brazil group.
negative bias in MERRA-2 hAODclr MODIS i compared with The result underscores the difficulty involved in deriving
MODIS AODs (Fig. 3a). For the China/Korea group, the accurate AODs, which appear to involve requirements in
RMS difference between MATCH AODs and AERONET addition to the identification of clear-sky scenes. Levy et
AODs is 0.18, and the correlation coefficient is 0.7. These al. (2013) list the factors lowering the QAC score as (1) pix-
values are worse than their counterparts from MERRA-2 els are thrown out due to cloud masking, (2) the retrieval
versus AERONET AODs: summertime agreement between solution does not fit the observation well, and (3) the solu-
MATCH and AERONET AODs is worse if a similar plot to tion is not physically plausible given the observed situation.
Fig. 6 is created for summertime, as hygroscopic aerosols are Therefore, even though the difficulty in identifying clear-sky
dominant under high-relative-humidity conditions. scenes is driven by cloud contamination by trade cumulus
The sign of the MATCH AODs compared to AERONET (Loeb et al., 2018), the difficulty in deriving AODs exists
AODs for all-sky conditions is generally consistent with the over convective regions (Varnai et al., 2017) as well.
sign of their clear-sky counterparts. The RMS difference un- Larger positive biases of MATCH AODs compared with
der all-sky conditions is generally larger than the clear-sky AERONET AODs exist over Africa (Tables 3, 4). For North
RMS difference, while the correlation coefficient is nearly Africa, the bias is known to be caused by excessive dust
the same. The biases for MERRA-2 comparisons are gener- generated by the MATCH algorithm. Even though modeled
ally comparable to MATCH, although the RMS values for aerosols are not often used over North Africa owing to the
MERRA-2 tend to be slightly smaller and correlations tend abundance of clear-sky conditions, the dust problem leads
to be higher, due in part to the assimilation of AERONET to a larger positive AOD bias. In addition, MATCH uses
into the MERRA-2 model. fixed aerosol sources in time. Therefore, it tends to miss large
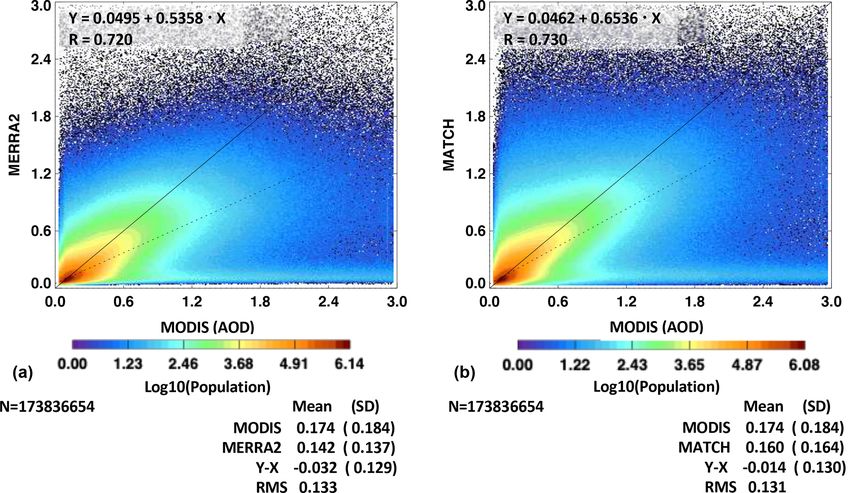
Results for all points across all sites and times are shown aerosol events, such as forest fires, until clear-sky conditions
in Fig. 8. The color density plots are on a log scale and in- occur, allowing observations of the event by MODIS. This
dicate that the vast majority of observations have an AOD of leads to a larger RMS difference and lower correlation co-
less than 1 for both the clear- and all-sky conditions observed efficient with AERONET AODs compared with those from
within the SYN1deg grid box. Biases are less than 10 % of MERRA-2 versus AERONET.
the mean value, but the RMS is large relative to the mean ob- Because MODIS AODs are not generally available un-
served value. The overall correlation is approximately 0.8. der overcast conditions, the reliance on modeled AOD in-
The clear-sky hours (where SYN1deg estimated less than creases as the cloud fraction over a 1◦ × 1◦ grid increases.
1 % cloud in the grid box based on MODIS and GEOS ob- Figure 6, which shows that AERONET AOD increases with
servations) represent a little more than 10 % of the overall cloud fraction derived from satellites, indicates that as the
points. When MATCH AOD is compared to MERRA-2 AOD cloud fraction over a 1◦ × 1◦ grid increases, AOD over the
(not shown), MATCH is biased approximately 10 % higher. clear-sky portion of the grid increases. In addition, Fig. 6 sug-
gests that modeled AODs under near-overcast conditions are
significantly larger than clear-sky AODs that are constrained
3 Discussion of AOD differences by MODIS observations. Because we are unable to evaluate
AODs for overcast conditions, we assess AOD changes with
In this section, we investigate the reason for the AOD dif- cloud fraction using ground-based observations. Figure 9
ferences shown in the previous section. In addition, we esti- shows the distribution of AERONET AODs for clear-sky and
mate the effect of the AOD differences on surface irradiances all-sky conditions as well as the precipitable water derived
when MATCH AODs are used for surface irradiance compu- from a microwave radiometer separated by these two con-
tations. ditions. Clear-sky is identified by the Long–Ackerman algo-
Generally, cloud contamination in MODIS AODs is rithm (Long et al., 2006) that uses surface direct and diffuse
caused by unresolved sub-pixel-scale clouds (Kaufman et al., irradiances. Figure 9 shows that AOD and precipitable water
2005; Martins et al., 2002). Therefore, the difference shown under all-sky conditions are significantly larger than those
over convective regions seems to be caused by the uncer- under clear-sky conditions. When we use the cloud fraction
tainty due to 3D radiative effects that impact retrieved AODs derived from satellite observations and plot AOD and pre-
by unknown amounts (Wen et al., 2007), by errors in esti- cipitable water as a function of the cloud fraction using the
mating the fraction of hygroscopic aerosols, or by errors in same grid box where the ground site is located, AOD and
estimating water uptake by hygroscopic aerosols (Su et al., precipitable water increase with the cloud fraction (Fig. 10).
2008; Marshak et al., 2021). Larger AODs are screened out in Therefore, the increasing AOD with cloud fraction shown in
the MOD08 data product, whereas the CERES team uses all Fig. 6 is qualitatively explained by the increasing AOD of hy-
retrieved AODs regardless of the QAC score, likely increas- groscopic aerosols with relative humidity. However, Fig. 10
ing MATCH AOD overall. The comparison with AERONET indicates that either the growth of MATCH AOD is too strong
AODs is not decisive to determine how to screen MODIS
https://doi.org/10.5194/acp-22-10115-2022 Atmos. Chem. Phys., 22, 10115–10137, 2022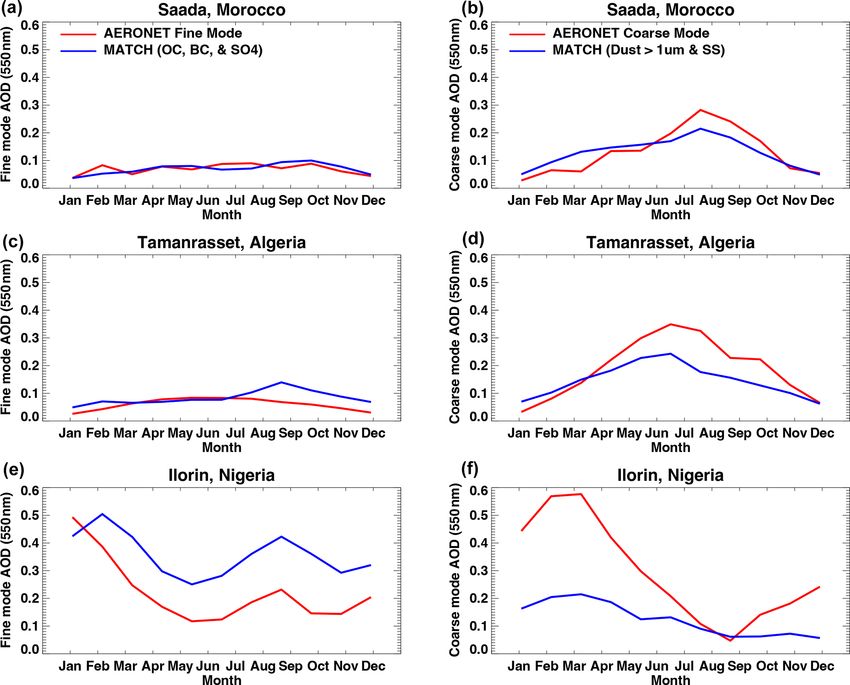
10124                     D. W. Fillmore et al.: Evaluation of AOD and clear-sky radiative fluxes of the CERES SYN1deg product

Table 3. Hourly AERONET station statistics for MATCH and MERRA-2 for continental groups under clear-sky conditions∗ .

                                                                                                                     MATCH                             MERRA-2
      Site                                     Predominant                    Number        Observed           Bias      RMS        R2             Bias      RMS        R2
                                               aerosol type                                  average
      Australia (5 sites)                      Dust, smoke                      20 925          0.06          0.01        0.06      0.4          0.03        0.05       0.7
      Brazil (7 sites)                         Smoke, polluted                   6554           0.14          0.02        0.10      0.8         −0.02        0.08       0.9
      Central Africa (5 sites)                 Smoke                             2139           0.70         −0.10        0.24      0.9         −0.10        0.24       0.9
      North Africa (5 sites)                   Dust                             10 047          0.17          0.07        0.15      0.7          0.02        0.10       0.8
      China/Korea (8 sites)                    Polluted                          2827           0.26         −0.00        0.18      0.7         −0.03        0.15       0.8
      India/Southeast Asia (6 sites)           Smoke, polluted                   3010           0.51         −0.09        0.28      0.6         −0.10        0.24       0.8
      North America (9 sites)                  Continental, polluted            21 429          0.10         −0.00        0.07      0.7          0.00        0.06       0.8
      Europe (10 sites)                        Continental, polluted            10 211          0.13          0.01        0.07      0.7         −0.02        0.05       0.8
    ∗ The time period used is from March 2000 through April 2020, although the actual period varies by site depending on AERONET data availability. Clear sky is identified by
    MODIS and geostationary satellites, and the cloud fraction is less than 1 % over a SYN1deg grid box.

Table 4. Hourly AERONET station statistics for MATCH and MERRA-2 for continental groups under all-sky conditions∗ .

                                                                                                                     MATCH                             MERRA-2
      Site                                     Predominant                    Number        Observed           Bias      RMS        R2             Bias      RMS        R2
                                               aerosol type                                  average
      Australia (5 sites)                      Dust, smoke                    110 523           0.09          0.00        0.09      0.5          0.02        0.07       0.8
      Brazil (7 sites)                         Smoke, polluted                 72 656           0.25          0.03        0.23      0.8         −0.04        0.18       0.9
      Central Africa (5 sites)                 Smoke                           41 193           0.55         −0.07        0.26      0.8         −0.10        0.26       0.9
      North Africa (5 sites)                   Dust                            43 205           0.23          0.08        0.20      0.7          0.01        0.14       0.8
      China/Korea (8 sites)                    Polluted                        52 287           0.45          0.01        0.31      0.7         −0.08        0.27       0.8
      India/Southeast Asia (6 sites)           Smoke, polluted                 44 534           0.61         −0.06        0.32      0.6         −0.10        0.32       0.7
      North America (9 sites)                  Continental, polluted          160 356           0.13          0.02        0.13      0.6          0.00        0.09       0.7
      Europe (10 sites)                        Continental, polluted          175 010           0.18          0.04        0.14      0.6         −0.02        0.08       0.8
    ∗ The time period used for the statistics is from March 2000 through April 2020, although the total sample varies by site depending on AERONET data availability.

or the modeled MATCH AOD under all-sky conditions is too                                    buoy data are made available from the Pacific Marine Envi-
large.                                                                                      ronmental Lab (PMEL) (McPhaden, 2002; McPhaden et al.,
                                                                                            2009) and the Woods Hole Oceanographic Institute (WHOI)
                                                                                            (Colbo and Weller, 2009). A complete listing is given in Ap-
4    Clear-sky comparisons of SYN1deg and                                                   pendix A.
     surface-observed irradiances
                                                                                            4.1     Shortwave comparisons
We consider the impact of MATCH aerosols on com-
puted surface irradiances by comparing calculated hourly                                    We begin with a simple sensitivity calculation of AOD
mean surface downward irradiances from the Edition 4.1                                      on surface downward shortwave irradiance (DSI). Fig-
SYN1deg-1Hour product to observations of downward ir-                                       ure 12 shows a series of radiative transfer calculations using
radiance. In a 1◦ × 1◦ grid box with an approximate size                                    the online Langley Fu–Liou radiative transfer code (https:
of 111 km2 , 100 % clear sky sampled over 1 h as deter-                                     //cloudsgate2.larc.nasa.gov/cgi-bin/fuliou/runfl.cgi, last ac-
mined by MODIS or geostationary satellites is relatively rare.                              cess: 3 August 2022) with an open shrub spectral albedo
Nonetheless, by grouping sites based on general surface con-                                (broadband albedo of 0.14 at µ0 = 1.0), “continental”
ditions and analyzing 20 years of data, sufficient samples                                  aerosol, and no clouds. Values on the solid black line are
are found. Figure 11 shows the sites, grouped by color, in-                                 calculated DSI with an AOD of 0.09 at six different so-
cluding 15 land sites labeled “midlatitude” (green), 6 sites                                lar zenith angles. Calculations were then done for AODs
labeled “desert” (red), 6 sites labeled “polar” (white), and                                of 0.0 and 0.18 at the same solar zenith angles, representing
46 buoys (blue). Surface-observed shortwave irradiance from                                 100 % error bounds of mean AODs derived from AERONET,
the land sites comes from the Baseline Surface Radiation                                    as found in Tables 3 and 4 for the Australian sites where
Network (Ohmura et al., 1998; Driemel et al., 2018), and                                    the RMS is approximately equal to the observed average of

Atmos. Chem. Phys., 22, 10115–10137, 2022                                                                         https://doi.org/10.5194/acp-22-10115-2022
D. W. Fillmore et al.: Evaluation of AOD and clear-sky radiative fluxes of the CERES SYN1deg product 10125 Figure 8. All-sky (a, c) and clear-sky (b, d) comparisons of observed (AERONET) hourly mean optical depths to estimates from the MATCH model for more than 20 years at the 55 AERONET sites shown in Fig. 7. AOD. Orange and red shaded areas indicate a potential bias where the ground site is located. Thus, when satellites did not in DSI at a given solar zenith angle (SZA). Irradiance val- detect clouds over the 1 h period within the grid box, we com- ues scale nearly linearly with Cos(SZA) between these lim- pared computed and observed hourly mean downward short- its. Figure 12 shows that the error remains nearly constant wave irradiances. DSI is nominally measured by a shaded until a µ0 = 0.5, where it begins to decrease as insolation pyranometer combined with the direct insolation measured decreases. However, due to small downward irradiances at by a pyrheliometer on a solar tracker. Although satellites may large solar zenith angles, the percentage error increases. indicate clear sky, clouds might have been present within the Figure 13 shows hourly comparisons of computed clear- field of view of the pyranometer, increasing diffuse radiation. sky downward shortwave irradiance compared to observa- This would increase observed DSI; hence, modeled irradi- tions for the groups of sites shown in Fig. 11. In general, ance would be smaller. To verify, we used the ground-based the calculated irradiance is larger than observed. We find cloud-screening algorithm developed by Long and Acker- that in every grouping, SYN1deg calculations tend to be too man (Long et al., 2006) to further screen clouds. For the transmissive, overestimating DSI by between 3 W m−2 (po- land groupings, Table 5 shows the bias (RMS) in the DSI lar sites) and 15 W m−2 (ocean buoys) with midlatitude and where both the satellite and surface-observed cloud fractions desert sites each overestimating DSI by ∼ 10 W m−2 . This equal 0.0. Although the mean bias did not change signifi- points to the possibility that MATCH is weighted too far to- cantly, the RMS in both the midlatitude and desert sites was wards scattering aerosols and has too few absorbing aerosols. reduced by half due to the more stringent cloud screening. Clear-sky scenes used for Fig. 13 are those identified by MODIS and geostationary satellites over the 1◦ grid box https://doi.org/10.5194/acp-22-10115-2022 Atmos. Chem. Phys., 22, 10115–10137, 2022
10126                D. W. Fillmore et al.: Evaluation of AOD and clear-sky radiative fluxes of the CERES SYN1deg product

Figure 9. (a) The 15 min mean precipitable water distributions from microwave radiometer observations at the Atmospheric Radiation
Measurement (ARM) Southern Great Plains (SGP) E13 site under all-sky and clear-sky conditions. (b) The 15 min mean AOD distributions
from AERONET sun photometer measurements at 550 nm. “Clear sky” is defined here as a 15 min time period where the surface radiometry-
based cloud fraction, from the Long et al. (2006) methodology, equals zero.

                                                                       Table 5. Bias (RMS) of the clear-sky surface shortwave calculation
                                                                       compared with observation∗ (in W m−2 ).

                                                                             Cloud analysis                 Midlatitude         Desert      Polar
                                                                             Satellite                         11 (31)          9 (26)      3 (18)
                                                                             Satellite and surface             11 (16)          8 (15)      4 (19)
                                                                           ∗ Sample is based on 20 years of calculations when either satellite or
                                                                           satellite and surface cloud analysis indicates 0 % cloud.

Figure 10. AOD and precipitable water (PW) as a function of            cept for the polar region, where DLI is very sensitive to near-
cloud fraction over the 1◦ × 1◦ grid box where the ARM SGP E13         surface air temperature, the bias and standard deviations of
and SURFRAD (SURFace RADiation program) Bondville, IL, sites
                                                                       the DLI are smaller than the shortwave equivalents in terms
are located. Closed and open blue circles are AOD derived from
AERONET and MATCH AOD, respectively. Closed red circles are
                                                                       of both watts per square meter (W m−2 ) and the percentage
observed PW from either a microwave radiometer or CIMEL sun            of the mean observation. Depending on aerosol type, DLI
photometer, and open red circles are PW from the GEOS-5.4.1 re-        is less sensitive to total AOD. For example, a doubling of
analysis. Cloud fractions are derived from MODIS and geostation-       AOD (0.2 to 0.4) for a continental aerosol type results in a
ary satellites. Black dots are the mean cosine solar zenith angle of   DLI change of only 0.2 W m−2 . However, Table 6 outlines
the time of AOD and PW observations. AOD and PW are normal-            the sensitivity of DLI (and DSI) to changes in dust particle
ized to their maximum value for display.                               size and shows that a change in aerosol type results in up to
                                                                       a 10 W m−2 change in DLI.
                                                                          DLI is, thus, more sensitive to aerosol type in certain re-
4.2   Longwave comparisons                                             gions of the globe where there is substantial dust. To see the
                                                                       potential impact on DLI, Fig. 15 shows calculated longwave
In this section, we consider the implications of errors in AOD         downward radiative forcing (clear minus pristine calcula-
and aerosol type on longwave LFLRT calculations as found               tions) at 57 AERONET sites across the 20 years of SYN1deg
in the SYN1deg product. Figure 14 shows SYN1deg surface                data under consideration. The northwestern African sites
downward longwave irradiance (DLI) calculations compared               (where dust is found seasonally) are shown as red boxes, and
to surface observations similar to those shown in Fig. 13. Ex-         one clearly sees larger longwave forcing at these sites. Given

Atmos. Chem. Phys., 22, 10115–10137, 2022                                                  https://doi.org/10.5194/acp-22-10115-2022
D. W. Fillmore et al.: Evaluation of AOD and clear-sky radiative fluxes of the CERES SYN1deg product 10127
Figure 11. The location of surface observations of downwelling shortwave irradiance used to compare the SYN1deg Edition 4.1 calculations
to observations for all available hours (from March 2000 through December 2019) for which the SYN1deg cloud analysis determines the
hour and grid box to be 100 % clear sky.
groupings of AOD species from the MATCH model output.
To undertake a comparison with the AERONET fine-mode
observations, we plot the sum of the MATCH AOD due to
organic carbon (OC), black carbon (BC), and sulfate (SO4 ).
We compare the sum of MATCH AOD large dust particles
(> 1 µm) along with sea salt (although sea salt is essentially
zero over land) to the coarse-mode AERONET optical depth.
All AOD values are at 550 nm.
Figure 16 indicates that resultant fine-mode and coarse-
mode comparisons are encouraging, but the agreement is
Figure 12. Calculated DSI error at the surface computed with the site dependent. In general, MATCH is capturing seasonal
LFLRT model due to the error in AODs. AOD is assumed to be 0.09. changes in fine-mode and coarse-mode particles at these
The respective light and dark orange shading indicate positive and sites, but the magnitude of the AOD values is biased.
negative errors (in W m−2 ; left axis) due to 100 % AOD errors. The
shaded areas are computed with AODs of 0.0 (a −100 % error) and
0.18 (a +100 % error) at the same solar zenith angles, representing 4.3 CERES TOA and Energy Balanced and Filled
100 % error bounds. Values on the solid black line are calculated (EBAF) surface product comparison
DSI (right axis) with an AOD of 0.09 at six solar zenith angles.
CERES instruments observe TOA irradiances, which can be
used to assess the bias in computed irradiance. Global annual
Table 6. The effect of dust particle size on surface irradiance mean clear-sky TOA irradiances derived from CERES ob-
calculations∗ . servation averaged over 20 years from March 2000 through
February 2020 are 53 W m−2 for reflected shortwave ir-
Dust particle size (reff )
radiance and 268 W m−2 for emitted longwave irradiance.
0.5 µm 2.0 µm 8.0 µm The corresponding computed reflected shortwave flux is
DLI 352 W m−2 359 W m−2 (+2.0 %) 362 W m−2 (+2.8 %) 51 W m−2 , and the emitted longwave flux is 267 W m−2 . In-
DSI 1046 W m−2 1038 W m−2 (−0.7 %) 1020 W m−2 (−2.5 %) sight into the surface irradiance errors may be gained by
∗ The radiative transfer code is run for a midlatitude summer atmosphere, open shrub surface considering how surface irradiance is modified via the tun-
albedo, aerosol scale height of 1.5 km, clear sky, and cosine solar zenith angle of 1.0. AOD is
fixed at 0.2 for all calculations. ing algorithm to match TOA irradiance in the CERES En-
ergy Balanced and Filled (EBAF) surface product (Kato et
al., 2018). After known biases are taken out, the adjustment
the importance of particle size for the longwave effect, we of temperature and specific humidity profiles, surface and
check MATCH particle size against AERONET fine-/coarse- aerosol properties are derived based on their preassigned
mode retrievals for several of the African AERONET sites. uncertainty and the difference between computed and ob-
Figure 16 plots canonical mean observations of fine- and served TOA shortwave and longwave irradiance using the
coarse-mode AOD from three AERONET sites along with Lagrange multiplier approach. To match the computed short-
https://doi.org/10.5194/acp-22-10115-2022 Atmos. Chem. Phys., 22, 10115–10137, 202210128 D. W. Fillmore et al.: Evaluation of AOD and clear-sky radiative fluxes of the CERES SYN1deg product Figure 13. Comparisons of DSI at the surface from the SYN1deg Edition 4.1 calculations (y axis for all plots) and Baseline Surface Radiation Network (BSRN) and buoy surface sites (x axis all plots). Data are from March 2000 through February 2020 and only include hours when a 1◦ grid box is 100 % clear sky according to the SYN1deg cloud fraction. wave and longwave fluxes, AOD is increased from 0.136 negatively biased by 0.01 (Europe). Therefore, increasing to 0.156 (global annual mean values) and precipitable wa- MATCH AODs by 0.02 on average for the midlatitude group ter is decreased from 2.29 to 2.22 cm (global annual mean seems justifiable. However, a decrease of 2 W m−2 for the values). These adjustments change the downward shortwave diurnally averaged downward shortwave is smaller than the irradiance from 244 to 243 W m−2 . 11 W m−2 bias shown in Fig. 13a, although instantaneous ir- To analyze how the EBAF tuning process changes surface radiances are used for Fig. 13. The positive bias found in the irradiance, AOD, and precipitable water, we computed the downward shortwave irradiance for the North African group mean change separated by surface group shown in Fig. 11. (Fig. 13c) is not consistent with the positive bias in the AOD Generally, AOD increases and precipitable water decreases shown in Table 3 under clear-sky conditions. to increase reflected shortwave flux, which in turn decreases The adjustment made to match TOA shortwave irradiance surface downward shortwave irradiance over these regions in the EBAF product is within the uncertainty of MODIS- (Table 7). For the midlatitude group, on average, AOD is in- derived AOD of ±0.05 over land and ±0.03 over ocean (Re- creased by 0.02, precipitable water is decreased by 0.06 cm, mer et al., 2008; Levy et al., 2010, 2013). However, these and surface albedo is increased by 0.03. These adjustments values are expected errors of instantaneous AOD retrieval de- reduce the diurnally averaged downward shortwave irradi- rived from the comparison of AODs with AERONET. There- ance at the surface by 2 W m−2 . We do not have exact fore, the bias averaged over ground sites and many years is matches of BSRN and AERONET surface sites, but Ta- expected to be much smaller. Although, the 0.03 AOD ad- bles 3 and 4 show that MATCH AODs have either no bias justment over ocean might be the upper limit of the uncer- (North America, China, and Southeast Asia) or are slightly tainty of MODIS AODs over ocean, the 16 W m−2 bias in Atmos. Chem. Phys., 22, 10115–10137, 2022 https://doi.org/10.5194/acp-22-10115-2022
D. W. Fillmore et al.: Evaluation of AOD and clear-sky radiative fluxes of the CERES SYN1deg product                            10129

Figure 14. Comparisons of longwave downward irradiance at the surface from the SYN1deg Edition 4.1 calculations (y axis for all plots)
and BSRN and buoy surface sites (x axis all plots). Data are from March 2000 through February 2020 and only include hours when a 1◦ × 1◦
grid box is 100 % clear sky according to the SYN1deg cloud fraction.

Figure 15. The clear-sky direct radiative effect (clear minus pristine) in downward longwave irradiance averaged from 2000 through 2020,
when AERONET observations are available. Boxes indicate the average, and the vertical bar is ±1 standard deviation. Black boxes indicate
all 57 AERONET sites, and red boxes indicate sites in northwestern Africa.

the instantaneous downward shortwave irradiance seems to              comparison with surface observations, potential issues are as
be larger than the 2 W m−2 reduction in the diurnally aver-           follows: (1) the aerosol type and optical properties used in
aged downward shortwave irradiance.                                   irradiance computations and (2) the bias in downward short-
   While we cannot identify the cause of the discrepancy be-          wave irradiance measured by pyranometer, especially diffuse
tween AOD comparison and downward shortwave irradiance                irradiance at smaller solar zenith angles. Because of the tem-

https://doi.org/10.5194/acp-22-10115-2022                                           Atmos. Chem. Phys., 22, 10115–10137, 2022
10130               D. W. Fillmore et al.: Evaluation of AOD and clear-sky radiative fluxes of the CERES SYN1deg product

Figure 16. Canonical monthly means across 20 years (2000–2020) showing AERONET fine-mode (a, c, e) and coarse-mode (b, d, f) AOD
at 550 nm compared with MATCH constituents. MATCH values represent summations of organic carbon (OC), black carbon (BC), and
sulfate (SO4 ) for fine-mode comparisons, and they represent large dust particles (> 1 µm) and sea salt for coarse-mode comparisons.

Table 7. Radiative flux, aerosol optical depth (AOD), precipitable water, and surface albedo change to match observed TOA radiative fluxes.

                                                                   Changes: adjusted − unadjusted
                       Site          Observed      Clear-sky    Clear-sky     Clear-sky     Clear-sky     Clear-sky
                                        TOA           TOA         surface       AOD        precipitable    surface
                                       upward        upward     downward                   water (cm)      albedo
                                     shortwave     shortwave    shortwave
                                     irradiance    irradiance   irradiance
                                      (W m−2 )      (W m−2 )     (W m−2 )
                       Midlatitude      63.3          3.9          −2.0          0.02         −0.06          0.03
                       Desert           92.3          3.4          −1.7          0.02         −0.04          0.01
                       Polar            86.5          8.2          −0.2          0.01         −0.03          0.10
                       Buoys            42.0          1.6          −2.0          0.03         −0.12          0.00

perature gradient within a pyranometer, the downward short-             5    Conclusions
wave irradiance measured by this instrument tends to be bi-
ased low under clear-sky condition (Haeffelin et al., 2001).
Note that a study by Ham et al. (2020) indicated that the bias          We evaluated MATCH AODs used to produce the CERES
in the diurnally averaged surface downward shortwave irra-              SYN1deg product. AODs derived from Terra and Aqua by
diance computed by a four-stream model should be smaller                the Dark Target and Deep Blue algorithms were merged
than 1 %.                                                               to produce daily gridded AODs. Daily gridded AODs were
                                                                        used for assimilation by MATCH at local solar noon. As a
                                                                        consequence, monthly mean AODs under clear-sky condi-
                                                                        tions identified by MODIS closely agree with those derived
                                                                        from MATCH, although MATCH uses climatological aerosol
                                                                        sources. Because AODs are not screened by QAC, MATCH

Atmos. Chem. Phys., 22, 10115–10137, 2022                                                 https://doi.org/10.5194/acp-22-10115-2022
D. W. Fillmore et al.: Evaluation of AOD and clear-sky radiative fluxes of the CERES SYN1deg product 10131 AODs are larger over convective regions (e.g., the Amazon, Appendix A: Surface observation sites used for central Africa, and Southeast Asia) for both clear-sky and validation all-sky conditions. MATCH AODs under all-sky conditions are larger than A great deal of the data used in this study were collected by those under clear-sky conditions. Time series of AERONET dedicated site scientists measuring critical climate variables AODs indicate that AODs generally increase with cloud frac- around the world. The tables included in this Appendix out- tion, which is consistent with, primarily, water uptake by line the sites, the in situ measurements taken and their loca- hygroscopic aerosols (Varnai et al., 2017). In addition, sur- tions, and the dates of available data. Table A1 lists the loca- face observations at the ARM SGP site suggest larger AODs tions of the AERONET sites, our source for observed AOD, and larger precipitable water values under all-sky condi- which can be found online at https://aeronet.gsfc.nasa.gov/ tions than those under clear-sky conditions. AOD biases from new_web/index.html (last access: 3 February 2022). AERONET AODS in MATCH are comparable to biases of Sources of surface-observed downwelling irradiance are MERRA-2 AOD from AERONET AODS for both all-sky outlined in Table A2 (land) and Table A3 (buoys). For land, and clear-sky conditions. However, MERRA-2, which uses we utilize data from the Baseline Surface Radiation Net- AERONET AODs to train the algorithm, has better temporal work (BSRN; Driemel et al., 2018; Ohmura et al., 1998); correlation with AERONET AODs than MATCH AODs. the US Department of Energy’s Atmospheric Radiation Mea- Once MATCH AODs are used for surface irradiance com- surement (ARM) program; and the NOAA SURFRAD net- putations, downward shortwave irradiances are positively bi- work, available from the NOAA Air Resources Laboratory/- ased by 1 % to 2 % compared with those observed at sur- Surface Radiation Research Branch (Augustine et al., 2000). face sites. TOA reflected clear-sky shortwave irradiances Buoy observations come from two sources through four sep- are negatively biased compared with those derived from arate projects. The Upper Ocean Processes Group at the CERES observations. Increasing AODs by ∼ 0.02 and sur- Woods Hole Oceanographic Institute have maintained the face albedos by 0.03 as well as decreasing precipitable water Stratus, North Tropical Atlantic Site (NTAS), and Hawaii by 0.06 cm over midlatitude surface sites makes computed Ocean Time-series (HOTS) buoys for more than a decade, reflected TOA irradiances agree with those derived from providing valuable time series of radiation observations in CERES. These adjustments reduce downward shortwave ir- climatically important regions of the ocean. These data can radiances at the surface by 2 W m−2 . Decreasing MATCH be retrieved from: http://uop.whoi.edu/index.html (last ac- AODs for the desert group is needed to match computed re- cess: 18 July 2022). We would also like to acknowledge flected shortwave irradiances at TOA with those derived from the Project Office of the NOAA Pacific Marine Environ- CERES. However, decreasing MATCH AODs is not con- mental Laboratory (PMEL) where three groups of buoy data sistent with generally larger MATCH AODs compared with were downloaded: (1) the Tropical Atmosphere Ocean/Trian- AERONET. This discrepancy is partially explained via Ta- gle Trans-Ocean Buoy Network (TAO/TRITON; McPhaden, bles 2 and 6. Table 2 shows that we map all large dust par- 2002) data for the Pacific; the Prediction and Research ticles from MATCH (> 0.5 µm reff ) into a single aggregate Moored Array in the Tropical Atlantic (PIRATA; Servain et set of dust scattering properties in the radiative transfer code. al., 1998) data for the tropical Atlantic Ocean; and the Re- Table 6, which shows surface irradiance down for the 0.5, search Moored Array for African–Asian–Australian Mon- 2.0, and 8.0 µm particle sizes separately, supports the idea soon Analysis and Prediction (RAMA; McPhaden et al., that averaging all large dust particles could lead to too much 2009) data for the Indian Ocean. Also downloaded from DSI and too little DLI, as found in our irradiance compar- PMEL are the long-term buoy observations for the PAPA and isons in Figs. 13 and 14, particularly in regions where larger Kuroshio Extension Observatory sites. dust particles are found, such as deserts. This issue will be addressed in the next full release of the CERES SYN1deg product. https://doi.org/10.5194/acp-22-10115-2022 Atmos. Chem. Phys., 22, 10115–10137, 2022
You can also read