FACILE SYNTHESIS AND CHARACTERIZATION OF WO3/CUWO4 NANOCOMPOSITES FOR THE REMOVAL OF TOXIC METHYLENE BLUE DYE
←
→
Page content transcription
If your browser does not render page correctly, please read the page content below
Korean J. Chem. Eng., 38(5), 952-965 (2021) pISSN: 0256-1115
DOI: 10.1007/s11814-021-0756-x eISSN: 1975-7220
INVITED REVIEW PAPER INVITED REVIEW PAPER
Facile synthesis and characterization of WO3/CuWO4 nanocomposites
for the removal of toxic methylene blue dye
Thilagavathi Thiyagarajan*,†, Venugopal Deivasigamani*, Marnadu Raj**, Chandrasekaran Joseph**,
Thangaraju Dheivasigamani***, Baskaran Palanivel****, Mohamed S. Hamdy*****, and Mohd. Shkir******
*Department of Physics, Gobi Arts & Science College, Gobichettipalayam - 638453, Erode, Tamilnadu, India
**Department of Physics, Sri Ramakrishna Mission Vidyalaya College of Arts and Science,
Coimbatore - 641020, Tamilnadu, India
***Nano-crystal Design and Application Lab (n-DAL), Department of Physics,
PSG Institute of Technology and Applied Research, Coimbatore - 641062, Tamil Nadu, India
****Department of Physics and Nanotechnology, SRM Institute of Science and Technology,
Kattankulathur, Kancheepuram 603203, Tamil Nadu, India
*****Catalysis Research Group (CRG), Department of Chemistry, College of Science,
King Khalid University, P.O. Box 9004, Abha 61413, Saudi Arabia
******Advanced Functional Materials & Optoelectronics Laboratory, Department of Physics,
College of Science, King Khalid University, Abha - 61413, Saudi Arabia
(Received 25 August 2020 • Revised 25 December 2020 • Accepted 29 January 2021)
AbstractPure tungsten oxide (WO3) nanoparticles (NPs) and WO3/copper tungstate (CuWO4) nanocomposites
(NCs) were prepared by varying copper content from (5-20 wt%) via the co-precipitation process. XRD results reveal
that the structural parameters of WO3/CuWO4 NCs have been strongly affected via Cu doping. Morphology of synthe-
sized WO3 was noticed to be distinct and particle size was significantly reduced through Cu doping confirmed by
employing HRTEM studies. Elemental purity of as synthesized products, elucidated from EDX and XPS analyses,
reveals that WO3/CuWO4 nanocomposites contain W, O and Cu elements only. Also, FT-IR spectra and its corre-
sponding assignments indicate the existence of WO3/CuWO4. UV-Visible study shows that WO3/CuWO4 composites
have narrow bandgap compared to pure WO3. Photoluminescence spectral peaks intensity of NCs displays a decreasing
trend, which supports the enhanced photocatalytic activity. The results clearly show that 20 wt% Cu incorporated WO3
sample exhibits better photocatalytic nature than that of pure WO3 and will be more applicable in purify the water.
Keywords: WO3/CuWO4 NCs Synthesis, X-ray diffraction, HRTEM/SAED, XPS, Optical Properties, Photocatalytic
Activity
INTRODUCTION to its harmlessness, earth-abundance, highly photo-active and able
to respond ultraviolet and visible lights to degrade toxic dyes [5].
The presence of non-biodegradable, carcinogenic synthetic toxic WO3 has extensive applications in diverse fields, such as batteries
organic dyes in textile and leather industry effluents pollutes water based on Li-ions [6], sensing of toxic gases [7], and heterogeneous
resources like lakes and rivers [1,2]. In the present circumstances, catalyst [8]. Also, WO3 has several polymorphs as a result of tem-
inexpensive and large scale effective clean water production tech- perature and the method of synthesis. Among the existing poly-
nologies are essential to supply clean water to humans as well as morphs, the monoclinic phase is the most stable and always shows
aquatic organisms. In fulfilling the increasing clean water demand, enhanced photocatalytic activity compared to other phases of WO3
a simple and eco-friendly semiconductor photocatalytic green chemi- [9]. Moreover, WO3 exhibits nanorods [10], nanoplates [11] and
cal technique is extensively acknowledged [3,4]. In this aspect, nanowire [12] morphologies. Due to these excellent reasons, WO3
popular semiconductor photocatalysts such as TiO2, -Fe2O3, NiO, has been synthesized from various techniques, including impreg-
ZnO, SnO2 and WO3 have been utilized and studied for their pho- nation method [13], hydrothermal synthesis [14], co-precipitation
tocatalytic degradation of toxic organic dyes. Among the exten- [15], molten salts process [16] and sol-gel [17] method. From all
sively investigated transition metal oxide semiconductors, WO3 is the available physical and chemical methods, the co-precipitation
an important widely tunable bandgap (around 2.8 eV) n-type mate- method is advantageous due to its cost-effectiveness and quick for-
rial. It is found to be an appropriate photocatalytic material owing mation of nanoparticles [18]. Regrettably, the fast recombination
frequency of electron-hole pairs generated under light limits the
†
To whom correspondence should be addressed. photocatalytic degradation efficiency of pure WO3 nanoparticles. To
E-mail: thilagavathi01@gmail.com overcome the drawbacks gone through pure WO3, low cost, chem-
Copyright by The Korean Institute of Chemical Engineers. ically and thermally stable n-type semiconductor copper tungstate
952
Facile synthesis and characterization of WO3/CuWO4 nanocomposites 953
(CuWO4) forms the heterojunction coupling with WO3 may enhance (0-20 wt%) acting as a Cu doping agent dissolved in deionized
the separation of photo induced charge carriers (e -h+) [19]. As a water was added to the total solution. Then the complete solution
result, the as-formed WO3/CuWO4 nanocomposites have proven was stirred continuously for 2 hours at 80 oC in a temperature-
to be a successful photocatalyst. In view of that, Salimi et al., re- controlled magnetic stirrer and after cooling to 300 K, a bluish-yel-
ported the photocatalytic performance of CuWO4/WO3 hetero- low colored precipitate/powder was formed. Further, this precipi-
structures [20]. Neto et al. studied the photocatalytic properties of tate was washed with acetone, ethanol followed by deionized water
CuWO4, CuWO4/WO3 and CuWO4/CuO powders by sonochem- numerous times to eliminate scum. To eliminate moisture, the
ical method [21]. Chen et al. reported the photocatalytic activity of cleaned precipitate was kept in an oven for 6 hours at 60 oC. Finally,
WO3 through CuWO4 for phenol degradation [22]. The photocat- the samples were annealed at 600 oC in an air atmosphere using a
alytic degradation of cationic toxic dyes by WO3 doped with other muffle furnace for an hour. After annealing, WO3 samples were
metals has been reported by many researchers. ground for 30 minutes using mortar and pestle. From the above-
Accordingly, Aslam et al. prepared WO3/CdWO4 as photocata- synthesized procedure, 0 wt% Cu gives pure WO3 and (5-20 wt%)
lyst and studied organic contaminants degradation under VIS gives WO3/CuWO4 nanopowders. These powders were stored in
light [23]. Tahir et al. reported the improved photocatalytic action airtight, dust-free vials for further characterization.
g-WO3 for producing hydrogen [24]. Ismail et al. studied WO3/ 2. Photocatalytic Activity Measurement
graphene as photocatalyst below VIS light for MB degradation [25]. The prepared WO3 NPs can be used to remove pollutants such
Yu et al. reported AgCl/WO3 composite microrod photocatalysts as dye molecules present in water. For this experiment, cationic
prepared by hydrothermal method [26]. Methylene blue (MB) was taken as a model pollutant and the actual
In the present work, we prepared pure WO3 nanoparticles and concentration of the prepared MB dye was 10 mgL1. From the
WO3/CuWO4 nanocomposites with Cu content (5-20 wt%) via the above quantity of dye solution, only 50 ml was taken and 0.020 g
co-precipitation method. Detailed structural, surface morphological of pure WO3 NP and WO3/CuWO4 NCs were separately dispersed
and optical characterizations were done. In addition, photocatalytic over this solution. To measure the decolorization ability of the WO3,
activity and the possible mechanism responsible for photocatalytic WO3/CuWO4 catalysts, the catalysts and dye solution were irradi-
degradation of MB by the prepared samples were also proposed ated with 125 W high-pressure mercury lamp UV light source with
based on the experimental observations. We report that the hetero- a spectral peak centered at 365 nm (UV-A) using Heber photore-
junction structured WO3/CuWO4 nanocomposites offer enhanced actor (Model: HML-COMPACT-SW-MW-LW 888). The catalyst
photocatalytic degradation efficiency than pure WO3 nanoparticles. and blue colored dye solution were filled in a cylindrical borosilicate
glass tube and inserted in the corresponding holder with photore-
INVESTIGATIONAL DETAILS actor chamber. This catalyst - blue-colored dye solution, suspen-
sion aerated constantly and changed to colorless within 80 minutes,
1. Preparation of Pure WO3 and WO3/CuWO4 Nanocomposites shows the removal of dye by the WO3 NPs and WO3/CuWO4
To synthesize pure WO3 NPs and WO3/CuWO4 NCs, a simple NCs after irradiation of UV-A source. During irradiation, the cata-
and environmentally friendly co-precipitation technique was pre- lyst - dye suspension was collected every 20 minutes of time inter-
ferred, and the detailed process is illustrated in Fig. 1. In a typical vals. The absorption spectrums of the as collected samples were
synthesis, 0.5 M of Sodium tungstate dihydrate (Na2WO4·2H2O) recorded using JASCO spectrophotometer.
of M.W 329.86 g/ml (AR grade) was dissolved in 40 ml deionized 3. Characterization Techniques
water and within a few minutes a transparent solution was attained. Phase and purity of all the samples were investigated through
This transparent solution turned to pale yellow color when 5 ml of PANalytical X’ Pert PRO X-ray diffractometry (XRD) having radi-
concentrated HCl was added. Afterwards, Cu (NO3)2·3H2O with ation of CuK with =1.5406 Ao. The shape and structure were
Fig. 1. Schematic illustration for preparing pure WO3 nanoparticles and WO3/CuWO4 nanocomposites.
Korean J. Chem. Eng.(Vol. 38, No. 5)
954 T. Thilagavathi et al.
inspected by a Field emission SEM (SIGMA HV - Carl Zeiss) and and also lattice distortion created by higher ionic radius differ-
high-resolution TEM-JEM 2100 from JEOL. The elemental inspec- ences between the W6+ and Cu2+ ions. The diffraction peaks at 2
tion was done through EDS/SEM device. The chemical composi- position 26.8o, 33.39o, 34.27o, 41.95o, 47.40o, 46.83o, 49.99o, 50.14o,
tion of elements was examined via the XPS spectrophotometer 52.08o, 53.84o, 56.01o and 58.71o appeared in pure were suppressed
(Kratos Analytical) equipped with a monochromatic AlK source and disappeared in WO3/CuWO4 NCs samples. Interestingly, one
of radiation (1,486.6 eV). The Avatar 370-FT-IR spectrometer was new peak was recorded at 43.11o (denoted by *) having mono-
employed to measure the spectra over 400 to 4,000 cm1 region clinic structure that matches well with JCPDS 83-0950. Addition-
with a firmness of 4 cm1. Varian Cary 5000 UV-Vis-NIR DR spec- ally, triclinic structured CuWO4 peaks were formed at 26, 30.26,
trophotometer was used to measure reflectance profiles. Photolu- 31.86, 32.14 and 35.61o denoted as dot confirmed with JCPDS card
minescence was studied by the Varian Cary Eclipse system. No: 01-073-1823. All these interesting changes in the XRD pat-
tern proved that copper has the utmost impact on the structural
OUTCOMES AND DIALOGUE parameters of WO3/CuWO4 NCs.
The average values of crystallite size (D), dislocation concentra-
1. XRD Study tion (), and strain () of the pure and WO3/CuWO4 NCs were
Fig. 2(a) illustrates the XRD profiles of annealed pure WO3 NPs obtained using below formulae [27-32] and provided in Table 1.
and WO3/CuWO4 NCs with various amounts of Cu content (0-20
k
wt%). It is apparent from the Fig. 2(a) that pure WO3 NPs exhib- Dave -------------- (1)
cos
its a well-resolved intensive triplet diffraction peaks at 2 =23.30o,
23.71o and 24.48o indexed as (002), (020) and (200) planes, respec- 1
ave ------2 (2)
tively. All the diffraction planes correspond to monoclinic struc- D
ture and compatible with JCPDS # 83 - 0950. When copper content
Cot
was introduced into pure WO3, the most predominant triplet peak ave --------------- (3)
4
was suddenly reduced in its intensity, shown in Fig. 2(a). More-
over, the shifting of triplet peak towards the lower angle diffrac- 2
2
tion side was observed for all WO3/CuWO4 NCs depicted in Fig. SFave -----------------------------
1/2
- (4)
453 tan
2(b). This peak shift may occur due to the ionic radius dissimilar-
ity of the host WO3 (W6+=0.65 Ao) and the guest (Cu2+=0.73 Ao) The acquired results of D for pure WO3 NPs and WO3/CuWO4
Fig. 2. (a) XRD patterns and (b) peak shift patterns of pure WO3 nanoparticles and WO3/CuWO4 nanocomposites.
Table 1. Average structural parameters calculated for pure WO3 nanoparticles and WO3/CuWO4 nanocomposites
Cu concentration Grain size Dislocation density Micro strain Stacking fault
(wt%) (Dave) nm (ave)×10 3 nm 2 (ave) 10 3 (ave)×10 3
00 34.42 1.15 3.52 2.05
05 32.81 1.23 4.22 2.09
10 30.18 1.27 4.28 2.19
15 29.44 1.51 4.60 2.32
20 27.49 1.55 4.66 2.44
May, 2021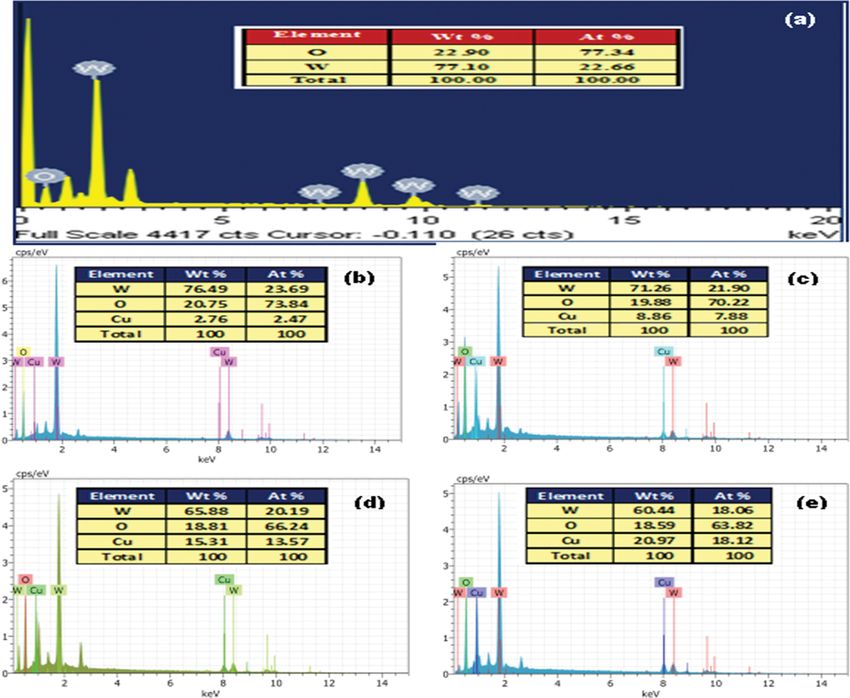
Facile synthesis and characterization of WO3/CuWO4 nanocomposites 955
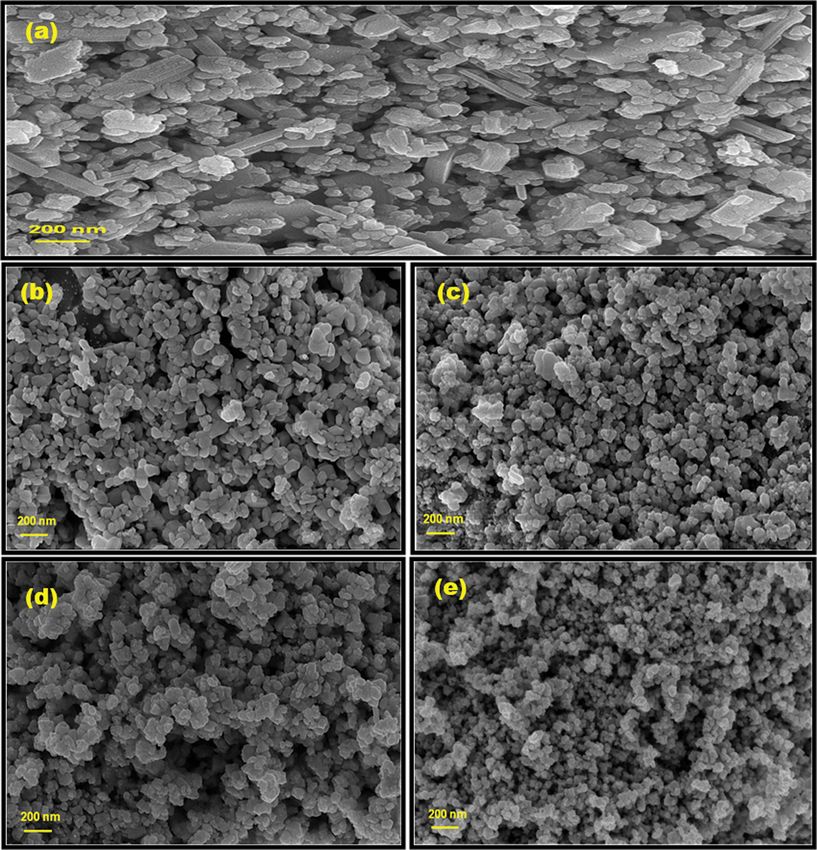
NCs are approximately 34.42, 32.81, 30.18, 29.44 and 27.49 nm, [36]. The FESEM images of WO3/CuWO4 NCs shown in Fig. 3(b)-
respectively. These sorts of decrease in crystallite size perceptibly (e) evidently demonstrate that the particle size of sphere-like NCs
illustrate the strong incorporation of Cu2+ ions into W6+ lattice posi- decreases upon increasing the copper content and is in agreement
tions. Our result agrees well with the previously reported results with the decrease in crystallite size calculated from XRD analysis.
[33,34]. This decrease in size might be beneficial for transferring 3. HRTEM Analysis
of charge carriers generated by light to surface where it might have Morphology evolution of pure WO3 and Cu including WO3 sam-
a considerable role for enhancing the photocatalytic nature. The ples was deeply investigated by TEM and HRTEM analysis, and
mean values of , and increase continuously on increase of Cu the captured micrographs are depicted in Fig. 4, and 5, respectively.
dopant from 0 to 20 wt%. TEM pictures of as synthesized pure WO3 NPs appearing as nano-
2. FE-SEM Analysis plate-like structure with sharp edges, and mild agglomeration may
Fig. 3 FESEM study was employed to evaluate the surface mor- be due to physisorption of individual WO3 nanoplates [37]. Plate-
phological information and structure of the pure WO3 NPs and like structure of WO3 started disappearing gradually while copper
WO3/CuWO4 NCs with increase in Cu2+ content from 5-20 wt% was added in the synthesis. Micrographs of 5 wt% WO3/CuWO4
are shown in Fig. 3(a)-(e). The surface of pure WO3 NPs exhibits NCs appeared as lamellae-like structure with sub-angular edges
closely packed nanoplate structure as given in Fig. 3(a) [35]. On and their edges were not sharp like pure WO3. Lamellae with sub-
increasing the Cu2+ content from 5-20 wt%, nanoplates were trans- angular edges were turned into sphere-like structure when the
formed to irregular sphere-like NCs. This morphological change percentage of copper addition increased from 5 to 20%. Morphol-
may occur due to the formation of WO3/CuWO4 nanocomposite ogy of WO3 samples synthesised in the presence of copper was dis-
Fig. 3. FESEM images of (a) pure WO3 nanoparticles and (b) 5 wt% Cu, (c) 10 wt% Cu, (d) 15 wt% Cu, and (e) 20 wt% Cu of WO3/CuWO4
nanocomposites.
Korean J. Chem. Eng.(Vol. 38, No. 5)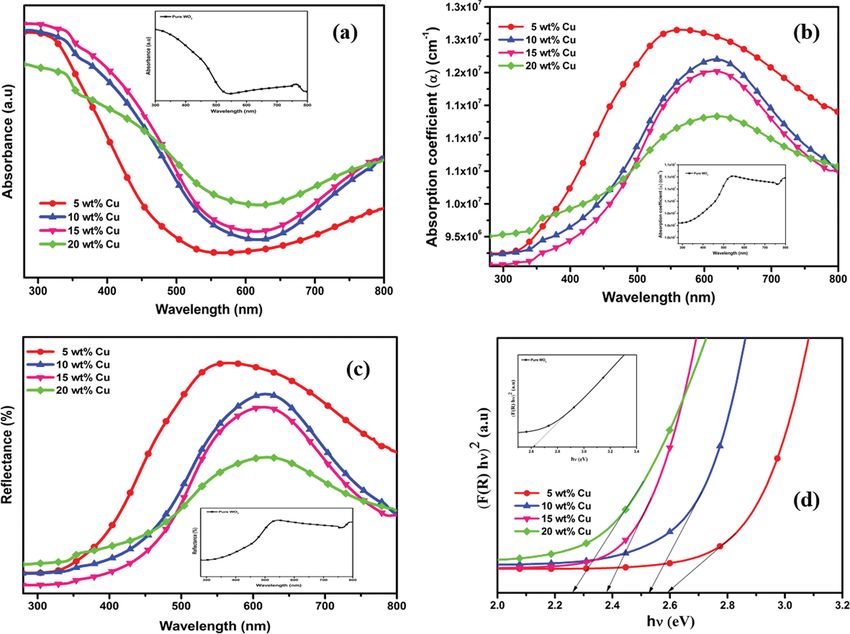
956                                                        T. Thilagavathi et al.

Fig. 4. TEM images of pure WO3 nanoparticles (a)-(c), 5 wt% Cu (d)-(f), 10 wt% Cu (g)-(i), 15 wt% Cu (j)-(l) and 20 wt% Cu (m)-(o) of WO3/
        CuWO4 nanocomposites.

tinct and particle size was significantly reduced. Two different         shell type WO3/CuWO4 structure, while increasing the copper con-
morphologies were observed in the WO3/CuWO4 samples, which               centration CuWO4 domination was increased around the WO3
may be clear classification of formation of WO3 and CuWO4,               particles. Interplanar spacing 0.37 and 0.28 nm matched with
which is well matched with the XRD results.                              (020) of monoclinic WO3 and triclinic (-111) planes of CuWO4,
   HRTEM and SAED pattern images of pure WO3 (Fig. 5(a) and              respectively. Corresponding shade patterns (Fig. 5(g), (h), (i) and
(f)) confirmed the formation of the desired compound; the inter-         (j)) confirm the polycrystalline nature of WO3/CuWO4 samples
planar spacing 0.374 nm corresponds to the (020) plane of mono-          and mixed phases. Diffracted dots indicate the presence of domi-
clinic WO3 structure [38]. SAED pattern of pure samples clearly          nant planes of WO3 and CuWO4 structures.
confirms the crystalline nature and well distinct scatter dots were      4. EDS Analysis
observed. HRTEM micrographs of WO3/CuWO4 samples confirm                    The elemental analysis of pure WO3 NPs and WO3/CuWO4 NCs
the presence of WO3 and CuWO4 phases as mixture (Fig. 5(b),              was determined by EDX and attained profiles are given in Fig. 6.
(c), (d) and (e)). It is clearly confirmed that WO3 particles were       These profiles visibly indicate that pure WO3 contain W & O peaks.
formed first and the copper influence later formed the CuWO4             Additionally, the EDS profile of WO3/CuWO4 NCs composed of
particles in copper including WO3 samples. There may be core/            tungsten, oxygen and copper atoms confirmed the presence of W,

May, 2021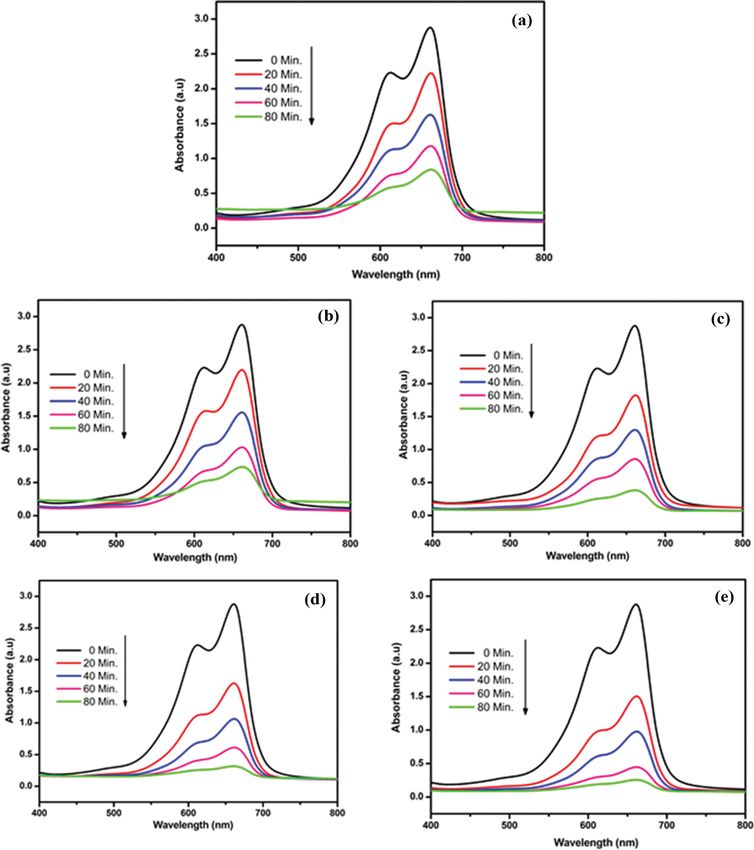
Facile synthesis and characterization of WO3/CuWO4 nanocomposites                                     957

Fig. 5. HRTEM images with SAED pattern of pure WO3 nanoparticles (a), (f), 5 wt% Cu (b), (g), 10 wt% Cu (c), (h), 15 wt% Cu (d), (i) and
        20 wt% Cu (e), (j) of WO3/CuWO4 nanocomposites.

O and Cu atoms peaks. The compositional % of elements is given         wt% Cu@WO3 samples are depicted in Fig. 7(a) and (b), respec-
in the inset of Fig. 6. The intensity peak of tungsten was decreased   tively, and own the peaks for W, O, and Cu replicas [40]. Fig. 7(c)
due to the addition of Cu2+ in the tungsten site and atomic per-       reveals the peaks for tungsten as W 4f5/2 and W 4f7/2 and for oxygen
centage of oxygen decreases gradually. This observation supports       as O 1s as seen in Fig. 7(d). It is evident from Fig. 7(d), that the O
the photocatalytic performance due to the existence of deficiency      1s photoelectron peak is situated at ~531.2 eV, which is ascribed
ions in the prepared WO3/CuWO4 samples [39].                           to the lattice oxygen of WO3 crystal. However, when Cu was doped
5. XPS Analysis                                                        in WO3 this peak was slightly shifted to 531.5 eV because of Cu
   The measured XPS profiles for the prepared pure WO3 and 20          doping in WO3. For W the peaks assigned as W 4f5/2 and W 4f7/2

                                                                                                    Korean J. Chem. Eng.(Vol. 38, No. 5)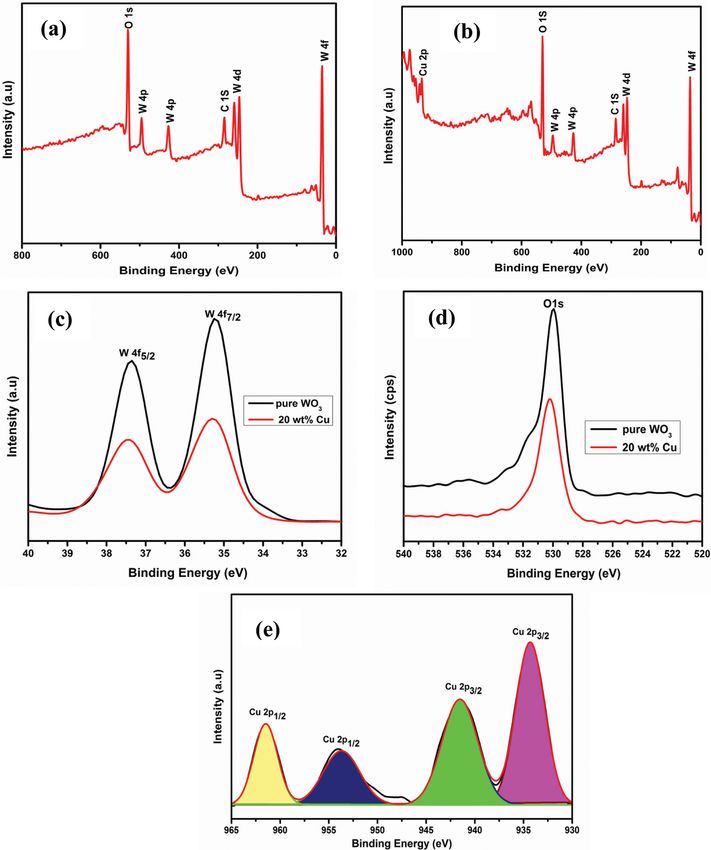
958 T. Thilagavathi et al.
Fig. 6. EDAX spectra of (a) pure WO3 nanoparticles and (b) 5 wt% Cu (c) 10 wt% Cu (d) 15 wt% Cu, and (e) 20 wt% Cu of WO3/CuWO4
nanocomposites.
are positioned at ~37.35 and 35.24 eV in pure and are slightly shifted the peaks at 1,619-1,625 cm1 arise due to the (H-O-H) bending
to ~37.44 and 35.29 in WO3/CuWO4 NCs (see Fig. 7(c)). These vibration mode of absorbed water present in pure and WO3/
peaks are reported at 38.2 and 36.94 eV in pure and are slight shifted CuWO4 NCs. Further, the peaks at 712-727 cm1 denote (O-W-O)
to ~35.6 (or 35.7) and 37.8 (or 37.9) for Cu@WO3 by Ghodselahi stretching modes WO3/CuWO4 NCs. New distinct bands were
et al. [26]. Moreover, the Cu centers were also studied through observed at 913-921 and 555-564 cm1 for the stretching vibration
XPS for knowing their electronic configuration in Cu 2p3/2 and Cu of (W-O) bonds in WO4 tetrahedra in association with CuWO4
2p1/2 area and depicted in Fig. 7(e). In this figure the Cu 2p3/2 phase. Moreover, the bands identified at 458-478 cm1 represent
related peaks are positioned at 934.31 eV and 941.58 eV and Cu symmetric stretching vibrations of CuO6 octahedral phase. The
2p1/2 related peaks at 954.10 eV and 961.45 eV. Ghodselahi et al. FT-IR outcomes undoubtedly designate the presence of WO3/
reported the Cu 2p3/2 XPS peaks at ~935 eV [41]; however, Biesinger CuWO4 photocatalyst.
et al. reported the peak for Cu 2p3/2 at 932.61 eV [42]. However, to 7. UV-Visible Studies
get exact and accurate energy peaks for related elements in XPS, a UV visible absorption, coefficient, reflectance and Kubelka-Munk
careful calibration needs to be done to avoid any error and also (K-M) plot of pure and Cu included WO3 are presented in Fig.
the product phases. 9(a)-(d). In absorption spectrum, excitonic feature of pure WO3
6. FTIR Studies starts around 500 nm, which is well matched with reported litera-
FT-IR profiles of WO3 and WO3/CuWO4 NCs recorded at room ture values [50]. Excitonic features of Cu including samples were
temperature are shown in Fig. 8(a)-(e). The observed wavenum- gradually increased from 500 to 610 nm, which is evident that
ber from the recorded spectra and its corresponding assignments inclusion of Cu in the synthesis of WO3 drastically changes in the
are demonstrated in Table 2. In WO3 profile, the band at 634 cm1 optical and electronic structure of pure WO3. Absorption coeffi-
represents (W-O-W) stretching vibration. The band at 3,356-3,447 cient () of 5% copper including WO3 samples shows higher value
cm1 resembles (O-H) stretching mode of WO3/CuWO4 NCs and (Fig. 9(b)), which was gradually lowering while increasing copper
May, 2021
Facile synthesis and characterization of WO3/CuWO4 nanocomposites 959
Fig. 7. (a) XPS survey spectra of pure WO3 nanoparticles, (b) XPS survey spectra of 20 wt% Cu WO3/CuWO4 nanocomposites, (c), (d) High
resolution XPS spectra of W4f and O1s of pure WO3 nanoparticles, WO3/CuWO4 nanocomposites and (e) Cu 2p region of WO3/
CuWO4 nanocomposites.
ion percentage. The reflectance modifications were recorded and
shown in Fig. 9(c) between 250 and 800 nm. From reflectance, Eg
was calculated for each synthesized samples using Kubelka-Munk
(K-M) rule through (F(R) h)2 vs. hv plot (Fig. 9(d)). The sketching
of the linear section of the curve intercepts on X-axis, ((F(R)h))2=
0) provides the Eg values of samples. The procedure to get Eg is as
follows:
2
1 R
FR ----------------- (5)
2R
where R is percentage reflectance.
Estimated band gaps of pure WO3 NPs and WO3/CuWO4 NCs
from Fig. 9(d) showed a continuous decrement while increasing
the copper concentration from 2.6 to 2.25 eV. The details of the
Fig. 8. FTIR spectra of (a) pure WO3 nanoparticles (b) 5 wt% Cu bandgap changes are given in Table 3.This means that wide band-
(c) 10 wt% Cu (d) 15 wt% Cu, and (e) 20 wt% of Cu of WO3/ gap pure WO3 (inset in Fig. 9(d)) was transformed towards nar-
CuWO4 nanocomposites. row bandgap while including Cu ions into it. Growth of CuWO4
Korean J. Chem. Eng.(Vol. 38, No. 5)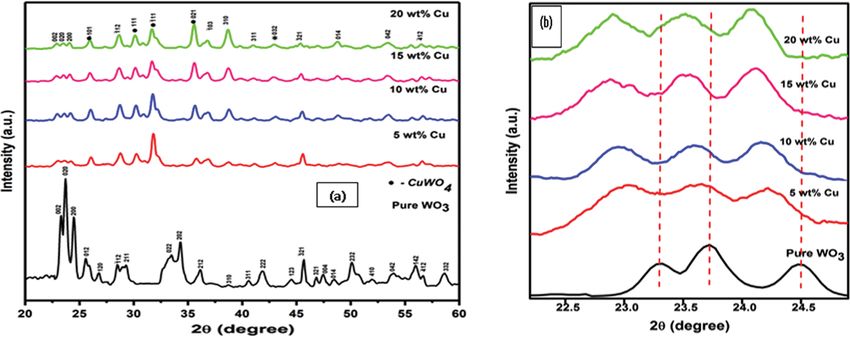
960 T. Thilagavathi et al.
Table 2. Shows the vibrational band assignments for all absorption peaks in pure WO3 nanoparticles and WO3/CuWO4 nanocomposites
Sample pure WO3 5 wt% Cu 10 wt% Cu 15 wt% Cu 20 wt% Cu Assignment References
0,634 - - - - (W-O-W) [43]
- 0,458 0,466 0,473 0,478 (O-Cu-O) [44]
- 0,556 0,555 0,564 0,564 (W-O) [45]
Wavenumber - 0,727 0,720 0,712 0,712 (O-W-O) [46]
(cm 1) - 0,913 0,911 0,921 0,913 (W-O) [47]
1,625 1,621 1,619 1,622 1,625 (H-O-H) [48]
- 3,436 3,444 3,356 3,443 (OH) [49]
- - - 3,447 - (OH) [49]
Fig. 9. (a) Absorbance spectra, (b) Absorption coefficient, (c) Diffuse Reflectance Spectra (DRS), and (d) K-M plot indicating the direct band
gap for the corresponding reflectance spectra of pure WO3 nanoparticles (inset) and WO3/CuWO4 nanocomposites.
Table 3. Estimated values of band gap for pure WO3 and WO3/ while attempting to include Cu in the WO3 system it is ended to
CuWO4 nanocomposites new compound CuWO4 instead of doping [51]. Since CuWO4
Sample Band gap (Eg) eV completely covers the surface of the WO3 particles, the bandgap is
reduced to 2.25 eV for heavily Cu included samples.
pure WO3 2.61
8. Photoluminescence Studies
5 wt% Cu 2.59
Photoluminescence of pure and Cu included WO3 samples was
10 wt% Cu 2.52 measured under 280 nm excitation and recoded spectra between
15 wt% Cu 2.37 350 and 500 nm are displayed in Fig. 10. Inset picture of Fig. 10 is
20 wt% Cu 2.25 the emission spectrum of pure WO3 sample, which shows four high
intensity emissions at 361, 383, 412, and 492 nm. Among them, the
around WO3 particles may be attributed to narrower band gap peak centered at 383 nm possesses the highest intensity. The emis-
and increase in the excitonic feature of the Cu : WO3. The reason sion peak at 361 nm may be generated due to near band edge
is that bandgap report of CuWO4 from the literature is 2.2-2.3 eV, transition and the rest of the low intense emissions such as 412
May, 2021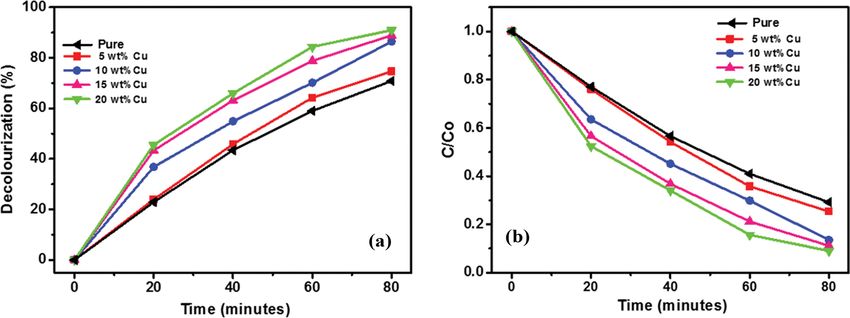
Facile synthesis and characterization of WO3/CuWO4 nanocomposites 961
and 492 nm may be raised from defect state originating between
conduction band and valance band. The scenario of Cu included
WO3 samples is entirely changed [52]. In 5 wt% Cu, band edge
transition emission at 361 nm intensity shows higher intensity than
that of other emission features such as 377, 412, 437 and 490 nm. The
intensity of emission peaks above discussed is getting decreased
while increasing the copper concentration in the WO3 synthesis.
Principal emission peak of WO3 completely vanished in highly Cu
included samples and emission at 490 was retained even for high
copper content in WO3 samples. The reason is that the emission is
raised from electronic transition within complex structure of WO42
from newly formed CuWO4 among WO3 particles [53].
9. Photocatalytic Studies
Fig. 10. Photoluminescence spectra of pure WO3 NPs (inset) and The decolorization of MB dye in aqueous solution was per-
WO3/CuWO4 nanocomposites. formed beneath of UV-A light (365 nm) illumination and the UV-
Fig. 11. The UV-Vis spectra of MB aqueous solution as a function of reaction time (a) pure WO3 nanoparticles (b) 5 wt% Cu (c) 10 wt% Cu
(d) 15 wt% Cu, and (e) 20 wt% of Cu of WO3/CuWO4 nanocomposites.
Korean J. Chem. Eng.(Vol. 38, No. 5)962 T. Thilagavathi et al.
Fig. 12. (a) Methylene blue decolorization profile as a function of irradiation time, (b) relative absorbance curves of methylene blue (MB)
decomposed photocatalytically by pure WO3 nanoparticles and WO3/CuWO4 nanocomposites.
Table 4. Comparison of MB degradation efficiency of WO3/CuWO4 nanocomposites with other photocatalysts
Catalyst Catalyst amount MB concentration Light source Degradation%/time Reference
WO3/GN 60 mg 60 mL 350 ppm 15 W UV lamp 80/90 min [54]
Nb doped WO3 50 mg 10 mgl1 300 W Hg lamp 85/120 min [55]
WO3/ZnWO4 100 mg 100 mL 1.0×10⁴ M 35 W Xe lamp 55.54/480 min [56]
WO3/TiO2 20 mg 25 mmol·m 3 230 W UV lamp 85/180 min [57]
CuWO4 40 mg 10 mg/L 300 W Xe lamp 86/90 min [58]
WO3/CuWO4 0.02 g 10 mgL1 125 W Hg lamp 90.97/80 min Present work
Visible spectrophotometer was used to control the reactions. Fig. (LH) rule was used to measure the degradation of dyes as follows.
11(a)-(e) shows the UV-Vis. spectra of the decolorization of MB as
ln(C0/C)=kt (7)
a function of reaction time over different prepared photocatalysts
st
at a constant interval time. As the irradiation time progresses, the Where, k is 1 -order rate constant and t stands for the time of
absorption peak intensity gradually decreases from the maximum irradiating the samples. Herein, the starting MB content was quite
absorption value (661 nm). This progression indicates the MB dye low (10 mgL1), so, the LH model was employed for evaluating k.
degradation. The absorbance values of the dye suspension col- The obtained photocatalytic data were found to be fit with
lected from 0-80 minutes interval can be re-expressed as a unit of pseudo-first-order kinetic model in which ln(C0/C) was plotted for all
concentration using the Lambert-Beer law. the reactions against the reaction time (min) (Fig. 13(a)). Straight
lines were obtained with a high R2 and therefore the slope represents
C0 C
Decolorization Efficiency ------------------
- 100 (6) a first-order rate constant (k) (Fig. 13(b)). The obtained kinetic data
C0
confirms the higher reaction rate associated with increasing Cu
Here, C0 & C stands for concentrations of MB dye (mgL1) before content in the prepared samples. The first-order rate constant of 20
and after UV- A light irradiation. wt% Cu sample exhibits two-times higher photocatalytic activity
The decolorization profiles of MB aqueous solution are pre- than pure WO3. The obtained kinetic parameters are listed in Table 5.
sented in Fig. 12(a) and (b). Pure WO3 was able to discharge 70% Further, the decolorization efficiency of the prepared pure and
of original color of MB. When cupper incorporated into WO3 the doped catalysts was investigated by TOC (total organic carbon)
photocatalytic decolorization of MB was improved, the sample with analyzer and the results are shown in Fig. 14. This TOC removal
5 wt% Cu catalyzed the decolorization 74% of MB, while the sam- efficiency graph clearly demonstrates the 20 wt% Cu doped WO3
ple 20 wt% Cu catalyzed the decolorization of 90% of MB. The has the higher efficiency (68%) than other photocatalysts over the
photocatalytic degradation efficiency of WO3/CuWO4 nanocom- 80 min of light irradiation. The TOC removal efficiency of pure
posite was compared with the degradation of other photocatalysts WO3, 5 wt%, 10 wt% and 15 wt% Cu doped WO3 was 12, 48, 55
reported in literature and the results are given in Table 4. The ob- and 62%, respectively.
tained results clearly show that all the Cu incorporated WO3 sam- 10. Elemental Trapping Analysis
ples exhibits better photocatalytic activity than that of pure WO3. To confirm the reactive oxygen species for the decolorization
Moreover, a clear trend was obtained as the photocatalytic activity reaction, the elemental trapping test was performed, and the results
was increased with Cu content. are displayed in Fig. 15. For the radicals trapping test benzoqui-
The pseudo-1st order reaction through a Langmuir-Hinshelwood none (BQ), disodium ethylenediaminetetraacetic acid (EDTA), and
May, 2021Facile synthesis and characterization of WO3/CuWO4 nanocomposites 963
Fig. 13. (a) Pseudo-first-order kinetic plot for photo-decolorization of MB solution as a function of irradiation time. (b) The calculated first
order rate constants of the applied catalysts.
Table 5. Parameters obtained from Pseudo - first - order kinetic plot
for photo-decolorization of MB solution
Degradation Rate constant Correlation
Sample
efficiency (%) k (min 1) coefficient (R2)
pure WO3 70.83 0.0154 0.9968
5 wt% Cu 74.65 0.0175 1.0000
10 wt% Cu 86.46 0.0237 0.9633
15 wt% Cu 88.89 0.0268 0.9945
20 wt% Cu 90.97 0.0301 0.9926
Fig. 15. Elemental trapping test for the prepared NCs of WO3/
CuWO4.
lysts can be considered nanocomposite of WO3 and CuWO4. Hence,
to explain the photocatalytic activity of this composite, these two
types of crystals must be considered in the explanation. First, pure
WO3 crystals can photocatalyze the reaction alone. Under the illu-
mination of UV light, electron/hole pairs will be formed, elec-
trons will be excited and move to CB while the holes will remain
in valence band (VB). The holes can react with water to form OH.
radicals, which have strong option to react with the dye molecule
and discharge their color. However, the photogenerated electrons
Fig. 14. TOC removal efficiency of prepared pure and Cu doped
and holes prefer to recombine instead of migrating to the surface
WO3 catalysts.
to catalyze the photoreactions. This can explain the low photocata-
lytic activity of pure WO3 crystals. However, in the case of WO3/
isopropanol (IPA) were used as a superoxide radicals, holes and CuWO4 nanocomposite, a heterojunction can take place between
hydroxyl radicals, respectively [1,2,59-65]. The addition of BQ greatly the two crystals. Under UV light illumination, electron/hole pairs
reduces the decolorization efficiency up to 43% and it demon- will be formed in the two crystals (Fig. 16). Here, the excited elec-
strates that the superoxide radicals are the key active elements. trons from CuWO4 can travel to the CB of WO3 while the holes
Further the decolorization efficiency was decreased to 72% and in VB of WO3 can travel to the VB of CuWO4. This ensures the
86% with addition of IPA and EDTA, respectively. Hence, from the relatively long separation of electrons and holes and increases the
elemental trapping experiment it could be observed that the superox- chance for the photogenerated species to reach the surface of the
ide radicals and hydroxyl radicals play the major and minor role crystals and perform the photocatalytic decolorization of MB. One
for decolorization reaction. additional factor can be added: the red shift in the bandgap of the
11. Proposed Mechanism composite which increased with increasing copper content means
As mentioned in the characterization results, the prepared cata- that the nanocomposite crystals can harvest photons from higher
Korean J. Chem. Eng.(Vol. 38, No. 5)964 T. Thilagavathi et al.
2. M. R. Abukhadra, M. Shaban, F. Sayed and I. Saad, Environ. Sci.
Pollut. Res., 25, 33264 (2018).
3. A. Yazdanbakhsh, A. Eslami, M. Massoudinejad and M. Avazpour,
Chem. Eng. J., 380, 122497 (2020).
4. L. Kaliraj, J. C. Ahn, E. J. Rupa, S. Abid, J. Lu and D. C. Yang, J.
Photochem. Photobiol. B: Biol., 199, 111588 (2019).
5. R. Abazari, A. R. Mahjoub, L. A. Saghatforoush and S. Sanati,
Mater. Lett., 133, 208 (2014).
6. C. Lian, X. Xiao, Z. Chen, Y. Liu, E. Zhao, D. Wang and C. Chen,
Nano Res., 9, 435 (2016).
7. T. D. Senguttuvan, V. Srivastava, J. S. Tawal, M. Mishra, S. Srivas-
tava and K. Jain, Sens. Actuat. B: Chem., 150, 384 (2010).
Fig. 16. The proposed mechanisms for the photocatalytic decolor- 8. M. Yan, Y. Wu, F. Zhu, Y. Hua and W. Shi, Phys. Chem. Chem.
ization of MB dye under ultraviolet light illumination. Phys., 18, 3308 (2016).
9. N. Dirany, M. Arab, V. Madigou, C. Leroux and J. R. Gavarri, RSC
wavelength area of visible light. Similar explanation was proposed Adv., 6, 69615 (2016).
earlier by Chen et al. [22] and by Salimi et al. [20]. In this way the 10. S. Salmaoui, F. Sediri, N. Gharbi, C. Perruchot, S. Aeiyach, I. A.
migrated electrons (at CB of WO3) produce the superoxide radi- Rutkowska, P. J. Kulesza and M. Jouini, Appl. Surf. Sci., 257, 8223
cals, whereas the holes (at VB of CuWO4) oxidize the water and (2011).
generate the hydroxyl radicals. These reactive radicals react with 11. X. Su, F. Xiao, Y. Li, J. Jian, Q. Sun and J. Wang, Mater. Lett., 64,
the dye molecules and produce the byproducts with releasing the 1232 (2010).
CO2 and H2O [66]. 12. M. Szabó, P. Pusztai, A.-R. Leino, K. Kordás, Z. Kónya and Á. Kuk-
ovecz, J. Molec. Struc., 1044, 99 (2013).
CONCLUSION 13. M. Amini, B. Pourbadiei, T. P. A. Ruberu and L. K. Woo, New J.
Chem., 38, 1250 (2014).
Pure WO3 NPs and WO3/CuWO4 NCs were successfully pre- 14. S. Cao, C. Zhao, T. Han and L. Peng, Mater. Lett., 169, 17 (2016).
pared by co-precipitation method. XRD studies confirmed the 15. B. Deepa and V. Rajendran, Nano-Struct. & Nano-Obj., 16, 185
existence of monoclinic WO3 as well as triclinic CuWO4 structures. (2018).
FESEM images demonstrated the transformation nanoplates to 16. S. Lakshmiprabavathi, K. Govindan, K. Saravana Kumar, A. Jang
irregular sphere-like morphology. SAED dots indicates the pres- and V. Muthuraj, J. Indust. Eng. Chem., 80, 558 (2019).
ence of dominant plane of WO3 (020) and CuWO4 structures. The 17. R. Mahdavi and S. S. A. Talesh, Adv. Powder Technol., 28, 1418
electronic configuration in pure WO3, Cu 2p3/2 & Cu 2p1/2 dou- (2017).
blet and its corresponding peak positions were identified through 18. M. Sajjad, I. Ullah, M. Khan, J. Khan, M. Y. Khan and M. T. Qureshi,
XPS. Estimated band gaps of pure WO3 NPs as 2.61 eV and CuWO4 Res. Phys., 9, 1301 (2018).
completely covered the surface of the WO3 particles, Eg was reduced 19. S. M. AlShehri, J. Ahmed, A. M. Alzahrani and T. Ahamad, New J.
to 2.25 eV for 20 wt% Cu NCs. From the elemental trapping experi- Chem., 41, 8178 (2017).
ment it could be observed that the superoxide radicals and hydroxyl 20. R. Salimi, A. A. Sabbagh Alvani, N. Naseri, S. F. Du and D. Poel-
radicals play the major and minor role for decolorization reaction. man, New J. Chem., 42 11109 (2018).
The TOC removal efficiency (68%) as well as first-order rate con- 21. N. F. A. Neto, Y. G. Oliveira, J. H. O. Nascimento, M. R. D. Bomio
stant was two-times higher for 20 wt% WO3/CuWO4 NCs than and F. V. Motta, J. Mater. Sci. Mater. in Electron., 31 18221 (2020).
pure WO3 NPs. 22. H. Chen, X. Xiong, L. Hao, X. Zhang and Y. Xu, Appl. Surf. Sci.,
389, 491 (2016).
ACKNOWLEDGEMENT 23. I. Aslam, C. Cao, M. Tanveer, M. H. Farooq, W. S. Khan, M. Tahir,
F. Idrees and S. Khalid, RSC Adv., 5, 6019 (2015).
The author T. Thilagavathi would like to express her gratitude 24. M. B. Tahir, G. Nabi and N. R. Khalid, Mater. Sci. Semicond. Proc.,
to Gobi Arts & Science College, Gobichettipalayam for providing 84, 36 (2018).
laboratory facilities. The authors from KKU express their appreci- 25. A. A. Ismail, M. Faisal and A. Al-Haddad, J. Environm. Sci., 66, 328
ation to the Deanship of Scientific Research at King Khalid Uni- (2018).
versity for funding this work through research groups program 26. C. Yu, F. Chen, Z. Liu, K. Yang, H. B. Ji, D. Li, W. Xie and S. Li, J.
under grant number R.G.P.2/60/42. Alloys Compd., 809, 151844 (2019).
27. M. Shkir and S. AlFaify, Sci. Rep., 7, 16091 (2017).
REFERENCES 28. M. Shkir, Z. R. Khan, T. Alshahrani, K. V. Chandekar, M. A. Man-
thrammel, A. Kumar and S. AlFaify, Chin. Phys. B, 29, 116102
1. A. M. Saad, M. R. Abukhadra, S. Abdel-Kader Ahmed, A. M. Elz- (2020).
anaty, A. H. Mady, M. A. Betiha, J.-J. Shim and A. M. Rabie, J. 29. M. Shkir, K. V. Chandekar, T. Alshahrani, A. Kumar, A. Khan and
Environm. Manage., 258, 110043 (2020). S. AlFaify, The Europ. Phys. J. Plus, 135, 816 (2020).
May, 2021Facile synthesis and characterization of WO3/CuWO4 nanocomposites 965
30. M. Shkir, Z. R. Khan, K. V. Chandekar, T. Alshahrani, A. Kumar Mehta, Sens. Actuat. B: Chem., 196, 231 (2014).
and S. AlFaify, Appl. Nanosc., 10, 3973 (2020). 50. D. Li, D. Chandra, R. Takeuchi, T. Togashi, M. Kurihara, K. Saito,
31. K. Ravikumar, S. Agilan, M. Raja, R. Marnadu, T. Alshahrani, M. T. Yui and M. Yagi, Chem. - A Europ. J., 23, 6596 (2017).
Shkir, M. Balaji and R. Ganesh, Phys. B: Cond. Matt., 599, 412452 51. N. Gaillard, Y. Chang, A. DeAngelis, S. Higgins and A. Braun, Int.
(2020). J. Hydrogen Energy, 38, 3166 (2013).
32. S. M. Mariappan, M. Shkir, T. Alshahrani, V. Elangovan, H. Algarni 52. B. Ahmed, A. K. Ojha, A. Singh, F. Hirsch, I. Fischer, D. Patrice
and S. AlFaify, J. Alloys Compd., 22, 157762 (2020). and A. Materny, J. Hazard. Mater., 347, 266 (2018).
33. F. Mehmood, J. Iqbal, A. Gul, W. Ahmed and M. Ismail, Phys. E: 53. S. M. Pourmortazavi, M. Rahimi-Nasrabadi, M. Khalilian-Shalamzari,
Low-dim. Sys. Nanostruc., 88, 188 (2017). H. R. Ghaeni and S. S. Hajimirsadeghi, J. Inorg. Organomet. Poly.
34. C. T. Nguyen, T. P. Pham, T. L. A. Luu, X. S. Nguyen, T. T. Nguyen, Mater., 24, 333 (2014).
H. L. Nguyen and D. C. Nguyen, Ceram. Intern., 46, 8711 (2020). 54. Y. Zhao, X. Wei, Y. Wang and F. Luo, Chem. Phys. Lett., 607, 34
35. D. J. Ham, A. Phuruangrat, S. Thongtem and J. S. Lee, Chem. Eng. (2014).
J., 165, 365 (2010). 55. W. Mu, X. Xie, X. Li, R. Zhang, Q. Yu, K. Lv, H. Wei and Y. Jian,
36. F. Duanmu, Z. Shen, Q. Liu, S. Zhong and H. Ji, Chin. Chem. Lett., RSC Adv., 4, 36064 (2014).
31, 1114 (2020). 56. Y. Keereeta, S. Thongtem and T. Thongtem, Powder Technol., 284,
37. J. Kaur, K. Anand, K. Anand and R. C. Singh, J. Mater. Sci., 53, 85 (2015).
12894 (2018). 57. M. Ezaki, W. Michida and K. Kusakabe, Trans. Tech. Publ., 6, 293
38. S.-J. Liu, Y. Yuan, S.-L. Zheng, J.-H. Zhang and Y. Wang, Dalton (2014).
Trans., 44, 11360 (2015). 58. X. Hu, D. Gao, Y. Li, H. Dong, W. Zhou, L. Yang and Y. Zhang, SN
39. M. B. Tahir and M. Sagir, Sep. Purif. Technol., 209, 94 (2019). Appl. Sci., 1, 119 (2018).
40. S. Zhu, X. Liu, Z. Chen, C. Liu, C. Feng, J. Gu, Q. Liu and D. 59. B. Palanivel, M. Lallimathi, B. Arjunkumar, M. Shkir, T. Alshah-
Zhang, J. Mater. Chem., 20, 9126 (2010). rani, K. S. Al-Namshah, M. S. Hamdy, S. Shanavas, M. Venkatacha-
41. T. Ghodselahi, M. A. Vesaghi, A. Shafiekhani, A. Baghizadeh and lam and G. Ramalingam, J. Environ. Chem. Eng., 22, 104698 (2020).
M. Lameii, Appl. Surf. Sci., 255, 2730 (2008). 60. B. Palanivel, S. d. M. Perumal, T. Maiyalagan, V. Jayarman, C.
42. M. C. Biesinger, L. W. M. Lau, A. R. Gerson and R. S. C. Smart, Ayyappan and M. Alagiri, Appl. Surf. Sci., 498, 143807 (2019).
Appl. Surf. Sci., 257, 887 (2010). 61. B. Palanivel and A. Mani, ACS Omega, 5, 19747 (2020).
43. R. Hatel and M. Baitoul, Mater. Chem. Phys., 225, 169 (2019). 62. B. Palanivel, M. Shkir, T. Alshahrani and A. Mani, Diam. Relat.
44. E. L. S. Souza, J. C. Sczancoski, I. C. Nogueira, M. A. P. Almeida, Mater., 55, 108148 (2020).
M. O. Orlandi, M. S. Li, R. A. S. Luz, M. G. R. Filho, E. Longo and 63. P. Kalisamy, M. Lallimathi, M. Suryamathi, B. Palanivel and M.
L. S. Cavalcante, Ultras. Sonochem., 38, 256 (2017). Venkatachalam, RSC Adv., 10, 28365 (2020).
45. M. Thiruppathi, K. Selvakumar, M. Arunpandian, K. Thirumalai, 64. M. Lallimathi, P. Kalisamy, M. Suryamathi, T. Alshahrani, M.
C. Ramalingan, M. Swaminathan and E. R. Nagarajan, Colloid Shkir, M. Venkatachalam and B. Palanivel, ChemistrySelect, 5,
Surf. A: Phys. Eng. Asp., 563, 148 (2019). 10607 (2020).
46. M. M. Mohamed, T. M. Salama, M. A. Hegazy, R. M. A. Shahba 65. R. Salimi, A. A. S. Alvani, N. Naseri, S. F. Du and D. Poelman, New
and S. H. Mohamed, Int. J. Hydrogen Energy, 44, 4724 (2019). J. Chem., 42, 11109 (2018).
47. S. Ramkumar and G. Rajarajan, Appl. Phys. A., 123, 401 (2017). 66. B. Palanivel, C. Ayappan, V Jayaraman, S. Chidambaram, R.
48. K. Jothivenkatachalam, S. Prabhu, A. Nithya and K. Jeganathan, Maheswaran and A. Mani, Mater. Sci. Semicond. Process., 100, 87
RSC Adv., 4, 21221 (2014). (2019).
49. S. Shukla, S. Chaudhary, A. Umar, G. R. Chaudhary and S. K.
Korean J. Chem. Eng.(Vol. 38, No. 5)You can also read