HIV INFECTION DRIVES INTERFERON SIGNALING WITHIN INTESTINAL SARS- COV-2 TARGET CELLS
←
→
Page content transcription
If your browser does not render page correctly, please read the page content below
HIV infection drives interferon signaling within intestinal SARS-
CoV-2 target cells
Rabiah Fardoos, … , Alasdair Leslie, Henrik N. Kløverpris
JCI Insight. 2021;6(16):e148920. https://doi.org/10.1172/jci.insight.148920.

 Resource and Technical Advance     AIDS/HIV    COVID-19

SARS-CoV-2 infects epithelial cells of the human gastrointestinal (GI) tract and causes related symptoms. HIV infection
impairs gut homeostasis and is associated with an increased risk of COVID-19 fatality. To investigate the potential link
between these observations, we analyzed single-cell transcriptional profiles and SARS-CoV-2 entry receptor expression
across lymphoid and mucosal human tissue from chronically HIV-infected individuals and uninfected controls. Absorptive
gut enterocytes displayed the highest coexpression of SARS-CoV-2 receptors ACE2, TMPRSS2, and TMPRSS4, of
which ACE2 expression was associated with canonical interferon response and antiviral genes. Chronic treated HIV
infection was associated with a clear antiviral response in gut enterocytes and, unexpectedly, with a substantial reduction
of ACE2 and TMPRSS2 target cells. Gut tissue from SARS-CoV-2–infected individuals, however, showed abundant
SARS-CoV-2 nucleocapsid protein in both the large and small intestine, including an HIV-coinfected individual. Thus,
upregulation of antiviral response genes and downregulation of ACE2 and TMPRSS2 in the GI tract of HIV-infected
individuals does not prevent SARS-CoV-2 infection in this compartment. The impact of these HIV-associated intestinal
mucosal changes on SARS-CoV-2 infection dynamics, disease severity, and vaccine responses remains unclear and
requires further investigation.

Find the latest version:
https://jci.me/148920/pdf
RESOURCE AND TECHNIC AL ADVANCE

                                         HIV infection drives interferon signaling
                                         within intestinal SARS-CoV-2 target cells
                                         Rabiah Fardoos,1,2 Osaretin E. Asowata,1,3 Nicholas Herbert,1,3 Sarah K. Nyquist,4,5,6,7 Yenzekile
                                         Zungu,1,3 Alveera Singh,1 Abigail Ngoepe,1 Ian M. Mbano,1,3 Ntombifuthi Mthabela,1 Dirhona Ramjit,1
                                         Farina Karim,1 Warren Kuhn,8 Fusi G. Madela,9 Vukani T. Manzini,9 Frank Anderson,9 Bonnie Berger,10
                                         Tune H. Pers,11 Alex K. Shalek,4,5,6 Alasdair Leslie,1,3,12 and Henrik N. Kløverpris1,2,3,12
                                         Africa Health Research Institute, Durban, South Africa. 2Department of Immunology and Microbiology, University of
                                         1

                                         Copenhagen, Copenhagen, Denmark. 3School of Laboratory Medicine and Medical Sciences, University of KwaZulu-Natal,
                                         Durban, South Africa. 4Institute for Medical Engineering & Science, Department of Chemistry, and Koch Institute for
                                         Integrative Cancer Research, Massachusetts Institute of Technology (MIT), Cambridge, Massachusetts, USA. 5Broad
                                         Institute of MIT and Harvard, Cambridge, Massachusetts, USA. 6Ragon Institute of MGH, MIT and Harvard, Cambridge,
                                         Massachusetts, USA. 7Program in Computational and Systems Biology, MIT, Cambridge, Massachusetts, USA. 8ENT
                                         Department, General Justice Gizenga Mpanza Regional Hospital (Stanger Hospital), University of KwaZulu-Natal, Durban,
                                         South Africa. 9Discipline of General Surgery, Inkosi Albert Luthuli Central Hospital, University of KwaZulu-Natal, Durban,
                                         South Africa. 10Computer Science and Artificial Intelligence Laboratory and Department of Mathematics, MIT, Cambridge,
                                         Massachusetts, USA. 11Novo Nordisk Foundation Center for Basic Metabolic Research, Faculty of Health and Medical
                                         Sciences, University of Copenhagen, Copenhagen, Denmark. 12Division of Infection and Immunity, University College
                                         London, London, United Kingdom.

                                                 SARS-CoV-2 infects epithelial cells of the human gastrointestinal (GI) tract and causes related
                                                 symptoms. HIV infection impairs gut homeostasis and is associated with an increased risk of
                                                 COVID-19 fatality. To investigate the potential link between these observations, we analyzed single-
                                                 cell transcriptional profiles and SARS-CoV-2 entry receptor expression across lymphoid and mucosal
                                                 human tissue from chronically HIV-infected individuals and uninfected controls. Absorptive gut
                                                 enterocytes displayed the highest coexpression of SARS-CoV-2 receptors ACE2, TMPRSS2, and
                                                 TMPRSS4, of which ACE2 expression was associated with canonical interferon response and antiviral
                                                 genes. Chronic treated HIV infection was associated with a clear antiviral response in gut enterocytes
                                                 and, unexpectedly, with a substantial reduction of ACE2 and TMPRSS2 target cells. Gut tissue from
                                                 SARS-CoV-2–infected individuals, however, showed abundant SARS-CoV-2 nucleocapsid protein
                                                 in both the large and small intestine, including an HIV-coinfected individual. Thus, upregulation of
                                                 antiviral response genes and downregulation of ACE2 and TMPRSS2 in the GI tract of HIV-infected
                                                 individuals does not prevent SARS-CoV-2 infection in this compartment. The impact of these HIV-
                                                 associated intestinal mucosal changes on SARS-CoV-2 infection dynamics, disease severity, and
                                                 vaccine responses remains unclear and requires further investigation.
Authorship note: RF and OEA
contributed equally to this work.

Conflict of interest: The authors have
declared that no conflict of interests
exists.                                  Introduction
                                         Gastrointestinal (GI) tract symptoms are observed in up to 60% of COVID-19 patients and precede respi-
Copyright: © 2021, Fardoos et
al. This is an open access article       ratory symptoms (1). SARS-CoV-2 can be detected within intestinal tissues (2, 3), and about 30% of
published under the terms of the         COVID-19 patients harbor detectable viral RNA in their stool (4), which is associated with more severe GI
Creative Commons Attribution 4.0         symptoms (1). The observed GI disorders include vomiting, nausea, and diarrhea; can manifest local and
International License.                   systemic disease; and may lead to fecal-oral transmission of virus (2, 5, 6). High expression of ACE2, the
Submitted: May 27, 2021                  primary receptor for SARS-CoV-2, is found on the luminal surface of differentiated small intestinal epi-
Accepted: July 8, 2021                   thelial cells, whereas crypt-based cells express lower levels (7, 8). Studies of human small intestinal organ-
Published: August 23, 2021               oids show that the mature enterocytes are the major source for SARS-CoV-2 replication (2, 6, 9). These
                                         cells coexpress the serine proteases TMPRSS2 and TMPRSS4, which promote SARS-CoV-2 spike protein
Reference information: JCI Insight.
2021;6(16):e148920.                      fusion and viral entry into enterocytes (6).
https://doi.org/10.1172/jci.                  HIV infection in the GI tract results in rapid and massive CD4+ T cell depletion, with associated chang-
insight.148920.                          es in the microbiome and elevated translocation of microbial products across the epithelial barrier. These

                                                                                                                                                                      1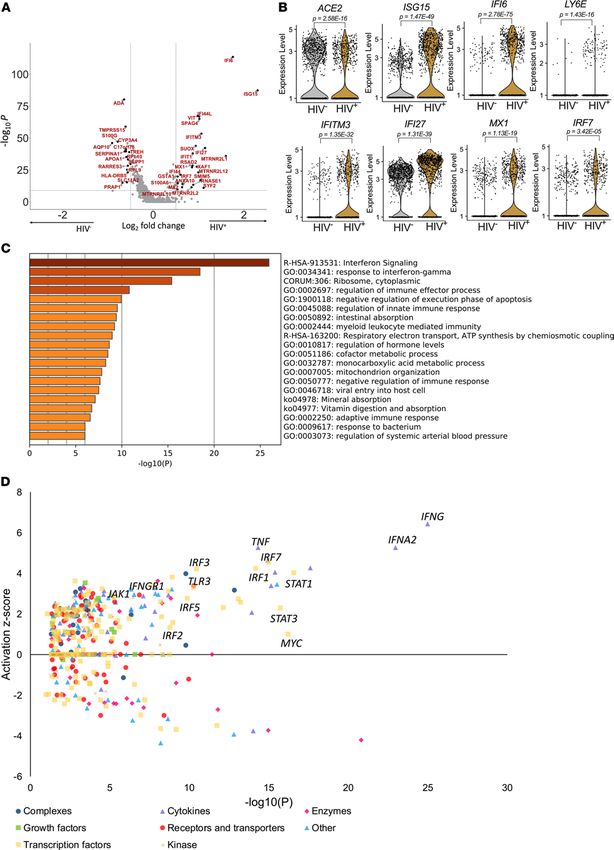
RESOURCE AND TECHNIC AL ADVANCE
events precipitate a so-called leaky gut syndrome, which is thought to be central to HIV pathology (10–13).
The elevated systemic immune activation, inflammatory responses, and gut dysbiosis associated with this
syndrome (14) may influence the overall type I interferon responses, and therefore compromise both local
and systemic responses to SARS-CoV-2 infection, including responses within the lung mucosa (15). Mul-
tiple studies prior to the SARS-CoV-2 pandemic have demonstrated that HIV-induced systemic immune
activation renders HIV-infected individuals vulnerable to airborne infections, such as tuberculosis (16, 17).
Recent data suggest that SARS-CoV-2 and HIV coinfected individuals overall have a 2.1-fold increased risk
of dying from COVID-19 (16), with a risk factor reaching more than 3.5 in viremic individuals with CD4
count below 200 cells/mm3 (18). This is consistent with low nadir CD4+ T cell counts being associated with
increased mortality in COVID-19 patients (19). Therefore, understanding the dynamics of SARS-CoV-2
infection in the gut of HIV-infected individuals is a pressing area of research.
Single-cell transcriptomic analysis from different tissues reported increased coexpression of ACE2 and
TMPRSS2 transcripts in the ileum of SHIV-infected nonhuman primates and within the lung of HIV-in-
fected humans compared with uninfected controls (20), suggesting a potential higher risk of SARS-CoV-2
infection in HIV-infected individuals. One of the isoforms of ACE2, encoded by exon 1c (dACE2), has
recently been confirmed as an interferon-stimulating gene (ISG) and responds directly to type I interferons
and SARS-CoV-2 infection in the small intestine (21). Therefore, type 1 interferon stimulation and altered
regulation of ACE2 could be exploited by SARS-CoV-2 to enhance infection (20). However, no human
studies have determined the impact of HIV infection on SARS-CoV-2 entry receptors in the gut, or on the
transcriptional landscape of the gut enterocytes expressing them.
To explore the potential impact of HIV infection on gut epithelial cells susceptible to SARS-CoV-2
infection, we investigated the gene expression profile of ACE2, TMPRSS2, and TMPRSS4 using single-cell
RNA-Seq (scRNA-Seq) data sets from human SARS-CoV-2–uninfected tonsil, liver, lymph node, duode-
num, and blood, as well as a published human lung scRNA-Seq data set (20). All study participants were
from clinics in KwaZulu-Natal, South Africa, recruited within extremely high HIV-1–endemic areas. Our
data show that ACE2 was associated with interferon response genes in HIV-uninfected individuals, sup-
porting the hypothesis that ACE2 expression is linked with interferon signaling within gut enterocytes. In
addition, and as expected, we show that HIV infection itself drove a strong interferon signaling response in
these cells. Surprisingly, however, HIV infection was associated with a downregulation of ACE2 expression
in all cell types studied. These data suggest that, although ACE2 is associated with interferon signaling
genes, the isoforms detected here are differentially regulated from canonical interferon signaling genes.
The reduction in potential target cells may affect infectability, propagation of infection of SARS-CoV-2 in
HIV-infected individuals, and local and systemic immunity beyond the gut, such as the lung mucosa (15).
Nevertheless, using gut biopsies from coinfected individuals, we observed the presence of SARS-CoV-2 and
HIV proteins in gut enterocytes, indicating this compartment remains vulnerable to infection.
Results
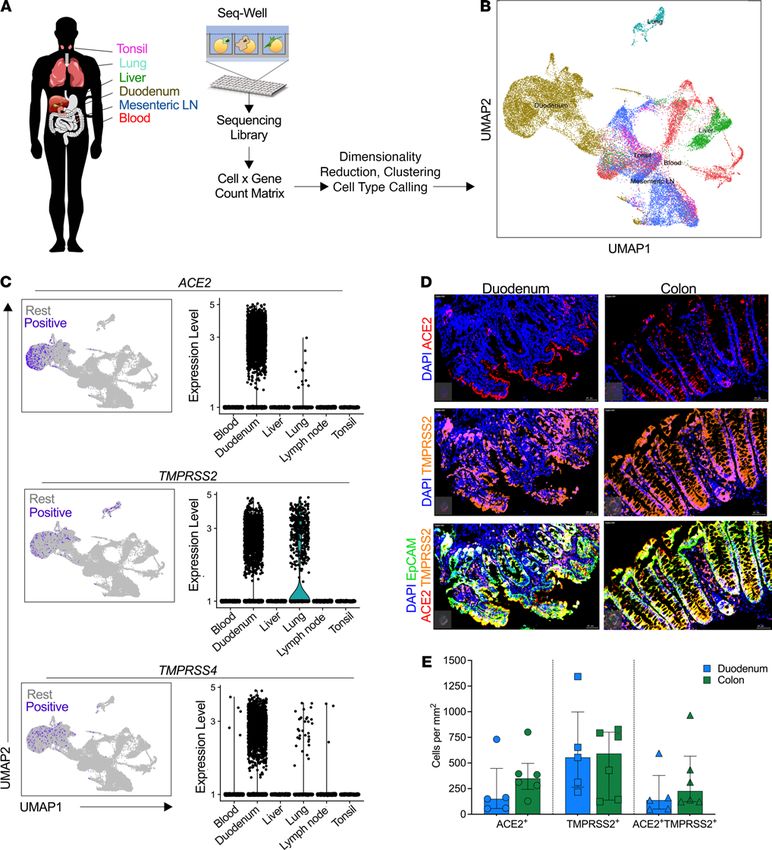
SARS-CoV-2 host entry receptors are enriched in the human small intestine. SARS-CoV-2 infection of human cells
requires surface expression of the primary receptor ACE2 and one of the coreceptors TMPRSS2 (22) or
TMPRSS4 (3, 6). scRNA-Seq analysis showed that ACE2 expression is primarily restricted to type II pneu-
mocytes in the lung, gut absorptive enterocytes, and goblet secretory cells of the nasal mucosa (20). In this
study, we applied high-throughput scRNA-Seq (23, 24) to profile distinct human tissue samples (Figure 1A)
and analyzed 32,381 cells from blood, tonsil, lung, duodenum, and mesenteric lymph node (lung data set
has been previously described in ref. 20) (Figure 1B), for expression of genes encoding ACE2, TMPRSS2,
and TMPRSS4. We identified 18 distinct cellular subclusters in this data set (Supplemental Figure 1A;
supplemental material available online with this article; https://doi.org/10.1172/jci.insight.148920DS1),
with the majority of cells expressing ACE2, TMPRSS2, and TMPRSS4 located within duodenum and to
a lesser extent in lung tissue and with no expression in the other tissues analyzed (Figure 1C). We next
used fluorescence immunohistochemistry to costain epithelial cells (EpCAM) for ACE2 and TMPRSS2 and
found distinct in situ expression patterns between the small and large intestine (Figure 1D and Supplemen-
tal Figure 1B). The duodenum tissue expressed high levels of ACE2 facing outward toward the lumen side,
whereas the colon tissue was characterized by ACE2 expression at the bottom half of the crypt. TMPRSS2
was expressed in most of the epithelial cells and was coexpressed with ACE2 in both duodenum and colon
tissue. We found no quantitative differences in protein expression levels between both compartments for
JCI Insight 2021;6(16):e148920 https://doi.org/10.1172/jci.insight.148920 2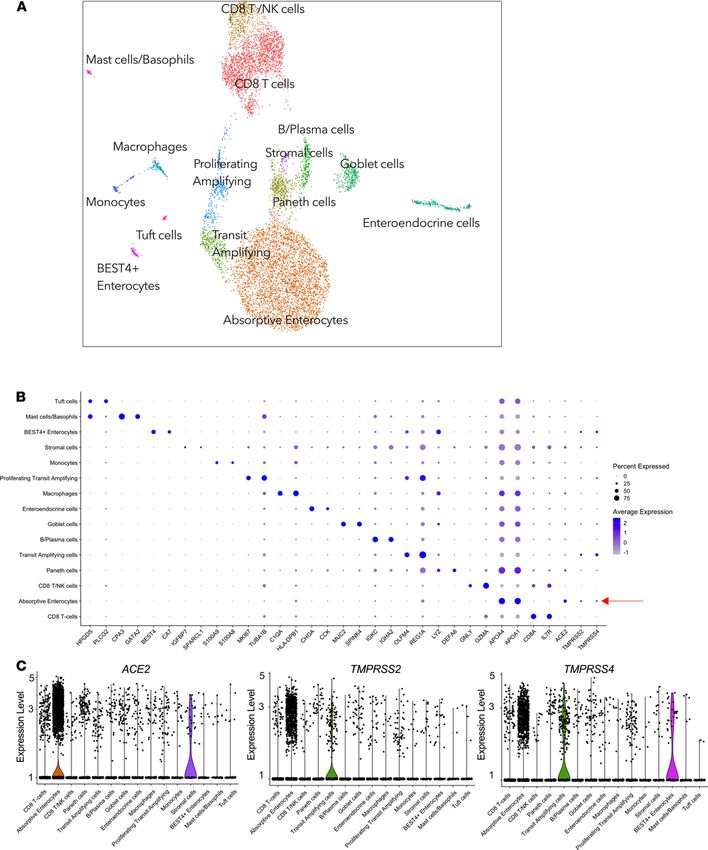
RESOURCE AND TECHNIC AL ADVANCE

Figure 1. SARS-CoV-2 putative target cells are enriched in the human duodenum. (A) Schematic of protocol for isolation of different tissues for scRNA-Seq using
Seq-Well S3, to identify cell types. (B) Uniform manifold approximation and projection (UMAP) of 32,381 cells colored by tissue source. (C) Left: UMAP of epithelial
cells showing expression of ACE2 (top), TMPRSS2 (middle), and TMPRSS4 (bottom) among all tissue sources from human donors. Color coding is as follows:
purple, RNA positive; gray, RNA negative. Right: Corresponding violin plots of expression values for ACE2 (top), TMPRSS2 (middle), and TMPRSS4 (bottom). (D)
Representative fluorescence immunohistochemistry image of gut tissue showing ACE2 (red), TMPRSS2 (orange), EpCAM (green), and DAPI (blue) of duodenum
and colon. Bars: 20 μm for all images. (E) Quantification of ACE2 and TMPRSS2 proportion of total cells stained with EpCAM. Data shown as median ± SD.

                                     ACE2 and TMPRSS2 (Supplemental Table 1 and Figure 1E). High SARS-CoV-2 entry receptor expression
                                     in the small intestine is consistent with recent reports (2, 5, 6, 20) and with detection of SARS-CoV-2
                                     nucleocapsid in the small intestine of infected individuals (3). Locational differences in ACE2 expression
                                     between the duodenum and colon may be linked to the physiology of ACE2 in these compartments, such as

JCI Insight 2021;6(16):e148920 https://doi.org/10.1172/jci.insight.148920                                                                                          3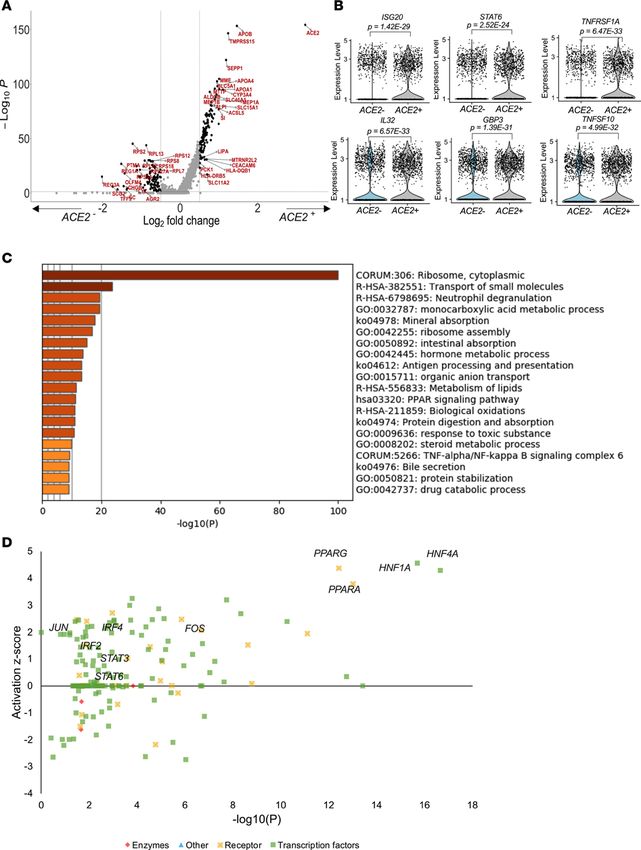
RESOURCE AND TECHNIC AL ADVANCE

                                 Table 1. Characteristics of study participants (n = 24)

                                                                                                    HIV–                                     HIV+ART+
                                                                            A
                                                                             Duo (n = 7)       A
                                                                                                Colon (n = 7)      B
                                                                                                                    Duo (n = 4)          B
                                                                                                                                          Duo (n = 6)
                                 Demographics
                                    Age in years, median (IQR)               43 (33–53)        46.5 (35–53)        43.5 (32–54)       49 (36.25–53.50)
                                 Sex, n (%) median (IQR)
                                    Female, 19 (79)                          43 (27–54)        46.5 (22–52)        43.5 (32–54)           49 (36–54)
                                    Male, 5 (21)                             39 (33–44)         50 (42–57)              NA                    NA
                                 C
                                  Ethnicity, n (%)
                                    Black, 14 (63)                              3 (43)             3 (43)              3 (75)               5 (83)
                                    Colored, 1 (4)                               NA                1 (14)               NA                    NA
                                    Indian, 8 (33)                              4 (57)             3 (43)              1 (25)                1 (17)
                                    White, 1 (4)                                 NA                 NA                 1 (25)                 NA
                                 CD4 count (cells/μL), median (IQR)              ND                 ND                  ND              454 (378–504)
                                 Viral load (copies/mL)                          NA                 NA                  NA
RESOURCE AND TECHNIC AL ADVANCE Figure 2. ACE2 expression is enriched in absorptive enterocytes. (A) UMAP of 13,056 cells from endoscopic pinch biopsies, colored by cell type. (B) Dot plot of 2 defining genes for each cell type and ACE2, TMPRSS2, and TMPRSS4. Dot size represents fraction of cells within cell type expressing a given gene, and color intensity represents binned count-based expression amounts (logscaled UMI+1) among expressing cells. Red arrow indicates cell type with largest proportion of ACE2+TMPRSS2+TMPRSS4+ cells; full results can be found in Supplemental Table 2A. (C) Expression of ACE2 (left), TMPRSS2 (middle), and TMPRSS4 (right) among all subsets from duodenum. UMI, unique molecular identifier. JCI Insight 2021;6(16):e148920 https://doi.org/10.1172/jci.insight.148920 5
RESOURCE AND TECHNIC AL ADVANCE
and progression of a number of inflammatory disorders (31) (Figure 3B). In support of the cell subsetting
approach, pathway analysis of ACE2+ cells was consistent with functional absorptive cells, including path-
ways involved in transport of small molecules, mineral absorption, intestinal absorption, bile secretion, etc.
(Figure 3C). Further subsetting on ACE2+TMPRSS2+ cells as putative SARS-CoV-2 targets and compari-
son with the remaining epithelial cells (Supplemental Table 2C) showed significant upregulation of IFNGR1
within ACE2+TMPRSS2+ cells (Supplemental Table 2C), further supporting the expression of ISG signatures
in susceptible target cells. Analysis of potential upstream drivers of the ACE2-associated DEGs identified
canonical ISG genes, such as STAT3, IRF2, and IRF4 (Figure 3D and Supplemental Table 2D). These data
show that epithelial cells, and particularly the absorptive enterocytes, are enriched for ACE2, TMPRSS2, and
TMPRSS4 expression and that ACE2 expression in these cells is upregulated in conjunction with known ISGs.
HIV infection drives interferon response in gut absorptive enterocytes. HIV infection depletes CD4+ T cells in
the gut and has a major impact on the barrier integrity (10, 12), and the intestinal epithelium is dominated
by absorptive enterocytes with high expression levels of SARS-CoV-2 entry receptors compared with other
epithelial subsets (see Supplemental Figure 3 and Supplemental Table 3A). Therefore, we next determined
the influence of HIV infection on potential SARS-CoV-2 target cells, by comparing the gene expression of
cells from duodenal tissues collected from individuals with chronic HIV infection on long-term antiretroviral
therapy (ART) and HIV-uninfected participants. We found 160 DEGs (134 upregulated and 26 downreg-
ulated; Figure 4A and Supplemental Table 3B). Consistent with the gut mucosal inflammation associated
with HIV (32), these included strong upregulation of numerous canonical ISG and antiviral genes, including
ISG15, IFI6, LY6E, IFITM3, IFI27, MX1, and IRF7 (Figure 4B and Supplemental Table 3B). In contrast to
earlier studies (20), and despite the observed interferon signaling, ACE2 expression was significantly reduced
in enterocytes isolated from subjects with treated chronic HIV infection (Figure 4B), suggesting that ACE2
expression itself may not directly act as an ISG (21). Pathway analysis of DEGs in absorptive enterocytes
showed that HIV infection was associated with a profound upregulation of interferon signaling (Figure 4C).
Analysis of potential upstream drivers of these DEGs indicated type I interferon and multiple interferon
response factors, consistent with a constitutive antiviral response program within absorptive enterocytes that
was induced by HIV infection despite ART (Figure 4D and Supplemental Table 3C). Finally, subsetting on
the remaining ACE2-expressing epithelial cells only showed a consistent strong upregulation of these canon-
ical ISGs in HIV-infected subjects (Supplemental Figure 5, A and B, and Supplemental Table 3D). Taken
together, these data show that, despite suppression of plasma viremia, HIV infection induces a strong inter-
feron antiviral response in gut enterocytes in general and also within ACE2-expressing putative SARS-CoV-2
target cells. However, this does not drive ACE2 expression itself, which is reduced in HIV-infected individuals.
Reduced numbers of ACE2-expressing absorptive enterocytes and SARS-CoV-2 target cells in HIV-infected indi-
viduals. Having observed an unexpected downregulation of ACE2 in HIV-infected subjects, we quantified
the number of epithelial cells susceptible to SARS-CoV-2 infection and compared the relative frequencies
of absorptive enterocytes, goblet cells, and transit-amplifying cells (see Figure 2) between HIV-infected and
uninfected individuals. Overall, the numbers of ACE2- and TMPRSS2-expressing absorptive enterocytes
were significantly reduced in HIV infection, while TMPRSS4 was unaffected (Figure 5A). The same trend
was observed for goblet cells but not for transit-amplifying cells (Figure 5, B and C). When we analyzed
absorptive enterocytes expressing 2 or more entry receptors, we found a similar significant reduction of
all combinations of SARS-CoV-2 putative target cells, with the same trend for goblet cells but not for
transit-amplifying cells (Supplemental Figure 6). Thus, chronic HIV infection appears to reduce the total
frequency of SARS-CoV-2 putative target cells within the small intestine.
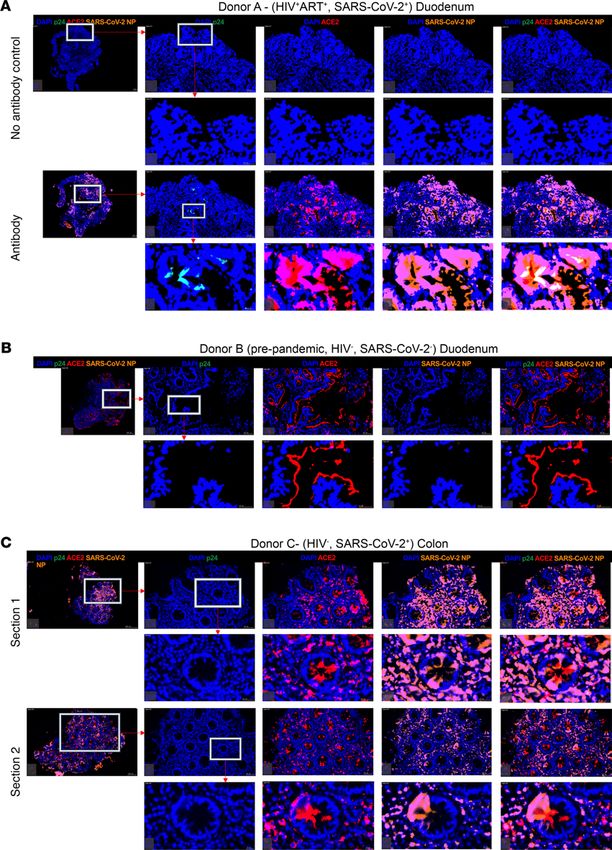
Abundant SARS-CoV-2 detection in small and large intestine irrespective of HIV coinfection. Finally, to determine
if HIV-associated loss of SARS-CoV-2 target cells and upregulation of antiviral genes prevented infection
of the GI tract, we collected gut tissue from confirmed SARS-CoV-2 antigen PCR-positive participants with
and without HIV infection. From a duodenum biopsy obtained from a SARS-CoV-2 and HIV coinfected
individual on ART and with undetectable plasma HIV viremia (Supplemental Table 1), we identified abun-
dant expression of SARS-CoV-2 nucleocapsid protein (NP) within the epithelial layer and colocalized with
that of ACE2 entry receptor (Figure 6A). We found small, but detectable, levels of HIV-p24 protein in the
same area but in cells that did not express ACE2, consistent with distinct viral entry receptor usage between
SARS-CoV-2 and HIV infection. We repeated this staining in a pre-pandemic control sample and observed no
SARS-CoV-2 NP staining (Figure 6B). Histology of colon samples collected from an HIV-uninfected SARS-
CoV-2 PCR-positive donor also revealed abundant SARS-CoV-2 NP expression within the epithelial tissue
JCI Insight 2021;6(16):e148920 https://doi.org/10.1172/jci.insight.148920 6RESOURCE AND TECHNIC AL ADVANCE Figure 3. ACE2-expressing absorptive enterocytes are linked to ISGs and functional absorptive pathways. (A) Volcano plot of DEGs (Supplemental Table 2B) within epithelial cells from HIV-uninfected individuals (n = 4) highlighting genes with more than 0.5 fold change and adjusted P < 5.0 × 10⁸. (B) Violin plots of genes differentially expressed among ACE2+ and ACE2− epithelial cells, FDR-adjusted P < 0.05; full results can be found in Supplemental Table 2B. (C) GO BP enrichment analysis of the DEGs from epithelial cell analysis upregulated in ACE2+ compared with ACE2–. P value was derived by a hypergeomet- ric test. (D) Selected upstream drivers of pathways shown in C from DEGs in Supplemental Table 2D. GO, Gene Ontology; BP, biological pathway. JCI Insight 2021;6(16):e148920 https://doi.org/10.1172/jci.insight.148920 7
RESOURCE AND TECHNIC AL ADVANCE

                                 overlapping with ACE2 (Figure 6C). These data confirm the presence of high levels of SARS-CoV-2 virus
                                 production in the GI tract (3) and show it is likely to occur in HIV-infected individuals despite upregulation of
                                 antiviral immunity and a loss of putative target cells in the small intestine.

                                 Discussion
                                 In this study we performed single-cell transcriptomic profiling across different human tissue sites and identified
                                 high expression of SARS-CoV-2 entry receptors within absorptive enterocytes from the small intestine that
                                 we confirmed by in situ protein staining. We detected overlapping expression of SARS-CoV-2 NP and ACE2
                                 within both the small and large intestine of SARS-CoV-2–infected individuals, confirming the infectability of
                                 these cells in vivo. ACE2, TMPRSS2, and TMPRSS4 expression was highest in the duodenum followed by the
                                 lung, with little or no expression detected in the tonsil, liver, lymph node, and blood, consistent with published
                                 studies (20, 25, 33, 34). We found that ACE2 protein expression was restricted to the luminal region of the
                                 enterocytes in the duodenum, whereas in the colon, ACE2 was located closer to the crypt base (7, 8). This dis-
                                 tinct location may be explained by differences in the physiological processes within these compartments where
                                 luminal duodenal ACE2 is reported to be important in amino acid transport and protein synthesis (35, 36),
                                 consistent with our pathway analysis of ACE2-expressing duodenal epithelial subsets (see Figure 3C).
                                      In HIV-uninfected subjects, ACE2 expression in the small intestine was associated with genes involved in
                                 interferon signaling, in agreement with recent observations and experimental data demonstrating upregula-
                                 tion of ACE2 in response to interferon signaling (20). However, more recently investigators have established
                                 that it is the truncated isoform of ACE2, dACE2, that is most likely to act as an ISG and not ACE2. This study
                                 found that dACE2 was directly upregulated by both interferon stimulation and SARS-CoV-2 infection within
                                 human intestinal organoid cells, but the full-length ACE2 was not (21). Importantly, dACE2 does not function
                                 as a SARS-CoV-2 entry receptor (37). In the future, it would be interesting to also sequence the gut virome of
                                 these individuals to determine how this may contribute to interferon signaling within the intestinal mucosa.
                                 The transcriptomic profile of enterocytes from chronic HIV-infected individuals was characterized by a strong
                                 interferon signaling pathway that included upregulation of canonical ISGs such as ISG15 and IFI27 predicted
                                 to be driven by type I and II interferons. These data highlight the impact from HIV infection on the small
                                 intestine and contribute to understanding of mechanisms underlying the functional consequences in gut bar-
                                 rier integrity and overall pathology (10–13). The reduced frequency of ACE2-expressing cells in the intestinal
                                 mucosa was therefore unexpected. Both ACE2 and canonical ISGs’ (STAT1 and IFI6) levels remained elevat-
                                 ed in absorptive enterocytes from nonhuman primates (NHPs) with treated SIV infection (20). Indeed, IFI6
                                 was also highly upregulated in HIV-infected subjects in our cohort (Figure 3B). Why ACE2-expressing cells
                                 were reduced is not clear from this study. Changes in the microbiome, however, have recently been shown to
                                 alter ACE2 expression levels and disrupt the ACE/ACE2 axis, and HIV is known to cause gut dysbiosis (38,
                                 39). It will therefore be interesting to investigate the link between HIV infection, altered microbiomes, and
                                 ACE2 expression levels in the gut of HIV-infected individuals. The Monocle lineage analysis conducted here
                                 suggests that ACE2 expression may be upregulated as enterocytes progress toward terminal differentiation.
                                 Therefore, a reduction of ACE2-expressing cells could result from interference in this process or in increased
                                 cell death of terminally differentiated ACE2-expressing cells. Individuals in this study were all women on
                                 long-term, fully suppressive ART, which may distinguish them somewhat from the experimentally infected
                                 NHPs, which were treated for 6 months. In addition, the impact of the gut microbiome on ACE2 expres-
                                 sion in the small intestine, discussed above, may affect comparisons between experimental NHP studies and
                                 human cohorts (38, 39). We only used women for the transcriptional data in this study to avoid sex-biased
                                 gene expression, and therefore extending these gene expression profiles beyond women will require further
                                 validation. However, the persistent interferon signature in these women clearly implies that upstream drivers,
                                 such as type I and II interferons, have not diminished.
                                      Although the implications for infectability of the gut mucosa for the SARS-CoV-2 virus remain unclear,
                                 our data from HIV and SARS-CoV-2 coinfected participants from whom we obtained ex vivo duodenum
                                 biopsies showed that SARS-CoV-2 infection certainly can occur in the gut of HIV-infected individuals.
                                 Whether HIV-infected individuals have longer SARS-CoV-2 sequelae from the gut (3) would be interesting to
                                 study in a large coinfected gut biopsy cohort, as would the impact of variant viruses, which may have different
                                 affinities for cell entry receptors (40, 41).
                                      Although the literature is still emerging, in general, studies have observed that COVID-19 patients with
                                 controlled HIV coinfection and preserved CD4+ T cell counts have similar clinical trajectories to those without

JCI Insight 2021;6(16):e148920 https://doi.org/10.1172/jci.insight.148920                                                                        8
RESOURCE AND TECHNIC AL ADVANCE JCI Insight 2021;6(16):e148920 https://doi.org/10.1172/jci.insight.148920 9
RESOURCE AND TECHNIC AL ADVANCE

Figure 4. HIV infection downregulates ACE2 expression and drives interferon signaling in absorptive enterocytes. (A) Volcano plot of DEGs (Supplemental Table
3B) within absorptive enterocytes in HIV-infected and HIV-uninfected cells highlighting genes with more than 0.5-fold change and adjusted P < 5.0 × 10⁸. (B)
Violin plots of expression of ACE2 and interferon-responsive genes among absorptive enterocytes from HIV– (n = 4) and HIV+ART+ (n = 5). (C) GO BP enrichment
analysis of the DEGs of absorptive enterocytes upregulated in HIV– (n = 4) and HIV+ART+ (n = 5). P value was derived by a hypergeometric test. (D) Activation z
score of upstream drivers from DEGs shown in A and Supplemental Table 3D color-coded by their functional categories.

                                    HIV infection (18, 42, 43). By contrast, immune-compromised, HIV-infected individuals with CD4+ T cell
                                    counts below 200 cells/mm3 are associated with increased COVID-19 disease severity and mortality (16, 18).
                                    Whether reduction of potential SARS-CoV-2 target cells in gut mucosa of HIV-infected subjects limits the addi-
                                    tional effects of SARS-CoV-2 infection in this compartment warrants further studies. Further intestinal sam-
                                    pling from coinfected individuals is currently being sought to address this urgent question. Indeed, although
                                    the actual number of SARS-CoV-2 target cells was reduced, interferon signaling and pathways of metabolic
                                    and absorptive changes observed here in HIV-infected subjects prior to SARS-CoV-2 infection may still exac-
                                    erbate disease or limit immunity in some individuals. Whether increased transmissibility of new SARS-CoV-2
                                    variants, including beta and the recent dominant delta variants identified in high HIV prevalence populations
                                    in South Africa (44, 45), alter the GI tract–related symptoms and overall COVID-19 disease severity is also cur-
                                    rently unknown. Finally, potentially altered induction of type I interferons by evolving SARS-CoV-2 variants
                                    could potentially also be linked to signaling within intestinal enterocytes and should be explored further.

                                    Methods
                                    Study participants. Patients presenting to the GI surgical unit of Inkosi Albert Luthuli Central Hospital
                                    were recruited into this study after they provided written informed consent. Tonsil, liver, gut lymph node,
                                    duodenum, and colon biopsies with participant-matched blood samples were obtained during surgical pro-
                                    cedures. Clinical information, including HIV status and demographic details of these participants, was
                                    collected using a structured questionnaire. HIV status was confirmed using the Determine HIV 1/2 Set
                                    (Abbott Laboratories) and COBAS TaqMan HIV-1 Test (Roche).
                                         Sample processing. Mononuclear cells were isolated from blood, tonsil, liver, lymph node, and pooled duo-
                                    denum pinches to average over individual pinch variation. Blood was collected in BD vacutainers with sodium
                                    heparin. Peripheral blood mononuclear cells were isolated using the Ficoll-Histopaque 1077 (MilliporeSigma)
                                    density gradient centrifugation. Duodenum and colon pinch biopsies (2 to 4 pinches) were removed by the
                                    operating GI surgeon and transported to the laboratory in cold PBS (pH 7.2). The PBS was decanted from the
                                    tubes containing the gut biopsies, which are about 5–8 mm in size, and they were incubated in epithelial strip
                                    buffer (PBS, 0.5 M EDTA, 1 M DTT, FBS, and penicillin/streptomycin) in a 37°C water bath for 10 minutes,
                                    with occasional agitation. Thereafter, the epithelial strip buffer was removed, and the tissues were digested in
                                    a buffer containing collagenase-D (0.5 mg/mL; Roche) and DNase I (20 μg/mL; MilliporeSigma) for 30 min-
                                    utes in a 37°C water bath with occasional agitation. Digested tissue was passed through a 70 μm cell strainer
                                    to isolate the cells, and these cells were washed with PBS.
                                         Single-cell RNA-Seq using Seq-Well S3. After obtaining single-cell suspensions from fresh biopsies, we used
                                    the Seq-Well S3 platform. Full methods on implementation of this platform are described (23, 24). Briefly
                                    15,000 cells in 200 mL RPMI with 10% FBS were loaded onto a PDMS array preloaded with barcoded
                                    mRNA capture beads (ChemGenes) and settled by gravity into distinct wells. The loaded arrays were washed
                                    with PBS and sealed using a polycarbonate membrane with a pore size of 0.01 μm, which allows for exchange
                                    of buffers but retains biological molecules within each nanowell. Arrays were sealed in a dry 37°C oven for
                                    40 minutes and submerged in a lysis buffer containing guanidium thiocyanate (MilliporeSigma), EDTA, 1%
                                    β-mercaptoethanol, and sarkosyl (MilliporeSigma) for 20 minutes at room temperature. Arrays were trans-
                                    ferred to hybridization buffer containing NaCl (Thermo Fisher Scientific) and supplemented with 8% (v/v)
                                    polyethylene glycol (PEG, MilliporeSigma) and agitated for 40 minutes at room temperature. mRNA capture
                                    beads with mRNA hybridized were collected from each Seq-Well array, and beads were resuspended in a
                                    master mix for reverse transcription containing Maxima H Minus Reverse Transcriptase (Thermo Fisher Sci-
                                    entific EP0753) and buffer, dNTPs, RNase inhibitor, a 50 template switch oligonucleotide, and PEG for 30
                                    minutes at room temperature, and overnight at 52°C with end-over-end rotation. Exonuclease I treatment was
                                    used (New England Biolabs [NEB] M0293L) to remove excess primers. After exonuclease digestion, bead-
                                    associated cDNA was denatured for 5 minutes in 0.2 mM NaOH with end-over-end rotation. Next, beads
                                    were washed with TE buffer + 0.01% Tween-20, and second strand synthesis was carried out by resuspending

JCI Insight 2021;6(16):e148920 https://doi.org/10.1172/jci.insight.148920                                                                                   10
RESOURCE AND TECHNIC AL ADVANCE
Figure 5. HIV infection reduces the frequency of SARS-CoV-2 putative target cells within the small intestine. (A)
Actual number of absorptive enterocytes (left) and percentage expression (right) of ACE2, TMPRSS2, and TMPRSS4 by
HIV status. (B) Number of goblet cells (left) and percentage (right) expressing ACE2, TMPRSS2, and TMPRSS4 by HIV
status. (C) Number of transit-amplifying cells (left) and percentage (right) expressing ACE2, TMPRSS2, and TMPRSS4
by HIV status. P values by Fisher’s Exact Test. Rest, cells not expressing the indicated transcript.
beads in a master mix containing Klenow Fragment (NEB), dNTPs, PEG, and the dN-SMRT oligonucle-
otide to enable random priming off the beads. PCR amplification was carried out using KAPA HiFi PCR
Mastermix (Kapa Biosystems KK2602) with 2.00 beads per 50 μL reaction volume. After whole transcrip-
tome amplification, libraries were pooled in sets of 6 (12.000 beads) and purified using Agencourt AMPure
XP SPRI beads (Beckman Coulter, A63881) by a 0.6× volume ratio, followed by a 0.8×. Libraries’ size was
analyzed using an Agilent Tapestation high sensitivity D5000 kit (Agilent Technologies) with an expected
peak at 1000 bp and absence of smaller primer peaks. Libraries were quantified using Qubit High-Sensitivity
DNA kit and preparation kit, and libraries were constructed using Nextera XT DNA tagmentation (Illumina
FC-131-1096) using 800 pg of pooled cDNA library as input using index primers with format as done before
(24). Amplified final libraries were purified twice with AMPure XP SPRI beads as before, with a volume ratio
of 0.6× followed by 0.8× yielding library sizes with an average distribution of 650–750 bp. Libraries from 16
Seq-Well arrays were pooled and sequenced together using an Illumina NovaSeq 6000 S2 Reagent Kit v1.5
(100 cycles) using a paired-end read structure with custom read 1 primer: read 1: 20 bases with a 12-base cell
barcode and 8-base UMI; read 2: 82 bases of transcript information, index 1 and index 2: 8 bases.
Single-cell RNA-Seq computational pipeline and analysis. Raw sequencing data were converted to demulti-
plexed FASTQ files using bcl2fastq2 based on Nextera N700 indices corresponding to individual arrays. Reads
were then aligned to hg19 genome assembly and aligned using the Dropseq-tools pipeline on Terra (https://
app.terra.bio). Data were normalized and scaled using Seurat R package v.3.1.0 (https://satijalab.org/seurat/);
JCI Insight 2021;6(16):e148920 https://doi.org/10.1172/jci.insight.148920 11RESOURCE AND TECHNIC AL ADVANCE Figure 6. SARS-CoV-2 nucleocapsid detection overlaps with ACE2 expression in the small and large intestine. Representative fluorescence immunohis- tochemistry (F-IHC) images of duodenum and colon tissues showing HIV-p24 (green), ACE2 (red), SARS-CoV-2 nucleocapsid protein (orange), and DAPI (blue). (A) F-IHC image of a duodenum tissue from an HIV+SARS-CoV-2+ participants by PCR including no antibody control (top). (B) F-IHC image of a duo- denum tissue from an HIV- SARS-CoV-2+ participant. (C) F-IHC image of a colon tissue from HIV-SARS-CoV-2+ with 2 sections shown from the same biopsy tissue. Scale bars are shown at the bottom right of each image. Scale bars: 20 μm and 100 μm for magnified inserts and main images, respectively. JCI Insight 2021;6(16):e148920 https://doi.org/10.1172/jci.insight.148920 12
RESOURCE AND TECHNIC AL ADVANCE

                                 any cell with fewer than 750 UMIs or greater than 2500 UMIs was excluded from further analyses. This cells-
                                 by-genes matrix was then used to create a Seurat object. Cells with any gene expressed in fewer than 5 cells
                                 were discarded from downstream analysis, and any cell with at least 300 unique genes was retained. Cells with
                                 more than 20% of UMIs mapping to mitochondrial genes were then removed. These objects were then merged
                                 into 1 object for pre-processing and cell type identification. The combined Seurat object was log-normalized to
                                 UMI+1 using a scale factor of 10,000. We examined highly variable genes across all cells, yielding 2000 vari-
                                 able genes. Principal component analysis was applied to the cells to generate 100 principal components (PCs).
                                 Using the JackStraw function within Seurat, we identified significant PCs to be used for subsequent clustering
                                 and further dimensionality reduction. For 2D visualization and cell type clustering, we used a UMAP dimen-
                                 sionality reduction technique and with “min_dist” set to 0.5 and “n_neighbors” set to 30. To identify clusters of
                                 transcriptionally similar cells, we employed unsupervised clustering as described above using the FindClusters
                                 tool within the Seurat R package with default parameters and k.param set to 10 and resolution set to 0.5. We
                                 applied the default parameters with a shared nearest neighbor parameter optimized for each combined data
                                 set inside Monocle 3 package (V3.2.0) to construct single-cell pseudo-time trajectory to discover differential
                                 transitions. We used highly variable genes identified by Seurat to sort cells in pseudo-time order. The actual
                                 precursor determined the beginning of pseudo-time in the first round of “orderCells.” UMAP was applied to
                                 reduce dimensional space, and the minimum spanning tree on cells was plotted by the visualization function
                                 “plot_cells” for Monocle 3. To further characterize substructure within cell types (for example, epithelial cells),
                                 we performed dimensionality reduction (PC analysis) and clustering over those cells alone. Differential expres-
                                 sion analysis between the negative and positive groups of the same cell type was performed using the Seurat
                                 package FindAllMarkers in Seurat v3 (setting “test.use” to bimod). For each cluster, DEGs were generated
                                 relative to all the other cells. GO, gene set enrichment, and Kyoto Encyclopedia of Genes and Genomes path-
                                 way analyses from DEGs were performed using Metascape (https://metascape.org), which supports statistical
                                 analysis and visualization profiles for genes and gene clusters.
                                      Histology and multicolor fluorescence immunohistochemistry. Formalin (4%) fixed duodenum and colon tissue
                                 samples were embedded in paraffin, and a 4 μm section of each was obtained on a glass slide. These sections
                                 were deparaffinized and incubated with anti-HIV p24 (clone: Kal-1, Dako), anti–SARS-CoV-2 nucleoprotein
                                 (clone: 40143-T-62, Sino Biological) anti-ACE2 (clone: ab15348; Abcam), anti-TMPRSS2 (clone: ab109131;
                                 Abcam), and anti-EpCAM (clone: ab71916; Abcam) followed by a secondary antibody incubation using the
                                 Opal 4-color manual IHC (PerkinElmer) as instructed by the manufacturer. For Opal fluorophores (Perki-
                                 nElmer), FITC (product number FP1487001KT; PerkinElmer) was used for EpCAM and p24, Texas red
                                 (product number FP1488001KT; PerkinElmer) for ACE2, and Cy5 (product number FP1497001KT; Perkin-
                                 Elmer) for TMPRSS2 and SARS-CoV-2 nucleoprotein signal generation. DAPI was used as the nuclear coun-
                                 terstain. The sections were mounted with the Fluorescence Mounting Medium (catalog number S302380-2;
                                 Agilent Technologies) and cover-slipped, and the edges were sealed with nail polish. The slides were stored at
                                 2°C–8°C until images were acquired.
                                      Microscopy and quantitative image analysis. Images of the tissue sections were acquired using the TissueFAXS
                                 software (TissueGnostics) connected with a Zeiss Axio Observer Z1 inverted microscope (Olympus). The
                                 quantitative analysis of the cells of the different phenotypes within the images was done using the TissueQuest
                                 quantitation software (TissueGnostics).
                                      Data availability. Next-generation sequencing data were deposited in National Center for Biotechnology
                                 Information’s Gene Expression Omnibus under accession number GSE181877.
                                      Statistics. Graphs were plotted using Prism 8.4.3 (GraphPad Inc.). Differences between groups were ana-
                                 lyzed using the Seurat package FindAllMarkers in Seurat v3 (setting ‘‘test.use’’ to bimod). If any other specific
                                 test was used, it has been stated in the figure legends. A P value less than 0.05 was considered significant.
                                      Study approval. This study was approved by the Biomedical Research Ethics Committee of the University
                                 of KwaZulu-Natal (BE 021/13 and BE061/13). Participants gave written informed consent.

                                 Author contributions
                                 RF and OEA performed experiments and analyzed transcriptional data. SN supervised transcriptional analysis.
                                 NH, YZ, AS, AN, and IMM contributed to experimental work. NM consented participants and collected sam-
                                 ples. DR and FK coordinated human tissue sample collection. WK, FGM, VTM, and FA contributed surgical
                                 human tissue samples. BB, THP, and AKS supervised data analysis. AKS, AL, and HNK provided intellectual
                                 input. RF, OEA, AL, and HNK prepared the manuscript. HNK conceptualized and supervised the work.

JCI Insight 2021;6(16):e148920 https://doi.org/10.1172/jci.insight.148920                                                                        13
RESOURCE AND TECHNIC AL ADVANCE
Acknowledgments
HNK is supported by the Wellcome Trust (202485/Z/16/Z). AL is supported by the Wellcome Trust
(210662/Z/18/Z). This work was supported through the Sub-Saharan African Network for TB/HIV Research
Excellence (SANTHE), a DELTAS Africa Initiative (grant DEL-15-006). The DELTAS Africa Initiative is an
independent funding scheme of the African Academy of Sciences (AAS) Alliance for Accelerating Excellence
in Science in Africa and supported by the New Partnership for Africa’s Development Planning and Coordinat-
ing Agency (NEPAD Agency) with funding from the Wellcome Trust (grant 107752/Z/15/Z) and the United
Kingdom government. HNK and AS were supported by SANTHE. AKS was supported, in part, by the Sear-
le Scholars Program, the Beckman Young Investigator Program, the NIH (5U24AI118672, 2R01HL095791,
2U19AI089992, 1R01HL134539, 1R01AI138546), a Sloan Fellowship in Chemistry, and the Bill and Melinda
Gates Foundation. The views expressed in this publication are those of the authors and not necessarily those of
AAS, NEPAD Agency, Wellcome Trust, or the United Kingdom government.
Address correspondence to: Henrik N. Kløverpris, Africa Health Research Institute, K-RITH Tower Building,
719 Umbilo Road, Durban 4001, South Africa. Phone: 27.74.546.6625, 27.31.260.4186, or 45.29.720.910;
Email: henrik.kloverpris@ahri.org.
1. Jin X, et al. Epidemiological, clinical and virological characteristics of 74 cases of coronavirus-infected disease 2019 (COVID-19)
with gastrointestinal symptoms. Gut. 2020;69(6):1002–1009.
2. Lamers MM, et al. SARS-CoV-2 productively infects human gut enterocytes. Science. 2020;369(6499):50–54.
3. Gaebler C, et al. Evolution of antibody immunity to SARS-CoV-2. Nature. 2021;591(7851):639–644.
4. Matheson NJ, Lehner PJ. How does SARS-CoV-2 cause COVID-19? Science. 2020;369(6503):510–511.
5. Xiao F, et al. Evidence for gastrointestinal infection of SARS-CoV-2. Gastroenterology. 2020;158(6):1831–1833.
6. Zang R, et al. TMPRSS2 and TMPRSS4 promote SARS-CoV-2 infection of human small intestinal enterocytes. Sci Immunol.
2020;5(47):eabc3582.
7. Liang W, et al. Diarrhoea may be underestimated: a missing link in 2019 novel coronavirus. Gut. 2020;69(6):1141–1143.
8. Hashimoto T, et al. ACE2 links amino acid malnutrition to microbial ecology and intestinal inflammation. Nature.
2012;487(7408):477–481.
9. Zhou J, et al. Infection of bat and human intestinal organoids by SARS-CoV-2. Nat Med. 2020;26(7):1077–1083.
10. Mattapallil JJ, et al. Massive infection and loss of memory CD4+ T cells in multiple tissues during acute SIV infection. Nature.
2005;434(7037):1093–1097.
11. Veazey RS, Lackner AA. HIV swiftly guts the immune system. Nat Med. 2005;11(5):469–470.
12. Brenchley JM, et al. CD4+ T cell depletion during all stages of HIV disease occurs predominantly in the gastrointestinal tract. J Exp
Med. 2004;200(6):749–759.
13. Esterházy D, et al. Compartmentalized gut lymph node drainage dictates adaptive immune responses. Nature.
2019;569(7754):126–130.
14. Mann ER, et al. Compartment-specific immunity in the human gut: properties and functions of dendritic cells in the colon versus
the ileum. Gut. 2016;65(2):256–270.
15. Trottein F, Sokol H. Potential causes and consequences of gastrointestinal disorders during a SARS-CoV-2 infection. Cell Rep.
2020;32(3):107915.
16. Boulle A, et al. Risk factors for COVID-2019 death in a population cohort study from the Western Cape Province, South Africa
[published online August 29, 2020]. Clin Infect Dis. https://doi.org/10.1093/cid/ciaa1198.
17. Adepoju P. Tuberculosis and HIV responses threatened by COVID-19. Lancet HIV. 2020;3018(20):e319–e320.
18. Karim F, et al. HIV infection alters SARS-CoV-2 responsive immune parameters but not clinical outcomes in COVID-19 disease
[preprint]. https://doi.org/10.1101/2020.11.23.20236828. Posted on medRxiv November 24, 2020.
19. Hoffmann C, et al. Immune deficiency is a risk factor for severe COVID-19 in people living with HIV. HIV Med. 2020;22(5):372–378.
20. Ziegler CGK, et al. SARS-CoV-2 receptor ACE2 is an interferon-stimulated gene in human airway epithelial cells and is detected
in specific cell subsets across tissues. Cell. 2020;181(5):1016–1035.
21. Onabajo OO, et al. Interferons and viruses induce a novel truncated ACE2 isoform and not the full-length SARS-CoV-2 receptor.
Nat Genet. 2020;52(12):1283–1293.
22. Hoffmann M, et al. SARS-CoV-2 cell entry depends on ACE2 and TMPRSS2 and Is blocked by a clinically proven protease
inhibitor. Cell. 2020;181(2):271–280.
23. Hughes TK, et al. Second-strand synthesis-based massively parallel scRNA-seq reveals cellular states and molecular features
of human inflammatory skin pathologies. Immunity. 2020;53(4):878–894.
24. Gierahn TM, et al. Seq-Well: portable, low-cost RNA sequencing of single cells at high throughput. Nat Methods. 2017;14(4):395–398.
25. Muus C, et al. Single-cell meta-analysis of SARS-CoV-2 entry genes across tissues and demographics. Nat Med. 2021;27(3):546–559.
26. Letko M, et al. Functional assessment of cell entry and receptor usage for SARS-CoV-2 and other lineage B betacoronaviruses.
Nat Microbiol. 2020;5(4):562–569.
27. Wu N, et al. The interferon stimulated gene 20 protein (ISG20) is an innate defense antiviral factor that discriminates self versus
non-self translation. PLoS Pathog. 2019;15(10):e1008093.
28. Wurster AL, et al. The biology of Stat4 and Stat6. Oncogene. 2000;19(21):2577–2584.
29. Almasan A, Ashkenazi A. Apo2L/TRAIL: apoptosis signaling, biology, and potential for cancer therapy. Cytokine Growth
JCI Insight 2021;6(16):e148920 https://doi.org/10.1172/jci.insight.148920 14RESOURCE AND TECHNIC AL ADVANCE
Factor Rev. 2003;14(3–4):337–348.
30. Cantarella G, et al. Neutralization of TNFSF10 ameliorates functional outcome in a murine model of Alzheimer’s disease.
Brain. 2015;138(1):203–216.
31. Khawar MB, et al. IL-32: A novel pluripotent inflammatory interleukin, towards gastric inflammation, gastric cancer, and
chronic rhino sinusitis. Mediators Inflamm. 2016;2016:8413768.
32. Brenchley JM, Douek DC. HIV infection and the gastrointestinal immune system. Mucosal Immunol. 2008;1(1):23–30.
33. Lee JJ, et al. Relative abundance of SARS-CoV-2 entry genes in the enterocytes of the lower gastrointestinal tract. Genes (Basel).
2020;11(6):645.
34. Liao M, et al. Single-cell landscape of bronchoalveolar immune cells in patients with COVID-19. Nat Med. 2020;26(6):842–844.
35. Vuille-Dit-Bille RN, et al. Human intestine luminal ACE2 and amino acid transporter expression increased by ACE-inhibitors.
Amino Acids. 2015;47(4):693–705.
36. Camargo SMR, et al. Tissue-specific amino acid transporter partners ACE2 and collectrin differentially interact with hartnup
mutations. Gastroenterology. 2009;136(3):872–882.
37. Monaco CL, et al. Altered virome and bacterial microbiome in human immunodeficiency virus-associated acquired immunodeficiency
syndrome HHS public access. Cell Host Microbe. 2016;9(193):311–322.
38. Santisteban MM, et al. Brain-gut-bone marrow axis: implications for hypertension and related therapeutics. Circ Res.
2016;118(8):1327–1336.
39. Kim S, et al. Altered gut microbiome profile in patients with pulmonary arterial hypertension. Hypertension. 2020;75(4):1063–1071.
40. Clark SA, et al. SARS-CoV-2 evolution in an immunocompromised host reveals shared neutralization escape mechanisms. Cell.
2021;184(10):2605–2617.
41. Kemp SA, et al. SARS-CoV-2 evolution during treatment of chronic infection. Nature. 2021;592(7853):277–282.
42. Sigel K, et al. Coronavirus 2019 and people living with human immunodeficiency virus: outcomes for hospitalized patients in
New York City. Clin Infect Dis. 2020;71(11):2933–2938.
43. Vizcarra P, et al. Description of COVID-19 in HIV-infected individuals: a single-centre, prospective cohort. Lancet HIV.
2020;7(8):e554–e564.
44. San JE, et al. Transmission dynamics of SARS-CoV-2 within-host diversity in two major hospital outbreaks in South Africa.
Virus Evol. 2021;7(1):veab041.
45. Tegally H, et al. Emergence of a SARS-CoV-2 variant of concern with mutations in spike glycoprotein. Nature.
2021;592(7854):438.
JCI Insight 2021;6(16):e148920 https://doi.org/10.1172/jci.insight.148920 15You can also read