IL-6 promotes drug resistance through formation of polyploid giant cancer cells and stromal fibroblast reprogramming
←
→
Page content transcription
If your browser does not render page correctly, please read the page content below
Oncogenesis                                                                                                                                www.nature.com/oncsis

ARTICLE                 OPEN

IL-6 promotes drug resistance through formation of polyploid
giant cancer cells and stromal fibroblast reprogramming
                                                                                         1✉
Na Niu1, Jun Yao2, Robert C. Bast3, Anil K. Sood               4
                                                                   and Jinsong Liu

© The Author(s) 2021

   To understand the role of polyploid giant cancer cells (PGCCs) in drug resistance and disease relapse, we examined the mRNA
   expression profile of PGCCs following treatment with paclitaxel in ovarian cancer cells. An acute activation of IL-6 dominated
   senescence-associated secretory phenotype lasted 2–3 weeks and declined during the termination phase of polyploidy. IL-6
   activates embryonic stemness during the initiation of PGCCs and can reprogram normal fibroblasts into cancer-associated
   fibroblasts (CAFs) via increased collagen synthesis, activation of VEGF expression, and enrichment of CAFs and the GPR77 + /
   CD10 + fibroblast subpopulation. Blocking the IL-6 feedback loop with tocilizumab or apigenin prevented PGCC formation,
   attenuated embryonic stemness and the CAF phenotype, and inhibited tumor growth in a patient-derived xenograft high-grade
   serous ovarian carcinoma model. Thus, IL-6 derived by PGCCs is capable of reprogramming both cancer and stromal cells and
   contributes to the evolution and remodeling of cancer. Targeting IL-6 in PGCCs may represent a novel approach to combating
   drug resistance.

   Oncogenesis (2021)10:65 ; https://doi.org/10.1038/s41389-021-00349-4

INTRODUCTION                                                                          cancers including breast and colorectal cancers [22, 23], and IL-6 is
Most deaths from ovarian cancer occur as a result of treatment                        a therapeutic target in ovarian cancer [24, 25]. Stress-induced IL-6-
resistance and relapse following chemotherapy [1–3]. Polyploid                        and IL-8-activated fibroblasts provide fertile soil for tumor seeds to
giant cancer cells (PGCCs), which can be either mononucleated or                      progress and evolve [26]. After chemotherapy, PGCCs are
multinucleated with variable atypical nuclear morphology, are                         abundantly increased in radiation or post-chemotherapy or
commonly observed in high-grade serous ovarian carcinoma                              treated cells and cancer tissues [5–9], although the underlying
(HGSC), particularly the following chemotherapy. Remarkably,                          mechanisms for how PGCCs communicate with the microenviron-
little attention has been paid to these cells in the cancer research                  ment remain unclear.
community because they were traditionally thought to be                                  We have previously shown that the formation of PGCCs can
nonviable owing to their senescent nature and inability to                            facilitate the drug resistance following the treatment of paclitaxel
execute mitosis [4].                                                                  [6, 7]. In the current report, we examined the mRNA expression
    In contrast to this widely held belief, we and others have                        profile in the initiation stage of PGCC formation and studied the
recently provided evidence that PGCCs are indeed viable and can                       mechanisms involved in embryonic stemness activation and the
grow progressively by amitotic budding, splitting, and bursts of                      paracrine signals that mediate communication with the stromal
proliferation from mononucleated or multinucleated giant cells                        fibroblasts.
[5–12]. PGCCs formed in response to therapeutic stress can
acquire embryonic stemness and generate new drug-resistant
daughter cells [6, 7]. Moreover, single PGCCs are capable of                          MATERIALS AND METHODS
initiating metastasis or tumor growth in immunosuppressed nu/                         Cell lines and treatment
nu mice [11–13]. Thus, PGCCs can activate embryonic program for                       Two human ovarian cancer cell lines, Hey and SKOV3; and patient-derived
dedifferentiation [6, 14] and represent a default cellular and                        xenograft (PDX) cell line (MDACC-HGSC-1, derived from human HGSC)
developmental mechanism that occurs in response to therapy                            were cultured in a corresponding medium as described previously [6, 7].
stress to initiate reprogramming for drug-resistant cells [4, 15–17].                 The origin and purity of all cell lines were verified with short tandem repeat
                                                                                      (STR) analysis before their use in MD Anderson’s Characterized Cell Line
    Tumor microenvironment and inflammation is thought to be                           Core (https://www.mdanderson.org/education-and-research/resources-for-
critical for cancer initiation, development, and progression and                      professionals/scientific-resources/core-facilities-and-services/characterized-
acquisition of drug resistance [18–21]. Inflammatory molecules                         cell-line-core-facility/index.html).
such as IL-6, IL-8, IL-1β, and TNF-α have been shown to contribute                      Paclitaxel (500 nM, Sigma), recombinant human IL-6 protein (R&D
to senescence and cancer initiation and progression in multiple                       Systems, Minneapolis, MN, USA), IL-6R alpha antibody (R&D Systems, for

1
 Departments of Anatomic Pathology, The University of Texas MD Anderson Cancer Center, Houston, Texas 77030, USA. 2Departments of Molecular and Cellular Oncology, The
University of Texas MD Anderson Cancer Center, Houston, Texas 77030, USA. 3Departments of Experimental Therapeutics, The University of Texas MD Anderson Cancer Center,
Houston, Texas 77030, USA. 4Departments of Gynecologic Oncology and Reproductive Medicine, The University of Texas MD Anderson Cancer Center, Houston, Texas 77030,
USA. ✉email: jliu@mdanderson.org

Received: 1 April 2021 Revised: 15 August 2021 Accepted: 23 August 2021
N. Niu et al.
                  2
                      in vitro use only), IL-6R alpha antibody (tocilizumab, for in vivo use in        Primary culture of fibroblasts and coculture of PGCCs and
                      PDX models; Genentech, San Francisco, CA, USA), and apigenin (Sigma)             fibroblasts
                      were used in test groups as described in detail below.                           Fibroblasts were isolated from normal human fallopian tubes and cultured
                                                                                                       as described previously [12]. PGCCs (recovery day 7, marked as PGCCs Sup)
                                                                                                       or corresponding test cells (regular cancer cells, named as group of Reg-
                      Apoptosis and senescence analysis
                                                                                                       sup) were grown in the inserts (pore size 0.4 µm; BD Falcon, Bedford, MA,
                      To detect the apoptosis and senescence of PGCCs at recovery day 7,
                      Annexin V: FITC Apoptosis Detection kit II (BD), and β-Gal staining were         USA), together with the primary fibroblasts for 72 h in the medium of
                      performed as described previously [7].                                           tested groups. Then the supernatant, total RNA, and protein of fibroblasts
                                                                                                       were collected, respectively for downstream experiments [29]. A sub-
                                                                                                       population of GPR77 + /CD10 + fibroblasts was quantified with flow
                      Cell labeling and spheroid formation                                             cytometry using direct antibodies as described previously [30].
                      To visualize the morphology of nuclei, Hey and SKOV3 cells were
                      labeled with pBabe-H2B-GFP as described previously [7]. At recovery
                      day 7, PGCCs from testing groups were dissociated with trypsin (Sigma),
                                                                                                       Blockage of IL-6 function in PDX models
                                                                                                       56 SCID male mice (3-week-old) bearing MDACC-HGSC-1 or Hey ovarian
                      then 5000 PGCCs were cultured in 3 ml human iPS cell medium for
                      another 7 days with low-attachment dishes as reference [6]. The                  cancer xenografts were treated intraperitoneally with PBS (500 µl, contain-
                      number of spheroids with diameter > =200 µm were calculated in test              ing 10% Cremophor EL as control, Sigma), paclitaxel (6 µg/g in 500 µl), IL-
                      groups as described [27].                                                        6R antibody (tocilizumab, 50 µg/g in 500 µl), apigenin (25 µg/g in 500 µl),
                                                                                                       paclitaxel + IL-6R antibody, paclitaxel + apigenin, or paclitaxel + IL-6R
                                                                                                       antibody + apigenin twice a week for 8 weeks. Tumor sizes were recorded
                      RNA sequencing and gene ontology analysis                                        weekly. After 8 weeks of treatment, the mice were sacrificed, and the
                      Total RNA was extracted from PGCCs treated with paclitaxel only (at              tumors were collected for H&E staining and immunohistochemistry (IHC)
                      recovery day 3) and budded daughter cells of Hey and SKOV3 as                    for Collagen I and CD31 as reported previously [23].
                      described previously [6]. Library construction and deep sequencing
                      analysis (50 M reads/sample, DNB-Seq 150PE) were performed in the
                      MD Anderson Science Park Next-Generation Sequencing Facility on an               Analysis of human high-grade serous carcinoma tissue
                      Illumina HiSeq 1000 sequencing system (Illumina Inc., San Diego, CA,             Thirty-eight paired (pre- and postneoadjuvant chemotherapy treatment
                                                                                                       with carboplatin and paclitaxel) HGSC samples were randomly selected
                      USA). Clean fastq files were mapped to the human transcriptome
1234567890();,:

                                                                                                       from the MD Anderson ovarian tumor registry. The prechemotherapy
                      (hg38) using salmon v0.14.1 to generate counts and TPM for each
                      transcript. The summed mapped counts for all samples ranged from                 samples were used as the control group. H&E staining and IHC for collagen
                      29.6 to 30.6 million reads. All RNA-seq data is publicly accessible in           I and CD31 were performed on all 38 cases to observe histologic features
                      Gene Expression Omnibus (GEO) (https://www.ncbi.nlm.nih.gov/geo/                 and analyze the proportion of PGCCs as described previously [6].
                      query/acc.cgi?acc=GSE178745)
                                                                                                       Statistical analysis
                      Verification with quantitative RT-PCR                                             All results of bar graphs were represented as the mean ± SD obtained from
                                                                                                       at least three independent experiments. Statistical differences were
                      To verify the results of RNA sequence, total RNA from the control, PGCC (at
                                                                                                       evaluated using the Student’s t test, one-way analysis of variance, or χ2
                      recovery day 3), and daughter cells were extracted from tested cell lines as
                      reported previously [7]; Primers were designed according to reference [28]       analysis as appropriate with SPSS 13.0 (SPSS Inc, Chicago, IL, USA). P ≤ 0.05
                      and listed in Table S1 [29].                                                     was considered statistically significant.

                      ELISA                                                                            RESULTS
                      Supernatants of Hey cell cultures without FBS were collected at different
                      intervals (0–30 recovery days) following treatment with paclitaxel and           Initiation of PGCCs is associated with activation of a cytokine
                      evaluated using a human Duoset® ELISA kit for IL-1β, IL-6, IL-8, Gro-α,          storm
                      tumor necrosis factor (TNF)-α, granulocyte-macrophage colony-stimulating         To elucidate potential mechanism(s) of PGCC initiation, we
                      factor (GM-CSF; R&D Systems), respectively, according to the manufac-            performed mRNA expression analysis via RNA-seq. The experi-
                      turers’ protocols.                                                               mental design is shown in Fig. 1A. Following treatment with
                                                                                                       paclitaxel, the total mRNA of PGCCs was collected for RNA-seq at
                      Inhibition of proinflammation, propidium iodide staining, and                     recovering day 3 [7]. PGCCs at recovery day 7 were used for
                      flow cytometry                                                                    coculture with fibroblasts. The supernatant and protein of PGCCs
                      Inhibitors of inflammation–IL-6R antibody (0–5 μg/ml, R&D Systems) and            were also collected for downstream ELISA and Western blot
                      apigenin (0-20 μM, Sigma) were incubated with Hey cells individually             analysis.
                      and in combination with and without paclitaxel (500 nM) overnight, and              As expected, treatment with paclitaxel led to mitotic crisis and
                      paclitaxel was removed, and cells were cultured in regular medium for            massive cell death; it also led to the formation of PGCCs (Figure
                      another 24–48 h. On recovery day 3, supernatant and cells were collected         S1). The optimal concentration of paclitaxel for inducing PGCCs
                      respectively. DNA content (≥4 C are defined as PGCCs) was analyzed as             was 500 nM for Hey and SKOV3 cells, as we have previously
                      previously described [6]. Secretion levels of IL-1β, IL-6, IL-8, Gro-α, TNF-α,   reported [7], and 1000 nM for the PDX cell line MDACC-HGSC-1
                      and GM-CSF (also known as CSF2, colony-stimulating factor 2) in the test
                      supernatant (within 24 h) were detected with the ELISA kit as                    (Figure S1A and B). Although many PGCCs were found to be
                      described above.                                                                 senescent [6], 45.2 ± 8.5% (mean ± SD) of PGCCs were viable at
                                                                                                       recovery day 7 (Figure S1C. Q3, viable subgroup; Q2 + Q4,
                                                                                                       apoptotic subgroup). Small daughter cells budded out from the
                      Immunofluorescence and confocal scanning                                          mother PGCCs and formed clones after recovering for 14–21 days
                      To study the expressions of proteins OCT4, NANOG, and SOX2 in PGCCs,
                      and the expression and distribution of collagen I and alpha-smooth muscle
                                                                                                       (Figure S1D).
                      actin (α-SMA) in fibroblasts, immunofluorescence and confocal scanning                RNA-seq analysis showed that more than 2000 genes were up-
                      were performed as previously described [7]. Primary antibodies are listed        or downregulated in PGCCs on recovery day 3 (Fig. 1B). When
                      in Table S2.                                                                     compared to the parental cells, there were 419 upregulated and
                                                                                                       99 downregulated genes in PGCCs in both the Hey and SKOV3 cell
                      Western blotting                                                                 lines (Fig. 1C). When compared with daughter cells, there were
                      Western blot analyses to detect the embryonic markers in cancer cells and        671 upregulated and 270 downregulated genes in PGCCs in both
                      expression levels of VEGF, IL-6R, p-STAT3, and STAT3 in fibroblasts were          the cell lines tested. When pathways were analyzed, the
                      carried out at different time points as described previously [6]. Details of     inflammatory response, including TNF-α, NF-κB, Lipopolysacchar-
                      the primary antibodies are listed in Table S2.                                   ide (LPS), and cytokines were the top upregulated pathways in

                                                                                                                                         Oncogenesis (2021)10:65
N. Niu et al.
                                                                                                                                             3

Fig. 1 Paclitaxel treatment triggers inflammatory response. A Experimental design. After treatment with paclitaxel (PTX; 500 nM) overnight
(16-18 h), ovarian cancer cells, including the control cells without treatment and PGCCs induced by PTX were allowed to recover in their
corresponding regular media. From recovery day 1 to 30, proinflammatory molecule levels were measured in the supernatant every 24 h. Total
mRNA for sequencing was collected at recovery day 3. PGCCs collected at recovery day 7 were used for the coculture system with primary
fibroblasts. B Heat map of the top 2000 genes induced by paclitaxel treatment of Hey and SKOv3 cells (control, PGCCs at recovery day 3, and
daughter cells). C Up- or downregulated genes in PGCCs of Hey and SKOv3 cells (at recovery day 3) compared with the control and daughter
cells. D The top up- or downregulated pathways in PGCCs compared with the control cells. E Top inflammatory molecules that were
upregulated in PGCCs, among which IL-6 and IL-1β, along with CXCL3, were the predominant molecules (arrows). F Representative pictures of
daughter cells (blue arrows) from mother PGCCs (red arrows, at recovery day 21). PGCCs are positive for β-gal staining (lower panels, at
recovery day 21), which indicates senescence. Bars, 50 µm.

Oncogenesis (2021)10:65
N. Niu et al.
4

    Fig. 2 ELISA and Western blot verification of inflammation burst triggered by paclitaxel. A, B ELISA verification of the increased production
    (within 24 h) of inflammatory molecules including IL-6 (peak at recovery day 4, 522.9 pg/ml), IL-1β (peak at recovery day 3, 123.5 pg/ml), TNF-α
    (peak at recovery day 2, 48.9 pg/ml), GM-CSF (peak at recovery day 4, 465.6 pg/ml), IL-8 (peak at recovery day 3, 19.8 ng/ml), and Gro-α (peak
    peak at recovery day 3, 5.1 ng/ml) at different recovering time point. C Phosphorylation of Chk2 and Erk1/2 was activated by paclitaxel
    exposure and kept at a high level for the first two recovering weeks, which was consistent with the elevated inflammatory molecules shown in
    (A) and (B). D Fold increases (via ELISA) in TNF-α (41.2 ± 10.6), IL-8 (75.4 ± 2.7), IL-6 (437.9 ± 15.1), IL-1β (110.6 ± 11.6), Gro-α (27.4 ± 2.2), and GM-
    CSF (73.9 ± 1.8) by PGCCs (at recovery day 3) compared with the control (regular group). E The inflammatory burst at recovery day 3 was
    inhibited by apigenin. Levels of TNF-α, IL-8, IL-6, IL-1β, Gro-α, and GM-CSF decreased by 1 ± 0.1, 0.35 ± 0.06, 0.29 ± 0.03, 0.23 ± 0.04, 0.39 ± 0.04,
    and 0.6 ± 0.08 folds, respectively, compared with the control. *P < 0.05.

    PGCCs (Fig. 1D), while proliferation and cell-division-related                  Their levels reached a peak at recovery day 2–4 and sustained a high
    pathways were inhibited (Fig. 1D). Among the proinflammatory                     level for the following 1–2 weeks of the PGCC life span.
    molecules, IL-6 was the most predominant factor upregulated in                  Phosphorylation of Chk2 and Erk 1/2 proteins was activated as the
    PGCCs (Fig. 1E). Moreover, together with inflammation burst,                     inflammation response waxed and waned (Fig. 2C). Two close bands
    PGCCs (at recovery day 7) were found to go through senescence                   of Chk2 were found, which was commonly seen in activation of
    (PGCCs, 85 ± 7.4%; regular cancer cells, 3.8 ± 2.1%; daughter cells,            inflammatory cascade, due to the isoform or glycosylation [31]. On
    9.4 ± 3.4%), as indicated by positive β-gal staining (Fig. 1F). These           recovery day 3, levels of TNF-α, IL-8, IL-6, IL-1β, Gro-α, and GM-CSF
    results demonstrated that the inflammatory response, dominated                   were increased by 41.2 ± 10.6-, 75.4 ± 2.7-, 437.9 ± 15.1-, 110.6 ± 11.6-,
    by IL-6 and the activation of senescence are associated with the                27.4 ± 2.2-, and 73.9 ± 1.8-fold, respectively, compared with the
    development of PGCCs.                                                           control (Fig. 2D). Notably, IL-6 was the most predominantly increased
       We further validated the mRNA sequencing data with RT-qPCR                   inflammatory molecule that has been found to be involved in
    (Figure S2), ELISA, and Western blotting (Fig. 2) in tested cell lines.         tumorigenesis and cancer stemness and predominantly expressed in
    The expression of representative protein was found to be consistent             PGCCs rather than in diploid cancer cells [32–34]. Apigenin is a plant
    with the RNA-seq data (Figure S2). For the inflammatory burst, we                bioactive compound that was found to be effective to prevent a
    tested the levels of TNF-α, IL-8, IL-6, IL-1β, Gro-α, and GM-CSF                wide range of chronic diseases including cancer, diabetes, and stroke.
    produced by PGCCs within 24 h throughout the 30-day recovery                    In this study, we employed apigenin as a parallel medicine with IL-6
    period (Fig. 2A and B). Following paclitaxel administration, produc-            antibody to investigate the role of inflammation in early events of
    tion of these inflammatory molecules began to increase immediately.              PGCCs development. The production of IL-6, IL-8, IL-1β, and Gro-α

                                                                                                                     Oncogenesis (2021)10:65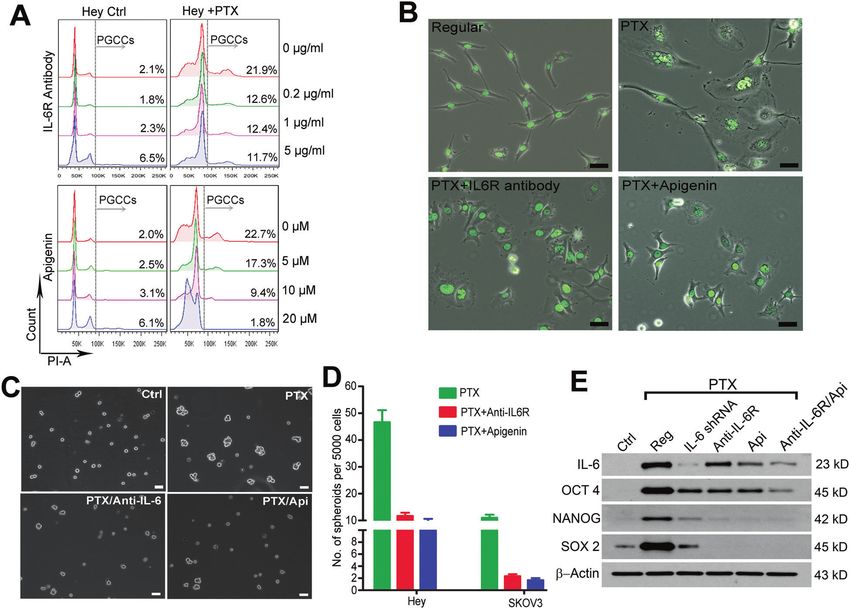
N. Niu et al.
                                                                                                                                                 5

Fig. 3 Inflammation response facilitates the development and stemness of PGCCs. A, B PGCC formation (at recovery day 3) was inhibited
by IL-6R antibody and apigenin in a dose-dependent manner, which was confirmed by population percentage (A, via flow cytometry; PGCCs,
DNA content>4 C as grouped by grey arrows.) and morphological observation (B, DNA was labeled with H2B-GFP). Bars, 50 µm. C, D Spheroid
formation (>=200 µm in diameter) capability of PGCCs was inhibited by apigenin (Api) and IL-6R antibody at day 7. In Hey cells, the number of
spheroids developed after treatment with paclitaxel (PTX), PTX + anti-IL-6R, and PTX + Api were 46.7 ± 7.7, 11.7 ± 2.1, and 10.5 ± 1.1,
respectively. In SKOV3 cells, the number of spheroids in each subgroup was 11.0 ± 2.0, 2.3 ± 0.5, and 1.7 ± 0.6, respectively. Bars, 200 µm.
E Expression of embryonic markers including OCT4, NANOG, and SOX2 in PGCCs (recovery day 7) was downregulated by IL-6 knockdown
(IL-6 shRNA), blocking with IL-6R antibody, apigenin, and IL-6R antibody + Api. Bars, 50 µm.

was inhibited significantly by apigenin (Fig. 2E). These data indicate   (diameter ≥ 200 µm) were developed from PGCCs, with bigger size
that an inflammation burst dominated by IL-6 was involved in the         and embryonic features such as cleavage [6]. We, therefore, next
development of PGCCs.                                                   examined the effect of the inflammatory burst on the activation of
                                                                        stemness in PGCCs by measuring their ability to form spheroids and
IL-6 is involved in activation of embryonic stemness program            the expression levels of OCT4, NANOG, and SOX2. Compared with
in PGCCs                                                                the control group (8 ± 3 per 5000 cells in 3 ml medium), there were
To determine the pleiotropic roles of IL-6 in stemness activation of    46.7 ± 7.7, 11.7 ± 2.1, and 10.0 ± 1.5 spheroids in the paclitaxel,
PGCCs, we blocked the IL-6 feedback loop in PGCCs with IL-6R            paclitaxel + IL-6R antibody, and paclitaxel + apigenin groups, respec-
antibody and/or apigenin. Compared with the control (20.5 ± 4.6%),      tively (Fig. 3C and D). Blockage of IL-6 activity by IL-6R antibody or
blocking the IL-6 pathway with IL-6R antibody reduced the PGCC          apigenin significantly reduced spheroid formation by 75% and
percentage to 12.1 ± 3.3%, 11.8 ± 3.8%, and 10.5 ± 2.1% at the          79.6%, respectively. This indicates inflammation predominated by IL-
concentrations of 0.2, 1, and 5 µg/ml, respectively (Fig. 3A. PGCCs,    6 promote the formation of spheroids from PGCCs. Production of IL-6
DNA content n ≥ 4 C). Blocking the cytokine storm with apigenin also    in PGCCs was downregulated by IL-6 shRNA, IL-6R antibody,
led to significant decreases in the PGCC percentage, to 17.1 ± 2.2,      apigenin, or IL-6R antibody and apigenin combined at different
9.5 ± 1.9, and 1.5 ± 0.5% at concentrations of 5, 10, and 20 µM,        levels (Fig. 3E), which suggests that IL-6 function in PGCCs is
respectively. The inhibition of PGCC formation was further confirmed     controlled in an autocrine feedback manner. Levels of NANOG and
by morphology (Fig. 3B). These studies demonstrated that an early       SOX2 were much more affected by IL-6 inhibition than that of OCT4.
inflammatory response, induced by paclitaxel and dominated by IL-6,      Blocking the IL-6 loop with IL-6R antibody and apigenin extra-
promoted PGCC development, which was inhibited by IL-6R                 cellularly was more efficient than knocking down the production of
antibody and/or doses of IL-6R antibody at 5 µg/ml and apigenin         IL-6 intracellularly with shRNA.
at 10 µM were selected for the following subsequent experiments.
   We previously found that PGCCs could form spheroids in stem cell     IL-6 increases collagen production, the GPR77 + /CD10 +
medium and acquired embryonic stemness marked by expression of          population of fibroblasts, and VEGF expression in fibroblasts
OCT4, NANOG, and SOX2, which are involved in ovarian cancer             We used a coculture system of PGCCs (supernatant of PGCCs,
relapse. Compared with the control, more compacted spheroids            PGCCs Sup), the corresponding regular cancer cells (supernatant

Oncogenesis (2021)10:65
N. Niu et al.
6
    of regular cancer cells, Reg Sup), and fibroblasts in vitro that          respectively (Fig. 5C), and by 2.6-, 2.4-, and 2.0-fold in the Reg Sup,
    mimics the interaction of PGCCs and fibroblasts in vivo. Morpho-          IL-6R antibody, and apigenin groups. These results suggest that
    logic changes in the fibroblasts were apparent in the test groups         PGCC-derived IL-6 may help to maintain the stemness of PGCCs by
    of PGCCs Sup and IL-6 (Figure S3A). In the presence of PGCCs             enriching the GPR77 + /CD10 + population of fibroblasts and
    alone or IL-6 protein alone, fibroblasts showed slow growth with          activating angiogenesis via VEGF.
    increased cell size and abundant cytoplasm, similar to that
    observed with paclitaxel treatment (Figure S3A). However, the            Anti-IL-6R antibody and apigenin reduce PGCC formation and
    development of polyploidy in fibroblasts was induced by                   decrease tumor growth in PDX models
    paclitaxel treatment alone (13.7 ± 1.5 polyploid cells per 5000          To investigate the effect of IL-6 blocking on tumor growth in vivo,
    cells compared to 5.8 ± 0.4 polyploid cells in the control group)        we administered tocilizumab (IL-6R antibody) and apigenin,
    and not by PGCCs Sup or IL-6 (Figure S3B).                               individually or together with paclitaxel, to mice bearing PDX
       To examine the phenotypic conversion of fibroblasts in                 tumors. Compared with the control group, tocilizumab or apigenin
    response to secretions from PGCCs or IL-6 alone, we performed            alone did not significantly affect tumor growth (Fig. 6A), but
    immunofluorescence staining for α-SMA, a commonly used                    paclitaxel alone and combined with tocilizumab, apigenin, or both
    marker for cancer-associated fibroblasts (CAFs). As shown in              the inhibited tumor growth significantly (Fig. 6A). Compared with
    Fig. 4A, the expression of α-SMA was significantly increased in           paclitaxel alone, paclitaxel + tocilizumab + apigenin inhibited
    PGCCs Sup and IL-6 (Control, 2.3 ± 1.5%; Paclitaxel, 37.3 ± 3.2%;        tumor growth most effectively.
    Reg Sup, 19.0 ± 2.1%; PGCCs Sup, 78.0 ± 3.0%; IL-6, 72.7 ± 2.5%).           Histologically, paclitaxel treatment led to the formation of
    Neutralization of IL-6 with IL-6R antibody (23.0 ± 3.6%) and             PGCCs with bizarre nuclei (Figure 6Ba-g) and abundant collagen
    apigenin (15.0 ± 4.6%) decreased the α-SMA positivity in fibro-           deposits in the stroma (Figure S4A). Compared with the control
    blasts. The above data suggest that PGCC-derived IL-6 was the            (1.8 ± 0.7%), PGCCs were significantly induced by paclitaxel
    critical factor in transforming fibroblasts into CAFs. In addition, as    (14.6 ± 5.4%), which was inhibited by co-administration of
    shown in Fig. 4B, we found that PGCCs Sup (554.3 ± 29.7 pg/ml) or        tocilizumab (5.2 ± 2.1%), apigenin (4.8 ± 1.9%), or both (2.5 ±
    IL-6 protein (394.3 ± 23.1 pg/ml) stimulated synthesis of procolla-      0.8%) (Figure 6Bh). The tumor/stroma ratios in the paclitaxel,
    gen I (dissoluble precursor of collagen I) in the fibroblasts, which      paclitaxel + tocilizumab, paclitaxel + apigenin, and paclitaxel +
    was inhibited by IL-6R antibody (167.3 ± 10.7 pg/ml) and apigenin        tocilizumab + apigenin groups were 1.9 ± 0.5, 0.8 ± 0.5, 1.2 ± 0.5,
    (126.0 ± 6.1 pg/ml) (Fig. 4B). We also examined the expression of        and 1.0 ± 0.3, respectively, which were significantly lower than the
    procollagen I’s rate-limiting enzyme for collagen synthesis, lysyl       ratios in the control (6.3 ± 2.9), tocilizumab only (7.7 ± 1.4), and
    oxidase (LOX), and we found that the expression of LOX was               apigenin only (9.5 ± 3.4) groups (Fig. 6C and D, Figure S4B). MVD in
    markedly increased by paclitaxel, PGCCs Sup, and IL-6 protein and        tumor stroma was 23 ± 5.5, 14.5 ± 3.9, 14.3 ± 3.6, and 12.1 ± 3.2
    that these increases could be blocked by shRNA, IL-6R antibody,          microvessels /500 µm diameter in paclitaxel, paclitaxel + tocilizu-
    and apigenin (Fig. 4C). STAT3, a critical downstream protein for         mab, paclitaxel + apigenin, and paclitaxel + tocilizumab + api-
    the IL-6/IL-6R pathway, was found to be highly phosphorylated in         genin, respectively, which was significantly higher than in the
    the test groups mentioned above (Fig. 4C). These data indicate           other three groups (control, tocilizumab only, apigenin only.
    that IL-6/IL-6R signaling is activated in PGCCs, which in turn can       Figure S4C, Fig. 6D). Tocilizumab and apigenin, alone or in
    activate STAT3 phosphorylation and facilitate transformation into        combination, combined with paclitaxel can significantly decrease
    CAFs via the synthesis of collagen by transformed fibroblasts and         the percentage of PGCCs, tumor/stroma ratio, and MVD in tumor
    activation of LOX.                                                       compared with paclitaxel alone. These results suggest that
       The cross-linking and remodeling of collagen after secretion          blockage of PGCC-derived IL-6 can enhance the therapeutic effect
    plays a critical role in collagen maturation and function in the TME.    of paclitaxel by modifying the TME in terms of PGCC formation,
    Thus, we further examined collagen cross-linking and deposition          collagen production, and angiogenesis.
    around the fibroblasts (Fig. 4D and Figure S3C). Compared with
    controls, fibroblasts treated with paclitaxel had more cluster and        Paclitaxel treatment increases collagen deposition,
    spot-like collagen I outside the fibroblasts, indicating that             microvascular density, and the GPR77+/CD10+population of
    paclitaxel exposure can trigger the production and deposition of         fibroblasts in human ovarian cancers
    collagen I from fibroblasts. Compared with the control and Reg            To determine whether the TME is similarly changed following
    Sup groups, fibroblasts incubated with PGCCs Sup or IL-6 protein          chemotherapy in human ovarian cancer, we examined the
    only developed more web-like collagen I with a greater degree of         percentage of PGCCs and stromal changes (marked with collagen
    cross-linking, which was attenuated by IL-6R antibody and                I) in 38 paired pre- and postchemotherapy cases. The percentage
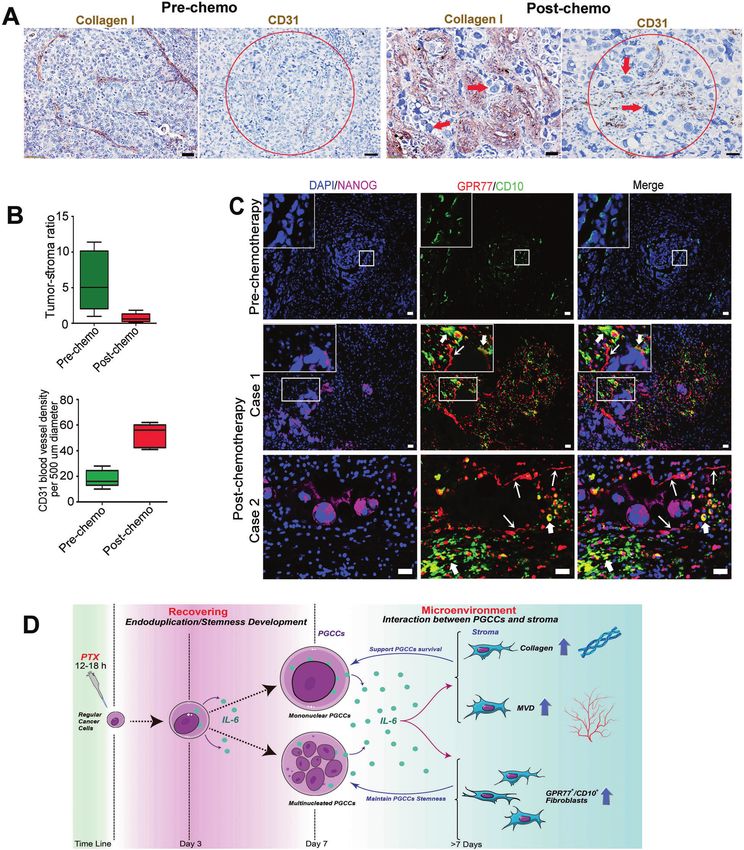
    apigenin. These results show that the IL-6/IL-6R pathway initiated       of PGCCs increased from 23.7% (9/38) before chemotherapy to
    by PGCCs (induced by paclitaxel), rather than paclitaxel per se or       65.7% (25/38) after chemotherapy (P < 0.05; Fig. 7A, red arrow-
    regular cancer cells, plays a key role in the organization and           heads). The tumor/stroma (collagen I) ratio dramatically decreased
    remodeling of collagen I, and this remodeling can be attenuated          from 5.9 ± 1.9 prechemotherapy to 0.7 ± 0.3 postchemotherapy
    by blocking IL-6.                                                        (Fig. 7A and B), while MVD increased from 18.2 ± 6.7 preche-
       The GPR77 + /CD10 + subpopulation of fibroblasts is critical for       motherapy to 52.2 ± 9.2 postchemotherapy (Fig. 7A and B). The
    maintaining the stemness of cancer cells by forming a niche              GPR77 + /CD10 + population of fibroblasts was also found to be
    microenvironment around the cancer cells. To determine whether           mainly distributed around NANOG-positive PGCCs (Fig. 7C). These
    PGCCs affect the expression of GPR77 and CD10, we examined the           data suggest that paclitaxel treatment could promote PGCC
    expression of these two markers in the fibroblasts in the presence        formation and trigger IL-6 production, which is consistent with
    or absence of treatment. As shown in Fig. 5, the GPR77 + /CD10 +         what we found in vitro and in vivo above.
    population of fibroblasts in the PGCCs Sup alone (4.3 ± 0.3%) and
    IL-6 protein alone (1.6 ± 0.2%) groups increased significantly, by
    43-fold and 16-fold, respectively, compared with the control (0.1 ±      DISCUSSION
    0.1%, Fig. 5A and B). This GPR77 + /CD10 + phenotype was                 In this study, we have identified the mechanism for the initiation
    blocked in the presence of IL-6R antibody, apigenin, and their           of PGCCs and their role in generating therapeutic resistance: IL-6, a
    combination (Fig. 5A and B). The expression of VEGF, a well-             well-studied molecule in cancer biology and immunology, plays a
    described angiogenic factor, was also elevated by 5.1-, 8.5-, and        critical role in the initiation of PGCCs and their communication
    3.3-fold in the paclitaxel, PGCCs Sup, and IL-6 protein groups,          with stromal reprogramming factors to acquire chemoresistance.

                                                                                                            Oncogenesis (2021)10:65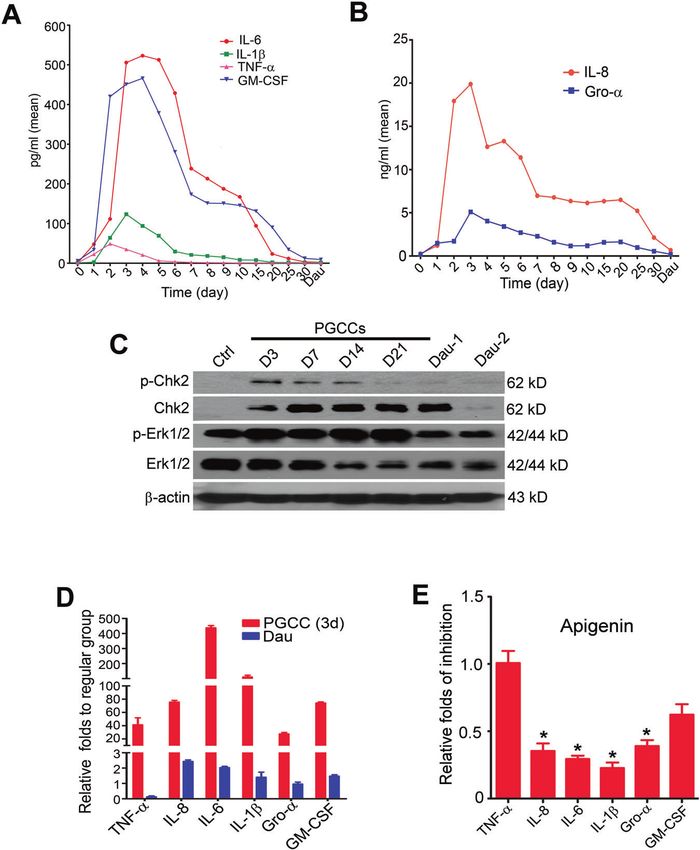
N. Niu et al.
                                                                                                                                                 7

Fig. 4 PGCCs facilitate transformation of CAFs and stimulate production of collagen I by fibroblasts dominantly via IL-6 pathway.
A Coculture of PGCCs or IL-6 with normal fibroblasts (for 72 h) enriched the population of CAFs (indicated as α-SMA positivity), which can be
inhibited by IL-6R antibody and apigenin. Positive percentage of α-SMA in test groups of fibroblasts: Control, 2.3 ± 1.5%; paclitaxel (PTX),
37.3 ± 3.2%; Reg Sup, 19.0 ± 2.1%; PGCCs Sup, 78.0 ± 3.0%; IL-6, 72.7 ± 2.5%; IL-6R antibody, 23.0 ± 3.6%; apigenin, 15.0 ± 4.6%. Bars, 50 µm.
B Level of procollagen I in fibroblasts (cocultured for 72 h) was significantly triggered by PGCCs Sup (554.3 ± 29.7 pg/ml) and IL-6 protein
(394.3 ± 23.1 pg/ml) and reduced by blocking with IL-6R antibody (167.3 ± 10.7 pg/ml) and apigenin (126.5 ± 6.4 pg/ml). C LOX level and
phosphorylation of STAT3 in fibroblasts (cocultured for 72 h) was increased when exposed to PGCCs, IL-6, and PTX and was inhibited by IL-6
knockdown, IL-6R antibody, and apigenin. D Cross-linking and deposition of collagen I outside fibroblasts (cocultured for 72 h) were
significantly apparent and web-like when cocultured with PGCCs or treated by IL-6 protein alone. This cross-linking was attenuated by IL-6R
blockage and apigenin. When treated with PTX only, the collagen is cluster- or spot-like. Panel corners show higher magnification of the
squared areas to clearly show the morphology of collagen. Bars, 50 µm.

Oncogenesis (2021)10:65
N. Niu et al.
8
Fig. 5 PGCCs and IL-6 enriched the GPR77 + /CD10 + population and increased VEGF expression of fibroblasts. A, B GPR77 + /CD10 +
population in fibroblasts increased significantly after treatment with paclitaxel (PTX; 11.5 ± 0.9%), PGCCs Sup (4.3 ± 0.3%), and IL-6 (1.6 ± 0.2%)
compared with the control (0.1 ± 0.1%). C Expression of VEGF in fibroblasts was elevated significantly in the subgroups of PGCCs Sup (8.5 ± 0.4-
fold), PTX (5.1 ± 0.6-fold), and IL-6 (3.3 ± 0.1-fold), respectively, which was inhibited by IL-6R antibody (2.4 ± 0.4-fold), apigenin (2.0 ± 0.2-fold),
or combination (1.4 ± 0.2-fold).
Paclitaxel and other chemotherapy drugs can damage the IL-6 autocrine loop, suggesting that embryonic stem cells are
mitotic spindle and shut down mitosis, which lead a switch of regulated through this autocrine loop. PGCCs can use IL-6 protein
mitotic cell cycle to endoreplication cell cycle and formation of as a paracrine mechanism to facilitate the transformation of
PGCCs. These PGCCs acquire features of stemness and a fibroblast to more tumor promoting CAFs for chemoresistance,
proinflammatory secretory phenotype that contribute to the supporting the established role that the TME plays a critical role in
acquisition of chemoresistance [15]. The IL-6 pathway is essential tumor development and chemoresistance.
for the transformation of fibroblasts into CAFs, which serve as PGCCs have recently been implicated in tumor initiation,
fertile soil for tumor progression [26]. It has been shown that IL-6 resistance, and metastasis [4, 37–39]. The formation of PGCCs has
alone is sufficient to convert non-stem cancer cells to cancer stem been observed in multiple tumors, including ovarian cancer, breast
cells and thus expand the cancer stem cell population in breast cancer, and prostate cancer [27, 39, 40]. Several mechanisms have
and prostate cancerss via an IL-6 feedback loop [32, 35]. IL-6 has recently been described as mediating the therapeutic resistance of
been shown to activate the expression of stem cell markers and PGCCs, including their lipid-dependent metabolism [41] or
confers chemotherapy resistance and predict poor prognosis in promotion of tumor regrowth [39]. The anti-inflammatory inhibi-
ovarian cancer [24, 25, 36]. Here, we found that IL-6 facilitates tors aspirin and resveratrol have been used in the prevention and
PGCC formation and the acquisition of embryonic stemness via an clinical treatment of colorectal cancer via the elimination of
Oncogenesis (2021)10:65N. Niu et al.
9
Fig. 6 Inflammation and IL-6 triggered by paclitaxel exposure facilitate tumor growth and modification of the tumor microenvironment
in vivo. A Tumor-proliferation curve. Inflammation attenuation and IL-6R blocking (with tocilizumab) enhanced the tumor-proliferation
inhibition of paclitaxel (PTX). B Histology features (a-g) and PGCC percentage (h) of tumor in each group. Compared with the control (1.8 ±
0.7%), PGCCs were significantly induced by PTX alone (14.6 ± 5.4%, P < 0.05), which was attenuated by combined administration of PTX with
tocilizumab (5.2 ± 2.1%, P < 0.05) and/or apigenin (4.8 ± 1.9%, P < 0.05), but tocilizumab or apigenin alone had no significant effect. H&E
staining, bars, 50 µm. a, control; b, tocilizumab; c, apigenin; d, PTX; e, PTX + tocilizumab; f, PTX + apigenin; g, PTX + tocilizumab + apigenin.
C PTX can significantly lower the tumor/stroma ratio (Control, 6.3 ± 2.9; PTX, 1.9 ± 0.5), which can be enhanced by tocilizumab (0.8 ± 0.5) and
apigenin (1.2 ± 0.5). D Microvessel density in tumor increased significantly in the subgroups of PTX (23 ± 5.5 per area of 500 µm diameter),
PTX + tocilizumab (14.5 ± 3.9), PTX + apigenin (14.3 ± 3.6), and PTX + tocilizumab + apigenin (12.1 ± 3.2). IL-6R blocking and apigenin reduced
the effect of PTX alone when combined together with PTX.
tetraploid cells [42, 43], which can be considered as polyploid cells On the basis of the above data and others [39, 44, 48, 49], we
in cancer initiation. In addition, IL33 was found to promote the propose a model for paclitaxel-mediated therapeutic effect and
regular diploid tumor cells into PGCCs by snail deregulation and mechanism of resistance as illustrated by Fig. 7D. Following the
p53 inactivation [44, 45]. The formation, migratory and invasive acute insult of paclitaxel, which leads to mitotic crisis and
features of PGCCs have been shown to be are regulated by massive cancer cell death, the remaining cancer cells undergo
inhibition of acid ceramidase, cytoskeletal organization and genomic shock and activate a genomically imprinted emergency
vimentin network [46, 47]. mechanism for survival [50–52]. This shock also leads to the
Our studies support our previous description in which the activation of inflammation dominated by IL-6 and associated
acquisition of resistance is mediated through the giant cell life cycle inflammatory network to reprogram both cancer cells and the
[7]. This process is initiated via activation of an inflammatory cytokine stroma cells and creates microenvironment to promote the
storm that leads to the activation of a stemness program for survival. growth of newly reprogrammed daughter cells for the resistance
The pleiotropic roles of IL-6 make it the most important mediator in and disease relapse.
the TME, forming a niche to favor the survival of PGCCs in two ways: Our data may have significant clinical implication. Anti-IL-6 or
(1) by acting on the PGCCs themselves, helping them to acquire anti-IL-6R antibodies have been used as single agents in clinical
polyploidy and embryonic stemness; and (2) by acting on stromal trials in platinum-resistant patients [24]; however, these trials
fibroblasts to modify the TME in terms of collagen production, VEGF resulted in only modest effects in small numbers of patients. Our
expression of fibroblasts, and enrichment of the GPR77 + /CD10 + data have shown that once the drug-resistant cells become the
population. These effects both favor the survival and maintain the dominant tumor mass, the IL-6 level largely returns toward low
stemness of PGCCs. level, although in drug-resistant tumors, the IL-6 level may be
Oncogenesis (2021)10:65N. Niu et al.
10
Fig. 7 Microenvironment events in human ovarian cancer before and after paclitaxel treatment. A Representative pictures of stroma
(collagen I) and microvessel density (CD31) in paired tumors before and after chemotherapy. PGCCs are indicated by the red arrows. B The
tumor/stroma ratio decreased (prechemo, 5.9 ± 1.9; postchemo, 0.7 ± 0.3; upper panel) while microvessel density increased (prechemo, 18.2 ±
6.7; postchemo, 52.2 ± 9.2; lower panel) in the tumor after chemotherapy. C NANOG (representative embryonic stemness marker) and the
population of GPR77 + /CD10 + fibroblasts in human tumor stroma were increased after paclitaxel treatment. Bars, 50 µm. D Schematic of the
role of IL-6 in PGCC formation and the interaction between PGCCs and fibroblasts. Stressed by paclitaxel (PTX) treatment, cancer cells go
through endoduplication to form PGCCs (mononuclear or multinucleated), and an inflammation response, predominantly IL-6, was triggered.
Autocrine IL-6 plays a critical role in the development of PGCCs. IL-6 produced by PGCCs promotes the transformation of fibroblasts to
synthesize collagen and microvessels, which can support the survival of PGCCs. IL-6 derived from PGCCs can also enrich the GPR77 + /CD10 +
population of fibroblasts, which can maintain the stemness of PGCCs.
Oncogenesis (2021)10:65N. Niu et al.
11
higher than before chemotherapy. In addition, a single agent is 23. Sandberg TP, Stuart M, Oosting J, Tollenaar R, Sier C, Mesker WE. Increased
unlikely to be effective, as the level of IL-6 is highest immediately expression of cancer-associated fibroblast markers at the invasive front and its
after the administration of paclitaxel. Thus, anti-IL-6-based therapy association with tumor-stroma ratio in colorectal cancer. BMC Cancer.
is likely to be most effect when used together with paclitaxel or a 2019;19:284.
24. Coward J, Kulbe H, Chakravarty P, Leader D, Vassileva V, Leinster DA, et al.
combination of paclitaxel and carboplatin at the beginning of
Interleukin-6 as a therapeutic target in human ovarian cancer. Clin Cancer Res.
chemotherapy rather than for patients who have already acquired 2011;17:6083–96.
resistance. In addition, it will be helpful to select patients with a 25. Wang Y, Xingyue Z, Sumegha M, Anirban KM. Daniela M, Kenneth PN. IL-6
high level of IL-6R expression, which is likely to generate a mediates platinum-induced enrichment of ovarian cancer stem cells. JCI Insight.
cytokine storm following chemotherapy. 2018;3:e122360.
In summary, IL-6 may represent a key initiation event for the 26. Kuzet SE, Gaggioli C. Fibroblast activation in cancer: when seed fertilizes soil. Cell
formation of PGCCs and creation of favorable tumor microenvir- Tissue Res. 2016;365:607–19.
onment in response to paclitaxel-mediated chemotherapy. This 27. Mittal K, Donthamsetty S, Kaur R, Yang C, Gupta MV, Reid MD, et al. Multi-
new biologic mechanism calls for clinical trials based on the nucleated polyploidy drives resistance to Docetaxel chemotherapy in prostate
cancer. Br J Cancer. 2017;116:1186–94.
beginning stage of giant cell life cycle and attack this novel
28. Carrero R, Cerrada I, Lledó E, Dopazo J, García-García F, Rubio MP, et al. IL1beta
adaptive mechanism for resistance, which may have the potential induces mesenchymal stem cells migration and leucocyte chemotaxis through
to improve outcomes of patients with ovarian cancers. NF-kappaB. Stem Cell Rev Rep. 2012;8:905–16.
29. Zhang J, Niu N, Li B, McNutt MA. Neuron-derived IgG protects neurons from
complement-dependent cytotoxicity. J Histochem Cytochem. 2013;61:869–79.
REFERENCES 30. Su S, Chen J, Yao H, Liu J, Yu S, Lao L, et al. CD10(+)GPR77(+) cancer-associated
1. Malpica A, Deavers MT, Lu K, Bodurka DC, Atkinson EN, Gershenson DM, et al. fibroblasts promote cancer formation and chemoresistance by sustaining cancer
Grading ovarian serous carcinoma using a two-tier system. Am J Surg Pathol. stemness. Cell. 2018;172:841–56 e816.
2004;28:496–504. 31. Willis WL, Wang L, Wada TT, Gardner M, Abdouni O, Hampton J, et al. The proin-
2. Telleria CM. Repopulation of ovarian cancer cells after chemotherapy. Cancer flammatory protein HMGB1 is a substrate of transglutaminase-2 and forms high-
Growth Metastasis. 2013;6:15–21. molecular weight complexes with autoantigens. J Biol Chem. 2018;293:8394–409.
3. Matulonis UA, Sood AK, Fallowfield L, Howitt BE, Sehouli J, Karlan BY. Ovarian 32. Korkaya H, Kim GI, Davis A, Malik F, Henry NL, Ithimakin S, et al. Activation of an
cancer. Nat Rev Dis Prim. 2016;2:16061. IL6 inflammatory loop mediates trastuzumab resistance in HER2+ breast cancer
4. Chen J, Niu N, Zhang J, Qi L, Shen W, Donkena KV, et al. Polyploid giant cancer by expanding the cancer stem cell population. Mol Cell. 2012;47:570–84.
cells (PGCCs): the evil roots of cancer. Curr Cancer Drug Targets. 2019;19:360–7. 33. Vazquez-Martin A, Anatskaya OV, Giuliani A, Erenpreisa J, Huang S, Salmina K,
5. Erenpreisa JA, Cragg MS, Fringes B, Sharakhov I, Illidge TM. Release of mitotic et al. Somatic polyploidy is associated with the upregulation of c-MYC interacting
descendants by giant cells from irradiated Burkitt’s lymphoma cell line. Cell Biol genes and EMT-like signature. Oncotarget. 2016;7:75235–60.
Int. 2000;24:635–48. 34. Wang AC, Wu FX, Gao YS, Sheng XG. Toll-like receptor 4 single-nucleotide
6. Niu N, Mercado-Uribe I, Liu J. Dedifferentiation into blastomere-like cancer stem polymorphisms Asp299Gly and Thr399Ile in ovarian cancers. Oncol Lett.
cells via formation of polyploid giant cancer cells. Oncogene. 2017;36:4887–4900. 2014;8:438–40.
7. Niu N, Zhang J, Zhang N, Mercado-Uribe I, Tao F, Han Z, et al. Linking genomic 35. Iliopoulos D, Hirsch HA, Wang G, Struhl K. Inducible formation of breast cancer
reorganization to tumor initiation via the giant cell cycle. Oncogenesis. 2016;5:e281. stem cells and their dynamic equilibrium with non-stem cancer cells via
8. Puig PE, Guilly MN, Bouchot A, Droin N, Cathelin D, Bouyer F, et al. Tumor cells IL6 secretion. Proc Natl Acad Sci USA. 2011;108:1397–402.
can escape DNA-damaging cisplatin through DNA endoreduplication and 36. Kumari N, Dwarakanath BS, Das A, Bhatt AN. Role of interleukin-6 in cancer
reversible polyploidy. Cell Biol Int. 2008;32:1031–43. progression and therapeutic resistance. Tumour Biol. 2016;37:11553–72.
9. Sundaram M, Guernsey DL, Rajaraman MM, Rajaraman R. Neosis: a novel type of 37. Amend SR, Torga G, Lin KC, Kostecka LG, de Marzo A, Austin RH, et al. Polyploid
cell division in cancer. Cancer Biol Ther. 2004;3:207–18. giant cancer cells: Unrecognized actuators of tumorigenesis, metastasis, and
10. Walen KH. Spontaneous cell transformation: karyoplasts derived from multi- resistance. Prostate. 2019;79:1489–97.
nucleated cells produce new cell growth in senescent human epithelial cell 38. White-Gilbertson S, Voelkel-Johnson C. Giants and monsters: Unexpected char-
cultures. Vitr Cell Dev Biol Anim. 2004;40:150–8. acters in the story of cancer recurrence. Adv Cancer Res. 2020;148:201–32.
11. Weihua Z, Lin Q, Ramoth AJ, Fan D, Fidler IJ. Formation of solid tumors by a single 39. Mirzayans R, Andrais B, Murray D. Roles of polyploid/multinucleated giant cancer
multinucleated cancer cell. Cancer. 2011;117:4092–9. cells in metastasis and disease relapse following anticancer treatment. Cancers
12. Zhang S, Mercado-Uribe I, Liu J. Tumor stroma and differentiated cancer cells can (Basel). 2018;10:118.
be originated directly from polyploid giant cancer cells induced by paclitaxel. Int 40. Lin KC, Torga G, Sun Y, Axelrod R, Pienta KJ, Sturm JC, et al. The role of het-
J Cancer. 2014;134:508–18. erogeneous environment and docetaxel gradient in the emergence of polyploid,
13. Zhang S, Mercado-Uribe I, Xing Z, Sun B, Kuang J, Liu J. Generation of cancer mesenchymal and resistant prostate cancer cells. Clin Exp Metastasis.
stem-like cells through the formation of polyploid giant cancer cells. Oncogene. 2019;36:97–108.
2014;33:116–28. 41. Sirois I, Aguilar-Mahecha A, Lafleur J, Fowler E, Vu V, Scriver M, et al. A unique
14. Salmina K, Jankevics E, Huna A, Perminov D, Radovica I, Klymenko T, et al. Up- morphological phenotype in chemoresistant triple-negative breast cancer reveals
regulation of the embryonic self-renewal network through reversible polyploidy metabolic reprogramming and PLIN4 expression as a molecular vulnerability. Mol
in irradiated p53-mutant tumour cells. Exp Cell Res. 2010;316:2099–112. Cancer Res. 2019;17:2492–507.
15. Coward J, Harding A. Size Does Matter: Why Polyploid Tumor Cells are Critical 42. Bashir AIJ, Kankipati CS, Jones S, Newman RM, Safrany ST, Perry CJ, et al. A novel
Drug Targets in the War on Cancer. Front Oncol. 2014;4:123. mechanism for the anticancer activity of aspirin and salicylates. Int J Oncol.
16. Liu J. The dualistic origin of human tumors. Semin Cancer Biol. 2018;53:1–16. 2019;54:1256–70.
17. Liu J. The “life code”: A theory that unifies the human life cycle and the origin of 43. Lissa D, Senovilla L, Rello-Varona S, Vitale I, Michaud M, Pietrocola F, et al.
human tumors. Semin Cancer Biol. 2020;60:380–97. Resveratrol and aspirin eliminate tetraploid cells for anticancer chemoprevention.
18. Balkwill F, Mantovani A. Inflammation and cancer: back to Virchow? Lancet. Proc Natl Acad Sci USA. 2014;111:3020–5.
2001;357:539–45. 44. Kudo-Saito C, Miyamoto T, Imazeki H, Shoji H, Aoki K, Boku N. IL33 is a key driver
19. Quail DF, Joyce JA. Microenvironmental regulation of tumor progression and of treatment resistance of cancer. Cancer Res. 2020;80:1981–90.
metastasis. Nat. Med. 2013;19:1423–37. 45. White-Gilbertson S, Lu P, Norris JS, Voelkel-Johnson C. Genetic and pharmaco-
20. Rohnalter V, Roth K, Finkernagel F, Adhikary T, Obert J, Dorzweiler K, et al. A logical inhibition of acid ceramidase prevents asymmetric cell division by neosis.
multi-stage process including transient polyploidization and EMT precedes the J Lipid Res. 2019;60:1225–35.
emergence of chemoresistent ovarian carcinoma cells with a dedifferentiated 46. Xuan B, Ghosh D, Cheney EM, Clifton EM, Dawson MR. Dysregulation in actin
and pro-inflammatory secretory phenotype. Oncotarget. 2015;6:40005–25. cytoskeletal organization drives increased stiffness and migratory persistence in
21. Korkaya H, Liu S, Wicha MS. Regulation of cancer stem cells by cytokine networks: polyploidal giant cancer cells. Sci Rep. 2018;8:11935.
attacking cancer’s inflammatory roots. Clin Cancer Res. 2011;17:6125–9. 47. Xuan B, Ghosh D, Jiang J, Shao R, Dawson MR. Vimentin filaments drive migratory
22. Hartman ZC, Poage GM, den Hollander P, Tsimelzon A, Hill J, Panupinthu N, et al. persistence in polyploidal cancer cells. Proc Natl Acad Sci USA. 2020;117:26756–65.
Growth of triple-negative breast cancer cells relies upon coordinate autocrine 48. Mirzayans R, Andrais B, Kumar P, Murray D. Significance of wild-type
expression of the proinflammatory cytokines IL-6 and IL-8. Cancer Res. p53 signaling in suppressing apoptosis in response to chemical genotoxic
2013;73:3470–80. agents: impact on chemotherapy outcome. Int J Mol Sci. 2017;18:928.
Oncogenesis (2021)10:65N. Niu et al.
12
49. Leong SP, Aktipis A, Maley C. Cancer initiation and progression within the cancer ADDITIONAL INFORMATION
microenvironment. Clin Exp Metastasis. 2018;35:361–7. Supplementary information The online version contains supplementary material
50. McClintock B. The significance of responses of the genome to challenge. Science. available at https://doi.org/10.1038/s41389-021-00349-4.
1984;226:792–801.
51. Liu J. Giant cells: Linking McClintock’s heredity to early embryogenesis and tumor Correspondence and requests for materials should be addressed to Jinsong Liu.
origin throughout millennia of evolution on Earth. Semin Cancer Biol. 2021;8:
S1044–579X. Reprints and permission information is available at http://www.nature.com/
52. Heng J, Heng HH. Genome chaos: creating new genomic information essential reprints
for cancer macroevolution. Semin Cancer Biol. 2020;13:S1044–579X.
Publisher’s note Springer Nature remains neutral with regard to jurisdictional claims
in published maps and institutional affiliations.
ACKNOWLEDGEMENTS
This work is supported in part by Moonshot program in ovarian cancer and M. D.
Anderson Cancer Center SPORE in Ovarian Cancer (P50CA217685. RCB, AS, JL.).
Open Access This article is licensed under a Creative Commons
Attribution 4.0 International License, which permits use, sharing,
AUTHOR CONTRIBUTIONS adaptation, distribution and reproduction in any medium or format, as long as you give
J.L. had full access to all the data in the study and takes responsibility for the integrity appropriate credit to the original author(s) and the source, provide a link to the Creative
of the data and the accuracy of the data analysis. Study concept and design: Commons license, and indicate if changes were made. The images or other third party
All authors. Acquisition, analysis, or interpretation of data: All authors. Drafting of the material in this article are included in the article’s Creative Commons license, unless
manuscript: N.N., J.L. Critical revision of the manuscript for important intellectual indicated otherwise in a credit line to the material. If material is not included in the
content: J.L., A.K.S, and R.C.B. Statistical and RNA-seq analysis: N.N., J.Y. Study article’s Creative Commons license and your intended use is not permitted by statutory
supervision: J.L. regulation or exceeds the permitted use, you will need to obtain permission directly
from the copyright holder. To view a copy of this license, visit http://creativecommons.
org/licenses/by/4.0/.
COMPETING INTERESTS
The authors declare no competing interests. © The Author(s) 2021
Oncogenesis (2021)10:65You can also read


