Implication of specific retinal cell type involvement and gene expression changes in AMD progression using integrative analysis of single cell and ...
←
→
Page content transcription
If your browser does not render page correctly, please read the page content below
www.nature.com/scientificreports
OPEN Implication of specific retinal
cell‑type involvement and gene
expression changes in AMD
progression using integrative
analysis of single‑cell and bulk
RNA‑seq profiling
Yafei Lyu1,9, Randy Zauhar2,9, Nicholas Dana3, Christianne E. Strang4, Jian Hu1, Kui Wang1,5,
Shanrun Liu6, Naifei Pan7, Paul Gamlin8, James A. Kimble8, Jeffrey D. Messinger8,
Christine A. Curcio8, Dwight Stambolian3* & Mingyao Li1*
Age‐related macular degeneration (AMD) is a blinding eye disease with no unifying theme for its
etiology. We used single-cell RNA sequencing to analyze the transcriptomes of ~ 93,000 cells from the
macula and peripheral retina from two adult human donors and bulk RNA sequencing from fifteen
adult human donors with and without AMD. Analysis of our single-cell data identified 267 cell-type-
specific genes. Comparison of macula and peripheral retinal regions found no cell-type differences but
did identify 50 differentially expressed genes (DEGs) with about 1/3 expressed in cones. Integration
of our single-cell data with bulk RNA sequencing data from normal and AMD donors showed
compositional changes more pronounced in macula in rods, microglia, endothelium, Müller glia, and
astrocytes in the transition from normal to advanced AMD. KEGG pathway analysis of our normal
vs. advanced AMD eyes identified enrichment in complement and coagulation pathways, antigen
presentation, tissue remodeling, and signaling pathways including PI3K-Akt, NOD-like, Toll-like, and
Rap1. These results showcase the use of single-cell RNA sequencing to infer cell-type compositional
and cell-type-specific gene expression changes in intact bulk tissue and provide a foundation for
investigating molecular mechanisms of retinal disease that lead to new therapeutic targets.
AMD is a leading cause of legal blindness worldwide. It affects over 10 million A mericans1, twice the number
affected by Alzheimer’s disease and equal to the total of all cancer patients combined2, and is expected to increase
as the population ages. AMD primarily affects the m acula3, a specialized region in the retina of humans and
non-human primates. While there are short-term therapies available for one type of AMD, the underlying
disease has no proven treatments, and vision loss is an eventual outcome for many individuals. While advances
in retinal disease diagnostics have progressed rapidly, specific treatments for AMD directed at primary genetic
or metabolic defects have progressed slowly due to a lack of understanding of the disease pathway. The slow
1
Department of Biostatistics, Epidemiology and Informatics, University of Pennsylvania Perelman School of
Medicine, Philadelphia, PA 19104, USA. 2Department of Chemistry and Biochemistry, The University of the
Sciences in Philadelphia, Philadelphia, PA 19104, USA. 3Departments of Ophthalmology and Human Genetics,
University of Pennsylvania Perelman School of Medicine, Philadelphia, PA 19104, USA. 4Department of
Psychology, University of Alabama At Birmingham, Birmingham, AL 35294, USA. 5Department of Information
Theory and Data Science, School of Mathematical Sciences and LPMC, Nankai University, Tianjin 30071,
China. 6Department of Biochemistry and Molecular Genetics, University of Alabama At Birmingham, Birmingham,
AL 35294, USA. 7Department of Computer and Information Science, University of Pennsylvania, Philadelphia,
PA 19104, USA. 8Department of Ophthalmology and Visual Sciences, University of Alabama At Birmingham,
Birmingham, AL 35294, USA. 9These authors contributed equally: Yafei Lyu and Randy Zauhar. *email: stamboli@
pennmedicine.upenn.edu; mingyao@pennmedicine.upenn.edu
Scientific Reports | (2021) 11:15612 | https://doi.org/10.1038/s41598-021-95122-3 1
Vol.:(0123456789)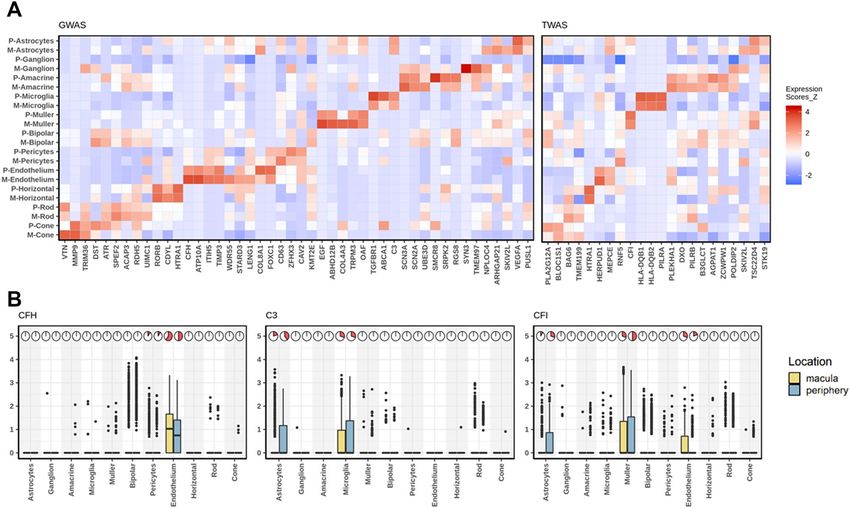
www.nature.com/scientificreports/

          Scientific Reports |   (2021) 11:15612 |   https://doi.org/10.1038/s41598-021-95122-3   2

Vol:.(1234567890)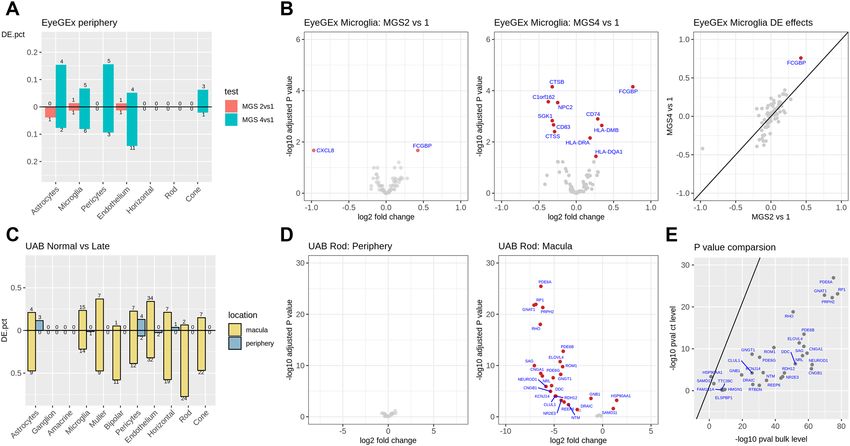
www.nature.com/scientificreports/
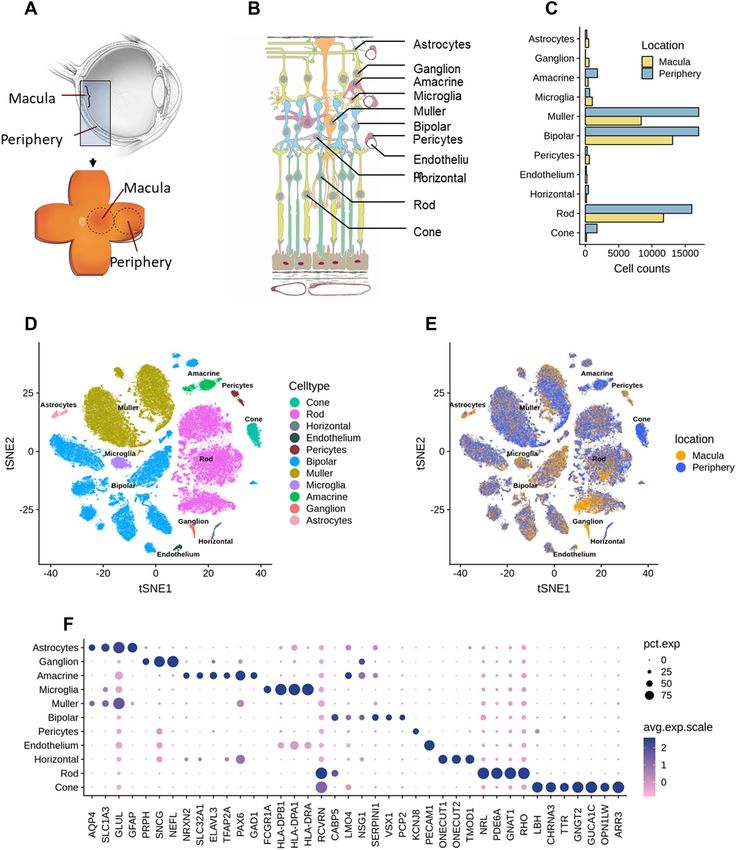
◂Figure 1. Summary of single-cell analysis from human retina. (A) Schematic cross-section of human eye (top)
showing the retina lining the interior surface. The macula contains the fovea and is responsible for sharp vision.
The periphery is responsible for detecting light and motion. Schematic of dissected tissue (bottom) shows
retina adjoined to support tissues, flattened with relaxing cuts. Areas 8 mm in diameter were excised for RNA
sequencing. (B) Layers of human retina and supporting tissues showing 11 assayed cell types. Five neuronal
classes are photoreceptors, bipolar cells, ganglion cells, horizontal and amacrine cells. Cone photoreceptors
are sensitive to color and bright light. Rod photoreceptors are sensitive to low light. Ganglion cells transmit
information to the brain. Horizontal cells and amacrine cells modulate signal from photoreceptors and bipolar
cells, respectively. Müller glia span the retina and are involved in neurotransmission, fluid balance, and wound
repair. Also depicted are microglia (with phagocytic and immune activity), astrocytes (regulation of metabolism
and blood brain barrier, synaptogenesis, neurotransmission), vascular endothelium (vascular tone and blood
flow; coagulation and fibrinolysis; immune response, inflammation and angiogenesis) and pericytes (integrity of
endothelial cells, trans-regulation of vascular tone, stem cells). The retinal layers include: NFL, nerve fiber layer;
GCL, ganglion cell layer; IPL, inner plexiform layer; INL, inner nuclear layer; OPL, outer plexiform layer; ONL,
outer nuclear layer; IS, OS, inner segments and outer segments of photoreceptors. Below the rods and cones are
(from upper to lower) retinal pigment epithelium, Bruch’s membrane, and choriocapillaris, which are shown
for completeness and were not assayed. (C) Bar plots showing proportions of counts of cells in each identified
cell types from the scRNA-seq data across the two retina regions. Note that the counts of cells in each cell type
do not reflect cell type composition in the tissue. (D) Visualization of scRNA-seq clusters from combined
macula and periphery using t-SNE. Cells are colored by cell types. (E) Visualization of scRNA-seq clusters using
t-SNE. Cells are colored by region of origin-macular or periphery. Note clusters are represented by both macula
and peripheral regions. (F) Dot plots showing expression pattern of known gene markers across cell types
(Supplementary data 1).
progress is a result of multiple factors including lack of information about cell types involved in the initiation
of AMD; anatomical and molecular differences between humans and commonly used laboratory animals; and
inadequate supplies of postmortem human eyes to study pathophysiology.
The human retina is composed of multiple layers, and each layer contains distinct cell types (Fig. 1A, B).
There are 5 neuronal cell types in the retina that include photoreceptors, bipolar cells, ganglion cells, horizontal,
and amacrine cells. Cone photoreceptors are sensitive to color and bright light. Rod photoreceptors are sensi-
tive to dim light. Photoreceptors transmit information to bipolar cells, which in turn make synaptic contacts
with ganglion cells. The axons of ganglion cells comprise the optic nerve and transmit information to the brain.
Horizontal cells and amacrine cells modulate signals from photoreceptors and bipolar cells, respectively. A
major glial cell, Müller, spans the retina and is involved in neurotransmission, fluid balance, and wound repair.
Retinal neurons and their support cells form a highly organized, vertically integrated physiologic unit. AMD is
a disease of this unit, with secondary effects including gliosis, cell death, and synaptic circuitry corruption4–6.
There is an urgent need to identify the gene expression and cell type-specific changes that lead to AMD and
accompany disease progression.
Regional differences exist in the retina and it is common to divide the retina into macula and peripheral
regions due to differences in anatomical, cellular, molecular, and f unction7–10. Early publications of the retinal
transcriptome were focused on describing the overall gene expression of the retina11,12 and later reporting the
transcriptome differences between macula and periphery using bulk RNA sequencing (RNA-seq)13. While these
studies described differentially expressed genes between macula and periphery, they lacked details of cell-type-
specific expression. Cell-type-specific expression of the retina will help understand the biology of multiple
diseases affecting the retina, beyond AMD.
Recent technologic breakthroughs in single-cell RNA sequencing (scRNA-seq) have made it possible to
measure gene expression in single cells, resolve cell types, characterize the signature of gene expression across
cells, and improve understanding of cellular function in health and disease. ScRNA-seq has been used to profile
the transcriptome of retina cell types. Macosko et al. (2015) and Shekhar et al. (2016) generated scRNA-seq data
from mouse retina and identified cell types and novel expression s ignatures14,15. Peng et al. (2019) profiled the
cell types and gene expression changes for the macaque fovea (a cone-only sub-region of macula) and periph-
eral retina. There also have been publications on scRNA-seq of human retina which provided a resource for
understanding human retina cell biology and d iseases16–21. However, these studies focus on single-cell/nuclei
data on non-AMD human retina tissues which cannot provide sufficient insights into the impact of AMD on
retina expression pattern and cell-type composition. Further, several publications had long postmortem times
(> 6 h)16 while others had low counts for nuclei or cells (< 25,000)16,17,19,20.
In the paper, we report the generation of a transcriptome atlas from scRNA-seq that contains 92,385 cells
across two human retina regions, macula and periphery. Of particular note is our incorporation of short postmor-
tem time. Long postmortem periods before processing of tissue (e.g. > 6 h) will affect RNA integrity and results
of gene expression22–24. In addition, our study reaches beyond previous single-cell publications by correlating
single-cell RNA expression with bulk tissue RNA expression of both control and AMD retina tissues. It is known
that cell dissociation and capture steps are biased for certain cell types25, making it difficult to obtain accurate
cell-type proportion estimates from scRNA-seq. To address this issue we used a novel deconvolution approach
that integrates bulk RNA-seq and scRNA-seq to conduct cell-type-specific expression and cell-type composition
analysis in intact bulk tissues, thus allowing the identification of cell-type-specific association of gene expression
with AMD26. Our results revealed distinct cell-type-specific gene expression and cell-type composition changes
associated with AMD progression and provided a framework for future studies incorporating bulk RNA-seq and
Scientific Reports | (2021) 11:15612 | https://doi.org/10.1038/s41598-021-95122-3 3
Vol.:(0123456789)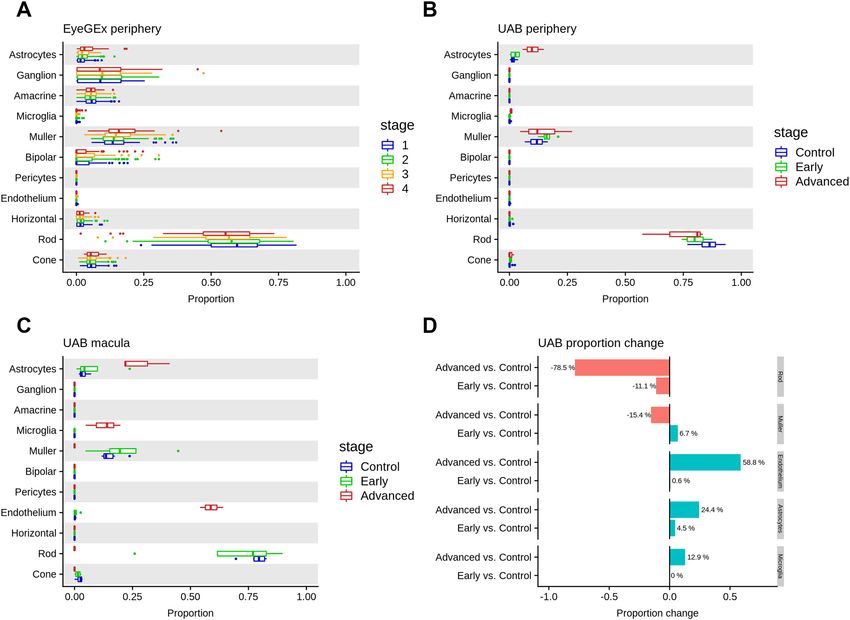
www.nature.com/scientificreports/
Figure 2. Dotplots showing the expression pattern of selected cell type specific markers across reina cell types.
6 top (ranked by percent of expression) specific markers for each retina cell type were selected and presented.
scRNA-seq. In addition, our study identified additional novel cell-type-specific markers adding to the previous
knowledge of specific retinal makers.
Results
Single‑cell RNA‑seq identified transcriptionally distinct clusters among neuronal and non‑neu‑
ronal cells. Posterior eyecups from two Caucasian adult male donors, aged 78 and 90, were obtained from
the Advancing Sight Network, Birmingham, Alabama (formerly the Alabama Eye Bank), within 6 h postmortem.
Relief cuts were used to flatten the posterior eyecup and the macula was visualized under a dissecting micro-
scope, which revealed no visible chorioretinal pathology. A sterile, RNAse-free 8 mm trephine was centered on
the macula to collect the macular samples. After collection of the macular samples, a new sterile, RNAse-free
8 mm trephine was placed in the temporal region so that the inner edge of the second punch contacted the outer
edge of macular punch. Retina was carefully separated from the underlying retinal pigment epithelium and
choroidal vasculature (Fig. 1A, B) and dissociated according to published p rotocols27. Dissociated cells, 36,959
and 55,426 cells from macula and periphery were processed through a 10X Chromium platform (Supplementary
Fig. 1a, b). Unsupervised deep learning-based clustering based on 2,000 highly variable genes identified 18 cell
clusters, which were then assigned to neuronal and non-neuronal cell types by their canonical gene m arkers28.
Two clusters could not be annotated due to a small number of cells (< 50) and were removed from further analy-
sis resulting in 16 cell clusters. Then by collapsing cell clusters based on pairwise differential expression analysis
(Supplementary Fig. 2), we obtained 11 major cell types (Fig. 1C, D, Supplementary Fig. 3). All identified cell
types are found in both retinal regions and donors (Fig. 1E, Supplementary Fig. 1c). To validate the cell type
annotation, we examined expression patterns of well-known retinal expression makers across the annotated cell
types (Supplementary data 1). GFAP was selectively expressed in astrocytes; PRPH, SNCG, and NEFL marked
ganglion cells; NRXN2, SLC32A1, ELAVL3, and GAD1 were highly expressed in amacrine cells; VSX1 and PCP2
were selectively expressed in bipolar cells; ONECUT1, 2 and TMOD1 were selectively expressed in horizontal
cells; NRL, PDE6A, GNAT1, and RHO were highly expressed in rods, and CHRNA3, TTR, GNGT2, GUCA1C,
OPN1LW, and ARR3 were selectively expressed in cones. FCGR1A was selectively expressed in microglia. KCNJ8
was selectively expressed in pericytes; PECAM1 was selectively expressed in endothelium.
To identify cell-type gene markers that are specifically expressed in particular cell types, we performed dif-
ferential expression analysis between each cell type vs. all other cells. In total, we identified 267 genes showing
significant cell-type-specific expression (Methods, Supplementary data 2a). Figure 2 shows selected cell-type-
specific markers for each cell type. Many of these findings were also reported in other scRNA-seq studies in
retina. For example, some of the cell-type-specific expression detected in this study were previously reported
to be enriched in rod (PDE6A, CNGA1), cone (PDE6H, ARR3), microglia (CCL3, C1QA, C1QB), endothelium
(RGCC, CLDN5), amacrine (GAD1), ganglion (NEFM) and bipolar (TRPM1, AANAT, LRTM1)17,19,29. Though
the cell-type-specific marker detection results may partially depend on the clustering algorithm resolution and
sample preprocessing, we found that the top enriched markers for the major cell types are robust and reproduc-
ible across different studies. Considering the possible discrepancy of cell type markers between retina regions,
we also identified cell-type-specific markers for macula and periphery separately, with 243 markers identified
in macula while 282 markers identified in peripheral retina (Supplementary data 2b, c). By comparing the cell-
type-specific markers identified in two retina regions for each cell type, we found that even though some markers
identified in one retina region didn’t pass the cell type specificity criteria in the other region, they are still ranked
high based on p-values from the differential expression analyses.
Scientific Reports | (2021) 11:15612 | https://doi.org/10.1038/s41598-021-95122-3 4
Vol:.(1234567890)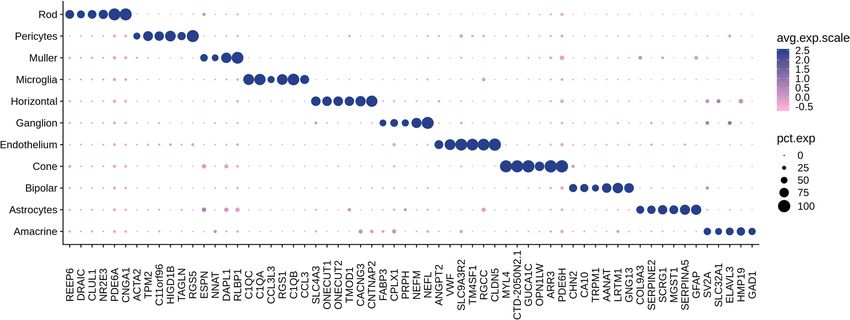
www.nature.com/scientificreports/
Distinct expression pattern between human retina regions. Although the two human retina
regions, macula, and periphery, share the same major cell types, their gene expression patterns exhibit regional
specificity3. To characterize region specificity for each of the 11 major cell types, we performed differential
expression analysis between the two retina regions, and 46 genes were found to be differentially expressed across
all 11 cell types (Methods, Supplementary data 3). We found a relatively large number of differentially expressed
genes (DEGs) in cones (n = 15). The numbers of DEGs detected for the other cell types are smaller: amacrine
(n = 2), astrocytes (n = 6), bipolar (n = 1), endothelium (n = 2), horizontal (n = 1), microglia (n = 7), Müller cells
(n = 9), pericytes (n = 2), and rods (n = 1). The variation in the number of DEGs between the two retina regions
for different cell types is possibly due to the different levels of region-specificity in expression patterns across
cell types. However, such variation may also be due to the different levels of cellular heterogeneity within each
cell type.
Cone and rod cells are two types of photoreceptors in human retina that are responsible for vision at high
and low light levels, respectively. The macula is a specialized area for vision with high spatial acuity. Further
photoreceptors in the macula have long Henle fibers (axons). Thus, differences in expression patterns between
macula and periphery are expected. For cone cells, we found PCP4, RP11, and VTN were highly expressed in
the macular region, whereas TTR, CLTB, and HSPB1 were preferentially expressed in the peripheral region.
For rod cells, only HSPA1A was detected as a DEG between macula and periphery according to our criteria.
Noticeably, HSPA1A also has consistently higher expression (fold change > 2) in macular region for four other
neural cell types including amacrine, bipolar, and horizontal cells. For bipolar cells, we detected very few DEGs
between macula and periphery, which is likely due to the transcriptional heterogeneity among the bipolar cells,
as characterized by previous s tudies3,14.
Single‑cell RNA‑seq identified transcriptionally distinct clusters among cone and bipolar cell
neurons. Rod-mediated vision is affected early in AMD and cone-mediated vision can be preserved until late
in the disease30–32. To further characterize these resilient cone cells and their connecting interneurons, we reclus-
tered cones from the initial clustering. From this, we identified 4 distinct clusters for the cones based on long
(L), medium (M), and short (S) wavelengths expression of OPN1LW, OPN1MW, and OPN1SW. One of the cone
clusters has low expression across all known cone subtype markers, and it mainly expressed ribosomal protein,
a sign of low-quality cells. Therefore, this cluster was removed from the following analysis as we were unable to
assign it to any known cone subtypes. Due to small differences in 2 clusters, we combined long wavelength and
medium wavelength cones and analyzed 2 major cone subgroups that contained S-cones and L/M-cones (Sup-
plementary Fig. 4). Both cone subclusters showed differences in regional specificity: 34 DEGs were identified
between macula and periphery for L/M-cones while 21 DEGs were detected for S-cones (Supplementary data
4a). Since recent studies have revealed multiple bipolar subtypes3, we also performed reclustering analysis on the
bipolar cells. This analysis identified 14 distinct clusters that included rod bipolar cells (RBC), on-cone bipolar
cells (OCBC), and off-cone bipolar cells (OFBC) based on their known bipolar markers (e.g., PRKCA, LSL1,
and GRM6) (Supplementary Fig. 5a). Differential expression analysis of these 14 clusters identified 292 cluster-
specific markers as well as DEGs between each pair of the subgroups (Supplementary data 4b, c). Expression pat-
terns of the 14 bipolar subtypes in macula and periphery showed large differences between OFBC and RBC cells
(Supplementary Fig. 5b-d). Reclustering of rods and Müller cells was not successful because we couldn’t find
subpopulations that are biologically interpretable. As we increased the clustering resolution parameter, the rods
and Müller cells started to separate by batch. As such, we didn’t pursue reclustering analysis further for these two
cell types. Due to the small cell numbers, we didn’t perform reclustering analysis on astrocytes, microglia, and
retinal ganglion cells.
Cell‑type level expression of AMD risk genes. Next, we assessed the cell-type level expression of AMD
risk genes identified from G WAS33 and transcriptome-wide association study (TWAS)34 (Fig. 3A, Supplemen-
tary Fig. 6). Of the 66 AMD risk genes, 23 were found to be among the 267 cell-type-specific genes. For example,
CFH passed our stringent cell type specificity criterion (Methods) and it is specifically expressed in endothelium
cells (Fig. 3B). The Y402H variant and other noncoding variants in CFH have been reported to be strongly
associated with AMD, and the CFH protein acts as an inhibitor of the other complement cascade and has been
localized in macular drusen by some groups but not o thers35,36. The relatively high expression level of CFH in
endothelium suggests a role of endothelium cells in AMD. CFH is also specifically expressed in an on-cone
bipolar subtype compared to other bipolar subtypes (Supplementary Fig. 5c). More than 80% of 431 cells (160
from macula and 271 from periphery) in this bipolar population expressed CFH gene. This bipolar subtype is
featured by enriched expression of CFH, SPOK3, NELL2, and TTYH1. This CFH enriched-bipolar subtype needs
to be further validated and investigated. Next, we examined cell type enrichment of two other AMD genes, C3
and CFI. C3 was preferentially expressed in microglia and astrocytes while CFI was expressed in astrocytes,
endothelium, and muller cells (Fig. 3B). C3 is a central complement component and a key inflammatory protein
activated in A MD37. Its expression level is negatively regulated by CFH 38. However, such regulation is com-
promised in neurodegenerative diseases including AMD. Further, we found that the AMD risk gene VTN is
differentially expressed between macular and peripheral cone cells (adjusted P < 0.05), indicating the potential
regional difference of AMD impact.
Differential expression analysis of bulk RNA‑seq revealed differences in expression between
early and advanced AMD. To investigate the impact of AMD on gene expression in human retina, we
sequenced total RNA from macula and peripheral regions of 15 postmortem retinas that included control,
early, and advanced AMD stages (Supplementary Fig. 7). The bulk RNA-data were generated from 13 macula
Scientific Reports | (2021) 11:15612 | https://doi.org/10.1038/s41598-021-95122-3 5
Vol.:(0123456789)www.nature.com/scientificreports/
Figure 3. Cell type- and region-specificity of AMD risk genes. (A) Heatmap showing expression levels of
AMD risk genes by cell type. Color in the heatmap represents expression intensity with red signifying higher
expression in units of z-score. Left panel: AMD associated genes identified by loss- or gain-of-function
mutations or by GWAS3. Right panel: target genes based on TWAS analysis listed34.Three AMD risk genes in
the complement pathway, CFH, C3 and CFI, were highlighted. (B) boxplot shows expression level of CFH, C3
and CFI across cell types and retina regions. The pie chart show the percentage of cells expressing the gene in a
particular region and cell type.
samples (6 control, 4 early AMD, and 3 advanced AMD) and 15 periphery samples (8 control, 4 early AMD,
and 3 advanced AMD) taken from the retina of the 15 adult donors. All donor eyes were collected within 6 h
postmortem and characterized for presence of AMD and other pathology by author C.A.C. and a consulting
medical retina specialist (J.A.K.) using ex vivo fundus imaging (color and optical coherence tomography, OCT).
There is currently no consensus definition of AMD for clinical OCT imaging but AMD features are visible
in post-mortem donor eyes39. By OCT, early AMD eyes are those with either drusen > 125 µm or roughening
(or worse) of the RPE-basal lamina-Bruch’s membrane band, in the setting of drusen or subretinal drusenoid
deposits. Control eyes lacked these features. Advanced AMD eyes had loss of outer retinal layers (OCT) and
loss of pigmentation (color) in atrophy and in neovascular AMD, also exhibited subretinal fibrovascular scars.
We identified 9,772 and 1,214 DEGs in macula and periphery, respectively, for advanced AMD vs. control com-
parison (Supplementary data 5a). A smaller number of DEGs between early AMD and control was found, with
169 DEGs in periphery and 21 DEGs in macula. We expected to see more DEGs in the macula than periphery
and suspect that the larger sample size and higher sequencing depth of peripheral retina samples increased the
power. Interestingly, we also found 17 DEGs for macula that may associate with AMD progression, as indicated
by their increased fold change from early AMD to advanced AMD when compared to control.
To evaluate the implications of differential gene expression in the context of annotated genes and known
biological pathways, we focused on genes with patterns of significant up- and down-regulation with respect to
AMD disease stages. For both macula and peripheral retina, the significant DEGs for the early AMD vs. control
comparisons were relatively few in number and did not identify significantly enriched KEGG pathways when
submitted to the STRING database. For the advanced AMD vs. control comparison for macula, there were far too
many genes to submit as a single query. Therefore, we constructed separate acceptable queries for up- and down-
regulated genes by requiring a difference of fivefold or greater expression between control and advanced AMD,
and also requiring that all genes in the queries have a minimum STRING connection weight of 0.5 or greater to
at least one other gene in the query set (Methods). This protocol generated query lists of 1,905 up-regulated and
1,538 down-regulated genes for advanced AMD vs. control in macula (Supplementary data 5b). To offset the
fewer number of DEGs in peripheral retina the fold-change criterion was reduced to twofold or greater with the
previous requirement for minimum STRING connection weight still applied. We identified 449 up-regulated and
84 down-regulated genes for advanced AMD vs. control for peripheral retina (Supplementary data 5b). Coding
genes from the lists were in turn used as queries against the KEGG database to select known biological pathways
with significant overlap. KEGG pathways significantly enriched for our queries (adjusted P < 0.05) are listed in
Scientific Reports | (2021) 11:15612 | https://doi.org/10.1038/s41598-021-95122-3 6
Vol:.(1234567890)www.nature.com/scientificreports/
Figure 4. Cell-type deconvolution analysis from bulk RNA-seq data. Cell-type proportions for each bulk
RNA-seq sample were estimated using MuSiC with the scRNA-seq data as reference. (A) Estimated cell-type
proportions for the EyeGEx peripheral retina bulk RNA-samples with four stages of AMD (MGS1: 105; MGS2:
175; MGS3: 112; MGS4: 61). (B) Estimated cell-type proportions for the UAB peripheral retina bulk RNA-seq
samples (control: 8; early AMD: 4; geographic atrophy, a advanced stage of AMD: 3). (C) Estimated cell-type
proportions for the UAB macular retina bulk RNA-seq samples (control: 6; early AMD: 4; advanced AMD: 3).
Note the similarity in (a) and (b) with respect to cell proportion increase in astrocytes and decrease in rods
in peripheral retina as AMD progresses. Larger differences are noted in both cell types in macula along with
additional increases in Müller glia, microglia and vascular endothelium as AMD progresses. (D) Cell-type
proportion changes in the UAB macula retina samples for highlighted cell types.
Supplementary data 6; genes up-regulated revealed pathways for complement and coagulation cascade, antigen
presentation, and tissue remodeling when comparing advanced AMD vs. control for both macula and peripheral
samples. Numerous signaling pathways are also up-regulated (PI3K-Akt, NOD-like, Toll-like, Rap1), in macula
the TGF-beta pathway has been specifically suggested as a mechanism in AMD p rogression40. Genes down-
regulated in the macula are enriched for pathways specific for neurons (Glutamatergic, GABAergic, Serotonergic,
Cholinergic and Dopaminergic synapses, synaptic vesicle cycle, circadian entrainment) and phototransduction
which is consistent with the significant loss of photoreceptors and other neuronal cell types in advanced AMD.
For peripheral retina, our list of down-regulated genes did not identify any significantly-enriched pathways.
The impact of AMD on retina cell‑type composition. Previous studies have shown that AMD has an
impact on cell-type composition of the retina, particularly in macula41,42. Deconvolution is an analytical tech-
nique that can assess cell-type composition changes in bulk RNA-seq data using scRNA-seq as a reference26. We
used deconvolution to analyze a large bulk RNA-seq dataset from the EyeGEx s tudy34, which includes 453 RNA-
seq samples from human peripheral retina. This study phenotyped eye samples using the Minnesota Grading
System (MGS) (MGS1: 105; MGS2: 175; MGS3: 112; MGS4: 61) for AMD pathology in macula. Interestingly,
we detected a significant cell-type proportion difference in astrocytes (adjusted P = 0.0043) between MGS1 (con-
trol) and MGS4 (more advanced stage) of AMD (Fig. 4A, Methods, Supplementary data 7). The increase in the
proportion of astrocytes may reflect an immune response of the peripheral retina with AMD progression43. We
also observed a tendency of increased median cell-type proportion for astrocytes and rods, as well as decreased
median cell-type proportion for muller cells over disease progression.
Scientific Reports | (2021) 11:15612 | https://doi.org/10.1038/s41598-021-95122-3 7
Vol.:(0123456789)www.nature.com/scientificreports/
Figure 5. Cell type-specific differential expression analysis in two datasets. (A) Proportions (y-axis) of up- and
down-regulated ctDEGs detected in the EyeGEx peripheral retina data. Colors show different test conditions:
red for MGS2 vs. MGS1, and green for MGS4 vs. MGS1. Numbers above each bar indicate the number of
detected ctDEGs for each comparison. (B) Volcano plots and effect size comparison of microglia-specific DEGs
detected in the EyeGEx peripheral retina data. Significant ctDEGs were colored in red and annotated with gene
names. (C) Proportions (y-axis) of up- and down-regulated ctDEGs for control vs. advanced AMD comparison
in the UAB bulk RNA-seq data. Colors show different retina regions: blue for periphery, and yellow for macula.
Numbers above each bar indicate the number of detected ctDEGs for each comparison. (D) Volcano plots and
effect size comparison of rod-specific DEGs identified for control vs. advanced AMD comparison in the UAB
bulk RNA-seq data. Significant ctDEGs were colored in red and annotated with gene names. (E) Comparison
of p-values for cell type level and bulk level differential expression analysis for control vs. advanced AMD
comparison in the UAB bulk RNA-seq data in macula rod cells.
Next, we tested our initial findings in another dataset, the UAB samples, which contain separate bulk RNA-seq
for macula and peripheral retina from control and AMD donors. We performed cell-type deconvolution analysis
in the peripheral retinas from our UAB sample and replicated the decrease in rods and increase in astrocytes
with AMD progression, consistent with the EyeGEx data (Fig. 4B). The macular retina was also analyzed from
these samples. The rods showed a slight decrease from control to early AMD and a more dramatic decrease
from early to advanced AMD (Fig. 4C). Rods are barely detectable in the macula of advanced AMD (Control vs.
Advanced adjusted P = 2.63E-6) (Fig. 4D and Supplementary Fig. 8, Supplementary data 7), which agrees with
published histological e vidence41,44. We also observed the tendency that endothelium, astrocytes, and microglia
proportions increased in the macula with progression from control to advanced AMD.
Cell‑type‑specific differential expression revealed genes associated with AMD. Bulk RNA-seq
measures the average expression of genes (sum of cell-type-specific gene expression weighted by cell-type pro-
portions), therefore, bulk RNA-seq DEGs can be due to changes in cell-type-specific gene expression and/or
cell-type composition. To determine if differential expression in the bulk RNA-seq samples was due to cell-
type-specific differential expression and not cell-type composition, we developed a calibration-based method
to detect cell-type-specific DEGs (ctDEGs) from bulk level gene expression for those cell-type-specific marker
genes found in our scRNA-seq data (Methods). Applying this method to the EyeGEx peripheral retina data,
we detected ctDEGs for each of the 11 major cell types. Comparing ctDEGs for different AMD stages MGS1,
MGS2, and MGS4, we identified 5 ctDEGs for MGS2 vs. MGS1, and 44 ctDEGs for MGS4 vs. MGS1 (Supple-
mentary Data 8). Microglia had a relatively large number of DEGs with 2 and 11 genes identified for the MGS2
vs. MGS1 and MGS4 vs. MGS1 comparisons, respectively (Fig. 5A). Notably, a microglia-specific DEGs, FCGBP,
was detected in both MGS2 vs. MGS1 and MGS4 vs. MGS1 comparisons (Fig. 5B). This increased expression of
FCGBP may suggest a microglia-specific AMD response with disease p rogression45.
Next, we applied the same analysis to the UAB bulk RNA-seq dataset and identified 5 ctDEGs in macula and
1 in periphery for control vs. early AMD (Supplementary Data 9). A larger number of ctDEGs were identified
after comparing control and advanced AMD, with 13 ctDEGs found in periphery and 236 ctDEGs in macula
(Fig. 5C). We compared the ctDEGs between the two retinal regions and found a considerable number of genes
unique to each region (Fig. 5C). For example, we found expression of RHO, RP1, and PDE6A down-regulated
Scientific Reports | (2021) 11:15612 | https://doi.org/10.1038/s41598-021-95122-3 8
Vol:.(1234567890)www.nature.com/scientificreports/
in rod photoreceptors in AMD macula but not in periphery (Fig. 5D). RHO encodes a protein that is essential
for vision in low-light conditions, RP1 encodes protein that affects photosensitivity and outer segment mor-
phogenesis of rod photoreceptors, while PDE6A involves visual signal transmission and amplification46. The
down-regulated expression of these rod-specific genes reflects the compromised function of rod photoreceptors
specific to macula of AMD eyes. These findings are consistent with the overall degeneration, dysfunction, and
loss of rods. The few rods that were found are likely expressing fewer genes because they were degenerating, as
expected. When comparing p-values of the ctDEGs with those obtained from bulk RNA-seq differential expres-
sion analysis (Fig. 5E), we found an attenuation of the p-value significance in ctDEGs because the bulk level
analysis captures both gene expression and cell-type composition changes. This underscores the importance of
delineating gene expression and cell type composition changes separately as is done in our analyses.
Discussion
Advances in scRNA-seq technologies have revolutionized our understanding of cellular function in health and
disease. Using scRNA-seq in human donor eyes, we constructed a high-resolution human retina cell atlas with a
particular focus on the comparison of regional differences between macula and peripheral neurosensory retina.
Our comprehensive analysis revealed 11 major cell types that are present in both retinal regions, a unique set of
retinal cell type marker genes, and identification of the cell type modifications occurring in AMD. Further cluster-
ing analysis also identified subtypes for bipolar and cone cells and comparison between macula and peripheral
gene expression revealed distinct gene expression patterns between regions. In total, we identified 267 genes that
are cell-type-specific, expanding the previous datasets describing cell type-specific gene expression. Interestingly,
vascular endothelium (93 genes) and microglia (42 genes) had over half of the 267 specific genes that were not
expressed in any other cell types, suggesting that microglia have an important role in supporting the retina that
cannot be compensated for by other cell types. The novel cell-type-specific marker genes identified in this study
need to be validated using techniques such as immunohistochemistry or in situ hybridization. We will conduct
such experiments in a separate study.
Our analysis of the impact of AMD on cell-type composition is particularly notable and speaks to the power
of using single-cell data to decipher cell compositional changes in bulk RNA-seq data. Using the technique of
deconvolution to integrate bulk RNA-seq data from donor retinas with and without AMD and scRNA-seq from
normal retinas, we were able to infer cell-type proportions in the bulk RNA-seq samples which has not been
attempted to date. It is notable that we observed cell-type compositional changes in select neurons and support-
ing cells, i.e. rods, Müller cells, vascular endothelium, astrocytes, and microglia (Fig. 4). Astrocytes, microglia,
and vascular endothelium showed large proportional increases in the macula with advancing AMD and smaller
increases in the periphery. The location of these dramatic increases is expected since AMD is known to adversely
affect the macula more than the periphery. Rods, an early-affected cell type in AMD demonstrated a large pro-
portional decrease in the macula and much smaller decrease in periphery from early AMD to the advanced GA
stage30. Astrocytes, located mainly in the nerve-fiber and ganglion cell layers, defend the retina from damage
through the reactive gliosis pathway which can be triggered by neuroinflammation and neurodegeneration. The
hallmark of reactive astrogliosis is an increase and hypertrophy of a strocytes47. Retinas manifesting AMD have
been reported to manifest reactive astrogliosis and our data support this result by demonstrating an increase in
astrocyte activity in both early and advanced AMD retinas43 (Fig. 4B-D). Remarkably, this increase was present
in both macula and peripheral locations, although greater in the macula region.
Müller glial cells span the width of the retina and perform a trophic function by supplying retinal neurons and
photoreceptors with nutrients. Practically all retinal diseases are associated with an increase in activity of Muller
cells47,48. Müller cell gliosis can be a double-edged sword, cytoprotective on retinal neurons in the early disease
stage and cytotoxic in the later stage. Li et al. have exquisitely defined through histology the various activities of
Müller cells in advanced GA stage including their enveloping cones into outer retinal tubulation and surviving
the loss of photoreceptors in the outer nuclear l ayer6. Our results identified an increase of activity in Müller glia
in the early AMD stage that could reflect their protective activities including clearing of drusen and release of
neurotrophic factors and antioxidants49. In the advanced AMD stage, we found a decrease in Müller glia activity,
possibly due to the massive gliosis50. Microglia are inactive under physiological conditions but become activated
and acquire the ability to phagocytose and become neurotoxic leading to degeneration of photoreceptors during
various retinal diseases, i.e. AMD51. In Fig. 4 it is apparent that microglia are quiescent during early AMD in the
macula and periphery but manifest a significant increase in the macula of retinas affected with GA, as supported
by recent h istology52. This microglial increase in advanced AMD could be explained by a commensurate decline
in the Müller glia population during this AMD stage. Müller glia expresses diazepam-binding inhibitor which
regulates activation of microglia by limiting the magnitude of inflammatory response53. Therefore, the increased
microglial response could be due to the loss of regulation secondary to the decline in Müller glia. Of course, this
hypothesis would require further experiments for confirmation. Based on our results therapies for early AMD
might be more successful if directed at protecting rods and Müller glia and inhibiting astrocyte activation. Such
a conclusion was reached by Menon et al. using a different approach but similar c onclusion19. They analyzed their
scRNA-seq data for the ability of cell-type gene signatures to predict AMD genetic risk and found that Müller
glia, astrocytes, microglia, and vascular endothelium were the most predictive of AMD risk. These authors also
found that expression by cones was predictive.
Finally, we examined the cell type and region specificity of AMD risk genes reported in previous GWAS and
TWAS studies3,34. Analysis of expression in our scRNA-seq data for 66 AMD risk genes identified 23 (35%) genes
as cell-type-specific and 41 (62%) possessed differential expression between macula and periphery suggesting
that gene expression differences between macula and peripheral retina may have functional relevance for the
anatomical location in AMD. Unfortunately, we were not able to directly identify AMD associated genes at the
Scientific Reports | (2021) 11:15612 | https://doi.org/10.1038/s41598-021-95122-3 9
Vol.:(0123456789)www.nature.com/scientificreports/
cell type level due to the lack of scRNA-seq data from AMD eyes. Instead, we applied our deconvolution method
to detect ctDEGs between control and AMD through the integration of bulk and scRNA-seq data. This procedure
uncovered AMD associated DEGs at the cell type level across AMD stages and retina regions, which might have
been masked at the bulk level. We observed that the AMD impact on cell-type-specific transcription landscapes
varied between retina regions and increased along with disease progression.
In summary, we have constructed a high-resolution human retina cell atlas with a particular focus on the
comparison of regional differences in the human retina. Our results linked GWAS genes for AMD with cell-
type-specific gene expression and enabled the use of GWAS data to inform the genetic architecture of AMD.
We further leveraged scRNA-seq and bulk RNA-seq data using an integrative analysis approach to reveal both
cell-type composition as well as cell-type-specific gene expression changes associated with AMD progression.
We also introduced novel methods for integrating scRNA-seq data with bulk RNA-seq data to elucidate the
molecular mechanisms of disease in whole tissue. Our ongoing studies will aim to increase AMD sample size
and add scRNA-seq data from the retinal pigment epithelium and choroid from both control and AMD eyes.
This comprehensive approach will provide novel insights into cell-type-specific functions that will power preci-
sion therapeutics targeting AMD.
Materials and methods
Study subjects, scRNA‑seq, and bulk RNA‑seq for the UAB data. The scRNA-seq data were gener-
ated from macular and peripheral retina taken from two adult donors eyes lacking grossly visible chorioretinal
pathology using the 10X Genomics Chromium™ system. The bulk RNA-data were generated from 13 macula
samples (6 control, 4 early AMD, and 3 advanced AMD) and 15 periphery samples (8 control, 4 early AMD,
and 3 advanced AMD) taken from the retina of 15 adult donors. All donor eyes were collected within 6 h post-
mortem and characterized for presence of AMD and other pathology in the ocular fundus by author C.A.C. and
a consulting medical retina specialist (J.A.K.). All protocols were carried out following relevant guidelines and
regulations as required by the UAB Institutional Review Board. Tissue collection protocols were approved by
the institutional review board at the University of Alabama at Birmingham, complied with the Health Insurance
Portability and Accountability Act of 1996, and adhered to the tenets of the Declaration of Helsinki. Informed
consent was obtained by the Alabama Sight Network (ASN) from a legally authorized representative (LAR).
Detailed sample preprocessing, donor characteristics, scRNA-seq and bulk RNA-seq data generation and pre-
processing can be found in Supplementary Note.
scRNA‑seq data clustering and cell type identification. To identify cell types in the scRNA-seq data,
we clustered cells into distinct cell types using DESC, a deep learning based clustering algorithm that is robust to
batch effect28. To prepare the data for DESC clustering, the original gene count matrix obtained from CellRanger
was normalized in which the UMI count for each gene in each cell was divided by the total number of UMIs in
the cell. The normalized UMI count data were then multiplied by 10,000 and transformed to a natural log scale.
We further standardize the log-transformed expression value for each gene by calculating a Z-score across cells
within each batch. Lastly, 2,000 highly variable genes selected using filter_genes_dispersion function from the
Scanpy package54 were used as input for DESC clustering. In DESC analysis, we used a 2-layer autoencoder with
64 nodes for the first layer and 32 nodes for the second layer. The DESC clustering was performed using a grid
of resolutions, and resolution = 0.4 was selected because it yields high maximum cluster assignment probability
for most of the cells. DESC initially identified 18 cell clusters and 16 of them that contain more than 50 cells were
kept for downstream analyses. We annotated these 16 cell clusters with cell type labels by examining expression
patterns of known retina cell type markers (Supplementary data 1). We further performed pairwise differential
expression analysis among cell clusters, and confirmed that cell clusters with the same cell type annotation had
few differentially expressed genes (Supplementary Fig. 2). This procedure resulted in 11 major neuronal cell
types, including cone photoreceptors, rod photoreceptors, bipolar cells, horizontal cells, amacrine cells, and gan-
glion cells; support cells (microglia, Müller glia, and astrocytes), and vascular cells (endothelium and pericytes).
We are aware of that some of the cell types we identified, such as cone, rod, and ganglion cell, are commonly
called cell c lasses55, since each of them includes multiple (sub) types of cells with different expression patterns.
However, to simplify the analysis of neural and non-neural cells, we use cell type to signify both cell types and
cell classes in our data.
t‑SNE visualization for scRNA‑seq clustering. To visualize cell type clusters from the scRNA-seq
data, we generated a two-dimensional non-linear embedding of the cells using t-distributed Stochastic Neigh-
bor Embedding (t-SNE)56. The low denominational representation of the original data from DESC was used as
input. The algorithm was implemented using the mTSNE function from python package M ulticoreTSNE57. We
set perplexity = 50 and learning rate = 500 and used the default values for all other parameters.
Identification of cell‑type‑specific marker genes. To determine if a gene is preferentially expressed in
a given cell type, we performed differential expression analysis to test whether a gene has a significantly higher
expression in the given cell type than all other cell types. The analysis was implemented using the FindMarkers
function in Seurat R package. We used the Wilcoxon test for the differential expression analysis by specifying
test.use = "wilcox" and all other parameters were set as default. The P values were adjusted using Benjamini-
Hochberg (BH) procedure and the significant (adjusted P value < 0.05, fold change > 2) DEGs from the test will
be considered as candidates. Then, the genes which are widely expressed in the target cell type (percent of cell
expressed the gene > 50%), but not in any of other cell types (percent of cell expressed the gene < 30%), were
defined as cell-type-specific genes. We performed the cell type-specific markers identification by combining data
Scientific Reports | (2021) 11:15612 | https://doi.org/10.1038/s41598-021-95122-3 10
Vol:.(1234567890)www.nature.com/scientificreports/
from two retina regions, as well as using macula and periphery data separately. Identified cell-type-specific genes
can be found in Supplementary data 2.
Cell‑type level differential expression between retina regions. To determine if a gene is preferen-
tially expressed in a given retina region, for each cell type, we performed differential expression analysis to test
whether a gene is differentially expressed between macula and peripheral region. The analysis was implemented
using the FindMarkers function in Seurat R package. We used the Wilcoxon test for the differential expression
analysis by specifying test.use = "wilcox" and all other parameters were set as default. The P values were adjusted
using Benjamini-Hochberg (BH) procedure and the genes with adjusted P value < 0.05 and fold change > 2 were
considered cell type level DEGs between retina regions. Identified cell type level DEGs can be found in Sup-
plementary data 3.
Cell‑type level expression of AMD risk genes. We obtained AMD risk genes from previous studies,
which include 51 AMD associated GWAS genes from Peng et al. 2019 3 and 24 target genes identified from
TWAS analysis by Ratnapriya et al.34. Genes that meet the following criteria were included for downstream
analysis: 1) expressed in at least 1% of the cells; 2) expressed in at least 15 cells for at least one cell type in the
scRNA-seq data. In total, 46 AMD associated genes and 20 TWAS target genes met these criteria. We searched
these 66 AMD risk gene in identified cell-type-specific markers (Supplementary data 2) and found CFH is spe-
cifically expressed in endothelium cells.
To visualize the cell-type level expression of AMD risk genes, for each of them, we calculated the mean
expression across cells for each of the 11 major cell types for macular and peripheral retina separately. To make
cell-type-wise mean expressions comparable across genes, we calculated z-score of cell type mean expressions
for each gene, and visualized the z-scores using heatmap (Fig. 3A).
DEG detection in UAB bulk RNA‑seq data. For the UAB data, we detected DEGs for macula and
periphery separately. Genes that were expressed in less than 20% of the samples were eliminated, resulting in
19,313 genes in downstream analyses. The filtered read count matrices (19,313 genes by 13 samples for macula;
19,313 genes by 15 samples for periphery) were used as input. Then, the differential expression analysis was
performed using DEseq2 (v1.22.2)58. For each retina region, we detected DEGs between control vs. early and
control vs. advanced AMD. All parameters for DESeq2 were set as default. We used BH adjusted p-value < 0.05
as significance threshold. The significant DEGs are reported in Supplementary data 5a.
Pathway analysis for DEGs detected in bulk RNA‑seq data. The list of genes with significant dif-
ferential expression between late AMD and control in macula retina was filtered to retain only genes with mini-
mum fivefold change (either up- or down-regulated, late AMD / control). For peripheral retina, a lower thresh-
old of twofold was applied. We further filtered the gene lists for macula and peripheral retina by removing
‘outlier’ genes with a STRING database interaction score of less than 0.5, using custom Python code, along with
the file of score data downloaded from the database (https://stringdb-static.org/download/protein.links.detai
led.v11.0.txt.gz). (‘Outlier’ genes, which include all non-coding genes, have limited or no representation in the
aggregate STRING data, and do not meaningfully contribute to identifying annotated biological pathways.) The
final sets of up- and down-regulated genes for macula and peripheral retina (Supplementary data 5b) were sup-
plied as queries to the STRING database using its public web interface (https://string-db.org/), and the KEGG
pathways with significant enrichment for the queries (adjusted P < 0.05) were downloaded from the website
(Supplementary data 6).
Cell‑type deconvolution in bulk RNA‑seq data. We performed cell type deconvolution analysis for
both the EyeGEx and UAB bulk RNA-seq data using the UAB scRNA-seq data as the reference. For the scRNA-
seq data, we only kept genes that were expressed in at least 5% of cells and more than 10 cells in at least one cell
type. Cell type deconvolution analysis was conducted using MuSi 26 by setting eps = 0.0001, iter.max = 1,000 and
default values for all other parameters. Also, we selected highly expressed genes in each cell type, totaling 1208
genes, as reference genes in the deconvolution.
To test the statistical significance of cell-type proportion changes estimated using EyeGEx data. We performed
two-sample t-test between cell-type proportions estimated under MGS1 and MGS2, 3 and 4. The P values were
then adjusted using BH procedure. The detailed result can be found in Supplementary Data 7. Similar tests were
conducted in the UAB bulk RNA-seq data.
DEG detection in EyeGEx bulk RNA‑seq data. The Eye Genotype Expression (EyeGEx) study was
designed to explore genetic landscape and post-GWAS interpretation of multifactorial ocular traits34. This study
generated bulk RNA-seq data of 523 peripheral retinal samples from postmortem human donors. We obtained
the EyeGEx bulk RNA-seq data from the Gene Expression Omnibus (accession number GSE115828). This data-
set includes gene expression measures for 523 samples and 58,051 genes. 453 of the samples with AMD phe-
notype information (MGS1: 105; MGS2: 175; MGS3: 112; MGS4: 61) were included in the analysis59. Genes
that were expressed in less than 20% of the samples were eliminated, resulting in 14,709 genes in downstream
analyses. Then, the filtered RSEM count matrix (14,709 genes by 453 samples) was used as input. Differential
expression analysis was performed between control vs. AMD samples defined by three different MGS levels
using DEseq2 (v1.22.2)58. Also, to remove the potential batch effect and confounding factors, the following
covariates were included in the analysis: sex, rna_isolation_batch, library_ preparation_batch, library_preparer,
Scientific Reports | (2021) 11:15612 | https://doi.org/10.1038/s41598-021-95122-3 11
Vol.:(0123456789)www.nature.com/scientificreports/
death_category, cholesterol, heart_disease, hypertension, rin and postmortem_interval_hrs. All parameters for
DESeq2 were set as default. We used BH adjusted P value < 0.05 as the significance threshold. The DEG detection
result from the EyeGEx data was then used in the cell type-specific DEG detection.
Detection of cell type‑specific DEGs in bulk RNA‑seq using calibrated gene expression. Our
analysis shows that AMD may have specific impact on particular cell types. We are interested in detecting genes
that are differentially expressed between AMD and control eyes for different cell types separately. However, the
bulk RNA-seq data with both AMD and control eyes lack cell type level information. To bypass such limitations,
we developed a procedure to detect cell type-specific DEGs using bulk RNA-seq data calibrated by cell type
proportion change between AMD and control eyes.
From bulk RNA-seq data, the fold change of gene expression between AMD and control eyes for gene g is
i∈S Yig /n2
FCg = 2 , (1)
i∈S1 Yig /n1
where Yig is the expression level of gene g in subject i, Sk is the set that includes all individuals in condition k (1 for
control, and 2 for AMD), and nk is the corresponding number of individuals in the set. Let Xijg be the expression
level of gene g in subject i for cell type j, and pij be the proportion of cells from cell type j for subject i. The bulk
RNA-seq expression can be written as weighted sum of cell-type-specific gene expression
C
Yig = pij Xijg . (2)
j=1
When gene g is cell type j specific, it is reasonable to assume that Yig ≈ pij Xijg because the expression level of
gene g in cell types other than j is low. This implies that
i∈S pij Xijg /n2
FCg ≈ 2 . (3)
i∈S1 pij Xijg /n1
To further simplify the computation, we assume cell type composition across subjects in the same condition
are similar such that pij = pjk for i ∈ Sk . Then by (3), we have
pj2 i∈S2 Xijg /n2
FCg ≈ 1 = PCj · FCjg , (4)
pj i∈S1 Xijg /n1
pj2 pj2
Xijg /n2
where PCj = pj1
is the proportion change of cell type j between AMD and control eyes, and FCjg = pj1
i∈S2
Xijg /n1
i∈S1
is the fold change of gene g in cell type j. Taking log transformation on each side of (4), we have
(5)
log FCg ≈ log PCj + log FCjg .
Let Gj be the set of genes that are cell type j specific, then
g∈Gj log FCg g∈Gj log FCjg
(6)
log PCj ≈ − ,
mj mj
where mj is the number of genes in Gj.
If we assume that only few genes in Gj are differentially expressed, then their average fold change in log scale
is approximately zero, which implies that
g∈Gj log FCg
PCj ≈ exp . (7)
mj
Thus, PCj can be estimated by the mean fold change of genes in Gj in log scale from the bulk RNA-seq data
directly.
Although we can also estimate PCj by cell type deconvolution results obtained from MuSiC, we have found
the proportion change estimated this way is prone to outliers, which may result in large number of false posi-
tives in the detected ctDEGs. The estimated PCj based on (7) is more robust in detecting ctDEGs by avoiding
computational complexity introduced in deconvolution analysis.
Based
′
on (3), we can calibrate gene expression contributed by cell type proportion change in AMD subjects
by Yig = PCj × Yig . This calibrated expression can be directly compared with gene expression in the control
subjects to determine if gene g is differentially expressed in cell type j. With the calibrated gene expression in
AMD subjects, we can perform differential expression analysis using D Eseq258 for genes preferentially expressed
in a given cell types. To determine if a gene is preferentially expressed in a given cell type, we performed dif-
ferential expression analysis to test whether a gene has a significantly higher expression in the given cell type
than all other cell types. The analysis was implemented using the FindMarkers function in Seurat R package.
We used the Wilcoxon test for the differential expression analysis by specifying test.use = "wilcox" and all other
parameters were set as default. The significant (adjusted P value < 0.05, fold change > 2) genes from the Wilcoxon
Scientific Reports | (2021) 11:15612 | https://doi.org/10.1038/s41598-021-95122-3 12
Vol:.(1234567890)You can also read