Lab on a Chip - RSC Publishing
←
→
Page content transcription
If your browser does not render page correctly, please read the page content below

Volume 22
                                                                                      Number 2
                                                                                      21 January 2022
                                                                                      Pages 203–414

Lab on a Chip
Devices and applications at the micro- and nanoscale
rsc.li/loc

                                ISSN 1473-0197

                                PAPER
                                Johannes Dornhof and Andreas Weltin et al.
                                Microfluidic organ-on-chip system for multi-analyte
                                monitoring of metabolites in 3D cell cultures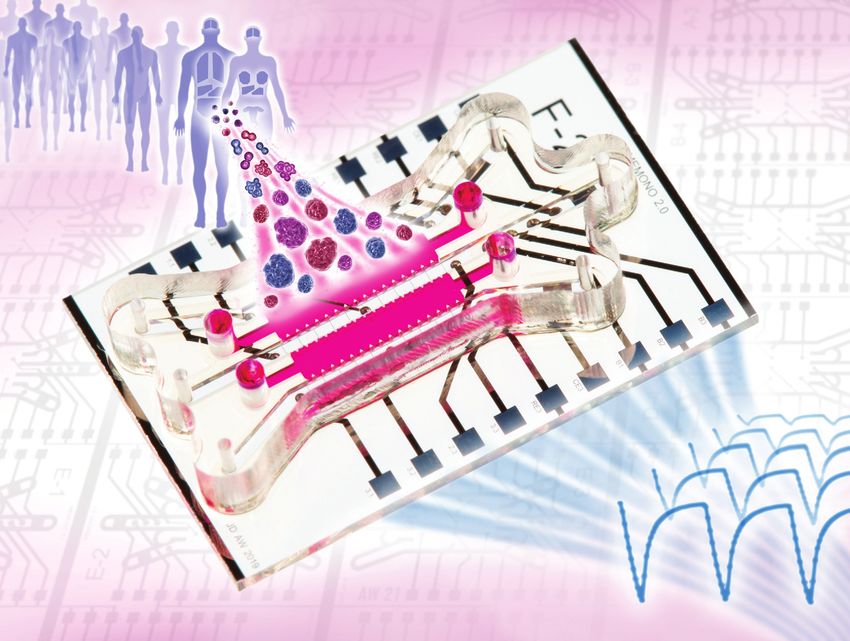
Lab on a Chip
View Article Online
PAPER View Journal | View Issue
Microfluidic organ-on-chip system for multi-
This article is licensed under a Creative Commons Attribution 3.0 Unported Licence.
analyte monitoring of metabolites in 3D cell
Open Access Article. Published on 01 December 2021. Downloaded on 2/27/2022 6:25:08 PM.
Cite this: Lab Chip, 2022, 22, 225
cultures†
Johannes Dornhof, a Jochen Kieninger, a Harshini Muralidharan,b
Jochen Maurer,b Gerald A. Urbana and Andreas Weltin *a
Three-dimensional cell cultures using patient-derived stem cells are essential in vitro models for a more
efficient and individualized cancer therapy. Currently, culture conditions and metabolite concentrations,
especially hypoxia, are often not accessible continuously and in situ within microphysiological systems.
However, understanding and standardizing the cellular microenvironment are the key to successful in vitro
models. We developed a microfluidic organ-on-chip platform for matrix-based, heterogeneous 3D cultures
with fully integrated electrochemical chemo- and biosensor arrays for the energy metabolites oxygen,
lactate, and glucose. Advanced microstructures allow straightforward cell matrix integration with standard
laboratory equipment, compartmentalization, and microfluidic access. Single, patient-derived, triple-
negative breast cancer stem cells develop into tumour organoids in a heterogeneous spheroid culture on-
chip. Our system allows unprecedented control of culture conditions, including hypoxia, and simultaneous
verification by integrated sensors. Beyond previous works, our results demonstrate precise and
reproducible on-chip multi-analyte metabolite monitoring under dynamic conditions from a matrix-based
culture over more than one week. Responses to alterations in culture conditions and cancer drug
Received 3rd August 2021, exposure, such as metabolite consumption and production rates, could be accessed quantitatively and in
Accepted 3rd November 2021
real-time, in contrast to endpoint analyses. Our approach highlights the importance of continuous, in situ
DOI: 10.1039/d1lc00689d
metabolite monitoring in 3D cell cultures regarding the standardization and control of culture conditions,
and drug screening in cancer research. Overall, the results underline the potential of microsensors in
rsc.li/loc organ-on-chip systems for successful application, e.g. in personalized medicine.
1. Introduction the use of patient-derived stem cells that recapitulate the
original patient's tumour from a single stem cell level
Three dimensional (3D) cell cultures have become essential onwards promises truly individualized medicine.1,2 Such
in vitro models, e.g. in cancer research and drug development. models are of particular importance in the development of
Microfluidic organ-on-chip platforms allow patterning and new and personalized medications, as they offer the
compartmentalization of 3D cultures to study responses to possibility for fast, cost-effective and parallelized testing of
stimuli such as drug exposure at minimal volumes, control of potential drug candidates in vitro, without negative side
culture conditions, and cellular interactions. Integrated effects for the patient and with the perspective to also reduce
microsensors for real-time monitoring of both culture animal experiments. The triple-negative breast cancer stem
conditions and cell metabolism promise unprecedented cell (BCSC) model used in this study consists of isolated cells
insight into these complex in vitro models. In cancer research, from individual patients after undergoing chemotherapy.3
Focus on such stem cells is essential because they drive
metastasis and are therapy resistant, meaning traditional
a
Laboratory for Sensors, IMTEK – Department of Microsystems Engineering,
University of Freiburg, Georges-Köhler-Allee 103, 79110 Freiburg, Germany.
treatments may not be effective. In current practice, in order
E-mail: weltin@imtek.de; Tel: +49 761 203-7263 to test e.g. the efficacy of a chemotherapeutic drug, cells are
b
Molecular Gynecology, Clinic for Gynecology and Obstetrics, University Hospital cultured in microtiter plates, then exposed to the
RWTH Aachen, Pauwelsstraße 30, 52074 Aachen, Germany chemotherapeutic agent, and then cultured again while cell
† Electronic supplementary information (ESI) available: Describing the
viability is tracked by e.g. spheroid growth or staining
computational modelling of mass transport. Video S1: filling of cell
compartment with standard laboratory pipette. Video S2: microscopic view of
methods. In some cases, cells are transplanted into mice as
microstructure-guided filling of cell compartment with Matrigel. See DOI: xenografts in order to recapitulate the original tumour. Such
10.1039/d1lc00689d procedures are time and resource consuming, aside from the
This journal is © The Royal Society of Chemistry 2022 Lab Chip, 2022, 22, 225–239 | 225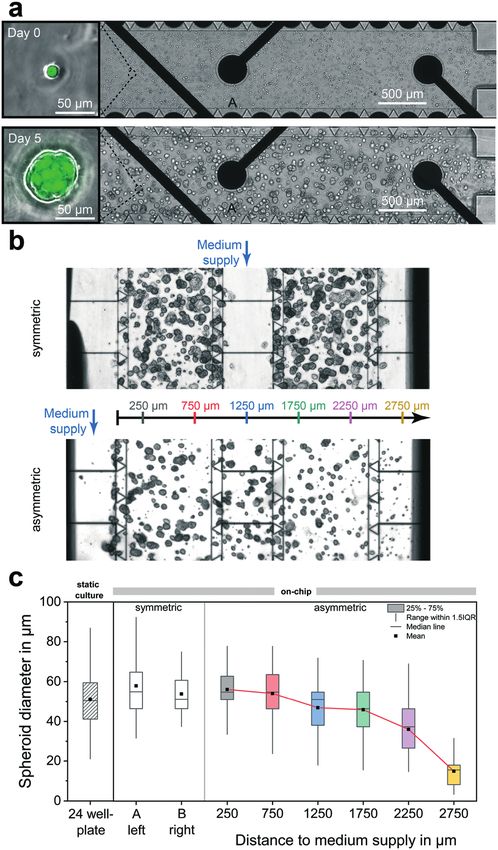
View Article Online
Paper Lab on a Chip
ethical concerns of animal models. It would therefore be for many different parameters such as oxygen,17–27
beneficial to perform some of these analyses on-chip. One superoxide,28 nitric oxide (NO),29 pH,20,25,27,30–32
central aspect is hypoxia as the cells are typically cultured in transepithelial electrical resistance (TEER),33–36
19,23,31,37 19,31,37
hypoxia incubators, although it is not often clear which exact lactate, glucose and other biochemically
oxygen concentration occurs within the 3D matrix. In a stop/ relevant substances were developed and used for examination
flow regimen within an organ-on-chip system, e.g. oxygen of static and dynamic 2D and 3D in vitro models. Optical
consumption as a quantitative measure for cell viability can sensors measure variations in optical properties, e.g.
be determined within minutes from a small cell number in a luminescence of sensing layer, caused by analyte
minimal volume. Besides continuous and online tracking of concentration changes. Their limitations include their
This article is licensed under a Creative Commons Attribution 3.0 Unported Licence.
metabolic parameters, microfluidic systems allow an undefined zero-point, integration capability into full-wafer
Open Access Article. Published on 01 December 2021. Downloaded on 2/27/2022 6:25:08 PM.
advanced level of control of culture conditions including in fabrication processes and inherent non-linear transfer
situ verification thereof. function, which restricts them from use at low
Along with the extensive effort put into improvement of concentrations. Deposition of microelectrodes by means of
in vitro models in order to make them resemble the in vivo thin-film technology established in microfabrication, on the
situation as closely as possible, it became evident that other hand, enables the integration of sensor arrays with a
traditional 2D cultures consisting of adherent cell high spatial resolution within a miniaturized environment.
monolayers can replicate the complex reality within the Besides rather basic electrical sensors for impedance
human body only to a limited extent. It has been shown that measurement to assess barrier properties of adherent cells,
cells of the same type behave fundamentally different this approach allows the integration of electrochemical
depending on how they are cultured.4 Within a 2D culture, sensors for measurement of a variety of different dissolved
cell interactions occur only laterally across the cell species at micromolar concentrations and second-by-second
membranes and through signalling molecules that spread temporal resolution. Their successful integration into both
within the comparably large volume of cell culture medium. static17,24,25,38 and dynamic31 2D cell culture, as well as
Within static 3D cultures, however, cells are embedded hanging droplet systems,37 has already been demonstrated.
within an artificial extracellular matrix (ECM) and develop Bavli et al. showed luminescence-based oxygen sensor beads
into spherical structures called spheroids, in which cell–cell integrated into multiple spheroids in a bioreactor, together
interactions and concentration gradients of metabolites and with external downstream electrochemical glucose and
waste products are found as under physiological lactate biosensors. Misun et al. integrated glucose and lactate
conditions.5,6 Furthermore, 3D models were equipped with biosensors in their hanging droplet system to measure single
medium supply channels for active7,8 or passive9,10 perfusion spheroid metabolism in situ over hours. Both approaches
in order to mimic the dynamic situation and concentration include isolated spheroids in an open or gas-permeable
gradients within living tissue even better. In such system environment. Microsensor integration into platforms
microfluidic platforms, the ECM is partitioned from medium for dynamic, matrix-based cultivation of cells in 3D, on the
channels by means of photolithographic ECM patterning or other hand, is rather challenging. Compartments for reliable
specific barrier structures, manufactured in a wide range of cell-laden gel integration have to be formed. Dynamic,
dimensions and shapes.10–14 Trietsch et al. introduced their reliable and efficient fluidic access has to be provided to
concept of stratified cell culture, in which ECM-gels are supply the cells with medium, and meaningful measurement
separated from fluid channels by microstructured signals have to be extracted from the heterogeneous culture
phaseguides in a microtiter plate format.10 ECM-free by integrated sensors or via microfluidics.
spheroid generation approaches have been elaborated, based In this work, we introduce a transparent, state-of-the-art
on the agglomeration of cells, rather than their formation organ-on-chip platform for matrix-based organoid cultivation
from single cells, within round-bottom ultralow attachment from single cells with integrated highly sensitive and long-
plates, spinning bioreactors, hanging droplets, term stable electrochemical microsensors for real-time
microengineered traps, magnetic levitation and fluidically measurement of oxygen, lactate and glucose. Cell cultivation
generated droplets.15 Such approaches accelerate spheroid is performed within culture compartments enclosing the
formation, but, self-assembly of cells into patient-specific ECM, separated by structured microchannels to enable
tumour organoids cannot be studied in more detail under medium perfusion, introduction of external stimuli and
these accelerated conditions. different microfluidic operation modes. The presented
Characterization of the cell state has traditionally been technology links microsensors with compartmentalized cell
dominated by optical methods such as staining, combined culture, allowing culture conditions, including hypoxia, to be
with microscopy and endpoint analysis. In recent years, it specifically adjusted and monitored. Besides optical
has been shown, that the monitoring of metabolic inspection of spheroid development, the transparent
parameters and culture conditions by means of embedded platform enables determination of cellular oxygen and
sensors can provide many benefits in terms of information glucose consumption as well as lactate production with
content and quality of drug screening experiments, as well as stable sensors over a relevant period of more than one week.
fundamental metabolic characteristics of tissues.16 Sensors To underline the utility of such a technology for drug-
226 | Lab Chip, 2022, 22, 225–239 This journal is © The Royal Society of Chemistry 2022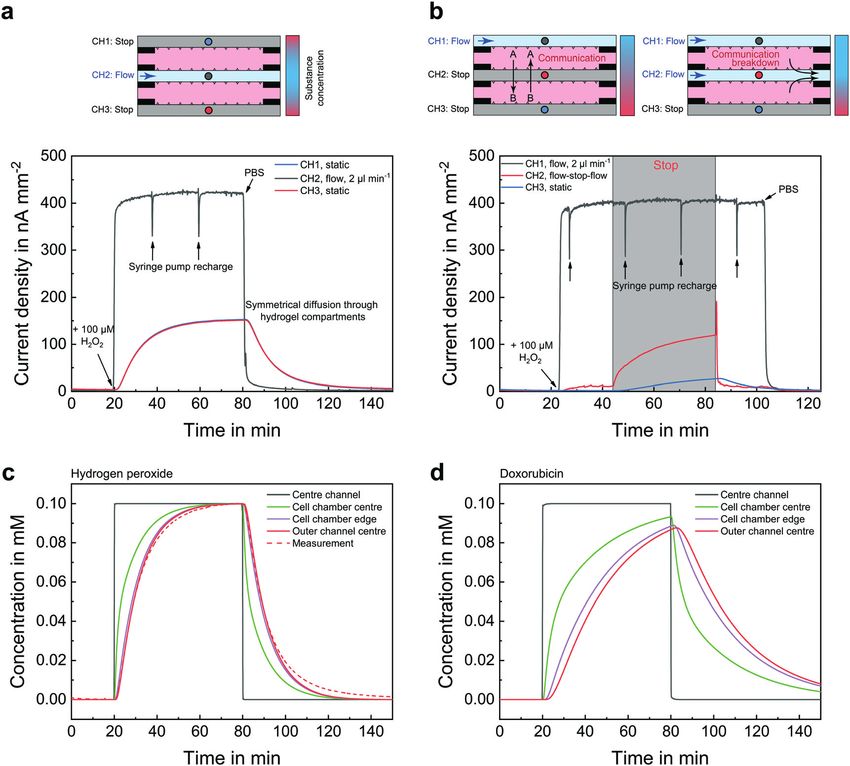
View Article Online

                                                                                                  Lab on a Chip                                                                                                                                       Paper

                                                                                                  screening experiments during personalized therapy, patient-                    covered with an insulation stack of 800 nm silicon nitride
                                                                                                  derived triple-negative breast cancer stem cells (BCSC1) are                   and 200 nm silicon oxide. Reactive ion etching (RIE) through
                                                                                                  used as a clinically relevant cell model and exposed to drugs                  the previously patterned AZ 1518 (Clariant, Switzerland)
                                                                                                  and hypoxia. Besides drug screening and toxicity studies,                      positive resist mask was used to open the insulation and the
                                                                                                  organ-on-chip systems with integrated electrochemical                          titanium layer in regions on the wafer where contact pads
                                                                                                  sensors, as introduced in the following, can contribute to                     and electrodes are located.
                                                                                                  standardization of in vitro models and to more fundamental                         The fluidic walls, barrier structures and electrode rims of
                                                                                                  research on cellular metabolism and interactions between co-                   the platform were formed using the permanent negative
                                                                                                  cultures.                                                                      epoxy resist SU-8 3000 as structural material (Fig. 1c and d).
            This article is licensed under a Creative Commons Attribution 3.0 Unported Licence.

                                                                                                                                                                                 The complex structures were created by 365 nm UV light
Open Access Article. Published on 01 December 2021. Downloaded on 2/27/2022 6:25:08 PM.

                                                                                                  2. Methods                                                                     exposure of multiple SU-8 layers through two different
                                                                                                                                                                                 chrome masks. A first 40 μm thick layer of SU-8 3025 was
                                                                                                  2.1. Chip fabrication                                                          spin-coated, soft-baked and exposed to 360 mJ cm−2 UV light
                                                                                                  Fabrication of the organ-on-chip system began on wafer-level                   to generate circular structures around sensor and reference
                                                                                                  with a 500 μm thick, 4-inch Pyrex borosilicate glass wafer                     electrodes, as well as the continuous part of the barrier
                                                                                                  (Fig. 1c). First, the wafer was coated with a 500 nm silicon                   structures. A post exposure bake step was followed by spin-
                                                                                                  nitride insulating layer using plasma enhanced physical                        coating of three consecutive layers of SU-8 3050 at 80 μm
                                                                                                  vapour deposition (PECVD). The image reversal resist AZ                        thickness each. In between each layer deposition, a soft bake
                                                                                                  5214E (Clariant, Switzerland) was spin-coated to a thickness                   was conducted for 5 min at 65 °C and 25 min at 95 °C. The
                                                                                                  of 1.4 μm and patterned by UV light with the mask aligner                      temperature was ramped at 2 °C min−1 in all baking steps in
                                                                                                  MA6B (Süss MicroTec, Germany) using a chromium mask.                           order to avoid thermal stress-induced delamination of the
                                                                                                  Subsequently, 50 nm titanium as adhesion promoter, 100 nm                      already cross-linked structures of the first SU-8 layer. After
                                                                                                  platinum as electrode material and 20 nm titanium as                           coating the wafer with all layers, the SU-8 stack with a total
                                                                                                  capping layer were evaporated and structured in a lift-off                     thickness of 280 μm was exposed through a second chrome
                                                                                                  process. In a further PECVD step, the wafer surface was                        mask with 990 mJ cm−2 UV light and post exposure baked at

                                                                                                  Fig. 1 System design, configuration and microfabrication. (a) Top-view illustration of the sensor glass chip comprising two cell compartments for matrix-
                                                                                                  based spheroid cultivation with three adjacent microchannels for medium supply and fluidic control of culture conditions. Electrochemical microsensors
                                                                                                  for oxygen, lactate and glucose are integrated for continuous metabolic monitoring. (b) Photographs of an assembled device filled with coloured hydrogel
                                                                                                  and with attached PMMA-cover. Electrical sensor read-out is done by means of a custom-made printed circuit board. Phase-contrast micrograph shows
                                                                                                  breast cancer stem cell (BCSC1) spheroids within a spheroid compartment after five days of culture. (c) Schematic cross-sectional view, including materials
                                                                                                  and technologies used. (d) SEM-micrograph of patterned SU-8 structures composing the fluidic structures. Barrier structures allow leakage-free filling of
                                                                                                  extracellular matrix hydrogels. The photograph shows gel-filled cell compartments.

                                                                                                  This journal is © The Royal Society of Chemistry 2022                                                               Lab Chip, 2022, 22, 225–239 | 227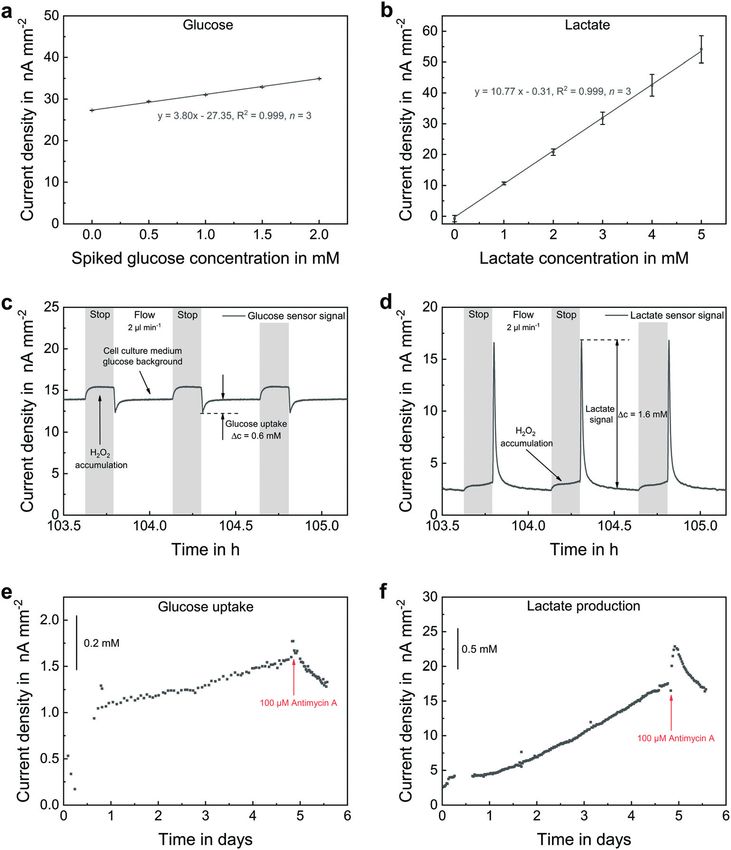
View Article Online
Paper Lab on a Chip
65 °C for 5 h. This step patterns the fluidic walls as well as same approach was used to seal the electrical connections
the triangular shaped barrier structures. Development in between glass chip and PCB (Fig. 1b).
1-methoxy-2-propanol acetate (Sigma-Aldrich, USA) for 75 min The multi-channel potentiostat MultiPalmSens4
on an orbital shaker revealed the cross-linked structures by (Palmsens, The Netherlands) was used in all electrochemical
dissolving unexposed SU-8, which were finally hard baked for measurements in a 3-electrode setup using on-chip reference
3 h at 150 °C. and counter electrodes. Oxygen sensor operation was
performed at an acquisition rate of 10 Hz using the following
2.2. Sensor electrode modification three-step chronoamperometric protocol: (1) 0.7 VAg/AgCl for 2
s, (2) −0.4 VAg/AgCl for 2 s, (3) −0.3 VAg/AgCl for 6 s. Each
This article is licensed under a Creative Commons Attribution 3.0 Unported Licence.
Silver/silver chloride reference electrodes were fabricated by
measurement cycle was ended at open circuit conditions,
Open Access Article. Published on 01 December 2021. Downloaded on 2/27/2022 6:25:08 PM.
electroplating of a 10 μm thick silver layer at −16 mA cm−2
whose duration defined the time between two oxygen
for 10 min in Arguna S solution (Umicore Galvanotechnik,
concentration readings and lasted 50 s or 110 s, depending
Germany). This layer was then partially converted to silver
on the experiment. Biosensors were operated at a constant
chloride in 0.1 M KCl solution at 1.6 mA cm−2 for 20 min.
potential of 0.5 VAg/AgCl and an acquisition rate of 2 Hz.
The last fabrication step on wafer-level was the deposition of
a permselective membrane onto the biosensor electrodes.
Therefore, m-polyIJphenylenediamine) was deposited by 2.4. Cell culture
electropolymerization during cyclic voltammetry using a 3
The fluorescent-labelled breast cancer stem cell line 1 (BCSC1
mM m-phenylenediamine (Sigma-Aldrich, USA) solution.
eGFP) was utilized for all cell-related experiments. Passage
Wafer dicing separated the 20 chips per wafer. Electrical
30–40 cells were cultured in a 2D environment in mammary
connection to the system was ensured by flip-chip bonding to
stem cell (MSC) medium with 2% Matrigel (Corning, USA) at
a printed circuit board with the electrically conductive
37 °C inside a hypoxia box (Billups-Rothenberg, USA) and low
adhesive Polytec EC 242 (Polytec PT, Germany) and curing at
oxygen conditions (3% O2, 5% CO2, 92% N2). The cell culture
100 °C for 20 min. Since all subsequent fabrication steps
medium consisted of mammary epithelial basal medium
were carried out at room temperature, electrodes could now
(Lonza Group, Switzerland) and was supplemented with 2%
be further equipped with hydrogels, which partly contain
B27 (Gibco-BRL, USA), 1% amphotericin B (Sigma Aldrich,
temperature-sensitive enzymes.
USA), 1% penicillin/streptomycin (Sigma-Aldrich, USA), 20 ng
Oxygen sensor electrodes were modified through
ml−1 epidermal growth factor (PeproTech, USA), 4 μg ml−1
deposition of a diffusion-limiting membrane by manual
heparin (Sigma-Aldrich, USA), 20 ng ml−1 fibroblast growth
dispensing and subsequent UV-curing of polyIJ2-hydroxyethyl
factor (PeproTech, USA), 35 μg ml−1 gentamicin (Gibco, USA)
methacrylate) (pHEMA). The pHEMA precursor solution
and 500 nM rho kinase inhibitor H-1152 (Calbiochem, USA).
consisted of 28% HEMA, 26% pHEMA, 42% ethylene glycol,
Cells were split as soon as the confluence reached 70%.
3% triethylene glycol dimethacrylate (TEGDMA) and 1%
In order to isolate single cells from the 2D cell culture,
Irgacure 651 in water. Circular SU-8 rims around the
cells were incubated with accutase (Life Technologies, USA)
electrodes define the volume and protect the membrane
for 20 min at 37 °C. After cell counting, the desired cell
during microfluidic operation. Platinum counter electrodes
number was suspended in 25% MSC medium and 75%
were left untreated. For biosensor fabrication, pHEMA with
Matrigel on ice. A volume of 3.5 μl of the suspension was
entrapped lactate oxidase (Sekisui Chemical, Japan) or
filled into each cell compartment through the gel loading
glucose oxidase (BBI Solutions, UK) was dispensed onto the
ports using a 10 μl pipette and pre-cooled tips. The cell-laden
previously applied electropolymer membrane. If an increase
chip was incubated at 37 °C for additional 30 min to let the
of the linear range of the sensor was necessary, an additional
Matrigel solidify. The polyimide tape HB830 (Hi-Bond Tapes,
diffusion-limiting pHEMA membrane without embedded
UK) was used in order to seal all ports in a gas-tight manner
enzymes was applied. Blank electrodes consisted of exactly
on the top side of the platform which are not connected
the same configuration but without lactate oxidase or glucose
during microfluidic operation. Drug exposure experiments
oxidase in the first pHEMA membrane.
were performed using doxorubicin hydrochloride (Actavis,
USA) and antimycin A (Sigma Aldrich, USA).
2.3. Device assembly and electrical read-out
The final fabrication step was the permanent attachment of a
computer numerical control (CNC) milled poly- 2.5. Microfluidic measurements
IJmethylmethacrylate) (PMMA) cover (2 mm thickness) to the Demonstration of fluidic compartment separation was
fluidic unit (Fig. 1b and c). The cover contained all fluidic in- performed with spheroid compartments containing 0.5%
and outlet ports and was placed manually on the fluidic walls agarose (Sigma-Aldrich, USA). Depending on the scenario,
using a stereo microscope. Both components of the system either pure phosphate-buffered saline (PBS) or PBS with 100
were attached by underfilling of the biocompatible epoxy- μM H2O2 (Perhydrol, Merck, Germany) was perfused at 2 μl
based adhesive Epo-Tek 302-3M (Epoxy Technology, USA) min−1 through the respective channel by means of two
and subsequent curing at room temperature for 24 h. The precision syringe pumps (PHD 2000 Infusion/Withdraw,
228 | Lab Chip, 2022, 22, 225–239 This journal is © The Royal Society of Chemistry 2022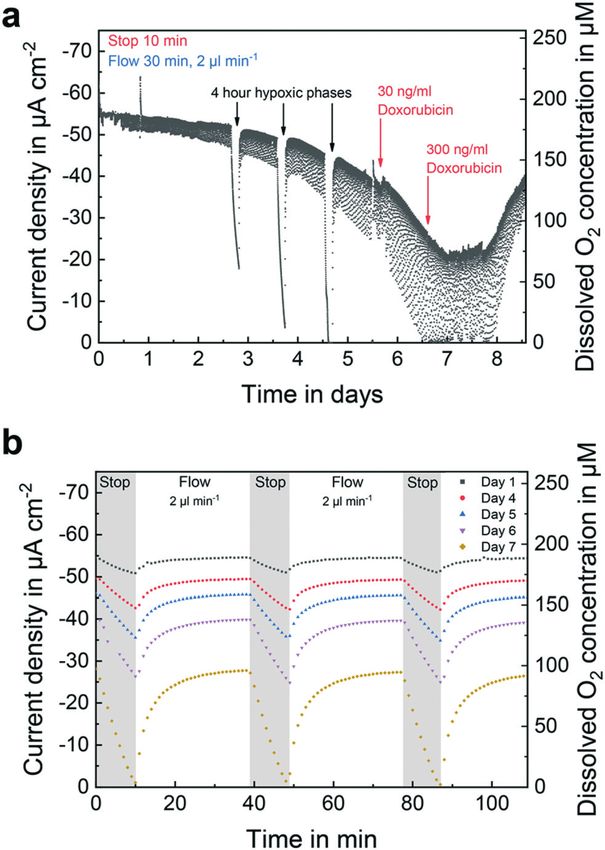
View Article Online
Lab on a Chip Paper
Harvard Apparatus, USA and Cavro XL 3000, Tecan Group, microstructure-guided gel integration allows the embedment
Switzerland). of artificial extracellular matrices (ECM) commonly used for
Throughout all cell-based and sensor-related in vitro cell cultivation44 into the closed platform, such as
measurements, the programmable syringe pump Cavro XL Matrigel, but also agarose or polyethylene glycol (PEG).
3000 was used. Pump protocols were implemented with the Within these compartments, single cells of mono- or co-
software bioMON 4 (Jobst Technologies, Germany). cultures develop into organoids with heterogeneous 3D
Oxygen calibration was performed in PBS at 37 °C and structures during microfluidic operation, while cell culture
Matrigel-filled spheroid compartments. The electrolyte medium is supplied via adjacent microchannels
reservoir was purged with a mixture of air and nitrogen using (Fig. 1a and b). The same channels permit the targeted
This article is licensed under a Creative Commons Attribution 3.0 Unported Licence.
the gas mixing station GMix41 (Hitec-Zang, Germany). control of culture conditions, insertion of external stimuli
Open Access Article. Published on 01 December 2021. Downloaded on 2/27/2022 6:25:08 PM.
Biosensors were calibrated before and after an experiment such as drugs or hypoxia, and a fluidic separation of culture
using aliquots of MSC medium containing different compartments for investigation of cell–cell interactions. In
concentrations of sodium L-lactate (Sigma-Aldrich, USA) and contrast to open systems such as hanging droplet platforms
D-(+)-glucose-monohydrate (Honeywell Fluka, USA). or systems made of PDMS, an accurate control of the
After platform seeding with the desired cell density, the dissolved gas composition and the ability to measure cellular
system was placed in an oven at 37 °C and electrically respiration rates is enabled by the gas-tight sealing of the
connected to the potentiostat. Unless otherwise stated, the culturing milieu. Electrochemical microsensors, directly
inlet of the middle channel was connected to a reservoir integrated into the culture environment, monitor both
filled with 15 ml MSC medium via microfluidic tubing. An culture conditions and cellular metabolism. The metabolic
atmosphere consisting of 95% air and 5% CO2 supplied by parameters oxygen, lactate and glucose are measured
the gas mixing station was created within the reservoir. A continuously in a stop/flow perfusion concept for renewal of
syringe pump was connected to the same channel's outlet in the medium without exposing cells to flow-induced shear
order to aspirate the cell culture medium in stop/flow (2 μl stress. Additionally, the design also allows passive pumping
min−1) cycles. The inverted microscope Nikon Eclipse schemes, e.g. by gravity.
TE2000-U (Nikon, Japan) was used to acquire phase-contrast The fluidic unit of the system is disposed on a 16.2 × 10.6
and fluorescence images. mm2 Pyrex borosilicate glass chip using microfabrication
processes and consists of two 1.4 μl cell compartments
2.6. Computational modelling of mass transport surrounded by three 500 μm wide microchannels (Fig. 1a).
We performed computational modelling of the mass Within the platform, electrochemical microsensors are
transport in the microfluidic organ-on-chip system using integrated into the bottom of the glass chip. Three
finite element analysis with COMSOL Multiphysics 4.2 amperometric oxygen sensor electrodes (Ø 200 μm) are
(COMSOL, USA). The physics interface “Transport of Diluted located in each of the three channels in close vicinity of the
Species” bearing Fick's law was chosen under the assumption compartments. In another design variation, oxygen sensors
of diffusion limited mass transport within the two- are additionally located in the spheroid compartments'
dimensional model. No further interaction of the molecule bottom in order to access pericellular oxygen levels. Three
with the hydrogel was assumed. Concentration changes enzyme-based biosensor electrodes for glucose, lactate and
within the supply channel were implemented with a the blank signal are present downstream the middle channel.
transition time of 20 s. Hydrogen peroxide and doxorubicin, Biosensors are located just outside the cell culture area so
with diffusion coefficients in water modelled as 2 × 10⁻⁹ m2 that the occurring reactions do not influence the cells, but
s−1 (ref. 39, 40) and 0.58 × 10⁻⁹ m2 s−1,41 respectively, were close enough that undiluted low-volume medium can be
used as representative substances for small and larger measured. Additionally, the biosensor technology allows the
molecules. Diffusion coefficients for the substances in potential detection of additional molecules such as pyruvate,
75% Matrigel in the cell chambers are not available in the glutamate45 or superoxide28 by changing the embedded
literature. Based on our own measurements, we estimated enzyme. Each microchannel has a downstream rectangular-
the diffusion coefficients in 75% Matrigel to be 25% lower shaped counter (0.35 mm2) and circular silver/silver chloride
than in water, which is in good agreement with the (Ag/AgCl) reference electrode in order to measure the analytes
literature42 for 100% Matrigel. Additional analyses for various in a 3-electrode setup. Biosensor and reference electrodes
diffusion coefficients, chip locations and diffusion times can have a diameter of 300 μm.
be found in the ESI.† Based on previous studies of Bohl et al.46 and Rubehn
et al.,47 a multi-layer photo-lithography process was
3. System concept and design elaborated to pattern the structures which form the fluidic
unit from permanent epoxy photoresist (SU-8). The interface
The presented microsystem is designed for three- between compartment and microchannel, which is defined
dimensional, matrix-based cell cultivation and sensor- by barrier structures that guide leakage-free filling of the
assisted characterization of the metabolic microenvironment. liquid cell/matrix suspension, ensures diffusion of dissolved
Preliminary results were introduced earlier.43 Simple, molecules into and out of the compartments during culture.
This journal is © The Royal Society of Chemistry 2022 Lab Chip, 2022, 22, 225–239 | 229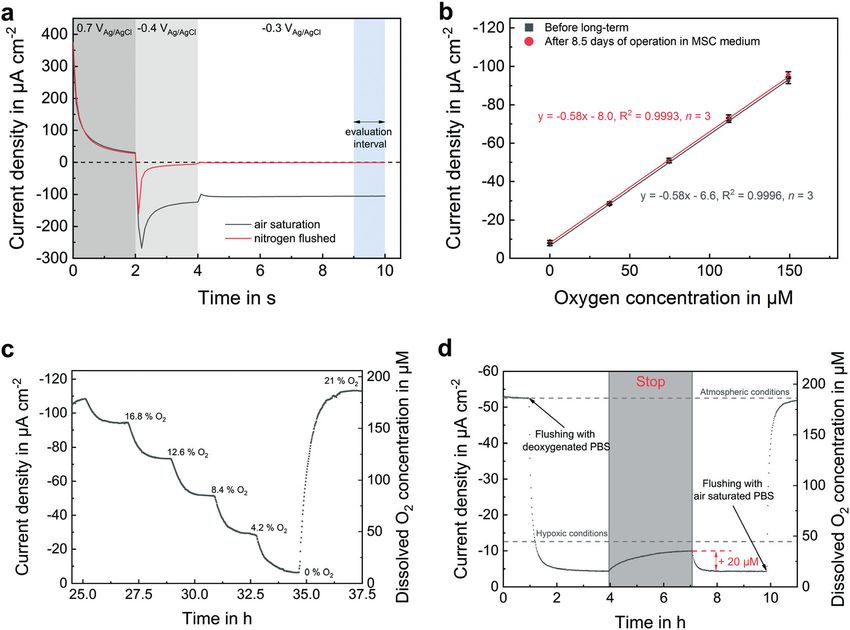
View Article Online

                                                                                                  Paper                                                                                                                            Lab on a Chip

                                                                                                  Barrier structures are composed of a 40 μm high step with                      Single cells suspended in an ice-cold Matrigel/medium
                                                                                                  superimposed equilateral triangles of 100 μm edge length                    mixture are introduced with a standard laboratory 10 μl
                                                                                                  and 200 μm spacing (Fig. 1d). The height of the triangles                   pipette via cell-loading inlet ports on the topside of the
                                                                                                  extends up to the entire height (280 μm) of the inner volume                platform (see Movie S1†). The guidance of the barrier
                                                                                                  of the platform, which can be adjusted with a high precision                structures provides leakage-free fluid propagation through
                                                                                                  and reproducibility by means of the multi-layer fabrication                 the spheroid compartments (Movie S2†) with a
                                                                                                  process. In combination with the flat step, the integrity of                homogeneous cell distribution. The modular arrangement
                                                                                                  the introduced gel is not affected by fluidic operation for                 of compartments and channels permits upscaling if
                                                                                                  more than one week. The top part of the platform is formed                  additional cultures are to be studied. An internal volume of
            This article is licensed under a Creative Commons Attribution 3.0 Unported Licence.

                                                                                                  by a milled PMMA cover including all fluidic ports and is                   below 10 μl allows rapid changes of substance
Open Access Article. Published on 01 December 2021. Downloaded on 2/27/2022 6:25:08 PM.

                                                                                                  hermetically bonded to the fluidic unit (Fig. 1c). The design               concentrations and reactions to external stimuli, using
                                                                                                  is such that all fluidic structures could be included in the                small amounts of fluids. Culture conditions during drug
                                                                                                  cover alone, e.g. as an injection moulded part, for more                    screening experiments can thus be changed dynamically
                                                                                                  efficient fabrication.                                                      within short time intervals.

                                                                                                  Fig. 2 Mass transport control study. H2O2 in PBS was used as test substance and measured with microsensors located in the centre of each
                                                                                                  microchannel. (a) Liquid perfusion is exclusively performed within the middle channel leading to identical microenvironments inside both spheroid
                                                                                                  compartments, reflected by the overlapping sensor signals. (b) Second operation mode in which a constant flow is applied to an outer channel. If
                                                                                                  perfusion within the middle channel is stopped, concentration gradients form across both compartments permitting communication of different
                                                                                                  cell types. Application of a flow to the same channel interrupts the communication by fluidic separation. (c) Computational modelling of mass
                                                                                                  transport for hydrogen peroxide (Dliq = 2.50 × 10⁻⁹ m2 s−1, Dgel = 1.875 × 10⁻⁹ m2 s−1) diffusion from the centre channel into the cell chamber. The
                                                                                                  measurement results fit the modelled behaviour very well, confirming that the sensor signals follow the underlying principles, and that mass
                                                                                                  transport is dominated by diffusion. (d) Computational modelling of the mass transport of a larger molecule, the cancer drug doxorubicin (Dliq =
                                                                                                  0.58 × 10⁻⁹ m2 s−1, Dgel = 4.35 × 10⁻¹⁰ m2 s−1) into the cell chamber.

                                                                                                  230 | Lab Chip, 2022, 22, 225–239                                                           This journal is © The Royal Society of Chemistry 2022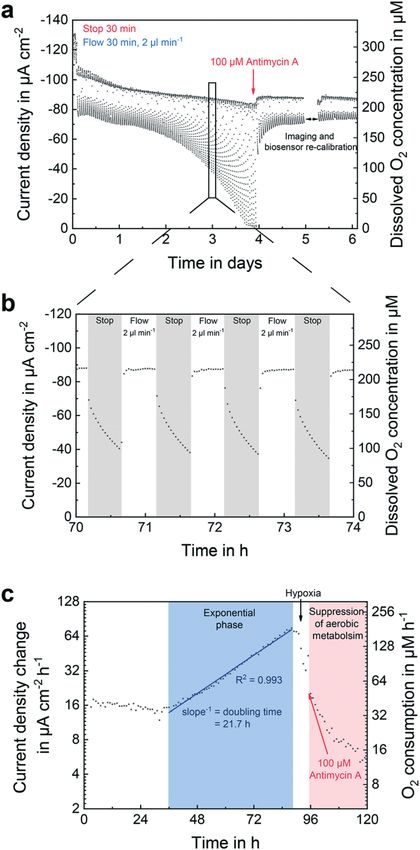
View Article Online
Lab on a Chip Paper
4. Results channel, where liquid flow prevented further diffusion into
4.1. Mass transport and microfluidic compartmentalization compartment B. By stopping the flow in the middle channel,
the H2O2 entered the static channel through compartment B,
The chip layout allows generation of different as indicated by the increase of the sensor signal within this
microenvironments in both spheroid compartments, as well channel. Re-establishment of the flow resulted in a removal
as control of the communication between the embedded cells of H2O2 from compartment B and re-isolation of both
by directing fluid flow to specific channels. To illustrate the compartments. Hereby, we show the successful manipulation
system's capabilities, Fig. 2 shows two possible operation of mass transport and thus culture conditions by
modes together with electrochemical measurements under compartmentalization and microfluidics.
This article is licensed under a Creative Commons Attribution 3.0 Unported Licence.
microfluidic operation, in which each mode was performed Computational study. Fig. 2c shows the simulated mass
Open Access Article. Published on 01 December 2021. Downloaded on 2/27/2022 6:25:08 PM.
in sequence. Hydrogen peroxide (H2O2) in phosphate transport of a small molecule, e.g. hydrogen peroxide,
buffered saline (PBS), which occurs as a reactive species and recapitulating the experiment in Fig. 2a. As expected, there is
behaves similarly to oxygen in terms of diffusion, was used an almost immediate concentration change in the centre
as test substance for these diffusion analyses. channel and an increasingly slower change, the larger the
Experimental study. Fig. 2a shows the first operation distance to the centre channel becomes. The dashed line
mode in which the two outer channels are kept static, while shows the normalized experimental data from Fig. 2a for the
the middle channel is perfused. This leads to equal hydrogen peroxide measurement in the outer channel. It can
substance distribution into both spheroid compartments due be observed that the experimental data follow the simulated
to the axial symmetry of the chip. Depending on the curve very closely. The main qualitative difference is observed
diffusivity of the individual solute within the used hydrogel, in the higher signal at the end during the removal of the
concentration gradients develop from the centre to the outer substance, which can be explained by an ongoing release of
walls of the chip. This was demonstrated with an substance from the dead ends of the fluid channels that were
electrochemical measurement, in which all sensors showed a not modelled. The degree of quantitative match between
signal close to zero at the beginning, since no oxidizable experiment and simulation lies in the accuracy of the used
substance was present in PBS. As soon as H2O2 entered the diffusion coefficients. Data for different combinations of
platform via the middle channel, the sensor located within it diffusion coefficients and the influence on diffusion times
showed a rise in signal which was dependent on the analyte are found in the ESI.† Overall, it can be shown that our
concentration and the flow rate. With a lag of around 70 s, sensor data follow the underlying physical principles, which
the sensors near the outer walls of the chip showed an are dominated by diffusion within the cell compartments,
increase in signal current, as H2O2 molecules diffused and reflect the expected mass-transport situation very well,
through the hydrogel containing compartments leading to a both qualitatively and quantitatively. Furthermore, it was
rise in concentration. Thereby, the courses and final values shown that in situ sensors can provide valuable information
of both sensor signals were similar, indicating a symmetrical by verifying parameters used in computational models, such
substance distribution within the chip and a highly as the diffusion coefficient, which is extremely challenging to
reproducible sensor performance. After pure PBS was measure but has strong influence on the mass transport.
perfused again in the middle channel, it took 30 min Fig. 2d shows the same situation as Fig. 2c, just for a
(t90%–10%) until the hydrogels released all H2O2. Sensor much slower diffusing substance, such as the drug
signals increased and decreased according to t (−1/2) matching doxorubicin. As expected, a much slower concentration
the one-dimensional analytical solution of Fick's second change can be observed. Overall, it can be assumed that
law.48 Hereby, we show how integrated sensor measurements concentrations of small molecules such as oxygen are fully
can enable the assessment of mass transport in organ-on- exchanged in the cell compartments within a typical flow
chip devices. phase of 30 min. For matrix-based 3D cell culture systems, it
Fig. 2b shows the case where the supply of nutrients and should be considered that diffusion is comparably slow if
oxygen is ensured via one outer channel, while the other two there is no forced mass transport, e.g. by flow, and diffusion
channels are kept static without flow. Thus, concentration times even in highly permeable ECM gels are in the range of
gradients range over the entire width of the chip. In addition, minutes to hours depending on the molecule size. Further
communication between the compartments can then take details regarding system geometry, diffusion coefficients and
place by diffusion of signalling molecules through the static diffusion times are found in the ESI.†
middle channel. Applying a flow to this channel leads to an
interruption of the communication and isolates both
compartments fluidically. The application of the middle 4.2. Oxygen sensor characterization
channel for such fluidic separation was validated by a The applied amperometric oxygen sensor principle relies on
measurement with H2O2, which can be seen as a signalling the electrochemical reduction of oxygen at the platinum
molecule equivalent with a comparatively high diffusivity due surface. Concentration changes are therefore determined by
to its smaller size. After adding H2O2 to the outer channel, it measuring the mass transport change to the electrode. For
diffused through compartment A and reached the middle this purpose, an optimized chronoamperometric protocol17
This journal is © The Royal Society of Chemistry 2022 Lab Chip, 2022, 22, 225–239 | 231View Article Online
Paper Lab on a Chip
This article is licensed under a Creative Commons Attribution 3.0 Unported Licence.
Open Access Article. Published on 01 December 2021. Downloaded on 2/27/2022 6:25:08 PM.
Fig. 3 Oxygen sensor and gas-tightness characterization. Medium flow was applied to the middle channel at 10 μl min−1. Both outer channels
were kept static. (a) Sensor response for the chronoamperometric oxygen measurement protocol in air-saturated and nitrogen-flushed PBS. The
mean current density of the last second is taken for data evaluation. (b) Oxygen sensor calibration before and after long-term measurement in
MSC medium. Error bars are s.d. (c) Transient oxygen calibration. (d) Gas-tightness verification by lowering the oxygen concentration via fluidics
and subsequent stopping of the perfusion. Dissolved oxygen concentration remains in hypoxic regime within the spheroid compartment even after
3 h without active supply of oxygen-free electrolyte.
was applied (Fig. 3a), which is based on the unique Fig. 3b. Sensitivity did not change after more than 8 days of
characteristic features of platinum electrochemistry. Initially, continuous operation. These results underline the stable
platinum oxide is formed at an anodic potential. The formed electrochemical protocol and the protection of the electrodes
oxide layer is reduced in the following step by lowering the by the membranes, which successfully prevent electrode
potential to a cathodic region. As a result, a bare platinum fouling and attachment of blocking substances. Additionally,
surface is present at the electrode–electrolyte interface, which sensitivity can be adjusted by the membrane thickness. In
acts as a catalyst for the oxygen reduction reaction. In a last the shown example, the sensitivity was −0.58 μA cm−2 μM−1
upward step by 100 mV to achieve faster sensor stabilization, with a relative error of 0.8% ± 0.4% before and 1.2% ± 0.4%
the actual oxygen measurement takes place. A typical current after long-term measurement (n = 6 × 3, based on 6 different
response is shown in Fig. 3a for oxygen concentrations at concentration values in 3 independent calibration runs) with
atmospheric and anoxic conditions. Oxygen-free conditions respect to the measurement range. All electrodes showed a
result in a sensor output close to zero allowing one-point detection limit below 1 μM (based on 3 σ of the blank). Low
calibration. An approximately 20 μm thick pHEMA-based standard deviations of the measurement points indicate a
diffusion limitation membrane is dispensed into the SU-8 highly reproducible measurement of the oxygen
polymer rims surrounding the sensor electrodes (Fig. 1c) in concentration within the platform.
order to obtain a defined diffusion profile above the
electrode and thereby increase the stability of the sensor
response. 4.3. Gas tightness
By cyclic formation and removal of the oxide layer, the In many microfluidic systems for culturing and monitoring
electrode is permanently cleaned during the measurement. spheroid cultures that are made of gas-permeable materials
This leads to a remarkably high long-term stability of the (such as PDMS) or open systems (such as hanging droplets),
sensor without measurable drift over one week, even within the gas composition in the cell culture medium is regulated
protein-containing cell culture medium, as demonstrated in by gas exchange with the incubator environment. This is a
232 | Lab Chip, 2022, 22, 225–239 This journal is © The Royal Society of Chemistry 2022View Article Online
Lab on a Chip Paper
convenient approach, however unlike the in vivo situation, if
a constant and reproducible oxygen concentration is desired
for all tissue types in the system, especially if several systems
are used in parallel for a high throughput evaluation. We
intentionally used gas-impermeable materials to have a
targeted control of the gas composition through external
gassing of the medium in reservoirs outside the microsystem.
In addition, this enables the determination of cellular
respiration rates, since the controlled influx of new medium
This article is licensed under a Creative Commons Attribution 3.0 Unported Licence.
is the only source of oxygen molecules.
Open Access Article. Published on 01 December 2021. Downloaded on 2/27/2022 6:25:08 PM.
The ability of the system to maintain hypoxic conditions
within a spheroid compartment was verified with an
experiment (Fig. 3d) in which the oxygen concentration was
first lowered to below 15 μM by perfusing oxygen-free
electrolyte. Upon stopping the flow for 3 h, oxygen has
increased to a final concentration of 35 μM, remaining in
hypoxic regime. Most likely, this slight increase is caused by
oxygen dissolution from microbubbles which remain after
the sealing of inlet and outlet ports, rather than by oxygen
diffusion through the compartment surrounding materials.
However, in practical operation during cell culture, typical
stop phases do not last longer than 30 min, which leads to a
maximum oxygen concentration increase by 10 μM, if there is
no cellular oxygen consumption.
4.4. Formation of breast cancer stem cell spheroids
The cell model used in this work consists of triple-negative
breast cancer stem cells, more specifically of the breast
cancer stem cell line 1 (BCSC1), one of five extensively
characterized BCSC lines isolated from primary invasive
tumours of individual patients.3,49,50 BCSCs are of particular
interest in the development of personalized chemotherapy
approaches for triple-negative breast cancer patients, as they
Fig. 4 On-chip tumour spheroid formation. (a) Phase-contrast
are considered to be responsible for both cancer metastasis micrographs of single breast cancer stem cells (BCSC1) embedded in
and therapy resistance.51 75% Matrigel right after seeding and gelation at a seeding density of 2
Fig. 4a shows the development of single BCSC1 cells into × 106 cells ml−1. During dynamic supply with cell culture medium over
spheroids with a mean diameter of approximately 50 μm days, spheroids develop within compartments. Scale bar, 500 μm.
Inserts show micrograph overlays (phase-contrast and green
after four days of culture under dynamic fluidic operation in
fluorescence) of a single cell and a spheroid. Scale bars, 50 μm. (b)
which cell culture medium was perfused through the middle Phase-contrast micrographs showing spheroids on day 5 of culture
channel of the chip. By variation of different seeding which have grown under two different medium supply situations.
densities, an optimum was found between 0.5 × 10⁶ and 2 × Seeding densities: 1.5 × 10⁶ cells ml−1 (top) 0.5 × 10⁶ cells ml−1
106 cells per ml, resulting in a total cell number of 3500 to (bottom). (c) Comparison of spheroid diameter distribution for static
conditions within a traditional well-plate (seeding density: 1.5 × 10⁶
15 000 cells per platform. In this range, there were enough
cells ml−1) and for both dynamic situations on-chip (n ≥ 58).
cells for a sufficiently high measurement signal and at the
same time no lack of nutrients occurred, and enough room
for growth remained over a time span of at least five days.
Due to the axial symmetry along the central channel, the distribution varies more widely compared to methods
same concentration gradients develop in both cell chambers, where individual spheroids are formed from aggregation
as confirmed in Fig. 2a. Thus, spheroids in compartment A of a defined number of cells using microfluidic structures
and B experience the same culture conditions during growth and techniques.52 In order to study spheroids with a
and do not differ in size or amount (Fig. 4b and c). uniform size distribution or larger diameter for higher
Furthermore, on-chip grown spheroids have the same metabolic activity instead of the development from single
morphology and size distribution as within a standard well- cells, spheroids can be grown outside the platform, sorted
plate format (Fig. 4c). Typical for cultures in which spheroids by a cell strainer with defined mesh size and transferred
develop from ECM-embedded single cells, the spheroid size into the platform.
This journal is © The Royal Society of Chemistry 2022 Lab Chip, 2022, 22, 225–239 | 233View Article Online
Paper Lab on a Chip
The lower micrograph of Fig. 4b shows an example where
the whole inner volume of the platform was filled with cell-
laden Matrigel, with the exception of one outer channel
which was used for medium perfusion. This asymmetric
supply with fresh medium results in substance gradients
across the entire width of the platform, as demonstrated in
Fig. 2b. Previous studies demonstrated for adherent cell
monolayers53 and matrix-embedded cancer cells54 that such
gradients lead to nutrient-dependent metabolic profiles and
This article is licensed under a Creative Commons Attribution 3.0 Unported Licence.
cell viability. Consequently, spheroids developing closer to
Open Access Article. Published on 01 December 2021. Downloaded on 2/27/2022 6:25:08 PM.
the supply were exposed to more favourable growth
conditions than cells growing more distant, as reflected in
their structure. This is also evident from the spheroid
diameter (see Fig. 4c), which was significantly smaller when
the spheroids were located more than 1.75 mm from the
supply channel. Since in all experiments we observed that
BCSC1 spheroids grew largely independent of the oxygen
concentration, we speculate that other factors such as the
accumulation of waste products leads to inhibition of
spheroid growth. These findings underline the importance of
selecting appropriate scaling of cell culture environments,
considering the diffusion properties of nutrients and cellular
waste products within the used ECM, and verifying culture
conditions in situ with integrated sensors.
4.5. Measurement of cellular oxygen consumption
Fig. 5 shows the signal of an oxygen sensor located in the
centre of the perfusion channel, in between of both cell
compartments. During growth, the culture medium was
aspirated through the platform in stop/flow cycles with each
phase lasting for 30 min. In the stop phases, active supply of
medium with atmospheric oxygen concentration was
stopped. The change in oxygen concentration within the chip
was then solely caused by the cells and showed a steady
decrease over time (Fig. 5b). Oxygen sensor consumption
during a stop phase was only 0.3% with respect to the overall
oxygen content within the chip and can therefore be
neglected. During flow phases, cells were re-supplied with
oxygen-rich medium, which passed over the sensor at 2 μl
min−1, bringing its signal back to baseline. Since the signal is Fig. 5 In-line oxygen monitoring. Oxygen monitoring in the central
perfusion channel during the formation of breast cancer stem cell
superimposed by a flow-dependent offset, the sensor showed
(BCSC1) spheroids at a seeding density of 2 × 10⁶ cells ml−1. MSC cell
a higher oxygen concentration than the expected 188.7 μM at culture medium was perfused in stop/flow cycles. Oxygen
atmospheric conditions (19.9% O2, 5% CO2). The gap in the concentration was measured every 2 minutes. (a) Oxygen
oxygen measurement after addition of the drug resulted from measurement over 6 days during spheroid formation including
electrical disconnection of the system from the potentiostat exposure to the metabolism altering drug antimycin A. (b) Section over
4 hours on day 3 of the same measurement. Each measurement point
to characterize the state of the cells under the microscope
represents the oxygen concentration at the given time. (c) Oxygen
and subsequent recalibration of the biosensors. consumption over time, whereby the slopes of the linear fits of the last
Over time, the oxygen demand of the cells increased, due 5 concentration values of each stop phase were taken for data
to proliferation and exponential growth of the cell number evaluation.
within the forming spheroids. This is also reflected in the
decrease of oxygen concentration during the stop phases in
the course of culture time (Fig. 5a). After 3.75 days, all the sensor output at anoxic conditions during calibration
available oxygen molecules were metabolized during the stop (Fig. 3a). Oxygen consumption increased with a doubling
phases, as indicated by a sensor current of −1.2 μA cm−2, time of 21.7 h (Fig. 5c). After 4 days of culture, 100 μM
which represents 1.5% of atmospheric conditions matching antimycin A was added to the cell culture medium leading to
234 | Lab Chip, 2022, 22, 225–239 This journal is © The Royal Society of Chemistry 2022View Article Online
Lab on a Chip Paper
an abrupt rise in oxygen concentration to atmospheric phases. During the first three days of culture, flow phases re-
conditions. As antimycin A inhibits mitochondrial electron established conditions at 19.9% oxygen. Afterwards, this
transfer,55 the aerobic cell metabolism was suppressed, as baseline was no longer reached due to the high oxygen
shown by the drastic decrease in oxygen consumption. A uptake by the cells, as shown in Fig. 6b, where stop/flow
cellular response to the drug occurred within a 1 hour stop/ sections at the end of the respective day are summarized.
flow cycle (Fig. 5a). By integration of oxygen sensors into the This observation underlines the importance of positioning
perfusion channel of such dynamic cell culture systems, the sensors for oxygen monitoring within the cell embedding
oxygen concentration of the inflowing medium can be ECM to access the realistic culture microenvironment
monitored. At the same time, oxygen consumption rates can experienced by the cells even during active medium
This article is licensed under a Creative Commons Attribution 3.0 Unported Licence.
be determined very accurately and used for revealing drug- perfusion.
Open Access Article. Published on 01 December 2021. Downloaded on 2/27/2022 6:25:08 PM.
induced effects on the respiratory metabolism. During spheroid development, three experimental phases
were included, in which the supply with fresh medium was
interrupted for 4 h (Fig. 6a) in order to mimic acute cyclic
4.6. Pericellular monitoring and exposure to doxorubicin hypoxia as seen in real tumours during accelerated growth
While the previous example covered the oxygen concentration compared to healthy tissue.56 After each phase, the oxygen
change within the medium supply channel of the system, concentration returned to values as before stopping the flow,
Fig. 6a shows a long-term oxygen measurement in the centre and the cellular oxygen consumption did not change. Since
of a spheroid compartment in close vicinity to the spheroids. the oxygen consumption was also not affected, it is shown
By integration into the cell compartment, the sensor's signal that BCSC1 cells have an adapted metabolism and tolerate
is not flow-dependent and indicates the actual oxygen hypoxia well, whereas oxygen consumption does not depend
concentration experienced by the cells even during flow on the overall oxygen concentration.
On the sixth day of culture (Fig. 6a), 30 ng ml−1 of the
chemotherapeutic drug doxorubicin, frequently used for the
treatment of breast cancer and based on the intercalation
into the DNA,57 was added to the cell culture medium. At this
critical concentration, BCSC1 cells show a significantly
inhibited cell proliferation when cultivated in 2D.49 In
contrast, the BCSC1 spheroids showed no change in
metabolism even more than 24 h post drug exposure. After
increasing that concentration by a factor of 10, the oxygen
concentration course changed to higher values. As verified by
microscopy the cells began to die, whereby the oxygen
concentration within the compartment successively began to
rise. Comparing the onset of action on oxygen uptake for
antimycin A (Fig. 5a) and doxorubicin (Fig. 6a) indicates, that
antimycin A induces a drug response much faster reflecting
the differences in the mechanisms of action. Such
acquisition of additional information on pharmacodynamics
highlights the fundamental benefit of sensor-based
pericellular metabolic monitoring. In comparison to a
traditional experiment where cells are exposed to a drug, re-
seeded and proliferation is monitored over days, our method
allows real-time, online and quantitative access to cell
metabolism.
4.7. Glucose and lactate monitoring
Biosensors are based on the equimolar conversion of glucose
or lactate into H2O2 inside the pHEMA-based hydrogel, which
is immobilized on the electrodes and entraps the enzymes
glucose oxidase or lactate oxidase, respectively. The
Fig. 6 Long-term oxygen monitoring. (a) Pericellular oxygen concentration of the analyte is then determined by the
monitoring within a spheroid compartment at a seeding density of 1.5
current density for the oxidation of the formed H2O2 at a
× 106 cells ml−1. Oxygen concentration was measured every minute.
During measurement, cells were exposed to three hypoxic phases and
potential of 0.5 VAg/AgCl. Sensor calibration for glucose and
two exposures to different concentrations of doxorubicin. (b) Course lactate sensors are shown in Fig. 7a and b, respectively.
of the oxygen concentration at the respective day of culture. During measurement, a blank-signal was recorded by an
This journal is © The Royal Society of Chemistry 2022 Lab Chip, 2022, 22, 225–239 | 235View Article Online
Paper Lab on a Chip
This article is licensed under a Creative Commons Attribution 3.0 Unported Licence.
Open Access Article. Published on 01 December 2021. Downloaded on 2/27/2022 6:25:08 PM.
Fig. 7 Biosensor characterization and long-term measurements. (a) Spiked glucose biosensor calibration before and after operation within long-
term culture. Error bars are s.d. (b) Lactate biosensor calibration before and after operation within long-term culture. Error bars are s.d. (c) Glucose
and (d) lactate signal simultaneously recorded during microfluidic operation (stop 10 min/flow 30 min). (e) Glucose uptake and (f) lactate
production during long-term culture and their change upon addition of 100 μM antimycin A.
electrode without embedded enzyme, in order to subtract secretion, both analytes were always present and converted
unspecific background signals. The developed biosensors by the enzyme membranes. This resulted in a H2O2
showed a highly linear, reversible and selective behaviour accumulation over the sensor electrodes and a signal increase
within the physiological range. The limit of detection was 7.6 during stop phases. Biosensors were placed outside the cell
μM (±3.7 μM, n = 3) in case of glucose and 6.1 μM (±4.2 μM, compartments downstream the microchannel in order to
n = 3) for lactate sensors. Sensitivity, limit of detection and prevent H2O2 diffusion into the inner volume of the platform.
linear range can be adjusted for the desired application by At the beginning of a flow phase, the consumed medium was
varying the height of the diffusion-limiting membrane within removed from the culture volume and passed over the sensor.
the membrane stack. An individual calibration was As glucose was metabolized by the cells, a signal drop relative
performed prior and after each experiment. Drift correction to the background was detected, and its uptake was
was performed under the assumption of linear sensitivity quantified by subtraction of both signal values. In case of
decay for long-term measurement evaluation. lactate, a distinct signal peak appeared at the initiation of
Fig. 7c and d shows typical biosensor signals during perfusion. Both glucose consumption and lactate secretion
spheroid cultivation. Due to the high glucose background increased with rising cell density and decreased again after
concentration in MSC medium and the cellular lactate the addition of a lethal dose of antimycin A. Compared to the
236 | Lab Chip, 2022, 22, 225–239 This journal is © The Royal Society of Chemistry 2022You can also read