Mito-QC illuminates mitophagy and mitochondrial architecture in vivo
←
→
Page content transcription
If your browser does not render page correctly, please read the page content below
Published Online: 25 July, 2016 | Supp Info: http://doi.org/10.1083/jcb.201603039 JCB: Tools
Article
Downloaded from jcb.rupress.org on August 29, 2018
mito-QC illuminates mitophagy and mitochondrial
architecture in vivo
Thomas G. McWilliams,1 Alan R. Prescott,2,3 George F.G. Allen,1 Jevgenia Tamjar,1 Michael J. Munson,1
Calum Thomson,3 Miratul M.K. Muqit,1,4 and Ian G. Ganley1
1MedicalResearch Council Protein Phosphorylation and Ubiquitylation Unit, 2Division of Cell Signalling and Immunology, 3Dundee Imaging Facility, School of Life Sciences,
and 4School of Medicine, University of Dundee, Dundee DD1 9SY, Scotland, UK
Autophagic turnover of mitochondria, termed mitophagy, is proposed to be an essential quality-control (QC) mechanism
of pathophysiological relevance in mammals. However, if and how mitophagy proceeds within specific cellular subtypes
in vivo remains unclear, largely because of a lack of tractable tools and models. To address this, we have developed
“mito-QC,” a transgenic mouse with a pH-sensitive fluorescent mitochondrial signal. This allows the assessment of mito-
phagy and mitochondrial architecture in vivo. Using confocal microscopy, we demonstrate that mito-QC is compatible
THE JOURNAL OF CELL BIOLOGY
with classical and contemporary techniques in histochemistry and allows unambiguous in vivo detection of mitophagy
and mitochondrial morphology at single-cell resolution within multiple organ systems. Strikingly, our model uncovers
highly enriched and differential zones of mitophagy in the developing heart and within specific cells of the adult kidney.
mito-QC is an experimentally advantageous tool of broad relevance to cell biology researchers within both discov-
ery-based and translational research communities.
Introduction
Damaged mitochondria have a deleterious impact on cellular provides rigorous detection of mitophagy. However, this is time
metabolism, promote the production of reactive oxygen spe- consuming and requires an expert eye for accurate quantifica-
cies, and ultimately trigger apoptosis (Nunnari and Suoma- tion, and it is often challenging to identify specific cell types
lainen, 2012; Wang and Hekimi, 2015). Removal of such with confidence in heterogeneous tissues.
mitochondria is therefore essential to prevent cellular dys- (2) Measuring lysosomal-sensitive loss of mitochon-
function, and this is believed to occur primarily through au- drial proteins biochemically (e.g., immunoblotting or citrate
tophagy. Mitochondrial autophagy or mitophagy, involves the synthase activity assay). This approach cannot distinguish
sensing, sequestration, and trafficking of damaged mitochon- between different cell types within a tissue, and the low sen-
dria to the lysosome for degradation. Over the past decade, a sitivity of currently available biochemical methods relies
complex picture of mitophagy has emerged, revealing mul- upon a high degree of mitophagy for accurate measurement.
tiple signaling pathways and routes by which mitochondria Additionally, lysosomal inhibitors required for these assays
can be delivered to lysosomes (Youle and Narendra, 2011; can have secondary effects and are not well tolerated in ani-
Wei et al., 2015; Yoshii and Mizushima, 2015). These discov- mals for in vivo studies.
eries have relied on the induction of mitophagy by treating (3) Immunofluorescence-based colocalization of mi-
cultured cell lines with cytotoxic mitochondrial uncoupling or tochondria with autophagosomes or lysosomes. This cannot
damaging agents. Although informative for molecular studies accurately distinguish between autophagy and mitophagy, as
of stress-induced mitophagy in vitro, it has been difficult to general nonspecific autophagosomes likely form at mitochon-
reconcile analogous physiological scenarios under which such dria (Hailey et al., 2010; Hamasaki et al., 2013). In addition,
mitophagy pathways may operate in vivo. As a result, there sensitive and specific antibody staining is needed, as well as
exists a paucity of data on the physiological relevance and na- careful tissue processing to preserve epitopes yet allow tissue
ture of vertebrate mitophagy. penetration of antibodies.
Current methods to visualize mitochondrial turnover in (4) Ratiometric fluorescence probes. mt-Keima is a
mammalian tissues include the following: pH-sensitive fluorescent protein targeted to the mitochondrial
(1) Electron microscopy. This method visualizes mito- matrix that has been successfully used to study mitophagy in
chondria surrounded by autophagic/lysosomal membranes and vitro (Katayama et al., 2011; Bingol et al., 2014). Recently, Sun
Correspondence to Ian G. Ganley: i.ganley@dundee.ac.uk
© 2016 McWilliams et al. This article is distributed under the terms of an Attribution–
Abbreviations used: AR, antigen retrieval; DCT, distal convoluted tubule; E, Noncommercial–Share Alike–No Mirror Sites license for the first six months after the
embryonic day; MEF, mouse embryonic fibroblast; OMM, outer mitochondrial publication date (see http://www.rupress.org/terms). After six months it is available under a
membrane; PCT, proximal convoluted tubule; QC, quality control; RMCE, recom- Creative Commons License (Attribution–Noncommercial–Share Alike 3.0 Unported license,
bination-mediated cassette exchange; WT, wild type. as described at http://creativecommons.org/licenses/by-nc-sa/3.0/).
The Rockefeller University Press $30.00
J. Cell Biol. Vol. 214 No. 3 333–345
www.jcb.org/cgi/doi/10.1083/jcb.201603039 JCB 333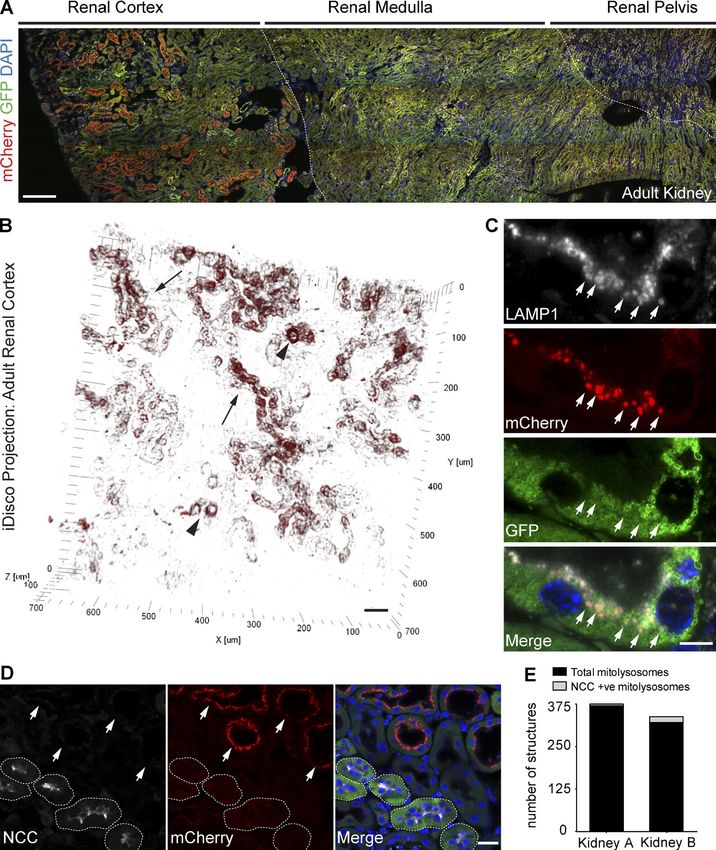
Figure 1. Generation of the mito-QC mouse
                                                                                               and detection of mitophagy and mitochondrial
                                                                                               architecture in vivo. (A) Schematic of gene tar-
                                                                                               geting strategy used to generate the mito-QC
                                                                                               mouse model. (B) Representative anti-GFP im-
                                                                                               munoblot showing expression of the reporter
                                                                                               construct in different tissues from heterozygous
                                                                                               reporter mice (designated A, B, and C). Pon-
                                                                                               ceau is shown to indicate protein loading. (C)
                                                                                               Sections of adult heart isolated from mito-QC
                                                                                               littermate mice. Images depict representative
                                                                                               heart sections from animals with and without
                                                                                               indicated copies of the reporter construct.
                                                                                               DAPI nuclear stain shown in blue. Bar, 20 µm.
                                                                                               (D) Images of mito-QC heart tissue sections im-
                                                                                               munolabeled with antibodies to the mitochon-
                                                                                               drial marker, TOM20. Bar, 5 µm. (E) mito-QC
                                                                                               heart tissue sections immunolabeled with
                                                                                               antibodies to the lysosomal marker LAMP1.
                                                                                               Bar, 5 µm. Arrowheads indicate examples of
                                                                                               LAMP1/mCherry-only (GFP-negative) colocal-
                                                                                               ization. (F) Quantification of mCherry-positive
                                                                                               mitolysosomes in heart sections obtained from
                                                                                               homozygous mito-QC adult littermate mice
                                                                                               (n = 4 mice). (G) Quantification of mean mito-
                                                                                               lysosome size between mito-QC adult litter-
                                                                                               mate mice (n = 4 mice). (H) Quantitation of
                                                                                               mean cardiac mitolysosome area in mito-QC
                                                                                               adult littermate mice (n = 4 mice). Error bars in
                                                                                               F–H depict standard deviation.

      et al. (2015) described the mt-Keima mouse, based on the same     stable, but GFP fluorescence becomes quenched by the
      precept. Although Sun et al. (2015) reported the occurrence of    acidic microenvironment. This results in the appearance of
      basal mitophagy in tissue sections, the utility of mt-Keima in    punctate mCherry-only foci that can be easily quantified as
      tissues has considerable limitations. The Keima protein is in-    an index of cellular mitophagy. Therefore, to address the
      compatible with fixation and can also exhibit spectral overlap.   challenge of resolving mitochondrial network architecture
      Thus, it is infeasible to investigate mitophagy with precision    and mitophagy in vivo, we have exploited this end-point
      and resolve mitochondrial morphology within immunochemi-          assay approach by generating a transgenic mouse model,
      cally labeled cellular subtypes in vivo.                          which we have called mito-QC, to highlight its use in mon-
             To circumvent these problems, we took advantage of         itoring mitochondrial quality control (Fig. 1 A). Given the
      a binary-based fluorescence assay previously developed            essential energy-generating function of mitochondria, we
      in our laboratory (Allen et al., 2013). This assay is based       chose to use mito-QC to investigate mitochondrial turnover
      on the expression of a functionally inert, tandem mCherry-        and organization in a range of metabolically demanding tis-
      GFP tag fused to the mitochondrial targeting sequence of          sues. In the data presented, we reveal striking and hitherto
      the outer mitochondrial membrane (OMM) protein, FIS1              unknown incidences of mitophagy in both the developing
      (comprising amino acids 101–152). Under steady-state              and mature heart and kidney. Additionally, we demonstrate
      conditions, the mitochondrial network fluoresces both red         its use as a tool to reveal the diversity of mitochondrial or-
      and green; however, upon mitophagy, mitochondria are de-          ganization in specific subsets of cells within tissues of vital
      livered to lysosomes where mCherry fluorescence remains           metabolic importance to mammals.

334   JCB • Volume 214 • Number 3 • 2016
Results                                                                    To assess if we could observe mitochondrial turnover and
                                                                    architecture in vivo, we examined tissue sections obtained from
Generation of a reporter mouse to                                   WT, heterozygous, and homozygous mito-QC littermate mice.
visualize mitochondrial turnover and                                As the intimate relationship between mitochondrial and cardiac
architecture in vivo                                                function is well established (Dorn et al., 2015), we inspected
We exploited our previously published mitophagy assay to gen-       cryosections of adult heart using conventional laser-scanning
erate a transgenic reporter mouse (Allen et al., 2013). Targeted    confocal microscopy. Although WT littermates exhibited no
transgenesis was used to create mito-QC through constitutive        discernable GFP or mCherry signal, the architecture of the car-
knockin of mCherry-GFP-FIS1101-152 (mito-QC) in the mouse           diac mitochondrial network was clearly visible in heart sections
Rosa26 locus in the C57BL/6 background (Fig. 1 A). Expres-          derived from littermate mice positive for the mito-QC reporter
sion from the Rosa26 locus enables the ubiquitous spatiotem-        construct (Fig. 1 C). Moreover, mCherry-only (GFP-negative)
poral expression of our construct in all mammalian tissues          puncta were visible in reporter heart sections, indicating the
(Soriano, 1999). Heterozygous and homozygous mito-QC mice           presence of degraded mitochondria in lysosomes. Although the
appear healthy, and offspring are produced in accordance with       fluorescence signal was greater in homozygous reporter mice
expected Mendelian ratios, implying that the reporter knockin       than in their heterozygous siblings, the endogenous heterozy-
does not perturb mitochondrial function. In support of this, we     gous signal was sufficient to observe both individual mitochon-
found no differences in oxygen consumption between isolated         drial architecture and mCherry-only puncta using conventional
wild-type (WT) versus heterozygous embryonic fibroblasts or         confocal microscopy (Fig. 1 C). Considerable validation of this
WT versus heterozygous versus homozygous adult fibroblasts          probe has been conducted in our previous cell-based study, yet
(Fig. S1, A and B). Additionally, mitochondrial morphology          we still sought to verify the mitochondrial and lysosomal signals
and dynamics appeared identical in wild type and littermate         in the reporter mice. To confirm the mitochondrial origin of the
primary mouse embryonic fibroblasts (MEFs) as visualized by         mCherry and GFP signals, we performed immunohistochemical
MitoTracker staining (Video 1). As a first step in validation, we   labeling of reporter heart sections with antibodies to the OMM
confirmed that mitophagy could be induced in primary MEFs           protein, TOM20. Immunolabeling revealed near-identical over-
derived from mito-QC reporter embryos. In agreement with            lap with the pattern of the outer membrane reporter, verifying
our previous study in reporter cell lines (Allen et al., 2013),     the mitochondrial localization of our reporter signal along with
we found that treatment with deferiprone, an iron chelator and      the characteristic morphology of cardiomyocyte mitochondria
potent mitophagy inducer, resulted in a sixfold increase in mi-     (Fig. 1 D). The mitochondrial localization of mito-QC relies
tophagy over control cells, confirming that the assay is behav-     on the targeting sequence of FIS1; however, FIS1 has been re-
ing as expected at the cellular level (Fig. S1, C and D). Also      ported to also localize to peroxisomes (Koch et al., 2005). Thus,
in agreement with our earlier study, immunofluorescence and         we assessed if mito-QC might also label peroxisomes. Immu-
immunoblotting assays revealed that stimulation of nonspecific      nohistochemical and immunocytochemical analyses using
autophagy, through inhibition of mTOR with the highly specific      the peroxisomal marker anti-PMP70 revealed peroxisomes in
compound AZD8055 (in combination with bafilomycin A1 for            close proximity to mitochondria. However, peroxisomal label-
biochemical experiments; Chresta et al., 2010), did not stim-       ing displayed a distinct pattern to that of mitochondria in both
ulate mitophagy, confirming the selective nature of our assay       mito-QC heart sections and isolated primary MEFs, demon-
for mitophagy, but not general autophagy (Fig. S1, C and D).        strating the selective labeling of mito-QC for mitochondria (Fig.
We were also able to show that primary WT and heterozygous          S2, A and B). To validate that the mCherry-only puncta are in
MEFs displayed no significant difference in citrate synthase ac-    fact mitolysosomes, i.e., degraded mitochondrial components
tivity, a biochemical measurement of mitochondrial mass, either     within lysosomes, we performed immunolabeling with anti-
under basal or mitophagy stimulated conditions (Fig. S1 E).         bodies to the lysosomal marker protein LAMP1. Quantitation
       Next, we analyzed expression of the reporter in heart,       of LAMP1 and mCherry-only signal revealed a 96% overlap
skeletal muscle, and liver by Western blot (Fig. 1 B). Using        in signals (Fig. 1, E and F). Almost all mCherry-only puncta
tissues isolated from three adult reporter mice, we detected        are resident in LAMP1-positive lysosomes, yet analyses using
a band corresponding to the predicted size of full-length           our model also revealed that approximately one third of the
mito-QC. Importantly, the expression of the reporter in each        LAMP1-positive network in the mammalian adult heart con-
tissue is consistent between individual mice; however, we           tains remnants of the degraded mitochondrial network (Fig. 1,
noted some variation in mito-QC transgene expression be-            E and F). Similarly, we were also able to detect LC3 colocal-
tween tissues. Although the mitochondrial content of the tissue     ization with mCherry-only puncta, further confirming that these
may account for this, we cannot exclude variations in trans-        structures are autolysosomal in nature (Fig. S2 C). Additionally,
gene expression from the Rosa26 locus. Regardless, only one         levels of cardiomitophagy were comparable across multiple an-
major band is detected, indicating that mito-QC is stable and       imals, as were the size of mitolysosomes (Fig. 1 G and H).
not subject to any overt cleavage. Intriguingly, a minor band              To further verify that mito-QC was selectively labeling
corresponding to the size of free GFP was detected in skeletal      mitochondria in vivo, we performed ultrastructural analyses
muscle tissue. This may provide a readout of mitophagy, as the      of mito-QC tissues using cryo immunogold transmission EM.
cleavage and lysosomal accumulation of GFP from GFP-tagged          Immunolabeling of ultrathin heart tissue cryosections with
autophagosomal cargo proteins has been used as evidence for         gold-conjugated anti-GFP antibodies revealed a clear (90%)
autophagy (Klionsky et al., 2016). In support of this, we have      overlap of the label with mitochondria (Fig. S3, A and B). Thus,
found skeletal muscle to have a high rate of mitophagy, based       data from both light and electron microscopy studies demon-
on mito-QC fluorescence (see the following section); however,       strate the exclusivity of the mito-QC signal for mitochondria in
further work is needed to confirm if the free GFP observed by       vivo. Although our cryolabeling methods successfully revealed
Western blot is indeed a robust indication of mitophagy.            GFP labeling with a high signal to noise ratio in reporter tissue

                                                                        mito-QC illuminates mitophagy in vivo • McWilliams et al.       335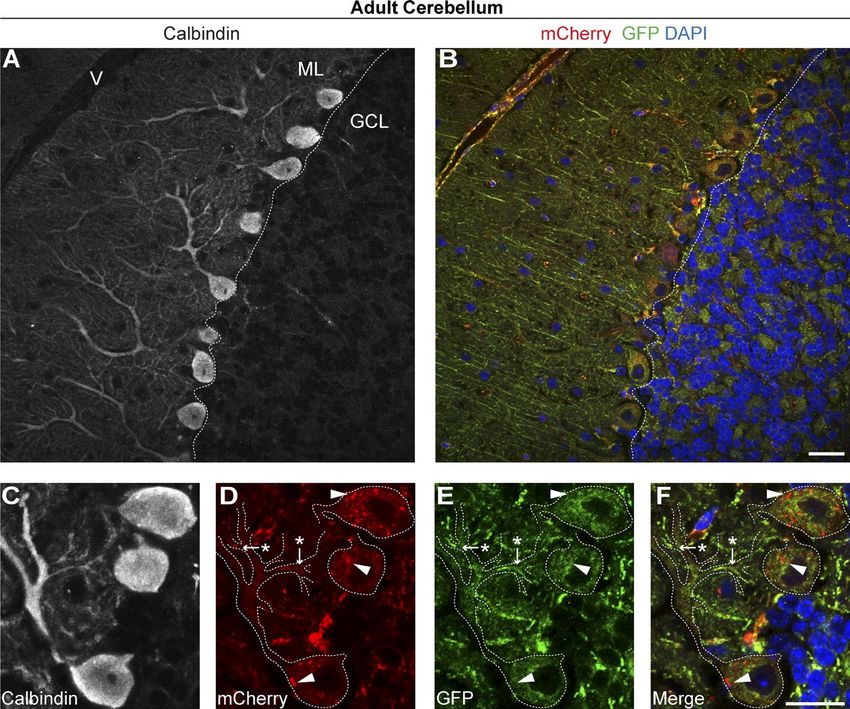
samples, it did not preserve membrane architecture sufficiently           In addition to mitophagy, mito-QC also allowed assess-
      to unambiguously detect gold-labeled mitochondria in autopha-       ment of the mitochondrial network and revealed interesting
      gosomes. Nonetheless, presumptive mitophagosomes identified         differences in the organization of cardiac mitochondria, both
      in heart EM cryosections compared well to mitophagosomes            within the same heart at E17.5 and when comparing this stage
      identified using conventional resin-embedded transmission EM,       to the adult heart (Fig. 3). High-resolution Airyscan confocal
      which afforded superior membrane preservation (compare the          imaging of E17.5 heart tissue revealed that the mitochondrial
      top and bottom panels in Fig. S3 C). Further EM examples of         network of cells within mitophagic zones was disordered and
      cardiac mitochondria engulfed by the characteristic autophagic      greatly reduced in mass. Conversely, cells with reduced mito-
      double lipid bilayer are shown in Fig. S4 (B and C). Importantly,   phagy exhibited highly organized mitochondria and a greater
      comparative assessment of heart resin-embedded sections from        overall level of mitochondrial content (Fig. 3, A–C). We ex-
      WT and reporter littermates revealed no apparent differences        tended this comparative analysis to adult ventricular heart tissue
      in mitochondrial morphology by transmission EM (Fig. S4 A).         and observed a highly ordered and stereotypical arrangement of
      This demonstrates that the genetically encoded OMM tag has          individual mitochondria in defined chain-like networks along
      no deleterious effects on mitochondrial morphology in vivo.         the muscle fibers (Fig. 3 D). Most adult cardiomyocytes ex-
      Collectively, our converging analyses demonstrate the utility       hibited a robust level of turnover, with no discernable reduc-
      of the mito-QC model to reveal mitochondrial architecture and       tion in mitochondrial mass or spatial restriction of mitophagic
      mitophagy in vivo. Furthermore, mito-QC demonstrates mito-          cells as we observed in the embryonic heart. For comparison,
      phagy to be a constitutive process in the mature heart under        we also examined sections of adult skeletal muscle and the
      steady-state conditions in mammals.                                 tongue. In skeletal muscle, we observed mitophagy to occur at
                                                                          a similar level to cardiac muscle (Fig. 3 E). Recently, a mito-
      Developmental cardiomitophagy and                                   chondrial reticulum has been described here, and distinct types
      diverse mitochondrial morphology revealed                           of mitochondria have been demonstrated with the aid of EM
      by mito-QC                                                          tomography (FIS-SIM [Glancy et al., 2015]). With mito-QC
      Mitophagy is clearly evident in the adult mouse heart, but less     and conventional confocal microscopy, we were able to clearly
      is known about mitochondrial turnover and the organization of       observe these distinct structures. The mammalian tongue is a
      mitochondrial networks during cardiac development. There-           metabolically demanding muscular and gustatory organ, often
      fore, we sought to exploit mito-QC to investigate mitophagy         affected in a variety of congenital and acquired disease states
      during embryonic development, shortly after cardiomyocytes          (Kutuzov and Sicher, 1953; Rajendran and Sivapathasundha-
      become defined. Fig. 2 shows micrographs of the heart at em-        ram, 2009). Owing to its unique anatomy, histological tongue
      bryonic day 14.5 (E14.5; Fig. 2 A), E17.5 (Fig. 2 B), and adult     preparations facilitate the visualization of adjacent longitudinal
      stages (Fig. 2 C). Investigation of mitophagy at E14.5 revealed     and transverse muscle fibers within the same section. Although
      that considerably less turnover occurs at this period in devel-     the macroanatomy of the tongue has been well established, lit-
      opment, relative to observable levels in the adult (Fig. 2, A and   tle has been reported about the cell biology of mitochondrial
      C). After E17.5, however, we observed restricted cellular zones     networks within this tissue since classical EM studies in the
      in the embryonic heart undergoing mitophagy (see arrows in          1950s (Wachstein and Meisel, 1955). Imaging of parasagittal
      Fig. 2 B), which was in contrast to the lower but uniformly         tissue sections revealed a unique organization of mitochondria
      distributed mitophagy observed in the adult heart (highlighted      within the interwoven muscle fibers of the adult tongue (Fig. 3,
      in Fig. 2, D and E). These restricted zones were stochastically     F and G). Mitochondria were densely packed along the muscle
      distributed and characterized by a dense cellularity possibly in-   fibers, and the network was both grid-like and expansive in ar-
      dicating tissue remodelling (compare DAPI staining in Fig. 2,       rangement. We were also able to detect distinct organizations of
      F and G). To gain insight into this localized mitophagy, we         sarcolemmal mitochondria along individual longitudinal mus-
      assessed if these cells were undergoing developmental apop-         cle fibers (Fig. 3 G). Interestingly, we observed a high degree
      tosis or cell proliferation. To monitor apoptosis, we performed     of mitophagy in the muscle fibers of tongue, with mCherry-
      immunohistochemistry to activated caspase-3, an established         positive mitolysosomes situated at the periphery and more medi-
      marker of dying cells. As this stage in development is beyond       ally within the tubular arrangement of fibrils. We also observed
      the defined period of active programmed cell death (Barbosky        a considerable degree of turnover at orthogonal intersections of
      et al., 2006), we observed low immunoreactivity for caspase-3       muscle (Fig. 3 G, asterisks). Although it is known that multi-
      in the heart and no overlap with cells undergoing mitophagy         nucleated regions of tongue muscle fibers are enmeshed within
      (Fig. 2 F). To determine if these cells might be dividing or cy-    dense mitochondrial networks (Sandborn, 1972), our model re-
      cling, we assayed embryonic heart sections with antibodies to       veals for the first time that this is also a major site of mammalian
      the proliferative marker, Ki67. Our findings showed a mutual        mitophagy. This localization contrasts with our observations in
      exclusion of Ki67-positive cells and mitophagic cells in the        adult cardiac and skeletal muscle, where mitochondria appear
      E17.5 heart (Fig. 2 G). Therefore, these highly mitophagic cells    to be routinely eliminated without any discernable pattern.
      appear not to be dying or proliferating, suggesting that they are
      undergoing remodelling or differentiation. Interestingly, a re-     mito-QC illuminates mitophagy in the
      cent publication has proposed that perinatal cardiomyocytes un-     nervous system
      dergo mitophagy to repopulate the network with mitochondria         We next explored the suitability of mito-QC to investigate mi-
      that are optimized for fatty acid metabolism (Gong et al., 2015).   tochondrial turnover in the vertebrate nervous system, another
      Our observations imply that this transformation may commence        region of high metabolic demand. The maintenance of mito-
      at a much earlier developmental stage. Regardless, our findings     chondrial integrity here is receiving much attention as a bur-
      clearly demonstrate that cardiomitophagy is a developmentally       geoning area of important research with respect to nervous
      regulated process in mammals.                                       system dysfunction (Carelli and Chan, 2014; Burté et al., 2015).

336   JCB • Volume 214 • Number 3 • 2016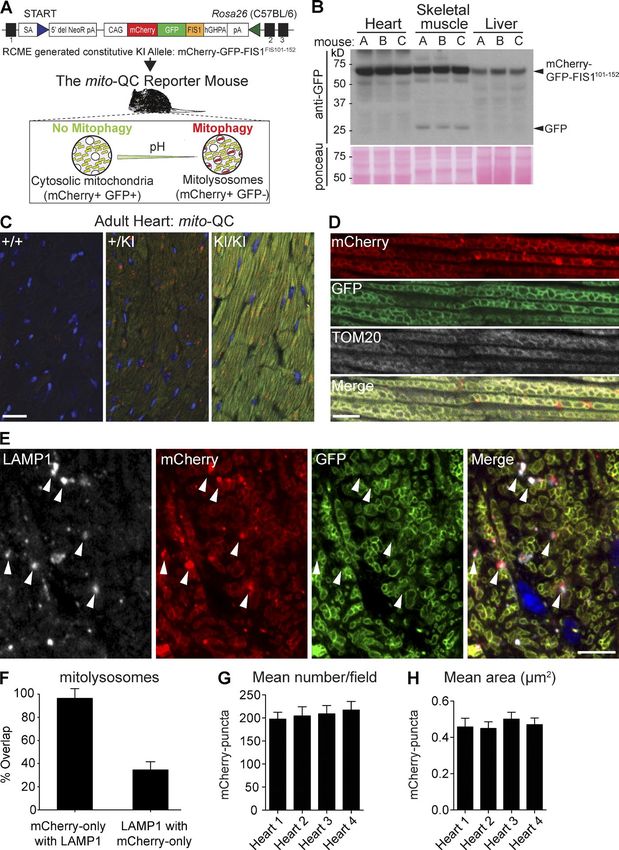
Figure 2. Differential and zonal regulation of
cardiomitophagy during development. (A–C)
Representative montage of tile-scan images
of E14.5 (A), E17.5 (B), and adult heart (C)
sections from mito-QC reporter mice. Arrow-
heads in B indicate areas of high mitophagy.
As images are to scale, and only a represen-
tative sample of adult cardiac tissue is de-
picted in C. Bars, 200 µm. (D) High resolution
Airyscan images showing a mitophagic zone
(delineated by dotted line) in the E17.5 ven-
tricle Bar, 20 µm. (E) Representative Airyscan
image of adult ventricular cardiomyocytes in
vivo. Bar, 20 µm. (F) Immunostaining of E17.5
heart sections with anti–activated caspase-3
antibodies. Dotted line highlights high mito-
phagic zone. Bar, 20 µm. (G) Immunostain-
ing of E17.5 heart sections with anti-Ki67
antibodies. Dotted line highlights high mito-
phagic zone. Bar, 20 µm.
Protruding from the rostral hindbrain, the cerebellum is specifically. At higher magnifications, we were also able to re-
recognized as one of the most experimentally amenable systems solve individual segments of the mitochondrial network within
in the mammalian CNS (Leto et al., 2015). The heterogeneity distinct neuronal compartments of Purkinje cells. In the prox-
of cell types and connections in the cerebellum makes it an imal smooth shaft of the Purkinje dendritic field, we observed
ideal region for comparative in vivo cell biology. We assessed mitochondria at the process edges. Segments of the mitochon-
parasagittal sections of adult cerebellum from mito-QC mice drial network were also observable at bifurcation points, in
(Fig. 4). We observed the most pronounced mitolysosomes in stretches of smaller dendritic arbors and in calbindin-negative
the monolayer of somata between the molecular and granule fibers of nonneural cells (Fig. 4, C–F).
cell layers, corresponding to the Purkinje cell layer. Purkinje As we could successfully detect mitochondrial turn-
cells are among the largest and most studied neurons in the adult over and architecture within a subpopulation of neurons using
CNS and are the sole output neurons of the cerebellar cortex. To conventional immunohistochemistry, we next probed the
validate our observations, we conducted immunohistochemical compatibility of mito-QC with a more contemporary immuno-
labeling with antibodies to calbindin-D28K, a classical marker histochemical approach. iDISCO is a recently reported tech-
of Purkinje neurons and their processes (Celio, 1990; Scotti, nological advance that enables volume imaging of large tissue
1995). Immunolabeling of mito-QC sections confirmed our specimens such as whole organs (Renier et al., 2014). We per-
observations that Purkinje neurons undergo pronounced mi- formed iDISCO on intact, hemisected cerebellum preparations
tochondrial turnover (Fig. 4, A and B). Further investigation from heterozygous mito-QC mice, labeled with antibodies to
revealed minimal mitophagy in calbindin-positive dendritic ar- GFP and mCherry as per the published protocol. Although we
bors or axonal projections. Rather, it appears the majority of mi- encountered difficulties in resolving individual mitolysosomes
tochondrial turnover occurs in the Purkinje somata, suggesting in the cerebellum (likely because of the required labeling and
mitochondria, or mitolysosomes, may be transported to the cell harsh clearing treatments resulting in de-quenching of the GFP
body for final degradation. These observations are highlighted signal), we were able to visualize the spatial disposition of
in Fig. S5 (A and B), which shows Purkinje mitochondria the mitochondrial network along neural projections, giving a
mito-QC illuminates mitophagy in vivo • McWilliams et al. 337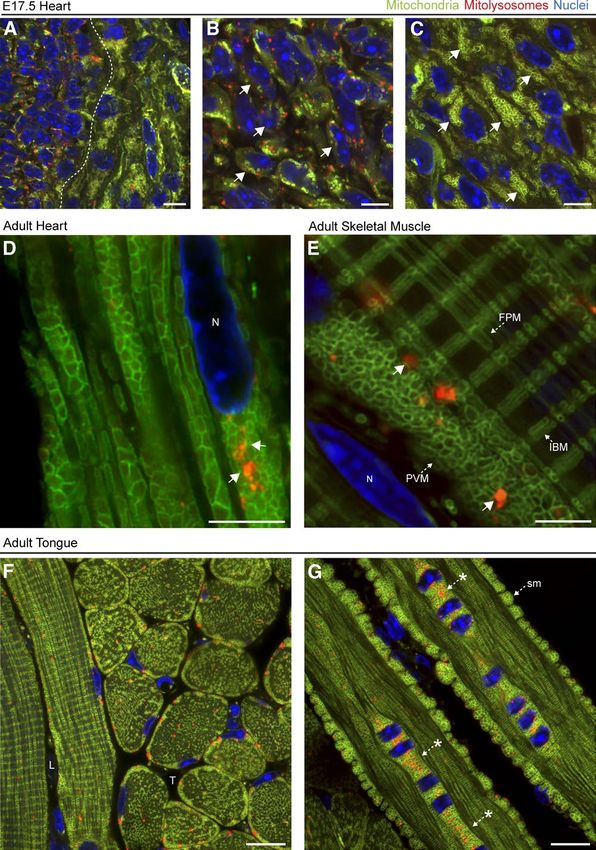
labeling techniques, making it possible to investigate mitochon-
drial turnover and architecture within specific cell types in vivo
with precision. We next explored if the model was amenable
to quantitation and if this could be used to predict differences
in the basal rates of mitophagy in vivo. We selected a range
of typical organs used in routine pathological analysis and per-
formed semiautomated quantitation on confocal photomicro-
graphs from tissue sections (Fig. 5). It is important to note that
our model facilitates a variety of analyses, depending on the
research question of interest. Earlier, we demonstrated that lev-
els of cardiomitophagy were consistent between different adult
reporter animals (Fig. 1, F and G). Thus, we sought to compare
global levels of steady-state mitophagy, as a proof-of-principle
for our model. As described in Materials and methods, we de-
vised a simple algorithm to quantify mitophagy by automated
analysis. We specified mCherry-only mitolysosomes as unique
objects and used the GFP signal to define the area of the tissue
to be analyzed. In combination with sufficient fields and bio-
logical replicates as well as blinded analysis, we found it was
possible to assay in vivo mitophagy in a generalized manner.
Our results show that mitophagy occurs to a similar degree in
heart and skeletal muscle, but to a lesser degree in the spleen
(Fig. 5 D). Interestingly, we observed the highest levels of mi-
tophagy in hepatic and renal tissue. A caveat of our example
analysis is that no consideration is given to the identity of spe-
cific cell types within the tissues analyzed; however, given the
compatibility of our model with immunohistochemistry (see
examples in Fig. 1, D and E; Fig. 2, F and G; Fig. 4; and Fig. 6,
C and D), quantitative analysis of mitophagy within cellular
subpopulations is clearly possible.
The kidneys are a major site of mitophagy
Figure 3. Comparative overview of mitochondrial networks in devel- in mammals
oping and adult muscle tissues in vivo. (A–C) High-resolution Airyscan As we observed pronounced mitochondrial turnover in the
images of E17.5 heart. Dotted line indicates division between high and
kidneys using our generalized screen, we performed a com-
low mitophagic regions. Magnified photomicrographs of mitochondrial
architecture in regions with high and low degrees of mitophagy are prehensive analysis of renal mitophagy using the mito-QC
shown in B and C, respectively. Arrows highlight the differential organi- mouse model. The kidneys are an important excretory organ
zation of mitochondrial networks within cells of the same tissue. (D) High- and regulate vital functions such as water homeostasis, acid–
magnification Airyscan image of adult mito-QC heart, depicting the mito- base and electrolytic balance, arterial pressure, hormone me-
chondrial architecture and the position of mitolysosomes (arrows) within
ventricular cardiomyocytes in vivo. N, Nucleus. (E) High-magnification
tabolism, and gluconeogenesis (Fougeray and Pallet, 2015).
Airyscan image of a mitochondrial network depicting mitolysosomes and This indispensable contribution to the maintenance of normal
aspects of the recently described mitochondrial reticulum within adult skel- physiology makes the renal system a site of high metabolic
etal muscle. Arrows indicate different muscle mitochondrial morphologies. demand in mammals. The nephron has been suggested as a
FPM, fiber parallel mitochondria; PVM, paraventricular mitochondria; IBM,
clinically relevant site of mitochondrial turnover in mammals,
I-band mitochondria. Bars, 5 µm. (F and G) Representative images from
parasagittal sections of adult tongue from a mito-QC reporter mouse. Bars, yet experimental evidence for this has been lacking because
10 µm. (F) Image shows transverse (T) and longitudinal (L) fibrils containing of an absence of robust tools to demonstrate this (Higgins
mitochondrial networks and mitolysosomes. (G) Image of a longitudinal and Coughlan, 2014; Eirin et al., 2015). Conveniently, as
tongue muscle fiber with sarcolemmal (sm) mitochondria at the periphery with other tissues, we observed that the OMM localization
of the fiber and a cluster of mitolysosomes at a multinucleated orthogonal
intersection (asterisks). DAPI is shown in blue throughout. of mito-QC in the kidneys facilitated identification of major
anatomical landmarks using standard fluorescence micros-
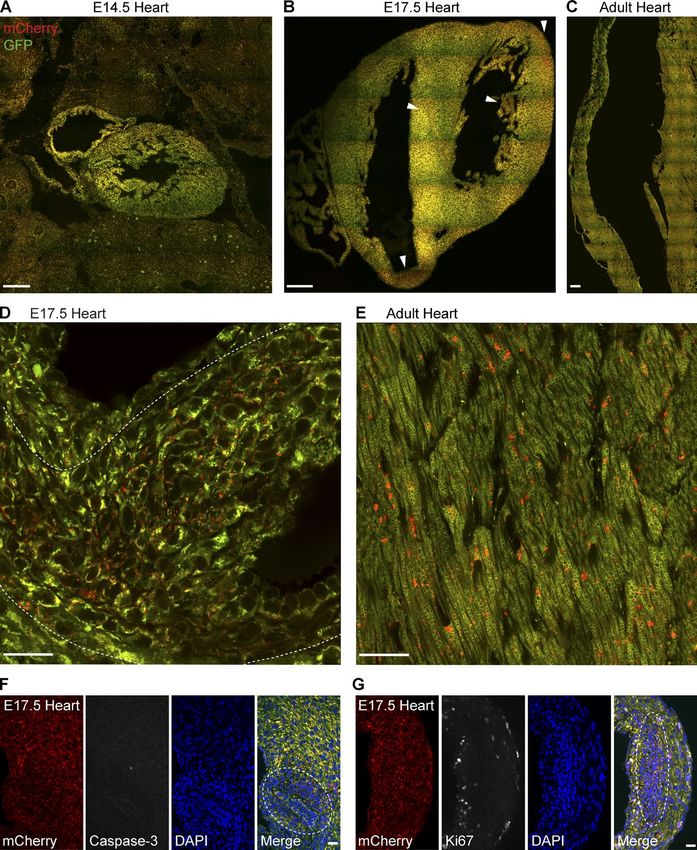
copy. We observed a striking pattern of mitophagy across the
powerful overview of the mitochondrial network at the regional adult kidney (Fig. 6 A), with the most pronounced mitochon-
level (Fig. S5 C and Video 2). Collectively, we predict that the drial turnover in tubules of the renal cortex (Fig. 6, A and B).
mito-QC mouse holds significant potential to reveal insights Moreover, mitolysosomes displayed a distinct coronal-like
about mitochondrial network biology under various pathophys- and apical positioning within these tubule cross sections. To
iological conditions in the vertebrate nervous system in vivo. visualize the spatial disposition of mitochondrial turnover
within the adult kidney at a whole-tissue level, we used an
mito-QC as a tractable tool to quantitate adapted version of the previously mentioned iDISCO method.
mitophagy in vivo By simply using the optical clearing steps of iDISCO, without
A major limitation of current models is their incompatibil- antibody labeling, on fixed whole-kidney specimens combined
ity with routine immunohistochemical approaches. We have with multiphoton confocal microscopy, we observed that mi-
demonstrated that mito-QC is fully compatible with a variety of tophagy in the adult kidney is spatially restricted to particular
338 JCB • Volume 214 • Number 3 • 2016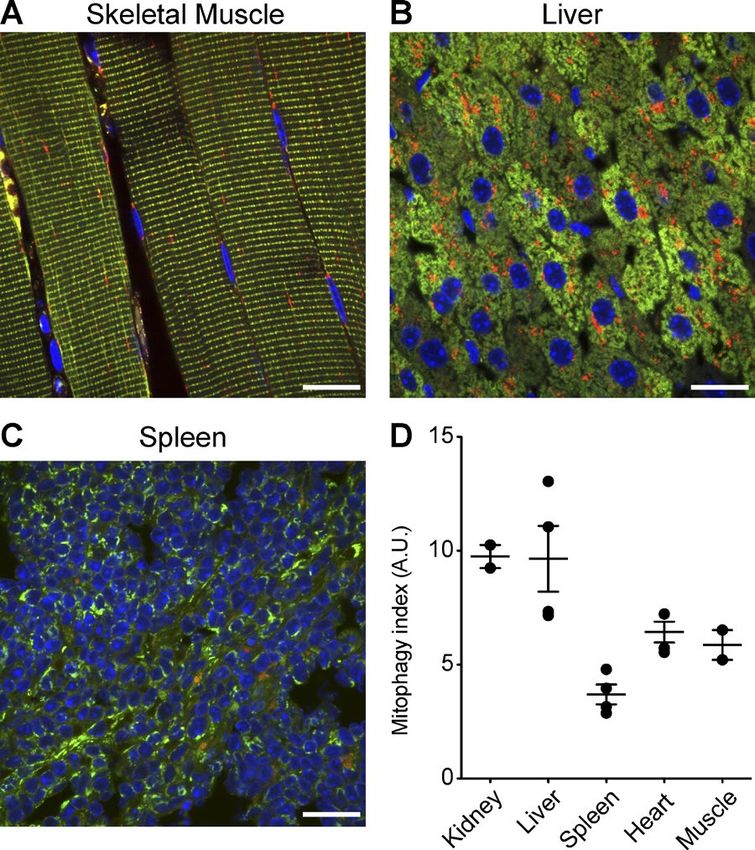
Figure 4. Mitophagy and mitochondrial
                                                                                                       architecture in defined subsets of cerebellar
                                                                                                       neurons. (A) Representative images from a
                                                                                                       parasagittal section of adult cerebellum from
                                                                                                       mito-QC reporter mouse, labeled with anti-
                                                                                                       bodies to the Purkinje neuron marker calbin-
                                                                                                       din-D28K. ML, molecular layer; GCL, granule
                                                                                                       cell layer; V, vasculature. (B) Reporter signal
                                                                                                       in same immunolabeled region as A, with
                                                                                                       DAPI shown in blue. (C–F) Magnified view of
                                                                                                       a calbindin-positive Purkinje neuron in the cer-
                                                                                                       ebellum, with panels showing calbindin (C),
                                                                                                       mCherry (D), GFP (E), and merge (with DAPI;
                                                                                                       F). Dashed lines demarcate calbindin-positive
                                                                                                       neuronal processes, whereas arrows/asterisks
                                                                                                       highlight mitochondria (mCherry- and GFP-
                                                                                                       positive) situated at dendritic bifurcation points
                                                                                                       and arrowheads highlight examples of mitoph-
                                                                                                       agy (mCherry only) in the soma. Bars, 20 µm.

cortical tubule segments of varying length from under 50 µm                     only puncta in cortical tubules colocalized with LAMP1
to over 300 µm (Fig. 6 B and Video 3). To verify the lysosomal                  staining, revealing the rich apical endolysosomal network
nature of these puncta, we performed immunohistochemical                        characteristic of tubular cells of the nephron (Fig. 6 C). The
labeling with antibodies to LAMP1. As expected, mCherry-                        histological profile of these distinct and highly mitophagic tu-
                                                                                bules, including their diameter, cuboidal morphology, and ex-
                                                                                tensive brush borders, suggested they are proximal convoluted
                                                                                tubules (PCTs). To rule out the morphologically similar distal
                                                                                convoluted tubules (DCTs), we labeled mito-QC kidney sec-
                                                                                tions with an antibody to the sodium-chloride cotransporter
                                                                                NCC, whose expression is restricted to the early segments
                                                                                of the DCT (Subramanya and Ellison, 2014). NCC-posi-
                                                                                tive distal tubules exhibited minimal mitochondrial turnover,
                                                                                strongly supporting the notion of the PCTs being highly mi-
                                                                                tophagic (Fig. 6 D). Semiquantitative analysis of mitophagy
                                                                                within cortical tubules confirmed the highly polarized nature
                                                                                of this mitochondrial turnover in vivo (Fig. 6 E). Our high-
                                                                                resolution imaging of renal cortex also revealed the elaborate
                                                                                GFP-positive mitochondrial networks characteristic of renal
                                                                                tubules. Although PCT and DCT cells are densely packed
                                                                                with mitochondria, our reporter staining revealed higher mi-
                                                                                tochondrial content in DCTs. This is in good agreement with
                                                                                previous work, further validating our model (Dørup, 1985).
                                                                                Our observations also dispel the notion that the degree of mi-
                                                                                tophagy is proportional to the mitochondrial mass of a cell, at
                                                                                least in the context of PCT and DCT mitophagy.

                                                                                Spatiotemporal regulation of mitochondrial
                                                                                turnover in the mammalian kidney
                                                                                Given our observations of mitophagy in the adult kidney, we
Figure 5. Tissue-wide quantitation of mitophagy in vivo. Representative         next investigated the kidney at an earlier stage of development
images of skeletal muscle (A), liver (B), and spleen (C) used to perform gen-   to perform a comparative assessment. Urine production in the
eralized analysis of mammalian mitophagy across selected tissues in vivo.
(D) Scatterplot depicting the mean relative level of global mitophagy in
                                                                                mouse kidney begins during late gestation at E16.5 (Airik and
different organs in vivo, where each data point represents an organ from        Kispert, 2007), and thus, we investigated sections obtained
an individual animal and error bars represent standard error. Bars, 20 µm.      from E17.5 reporter mouse kidneys. In contrast to the adult,

                                                                                    mito-QC illuminates mitophagy in vivo • McWilliams et al.               339
Figure 6. The renal tubules are a major site of mammalian mitophagy in vivo. (A) Tile scan showing parasagittal view of a representative adult kidney
section from a mito-QC reporter mouse. Dashed lines demarcate macro-anatomical regions of the kidney, (lateral-medial from left-right). Bar, 200 µm.
(B) 3D projection showing the spatial distribution of mitolysosomes within renal cortical tubules in vivo. Image acquired using iDISCO from an intact,
cleared, and nonimmunolabeled mito-QC adult kidney with multiphoton microscopy. Arrows depict long stretches of cortical tubules with mitophagy,
whereas arrowheads depict more restricted zones of mitophagy within tubules. Bar, 50 µm. (C) Representative Airyscan images from LAMP1 immunos-
tained adult mito-QC kidney sections. Arrows highlight lysosomes containing degraded mitochondria. Bar, 5 µm. (D) Image showing adult mito-QC kidney
sections immunolabeled with antibodies to the DCT marker, NCC. NCC-positive DCTs are demarcated by dashed lines, whereas arrows highlight NCC-
immunonegative PCTs exhibiting pronounced apical mitophagy. DAPI is shown in blue. Bar, 20 µm. (E) Sample semiquantitative analysis of mitophagy in
renal cortical tubules of mito-QC adult littermate kidneys. Data represent mean number of total and NCC-positive mitolysosomes, generated from a single
kidney from two individual animals, with 15 fields analyzed per animal. Data from these kidneys were also used for Fig. 5 D.
mitophagy in the E17.5 cortical tubular system occurs at a much data). These data demonstrate that renal mitophagy is spatially
lower rate (compare Fig. 6 A with Fig. 7, A–C). Additionally, regulated, in a developmentally-dependent fashion.
we observe an increased level of mCherry-only puncta in em-
bryonic glomeruli rather than in the cortical tubules. This is in
stark contrast to renal mitophagy in the adult, where cortical tu- Discussion
bules exhibit a greater degree of mitophagy compared with their
associated glomeruli (Fig. 7 D). We also assessed the early kid- Using mito-QC to reveal mitochondrial cell
ney in cryosections from E14.5 reporter embryos but were un- biology in vivo
able to detect any robust level of mitophagy that resembled our We sought to demonstrate the potential of mito-QC as an un-
observations in the late-embryonic or adult kidney (unpublished rivalled tool to simultaneously resolve mitochondrial turnover
340 JCB • Volume 214 • Number 3 • 2016Figure 7. Spatiotemporal regulation of renal mitophagy. (A) Tile scan showing a parasagittal view of a representative embryonic kidney from an E17.5
mito-QC reporter embryo. Dashed lines demarcate macroanatomical regions of the kidney. Bar, 200 µm. (B and C) Representative image of renal cortex
from sections of E17.5 and adult kidney. G, glomerulus; T, tubule. Magnified view of glomeruli from (D) embryonic and (E) adult kidney. Bars, 20 µm.
and network architecture within specific cellular subsets in on tissue fixation, it is therefore infeasible to simultaneously
vivo. Even so, using this model, we have uncovered previously detect mitophagy in immunolabeled cellular populations of in-
unknown biology pertaining to mitophagy and mitochondrial terest in tissues derived from the mt-Keima model. In terms of
organization in different organ systems, at different stages of identifying specific cell populations within tissues, this draw-
mammalian life. Our findings pave the way for future studies to back restricts researchers to making regional assumptions that
build on their mechanistic and physiological significance. Our rely on classic anatomical landmarks, many of which require
research using mito-QC demonstrates the spatially restricted specialist expertise to identify with confidence and are more
nature of mitophagy as a process within distinct cellular sub- open to interpretation. It is important to note that complex tis-
types. Furthermore, our findings provoke a reassessment of sues often exhibit a high degree of cellular heterogeneity and
how mitophagy is viewed as simply a protective response to variability, which is only apparent when labeled with markers
mitotoxic damage or that it only occurs in specific physiolog- for particular cellular subtypes in vivo. Although the mt-Keima
ical contexts such as reticulocyte development (Schweers et mouse is undoubtedly a powerful model, mito-QC overcomes
al., 2007; Mortensen et al., 2010; Novak et al., 2010). During these limitations and represents an unrivalled and experimen-
the preparation of this manuscript, Sun et al. (2015) published tally advantageous tool that can unequivocally resolve multiple
a mitophagy reporter mouse that expresses a mitochondrial- aspects of mitochondrial cell biology in vivo at an unprece-
matrix targeted fluorescent protein, termed mt-Keima, that has dented cellular resolution.
different fluorescent properties at acidic and neutral pH. Con- mito-QC offers researchers superior utility and flexibility
ceptually, both mito-QC and mt-Keima seem similar, as the for several experimentally demonstrable reasons: (1) Unlike
principle of detecting mitophagy in tissues relies on a change preexisting models, mito-QC is the only model that facilitates
in pH. However, because of the physicochemical characteristics the simultaneous detection of vertebrate mitophagy and mito-
of Keima, we believe that mito-QC affords superior versatility chondrial architecture, because of the unique OMM-localization
with a more binary-based readout of mitophagy. During this pH of the reporter construct. (2) Furthermore, unlike mt-Keima,
change, the Keima protein undergoes a gradual shift in fluores- mito-QC’s tractability is underscored by its compatibility with
cence excitation, with an overlap in the emission spectra. As classical techniques in immunohistochemistry and contempo-
Sun et al. (2015) outline in the limitations of their model, this rary advances in whole-tissue imaging, which enables the sub-
spectral overlap can complicate the interpretation of mitoph- sequent assessment of mitophagy and mitochondrial networks
agy in tissue because the distinction between acidic and neutral within distinct cellular subtypes and whole organs. (3) Mito-
environments is not always obvious and likely influenced by chondrial networks and mitolysosomes are easily viewed in
tissue processing. Moreover, this ambiguity in the interpretation mito-QC without any need for an advanced microscopy setup.
of mitophagy using the mt-Keima mouse is compounded by the Although recent developments in microscopy have improved the
fact that the Keima signal is lost upon conventional fixation, as sensitivity of confocal microscopy through the incorporation of
is stated in the original paper describing this protein (Katayama advanced detectors (Airyscan), we routinely used conventional
et al., 2011). Analyses with the mt-Keima mouse model require laser scanning confocal microscopy throughout this study. We
tissue to be freshly sectioned and visualized immediately. As hope that this aspect of mito-QC will be an accessible and
routine or specialized immunochemical analyses are dependent powerful tool to those in the wider scientific community where
mito-QC illuminates mitophagy in vivo • McWilliams et al. 341resources may be limited. (4) The end-point readout of mito-QC that certain (as yet unknown) conditions could disrupt this bi-
is unambiguous because of the distinct emission and excitation ological process and affect assay reliability. It is important to
spectra of GFP and mCherry. Unlike mt-Keima where it may note that we have found no evidence for this, but additional ex-
be difficult to conclusively delineate a positive mitophagy- periments such as the EM used here would rule this out when
reporter signal because of overlapping spectra and background, confirming new and unexpected instances of mitophagy.
mito-QC enables researchers to decisively detect and quantitate Our findings using mito-QC have unearthed regions of un-
mitophagy in vivo with confidence. For these aforementioned expected yet pronounced physiological mitophagy in mammals.
reasons, we think this distinct tractability of mito-QC confers a One striking example is the discovery of a high rate of mitoph-
significant advantage to researchers interested in various areas agy in kidney PCTs. Although the high energetic demand of
of mammalian mitochondrial biology. PCTs is well established, the dramatic mitochondrial turnover
We believe that the utility of the mito-QC model is only described here was completely unsuspected, because previous
restricted by three minor limiting factors: studies revealed that under steady-state conditions, general au-
(1) Histological considerations of the mito-QC reporter. tophagy proceeds but does not appear to be elevated (Li et al.,
As we have previously published in our cell-based assays, the 2014). This highlights the complex and selective nature of au-
pH of fixative used is a critical factor when using mito-QC, to tophagy within distinct cellular subtypes of a given tissue. As
maintain the lysosomal quenching of the GFP signal. A fixa- mitochondrial dysfunction has been implicated in both chronic
tive with pH of 7.0 ensures consistency in cell-based and histo- and acute kidney diseases (Emma et al., 2016), our data also
logical-based readouts of mitophagy with mito-QC. We advise lend experimental credence to the idea that aberrant mitophagy
researchers to follow our optimized methods for reliable and re- could be a critical process in renal pathophysiology.
producible results. It is also important to note that we have found Mitochondria have granted the Eukarya a survival advan-
that traditional heat-mediated antigen-retrieval (AR) techniques tage throughout evolution; however, it has emerged that their
are incompatible with mito-QC fluorescence. Ultimately, a lim- dysfunction confers a devastating vulnerability to mammalian
ited number of antibody reagents that depend on AR may be cells. Future pharmacological and genetic studies using mito-QC
precluded from use with mito-QC; thus, we advise researchers will be essential to fully decipher the contribution of mitochon-
to use thin cryosections in combination with optimized immu- drial turnover and morphology to a variety of organ systems
nodetection protocols for each antibody to ensure best results. during development and disease. The mechanistic elaboration
Interestingly, we have found that a classical SDS-mediated AR of cell-specific mitophagy pathways may also help in evaluating
method does not perturb the reporter signal, and this may be a their potential as therapeutic targets for the treatment of a variety
suitable option to test with antibody reagents that are likely to of human diseases, particularly those linked to mitochondrial dys-
require AR (Brown et al., 1996). Regarding whole-mount histo- function. Ultimately, we hope that our end-point mito-QC model
chemistry, we have tested a limited number of mito-QC tissues will underpin prospective work that unravels the physiological
(brain, heart, and kidneys) using the iDISCO protocol. In whole relevance of distinct mitochondrial turnover pathways in vivo.
kidney and heart tissues, we were able to resolve mitochon-
dria and mitolysosomes without immunolabeling; however, it
should be noted that we observed some de-quenching of the Materials and methods
GFP signal in optically cleared whole-tissue specimens. This
is likely caused by the harsh solvents and reagents used in this Generation of mitophagy reporter mice
procedure. Nonetheless, this was not sufficient to obstruct visu- mito-QC mice were based on a strategy (constitutive knockin of
alization of mitolysosomes or mitochondria within the tissues mCherry-GFP-mtFIS1101–153) described by Allen et al. (2013) and
we assessed. Future optimization and iterations of the protocol generated using targeted transgenesis by TaconicArtemis GmbH.
for individual mito-QC tissues will most likely resolve these Recombination-mediated cassette exchange (RMCE) was used to insert
issues. Researchers should note that it may prove problematic a CAG promoter cassette and the open reading frame for the mCherry-
to resolve individual mitochondria in tissues with a dense mi- GFP-FIS1 fusion protein including a Kozak sequence (GCC ACC)
tochondrial network using whole-mount approaches; however, into the mouse Rosa26 locus. The RMCE vector was transfected into
the visualization of mitolysosomes may prove more feasible. a TaconicArtemis C57BL/6 ES cell line containing RMCE dock-
We would advise researchers to use trimmed tissue blocks or ing sites in the Rosa26 locus. Recombinant clones were isolated via
slices to reduce incubation times in clearing solutions that may positive–negative (NeoR) selection. Mice were maintained on a C57BL/6
perturb the emission properties of the reporter. background. Genotyping was performed by diagnostic end-point PCR
(2) Restricted availability in fluorophore selection for tri- using genomic DNA isolated from tissue biopsy specimens with the
ple immunolabeling. As mito-QC already relies on two primary following sets of forward and reverse primers: set 1, 5′-CAAAGACCC
endogenous fluorophores (GFP and mCherry) for its detection, CAACGAGAAGC-3′ and 5′-CCCAAGGCACACAAAAAACC-3′;
users are restricted to selecting the blue (405) or far-red emis- and set 2, 5′-CTCTTCCCTCGTGATCTGCAACTCC-3′ and 5′-CAT
sion spectra (633–647 nm) to detect additional fluorescent la- GTCTTTAATCTACCTCGATGG-3′. These were used to detect WT
bels. In this study, we selected DAPI as a nuclear counterstain and knockin alleles using KOD Hot Start DNA polymerase (EMD Mil-
to reveal tissue architecture for most experiments. Though this lipore) and manufacturer-recommended conditions. All animal studies
is not necessarily a limitation per se, inadequate optimization and breeding was approved by the University of Dundee ethical review
of histological and secondary detection parameters may result committee and performed under a UK Home Office project license, in
in potential artifacts (e.g., bleed-through of far red–positive accordance with the Animal Scientific Procedures Act of 1986.
structures into the red channel). With sufficient optimization,
we have found that this limitation is easily resolved. Primary cell culture
(3) As mito-QC is dependent on correct localization of the For experiments using MEFs, embryos were derived from time-mated
reporter to the outer mitochondrial membrane, it is conceivable pregnant females at E12 and staged according to the criteria of Theiler
342 JCB • Volume 214 • Number 3 • 2016(1989). E12 embryos were decapitated and eviscerated, and MEFs and washes in 1× PBS, sections were counterstained with DAPI (1:1,000;
adult fibroblasts were generated using standard protocols, cultured in Thermo Fisher Scientific). Immunolabeled sections were washed and
DMEM/20% FBS/penicillin-streptomycin at 37°C/5% CO2. mounted using Vectashield (Vector Laboratories). Images were acquired
using a LSM700 laser-scanning confocal microscope (ZEISS; Plan-
Immunocytochemistry Neofuar ×40 objective, NA 1.30 or α-Plan Apochromat ×100 objective,
For immunocytochemical and fluorescence microscopy, primary MEFs NA 1.46), LSM 710 Multiphoton (Plan-Neofuar ×40 objective, NA
were cultured on glass coverslips or glass-bottom dishes (Greiner) 1.30; Plan Apochromat ×63 objective NA 1.4; Plan Apochromat ×20
processed as described previously (Allen et al., 2013) in DMEM/20% objective, NA 0.8), or a LSM880 Airyscan microscope (ZEISS; Plan
FBS/nonessential amino acids/l-glutamate and penicillin-streptomycin Apochromat ×63 objective, NA 1.4) and processed using ZEISS Zen
at 37°C/5% CO2. To facilitate comparative microscopic analyses of lit- Software/Adobe Photoshop. Images were digitally altered within linear
termate WT and reporter MEFs in the same dish, mixed cultures were parameters, with minimal adjustments to levels and linear contrast
also established. Specifically, cells were fixed for 15 min at room tem- applied to all images. The following primary antibodies were used
perature using 3.7% formaldehyde and 200 mM Hepes, pH 7.0. After in this study: rat anti-LAMP1 and rabbit anti-TOM20 (Santa Cruz
fixation, samples were washed in PBS and blocked and permeabilized Biotechnology, Inc.); rabbit anti–cleaved caspase-3 (Cell Signaling
with 1% donkey serum in PBS containing 0.2% Triton X-100 (block- Technology); rabbit anti-Ki67, chicken anti-GFP, and mouse anti-RFP
ing solution) for 30 min at RT. Primary antibodies were incubated in (Abcam); mouse anticalbindin (Swant); anti-GFP (Aves); anti-mCherry
the blocking solution for 1 h at room temperature or overnight at 4C (Thermo Fisher Scientific); anti-RFP (Rockland); rabbit anti-PMP70
with gentle agitation. After washing in PBS, samples were incubated (Sigma-Aldrich); and sheep anti-NCC (residues 906–925 of human
with the appropriate Alexa Fluor secondary antibody for 1 h at RT in NCC, S965B; https://mrcppureagents.dundee.ac.uk).
the dark, with either a 406- or 633-nm fluorochrome conjugate. After
washing steps and nuclear counterstaining with DAPI (in instances Whole-mount immunohistochemistry using iDISCO
where 633 antibodies were used), labeled cells were mounted using For labeling of mitochondria and mitophagosomes in excised cerebella,
Vectashield and sealed with nail polish. we used the same immunolabeling protocol as referred to in the orig-
inal iDISCO publication (Renier et al., 2014). For some kidney and
MitoTracker staining and live imaging of cultured MEFs heart specimens, we proceeded immediately to the solvent-based clear-
MEFs were seeded in glass-bottom quadrant dishes (Greiner) and in- ing steps after fixation. Cleared tissue preparations were imaged on the
cubated at 37°C/5% CO2 in culture medium (DMEM/20% FBS/1× LSM 710 MP with a multiphoton laser and ZEISS Plan-Apochromat
non-essential amino acids/penicillin-streptomycin) containing 200 20× objective (NA 0.8).
nM MitoTracker Deep Red FM for 30 min. The MEFs were imaged
via time-lapse confocal microscopy and imaged on a ZEISS LSM 700 Semiautomated quantitation
with stage incubator maintained at 37°C and 5% CO2 using a Zeiss Images were processed with Volocity 3D Image Analysis Software
Plan-Neofluar 40× objective (NA 1.30). (PerkinElmer) using algorithms developed to analyze object overlap
and count individual structures. For all analyses, we obtained images
Immunohistochemistry using uniform random sampling by an experimenter blind to all condi-
For studies investigating mitophagy in vivo, adult mice were terminally tions. All images in each experimental group were processed as a batch
anesthetized and trans-cardially perfused with PBS before perfusion using identical protocols.
with freshly made, sterile-filtered 3.7% (wt/vol) PFA in 200 mM To assess the degree of overlap between LAMP1 and mCherry-
Hepes buffer, pH 7.0. Organs of interest were excised and postfixed via only staining in Volocity, (1) LAMP1-positive structures (identified
immersion fixation (∼20× tissue volume) in PFA for 8–12 h at 4°C. For in far red/Alexa Fluor 633) were found using the “Find Objects/Au-
studies investigating developmental mitophagy, time-mated pregnant tomatic Method” in Otsu’s method (Otsu, 1979); (2) mCherry-only
females were humanely euthanized and embryos were extracted and puncta were found using the same method, but with a threshold offset
staged according to the criteria of Theiler (1989). After decapitation and of 110 to select bona-fide bright structures; and (3) mCherry-positive
brief exsanguination, embryos were briefly rinsed in cold 1× PBS and structures were intersected with LAMP1-positive structures.
immersion fixed for 2–6 h at 4°C, according to developmental stage. For For counting the density of mCherry structures in tissue sections
some studies, organs of interest were excised from fixed embryos before with Volocity, (1) mCherry-positive structures were found using the
further histochemical processing. Fixed tissues were washed extensively Automatic method but using an offset of 110 to select only the bright-
in 1× PBS at 4°C, before density-dependent cryoprotection in filtered est structures; (2) GFP-positive bright structures were found using
30% (wt/vol) sucrose/PBS at 4°C. Cryoprotected tissues were oriented in the Automatic setting, offset by 110 as for mCherry; (3) mCherry-
Peel-A-Way molds (Ted Pella Inc.), embedded in OCT (Sakura; Thermo positive objects that were also GFP positive were excluded from the
Fisher Scientific), and slowly frozen via controlled immersion in chilled count using the “Exclude touching objects” command; (4) and counts
isopentane on dry ice and sectioned on a cryostat (CM3050S; Leica were expressed as a ratio of the total area of tissue, because some sec-
Biosystems). Tissue sections were mounted directly to Leica Biosystem tion images did not completely fill the field of view. This was calculated
SurgiPath Xtra-adhesive slides before processing for immunolabeling using the “Find objects” command using intensities −1 standard devia-
or tinctorial staining. For immunohistochemical detection of markers of tion from the mean intensity.
interest, tissue sections were rehydrated and washed with 1× PBS, before To assess the degree of mitophagy in NCC-positive DCTs, we
blocking and incubation steps in 1–5% BSA containing 0.3–0.8% Triton followed a similar protocol: (1) mCherry-positive structures were
X-100, depending on the particular primary antibody. For staining with found using the Automatic method but using an offset of 110 to select
monoclonal antibodies, sections were blocked with M.O.M (Mouse- only the brightest structures; (2) GFP-positive bright structures were
on-Mouse blocking serum as per the manufacturers instructions; Vector found using the Automatic setting, offset by 110 as for the mCherry; (3)
Laboratories). Tissue sections were washed in PBS before incubation NCC-positive structures were also found in the Alexa633 channel using
with fluorophore-conjugated secondary antibodies (1:500 Alexa Fluor the Automatic method; and (4) overlapping objects were then found
405, 488, 594, and 633; Thermo Fisher Scientific) for 1 h at RT. After and expressed as a percentage of the total number of red structures.
mito-QC illuminates mitophagy in vivo • McWilliams et al. 343You can also read