Non-genetic photoacoustic stimulation of single neurons by a tapered fiber optoacoustic emitter
←
→
Page content transcription
If your browser does not render page correctly, please read the page content below
Shi et al. Light: Science & Applications (2021)10:143                                                                                       Official journal of the CIOMP 2047-7538
                                    https://doi.org/10.1038/s41377-021-00580-z                                                                                                                       www.nature.com/lsa

                                     ARTICLE                                                                                                                                                    Open Access

                                    Non-genetic photoacoustic stimulation of single
                                    neurons by a tapered fiber optoacoustic emitter
                                    Linli Shi1, Ying Jiang2, Fernando R. Fernandez2,3,4, Guo Chen5, Lu Lan5, Heng-Ye Man3,6, John A. White2,3,4,
                                    Ji-Xin Cheng 2,5 ✉ and Chen Yang1,5 ✉

                                      Abstract
                                      Neuromodulation at high spatial resolution poses great significance in advancing fundamental knowledge in the field
                                      of neuroscience and offering novel clinical treatments. Here, we developed a tapered fiber optoacoustic emitter (TFOE)
                                      generating an ultrasound field with a high spatial precision of 39.6 µm, enabling optoacoustic activation of single
                                      neurons or subcellular structures, such as axons and dendrites. Temporally, a single acoustic pulse of sub-microsecond
                                      converted by the TFOE from a single laser pulse of 3 ns is shown as the shortest acoustic stimuli so far for successful
                                      neuron activation. The precise ultrasound generated by the TFOE enabled the integration of the optoacoustic
                                      stimulation with highly stable patch-clamp recording on single neurons. Direct measurements of the electrical
                                      response of single neurons to acoustic stimulation, which is difficult for conventional ultrasound stimulation, have
                                      been demonstrated. By coupling TFOE with ex vivo brain slice electrophysiology, we unveil cell-type-specific
                                      responses of excitatory and inhibitory neurons to acoustic stimulation. These results demonstrate that TFOE is a non-
                                      genetic single-cell and sub-cellular modulation technology, which could shed new insights into the mechanism of
                                      ultrasound neurostimulation.
                  1234567890():,;
1234567890():,;
                  1234567890():,;
1234567890():,;

                                    Introduction                                                                                        psychiatric disorders, such as Parkinson’s Disease, depres-
                                       Neuromodulation at high spatial precision poses great                                            sion, and epilepsy6–8. However, the spatial resolution of
                                    significance in advancing fundamental knowledge in the                                               electrical stimulation is limited by the spread of the electric
                                    field of neuroscience, as the firing of a small population or                                         current, which could distribute over several millimeters and
                                    even single neurons can specifically alter animal behavior or                                        outside of the area of targeting9. Providing high spatial
                                    brain state1,2. Clinically, precise neural stimulation lays the                                     precision and cell specificity, optogenetics has been shown
                                    foundation for procedures such as retinal stimulation3,4 and                                        as a powerful method of modulating population neural
                                    selective dorsal rhizotomy (SDR)5, where selective activation                                       activities in rodents10,11. Yet, the requirement of viral
                                    of a small population or single neurons and axon fibers is                                           infection makes it challenging to be applied in humans.
                                    desired. Historically, electrical stimulation has been the most                                     Toward non-genetic stimulation, photothermal neural sti-
                                    important technique for neuromodulation. Deep brain sti-                                            mulations based on light absorption of water have been
                                    mulation, as the most prescribed neuromodulation method                                             reported12–14, and it has attracted increasing interest in basic
                                    clinically, has been used for treating neurological and                                             science and translational application15,16. In infrared pho-
                                                                                                                                        tothermal neural stimulation (INS), near-infrared light
                                                                                                                                        between 1.5 and 2 μm in wavelength is delivered through a
                                    Correspondence: Ji-Xin Cheng (jxcheng@bu.edu) or Chen Yang
                                                                                                                                        fiber and converted into temperature increase in water with
                                    (cheyang@bu.edu)
                                    1
                                     Department of Chemistry, Boston University, 580 Commonwealth Avenue,                               sub-millimeter precision15,17, where the associated heating
                                    Boston, MA 02215, USA
                                    2
                                                                                                                                        raises a significant concern of tissue damage18. As a rapidly
                                     Department of Biomedical Engineering, Boston University, 44 Cummington
                                                                                                                                        growing modality, focused ultrasound has been harnessed in
                                    Mall, Boston, MA 02215, USA
                                    Full list of author information is available at the end of the article                              a myriad of brain neuromodulation applications19–21, given
                                    These authors contributed equally: Linli Shi, Ying Jiang

                                    © The Author(s) 2021
                                                        Open Access This article is licensed under a Creative Commons Attribution 4.0 International License, which permits use, sharing, adaptation, distribution and reproduction
                                                        in any medium or format, as long as you give appropriate credit to the original author(s) and the source, provide a link to the Creative Commons license, and indicate if
                                    changes were made. The images or other third party material in this article are included in the article’s Creative Commons license, unless indicated otherwise in a credit line to the material. If
                                    material is not included in the article’s Creative Commons license and your intended use is not permitted by statutory regulation or exceeds the permitted use, you will need to obtain
                                    permission directly from the copyright holder. To view a copy of this license, visit http://creativecommons.org/licenses/by/4.0/.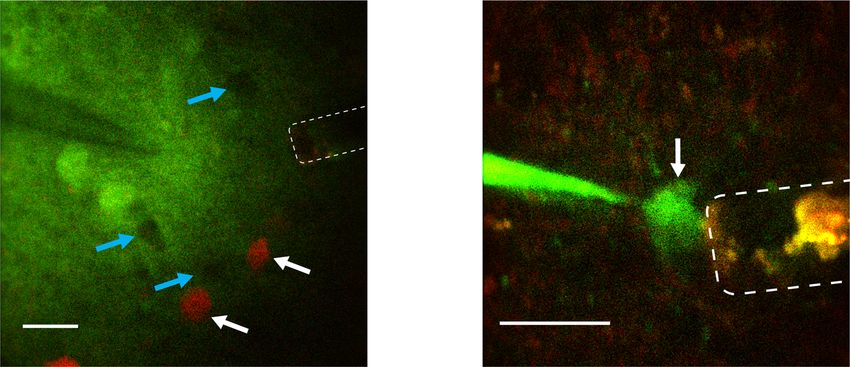
Shi et al. Light: Science & Applications (2021)10:143                                                           Page 2 of 13

its non-invasive nature with a deep penetration depth22.         Importantly, the near field acoustic wave generated by
However, ultrasound, with a focus limited by the acoustic        TFOE allowed optoacoustic stimulation with simulta-
wave diffraction, offers a limited spatial resolution at the     neously monitoring cell responses using whole-cell patch-
level of several millimeters19, which hinders the study of       clamp recording, which had been reported as a challenge
specific brain regions. In addition, since the ultrasound field    for traditional ultrasound23. Our studies revealed cell-
easily disrupts the gigaohm seals23, it is challenging to        type-specific responses to acoustic stimulation for exci-
integrate ultrasound stimulation with whole-cell patch-          tatory and inhibitory neurons. These advances show the
clamp electrophysiology, which is the gold standard tech-        exciting potential of TFOE as a platform technology for
nique for high-fidelity analysis of the biophysical mechan-       non-genetic high-precision stimulation of the neural
isms of neural membrane and ion channels24.                      system, and as a tool for investigations into the mechan-
   Our team recently developed a fiber-based optoacoustic         isms of ultrasound neural stimulation.
converter, which exploited the optoacoustic effect25,
absorbing pulsed light and producing an ultrasound wave,         Results
and achieved neural stimulation in vitro and in vivo at          Fabrication of TFOE and characterization of acoustic
submillimeter spatial resolution26. Yet, such resolution is      generation
still insufficient for targeting subtypes of neurons at             Towards single-cell modulation, we have fabricated a
single-cell level or sub-cellular structures. In addition, the   TFOE with a 20 μm tip diameter as a miniaturized
device does not allow stable integration with patch clamp        ultrasound source. We took several innovative steps to
on the same cell being stimulated. New capabilities,             overcome the challenges associated with the small 20 μm
including single and subcellular precision and integration       fiber tip. For control of tapering an optical fiber repro-
of single-cell electrophysiology recording, are still sought     ducibly, a multimode fiber was gradually pulled from the
to enable understanding of mechanical stimulation at the         full diameter of 225 to 20 μm via a thermal tapering
single-cell level and to offer high precision for potential      technique (see “Methods”). To convert the light energy
clinical applications.                                           into acoustic waves with maximum efficiency28, we have
   Here, we report a miniaturized tapered fiber optoa-            optimized the absorption/thermal expansion layer, which
coustic emitter (TFOE) capable of generating an ultra-           composes multi-wall CNTs with strong light absorption
sound field with a 2.7 MPa pressure and a spatial                 embedded in PDMS with a high thermal expansion
resolution of 39.6 µm, which offers an unprecedented high        coefficient27. To increase optoacoustic conversion effi-
spatial resolution for ultrasound stimulation. The sig-          ciency in the tapered fiber and assure minimum light
nificant advancement of TFOE in both spatial resolution           leakage, the optoacoustic CNT/PDMS coating was pre-
and optoacoustic conversion efficiency are achieved based         pared with a large CNT concentration of 15%, by intro-
on the following innovative designs. First, instead of using     ducing isopropyl alcohol (IPA) to form IPA-coated CNTs
a commercial multimode fiber with a diameter of 200 µm            with hydroxyl groups. To overcome the reduced viscosity
as in our earlier work, we developed a controlled tapering       of PDMS induced by high CNT concentration and IPA, as
strategy and reproducibly tapered the fibers to a tip dia-        well as to achieve a uniform and controlled coating
meter as small as 20 μm. Second, a new deposition                thickness on the 20 μm cross-section of the tapered end, a
method was developed to achieve uniform and con-                 punch-through method (see “Methods”) was deployed
trollable coating thickness of ~10 µm on the small 20-µm         (Fig. 1b). The coating thickness was controlled by chan-
fiber tip. Third, instead of using graphite powder in epoxy       ging the matrix viscosity via IPA evaporation. The TFOE
as a converter, we applied carbon nanotubes (CNT)                was further confirmed by optical imaging to have a CNT/
embedded in a polydimethylsiloxane (PDMS) matrix with            PDMS coating of a thickness of 9.5 μm and an overall
improved solubility, which allows highly efficient optoa-         diameter of 19.8 μm, meeting the needs of single-cell
coustic signal generation from the tapered fiber tip with         targeting (Fig. 1b bottom).
an increase in the conversion efficiency by one order               Next, a 1030 nm nanosecond pulsed laser was delivered
of magnitude27 and prevents light leak from the thin             to the TFOE to generate optoacoustic signals. The
20 μm coating.                                                   acoustic signals were measured by a 40 µm needle
   Using TFOE, we improved substantially the spatial and         hydrophone (Fig. S1). As shown in Fig. 1c, the acoustic
temporal resolution of optoacoustic neuron stimulation.          peak-to-peak intensity attenuates significantly as the dis-
Specifically, we demonstrated single-cell stimulations            tance between the hydrophone and the TFOE increases.
and subcellular stimulation of axons and dendrites. We           The measured pressure P is plotted as a function of the
also showed that a single acoustic pulse with a sub-             distance d in Fig. 1d, showing a fitting curve of P = 50.88/
microsecond duration was capable to achieve neuron               (d + 18.89) +0.14 (R2 = 0.9999, fitting coefficient of
stimulation, which was found as the shortest duration            determination) and confirming the inverse proportion
of acoustic stimuli to the best of our knowledge23.              relationship of the pressure and distance expected for
Shi et al. Light: Science & Applications (2021)10:143                                                                                                                                    Page 3 of 13

                         a                                                                               b

                                Pulsed laser                                                                                    MWCNT/PDMS
                                                                                                                                   + IPA

                         3 ns

                                                                                                                                Tapered fiber
                                   1.7 KHz

                                                                                                                        200 μm                                              20 μm

      c                                                     d                                            e                                              f
                                                                             3
                                                                                                                        1                0 μm                    0.1
                          1.5
      Amplitude (Volt)

                                             0 μm                                                                                                                          50 ms
                                                            Pressure (MPa)

                                                                                                         (normalized)
                                                                                                                                         49 μm

                                                                                                          Magnitude
                          1.0                282 μm                          2                                                                                             1 ms

                                                                                                                                                       ΔT (°C)
                                                                                                                                         145 μm
                          0.5
                                                                             1
                          0.0                                                                                                                                     0
                         –0.5                                                                                           0
                                                                             0
                             0.0         0.2          0.4                        0   100    200    300                      0                     50                   0         1            2
                                      Time (μs)                                      Distance (μm)                              Frequency (MHz)                               Time (s)

 Fig. 1 TFOE for high-precision optoacoustic stimulation. TFOE for high-precision optoacoustic stimulation.a Schematic of TFOE enabling single-
 neuron stimulation. b Multiwall CNT/PDMS mixture as coating material casted on a metal mesh followed by a punch-through method to coat the
 tapered fiber. Bottom left: optical image of TFOE, Bottom right: zoom-in showing the tip. c Acoustic signal waveforms detected by the hydrophone at
 the distances ranging from 0 to 282 µm from the TFOE. The curves shown from the top to the bottom were obtained at the distances of 0, 2, 6, 10,
 17, 29, 49, 82, 145, 185 and 282 µm, respectively. d Detected pressure plotted as a function of the distance. e Frequency spectra of acoustic signals
 acquired at 0, 49 and 145 µm, respectively. All measurements in (c–e) were done with single laser pulse with a pulse energy of 6.7 µJ. f Surface
 temperature of TFOE tip during laser excitation of 50 ms (7.8 mW, Red) and 1 ms (11.4 mW, Blue), respectively. Shaded area in (f): standard deviation
 taken from three measurements from the same TFOE. Black arrow: laser onset.

omnidirectional waves. The spatial resolution of the                                                         omnidirectional. Therefore, the acoustic intensity for low
generated acoustic field, defined by the distance where the                                                    frequency is expected to attenuate quickly. In contrast,
pressure decreases to 1/e of initial pressure at 0 µm, was                                                   the high-frequency components with wavelengths com-
found to be 39.6 µm, 5.5 times smaller compared to the                                                       parable to the size of TFOE propagate more like planar
acoustic wavelength of 0.22 mm corresponding to the                                                          waves in water, the attenuation is less for high-frequency
peak frequency of 6.6 MHz in water. We also confirmed                                                         components. Therefore, we observed a higher peak fre-
that a laser with the same energy delivered to a bare                                                        quency at the increased distances.
optical fiber without the photoacoustic coating generated                                                       To characterize the thermal profile generated by TFOE
negligible signal detected by the hydrophone at the dis-                                                     in water during acoustic generation, temperature on the
tance of 10 µm (Fig. S2).                                                                                    fiber tip was measured by a miniaturized ultrafast thermal
  The radio frequency spectrum of the measured acoustic                                                      sensor (DI-245, DataQ, OH, USA) directly in contact with
waveforms after Fast Fourier Transform (FFT) exhibit                                                         the TFOE tip surface. Two test conditions were used for
peak acoustic frequencies of 6.6, 10.1, and 13.9 MHz at                                                      successful neuron stimulation: first, a laser pulse train of
distances of 0, 49, and 145 µm, respectively (Fig. 1e). This                                                 50 ms, a laser power at 7.8 mW and a repetition rate of
frequency range is similar to previous studies29,30, in                                                      1.7 kHz; second, a laser pulse train of 1 ms, a laser power
which a peak frequency of 8 MHz was found for a fiber                                                         at 11.4 mW and a repetition rate of 1.7 kHz. As shown in
with ~10 µm coating of CNT/PDMS and 20 MHz for                                                               Fig. 1f, the tip surface temperature increased by only
~1 µm fiber coating. Moreover, the peak frequency of the                                                      0.093 ± 0.004 °C under the first condition and the increase
broad band shifts to a higher value as the distance                                                          was not detectable under the second condition. This
increases. This could be explained by the different decay                                                    temperature increase is far below the threshold of
dynamics of high and low-frequency acoustic waves. For                                                       thermal-induced neuron modulation (ΔT ≥ 5 °C)31,32.
the acoustic waves with lower frequencies and corre-                                                         Collectively, these results demonstrate that TFOE with a
spondingly longer wavelengths, the TFOE acts as a point                                                      tip diameter of 20 μm fabricated serves as a point ultra-
source and the propagation of the low-frequency waves is                                                     sound source, producing ultrasound fields with a spatial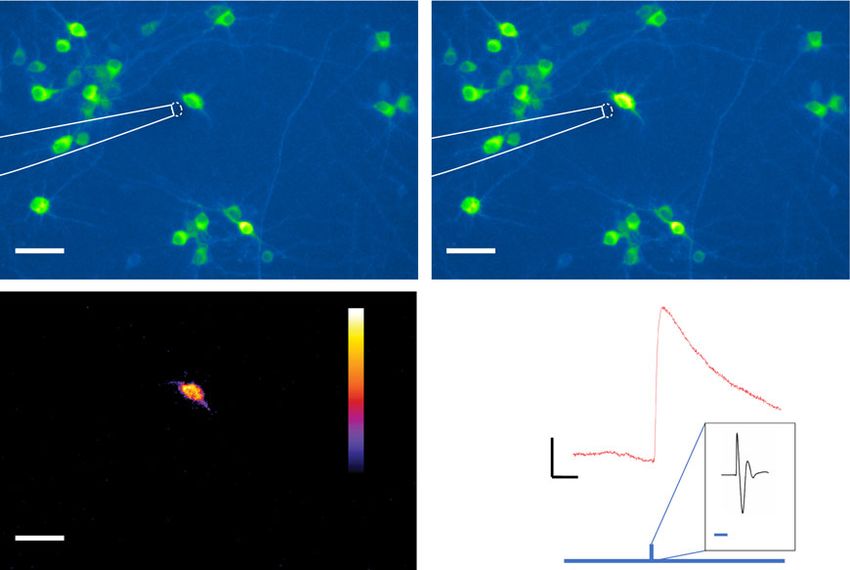
Shi et al. Light: Science & Applications (2021)10:143                                                         Page 4 of 13

resolution of 39.6 µm. This unprecedented spatial reso-        sequentially placed about 5 μm away from each of the
lution will enable high-precision stimulation at single-       three targeted neurons. The maximum fluorescence
neuron level while minimizing thermal damage and               intensity change (ΔF/F) was color-labeled for each
undesired mechanical disruptions.                              neuron in red, yellow, and green, respectively (Fig. 2d).
                                                               Importantly, fluorescence increase was observed only for
TFOE stimulation of primary neurons with single-cell           the selectively targeted neuron without simultaneous
precision                                                      activation of the other two neurons, indicating that
  To test whether the TFOE provides sufficient spatial          TFOE provided neuron stimulation with single-neuron
precision when modulating a single neuron in culture,          precision.
we prepared primary rat cortical neurons expressing              To quantify the spatial resolution of the TFOE stimu-
GCaMP6f and performed calcium imaging using an                 lation, we studied the distance dependence of the TFOE
inverted wide-field fluorescence microscope. Controlled          stimulation for the individually targeted neurons. The
by a micro-manipulator, a TFOE has placed ~5 μm away           TFOE was placed at varied distances from the neurons
from a targeted neuron. A 3-ns pulsed laser at 1030 nm         using a micro-manipulator. Transmission imaging was
and 1.7 kHz repetition rate was used to deliver laser pulses   acquired each time prior to fluorescence imaging to
of a 50 millisecond duration at an average power of            visualize the position of TFOE. Figure 2e shows the
7.8 mW, corresponding to 85 pulses. Calcium transients         merged transmission image and fluorescence image of
were observed immediately after laser onset for the tar-       GCaMP-expressing neurons, allowing measurement of
geted neurons, while other neurons ~50–70 µm away              the distance between the TFOE and the targeted neuron.
from the tip remained unaffected (Fig. 2a), indicating high    For each targeted neuron, the Calcium response was first
spatial resolution of TFOE stimulation. The calcium            recorded with the TFOE placed at a distance about 20 µm.
transient with max ΔF/F of 135% ± 83% (N = 6 from 3            Then, the distance was gradually decreased, until strong
cultures, data in mean ± SD) indicates successful activa-      activations were observed. Fluorescence traces of neuron
tion of the targeted neuron likely through the firing of        stimulated by the TFOE at four different distances were
multiple action potentials evoked by TFOE stimulation.         recorded. A total of 10 neurons were tested separately.
To further improve the temporal resolution, a laser pulse      Figure 2f shows three representative Calcium dynamics
train of 1 ms (two pulses) at 11.4 mW power was delivered      observed from a targeted neuron, including a typical trace
to the TFOE. Successful activation of single neurons was       with ΔFmax/F > 2%, labeled strong stimulation in red, a
also observed with a max ΔF/F of 106% ± 61% (N = 8 cells       subtle signal increase with 0.05% < ΔFmax/F < 2% labeled
from three cultures, data in mean ± SD) (Fig. 2b).             subtle stimulation in yellow, and no activation with
  Figure S3 compared the TFOE stimulation with con-            ΔFmax/F < 0.05% labeled in black. Figure 2g shows the
trols. The control group of 1 ms TFOE with 3 μM tetro-         distances where these three types of signal dynamics
dotoxin (TTX) showed no activation, confirming that the         occurred for all 10 neurons. For the distance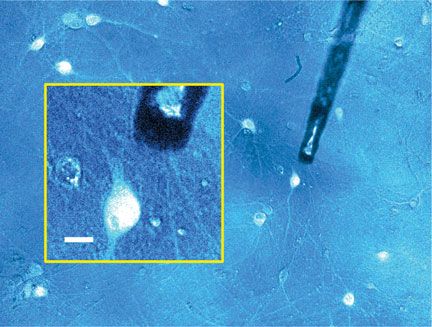
Shi et al. Light: Science & Applications (2021)10:143 Page 5 of 13
a Before After Max ΔF/F
4.8
ΔF/F 50%
3.6
50 ms
2.4
1.2
0
2s
b 2.4
ΔF/F 50%
1.8
1.2
1 ms
0.6
0
2s
c 1st 1.3 2nd 1.3 3rd 1.3
1.0 1.0 1.0
ΔF/F 50%
0.8 0.8 0.8
Repeat
1 ms
0.5 0.5 0.5
0.2 0.2 0.2 1 min 1 min
10 s
d Neuron 1 2.3
Neuron 2 0.7
Neuron 3
0.6
Merged
1.7 0.5 0.5
Sequential
1.1 0.3 0.4
1 ms
0.5 0.1 0.3
–0.1 –0.1 0.2
e f g 10 h
20 Strong stimulation
10
Subtle stimulation
8
Distance (μm)
15 No activation
Neuron #
ΔF/F (%)
6
10
4
5
2
0 0
1
g e
0 5 10 15 20 on btl
0 2 4 6 8 Str Su
Time (s) Distance (μm)
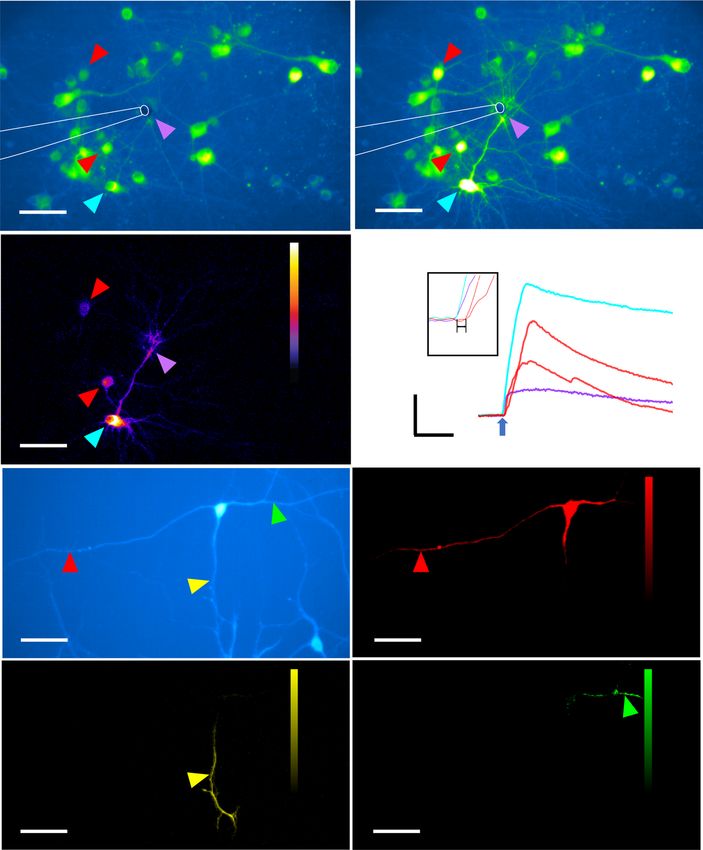
Fig. 2 Fluorescence images of GCaMP6f-expressing neurons in response to TFOE stimulation. a, b Fluorescence images and calcium traces in
sparse population stimulated by TFOE with a laser duration of 50 ms (a) and 1 ms (b). The fluorescence images with the peak intensity after
stimulation are shown as “after”. Blue arrows: laser onset. c Max ΔF/F images of one neuron undergone repeated TFOE stimulation three times. Right:
calcium signal of the neuron. Blue arrows: laser onset. d Sequential stimulation of three neurons. Max ΔF/F labeled in red, yellow, green respectively
superimposed with the fluorescence image. Scale bars: 50 µm. e Merged fluorescence image and transmission image of neuron culture. Inset: zoom-
in of the targeted neuron and the TFOE tip. Scale bar: 10 µm. f Representative fluorescence signals evoked at the targeted neuron by TFOE
stimulation. Average Calcium signals induced by strong neuron stimulation when the TFOE was placed at 10 µm (Black). Shaded areas: the standard deviation from 10
neurons. g Calcium response as a function of distance at targeted neurons upon TFOE stimulation. 10 neurons were tested individually. For each
neuron, four different distances were tested. Calcium responses were characterized by color bars with the red bars corresponding to the strong
stimulation similar to the red curve in (f), the yellow bars corresponding to the subtle stimulation and the black bars for no activation. h Average
distances to evoke strong and subtle activations. Laser condition for (e–h): 11.4 mW, 1 ms, 1.7 kHz.
nanosecond pulsed laser was used to deliver a single laser with unprecedented temporal precision required to mimic
pulse to the TFOE. TFOE stimulation of the GCaMP6f- natural neural coding37.
expressing primary cortical neuron with different laser We further investigated the required laser energy for a
pulse energies was performed under the single pulse given pulse number for successful neuron stimulation. In
condition. No calcium transient was observed until the previous ultrasound studies, continuous wave and pulsed
pulse energy reached 6 µJ/pulse (Fig. 3a–d). The width of ultrasound with varied intensities and durations have
the optoacoustic wave is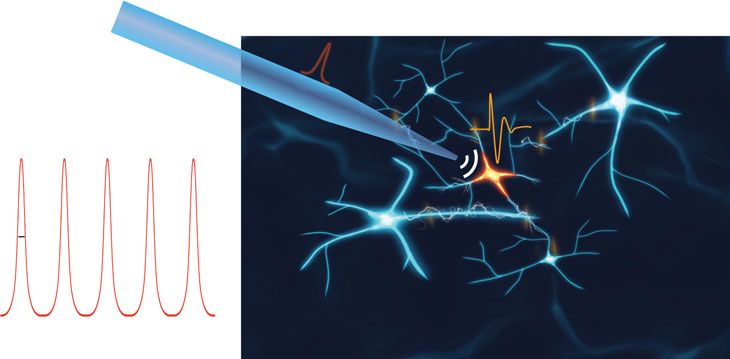
Shi et al. Light: Science & Applications (2021)10:143                                                                                    Page 6 of 13

                    a                                  b                                  e                   8

                                                                                                              6

                                                                                          Pulse energy (μJ)
                         50 μm              Before         50 μm              After                           4

                    c                           0.7    d
                                                0.5                                                           2

                                                           'F/F 50%
                                                0.4
                                                0.3
                                                0.1                                                           0
                                                'F/F                  2s
                                                                                                                  1   2     4    6   8
                         50 μm           Max 'F/F                           1 μs
                                                                                                                      Pulse number

 Fig. 3 Pulse energy dependence of TFOE stimulation. a–c Fluorescence images of GCaMP6f expressing neurons before and after TFOE
 stimulation with a single pulse. d Calcium trace of the targeted neuron undergone single-pulse stimulation. Blue vertical line: onset of optoacoustic
 stimulation with zoom-in showing a representative optoacoustic waveform. e Pulse energy threshold for successful neuron stimulation as a function
 of pulse number (N = 5–7).

investigation of the behavior of neurons in response to                      different calcium dynamics were captured through ima-
acoustic stimulation across multiple intensities and                         ging throughout
durations. In our work, first, the threshold of pulse energy                    the field of view. First, a slow propagation of calcium
for successful stimulation is defined as the laser pulse                      wave initiating from the targeted region in the neural
energy sufficient to induce a maximum fluorescence                             network was observed after TFOE stimulation (Fig. S4).
intensity change (Max ΔF/F) >20%40. The threshold                            The speed of the calcium wave propagation was calcu-
energy shows a monotonic decrease from 6.3 µJ, 4.9 µJ to                     lated to be 75.2 µm/s, which was in agreement with the
3.9 µJ when increasing the pulse number from 1, 2 to 4,                      propagation speed of dendritic calcium waves induced by
respectively, and it remains relatively constant at 3.9 and                  synaptic activity or by the activity of metabotropic glu-
3.6 µJ when the pulse number increased to 6 and 8,                           tamate receptors (mGluRs) and backpropagating action
respectively. These results demonstrated the following key                   potentials, which generated a speed of ~70 µm/s43. Sec-
findings. First, the decrease of the energy threshold when                    ond, four sites in the field of view showed elevated
the laser pulse number increases in the range of                             fluorescence signals prior to the spreading of calcium
1–4 shows that under the small pulse energy condition,                       waves (Fig. 4c). The neurites in the targeted region
subthreshold depolarizations accumulate with increasing                      (labeled purple in Fig. 4a–c) and a specific neuron 1
pulse numbers, consistent with the previous work41.                          (labeled cyan in Fig. 4a–c) with axon directly connecting
Second, the flattening trend of the threshold energy from                     to neurites in the targeted region showed fast calcium
4 to 8 pulses implies a presence of an energy threshold at                   transients immediately after laser onset (Fig. 4d), which
around 4 µJ/pulse, below which the action potential can                      resembles the backpropagation of action potentials.
hardly be evoked with even further elongation of the pulse                   Considering that an unmyelinated axon would conduct
train. These results are in agreement with previous                          action potential spikes at a speed of 500 µm/ms to
work41,42.                                                                   synapses44, the propagation from neurites to neuron 1
                                                                             (cyan in Fig. 4a–c) over a distance of ~100 µm only
TFOE stimulation targeting sub-cellular regions of a single                  requires 0.2 ms. Therefore, the difference in the calcium
neuron                                                                       transient onset for neuron 1 (cyan in Fig. 4d) and the
  Upon successful stimulation of cultured primary neu-                       targeted area (purple in Fig. 4d) was non-detectable by the
rons, we further investigated whether the TFOE can target                    camera with a sampling interval 50 ms. Third, neuron 2
subcellular structures. To this end, the TFOE was first                       and 3 (labeled red in Fig. 4a–c) in the vicinity but without
carefully placed above the targeted area where axons and                     axons connecting to the targeted area showed an activa-
dendrites densely populate without the presence of somas.                    tion delay of ~0.2 s (Fig. 4d, inset) with similar temporal
A 1030-nm laser pulse train with a duration of 1 milli-                      dynamics. This signaling was likely attributed to action
second, a laser power of 11.4 mW and a repetition rate of                    potential evoked through synaptic transmission, since it
1.7 kHz was delivered to the TFOE. An increase in                            showed a faster propagation speed than the calcium wave.
fluorescence intensity at the targeted area was clearly                         This capability of TFOE induced stimulation on sub-
observed after laser onset, indicating successful TFOE                       cellular structures, specifically on axons and dendrites,
stimulation of targeted neurites (Fig. 4a–b). Three                          was then utilized to elucidate whether axons and dendrite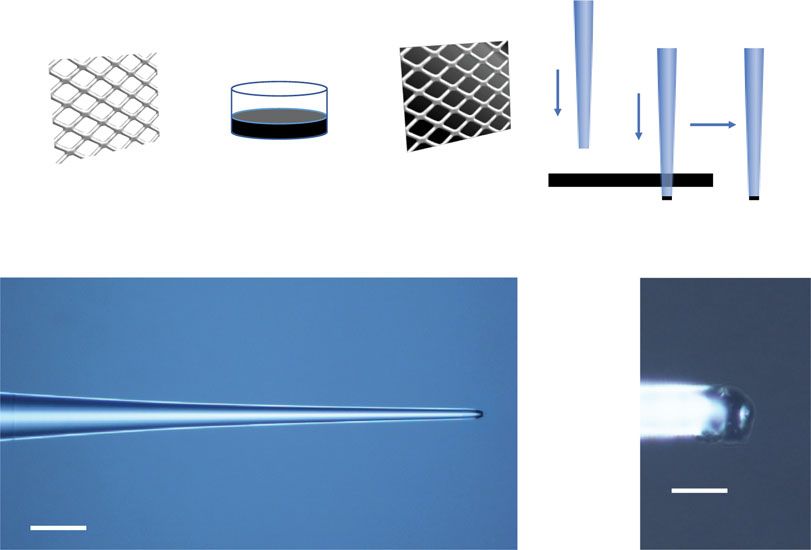
Shi et al. Light: Science & Applications (2021)10:143                                                                                      Page 7 of 13

                          a                                                  b

                                                                 Before                                                After
                          c                                           2.1    d
                                                                      1.6
                                                                      1.1
                                                                      0.6                            0.2 s

                                                                                     'F/F 50%
                                                                      0.1

                                                             'F/F at 4 s                        2s
                          e                                                  f                                           0.30
                                                                                                                         0.25
                                                                                                                         0.20
                                                                                                                         0.15
                                                                                                                         0.10

                          g                                           0.05   h                                           0.05
                                                                      0.04                                               0.04
                                                                      0.03                                               0.03
                                                                      0.02                                               0.02
                                                                      0.01                                               0.01

                          i                                                  j
                                                                                 'F/F 10%
                              'F/F 2%

                                        2s   Targeted area                                  2s               Soma
 Fig. 4 TFOE evoked sub-cellular stimulation on neurites. a–b TFOE evoked neurites activation with calcium wave propagating along the neuron
 network. Colored arrows: targeted area (purple), neuron 1 (cyan) and neuron 2, 3 (red). c ΔF/F of calcium signal at 4 s after laser onset. d Calcium
 traces of targeted area (purple), neuron 1 (cyan), and neuron 2 and 3 (red), as labeled in (a). Inset: Zoom-in of calcium signals immediately after the
 laser onset. Blue arrow: laser onset. e A multipolar neuron stimulated with a TFOE selectively targeting the axon (red arrow) and dendrites (yellow and
 green arrows). f–h Maximum ΔF of calcium signal upon stimulation of different areas. i Calcium traces measured at the targeted neurites as labeled in
 (e) by red, yellow and green arrows, respectively. j Calcium traces measured at the soma upon stimulation of different neurites. Blue arrows in (i–j):
 laser onset. Scale bars in (a–c), (e–h): 50 µm

have distinct response profiles to optoacoustic stimula-                          4f, j). Thus, this neurite is identified as an axon, since such
tion. In Fig. 4e, three neurites in a multipolar neuron were                     propagating activation resembles backpropagation of
targeted selectively by the TFOE. Targeted TFOE stimu-                           action potentials in an axon. Distinctively, targeted TFOE
lation on one of the neurites (red in Fig. 4e, f) induced                        stimulation of the other two neurites (yellow and blue in
strong calcium activation at the soma with no delay (Fig.                        Fig. 4e, g and h) did not induce any activation at the soma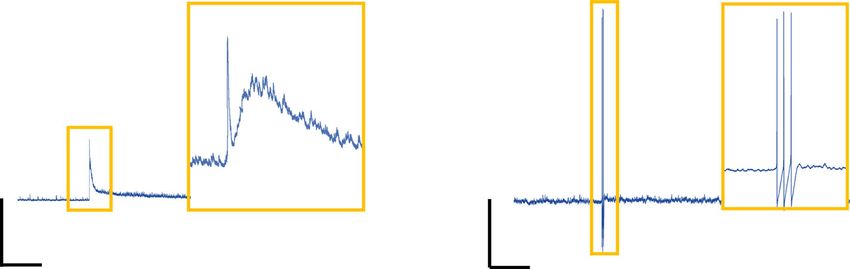
Shi et al. Light: Science & Applications (2021)10:143                                                             Page 8 of 13

(Fig. 4g–j). Thus, they were identified as dendrites. Neu-        subthreshold depolarization, indicating a high precision of
ronal dendrites are known to integrate synaptic inputs           the stimulation in the tissue.
from upstream neurons, which involves summation of                 Next, we targeted tdTomato positive interneurons.
stimuli that arrive in rapid succession, entailing the           TFOE induced subthreshold depolarization in inhibitory
aggregation of inputs from separate branches. In our case,       interneurons held at −75 mV, and the electrical response
the forward propagation of a single dendrite was found to        over time after stimulation showed two components (Fig.
be insufficient to evoke action potentials at the soma. The       5e, inset). The first sharp peak could be due to the direct
differences between responses of the axon and dendrites          interruption of the membrane integrity by the acoustic
upon acoustic stimulation at the single-cell level are           wave, and the following broad peak is likely due to an
shown to be repeatable across multiple neurons (Fig. S5).        inward channel current, thus indicates the possible
Collectively, these data reveal differential response            involvement of ion channels. With the membrane depo-
dynamics of axons and dendrites to optoacoustic stimu-           larized via injecting positive currents to near −40 mV, a
lation for the first time, enabled by subcellular targeting       short train of three action potentials was observed upon
capability of TFOE.                                              TFOE stimulation (Fig. 5f). The distinct response of
                                                                 excitatory pyramidal neuron and inhibitory interneurons
Whole-cell patch-clamp recording reveals cell-type-specific       to acoustic stimulation is likely contributed by multiple
response to TFOE stimulation                                     factors including a unique intrinsic action potential
  A key advantage of single-neuron TFOE stimulation              threshold of these two cell types, as well as distribution of
is the compatibility with intracellular patch-clamp              mechanosensitive ion channels that have different
recordings. While the calcium response to the stimu-             response dynamics to acoustic radiation force45,46. In
lation has limited temporal resolution, direct record-           summary, the TFOE provides an unprecedented stable
ings using intracellular patch-clamp recordings stand            ultrasound source compatible with patch-clamp record-
as the gold standard to study sub- and supra-threshold           ings, holding promise to shed light on the mechanism of
neuron activity. Conventional ultrasound easily dis-             acoustic induced neuron stimulation.
rupts the patch attachment between the glass and
membranes, so intracellular patch-clamp recordings               Discussion
have been challenging during conventional ultrasound                In this study, we develop a TFOE that generates
stimulation. Our optoacoustic stimulation has the                acoustic waves with a spatial resolution of 39.6 µm,
advantage of being highly precise with a minimized               enabling optoacoustic neural modulation with single-
mechanical disruption; therefore, it can be recorded             neuron and subcellular precision.
with patching, providing a new testing system to gain               The acoustic wave generated by TFOE allows optoa-
insights towards mechanical modulation of neural                 coustic stimulation along with simultaneous monitoring
systems.                                                         of cell responses using whole-cell patch-clamp recording,
  We integrated TFOE stimulation with patch-clamp                which has been reported to be challenging under con-
recording on single neurons in mouse cortical slices to          ventional ultrasound stimulation. Coupling TFOE with
detect the direct electrical response to optoacoustic            ex vivo brain slice electrophysiology, we revealed cell-
single-neuron stimulation. As shown in Fig. 5a, we used          type-specific responses to acoustic stimulation for exci-
brain slices from mice expressing tdTomato in GAD2               tatory and inhibitory neurons.
interneurons to assist in visualization of specific cell types.      The optoacoustic effect has been extensively used for
Thus, GAD2-tdTomato positive inhibitory interneurons             biomedical imaging25, and more recently, it has been
and GAD2-tdTomato negative pyramidal neurons can be              explored for neuromodulation26. Compared to the pre-
selectively targeted. TFOE can be integrated with the            viously reported optoacoustic stimulator, the TFOE offers
patch pipette to induce depolarization leading to action         new capabilities through adapting new device designs and
potential generation in the targeted neurons. Also indi-         innovative fabrication methods. The highly efficient
cated in Fig. 5c–f, the neuron membrane voltage can be           optoacoustic conversion layer in the TFOE is made of
measured precisely with an unprecedented stability upon          CNTs of improved solubility embedded in a thermo-
TFOE stimulation.                                                expansive PDMS matrix, which significantly improves
  For excitatory pyramidal cells, under the current-clamp        light to sound conversion efficiency27. In addition, the
mode, a train of action potential was observed immedi-           punch-through coating method ensures uniform coating
ately after TFOE stimulation at 5 µm (Fig. 5c). The result       of the much smaller tapered fiber tip with great control
was consistent with previous calcium imaging with ΔF/F           and reliability.
>100% in fluorescence change (Figs. 2a–b and 3d). When               A key advantage of the TFOE stimulation is its unprece-
the TFOE was moved from 5 to 10 µm away from the                 dented spatial resolution. Transcranial ultrasound neuro-
neurons (Fig. 5c, d), the action potentials give way to a        modulation has been demonstrated in rodents20, non-human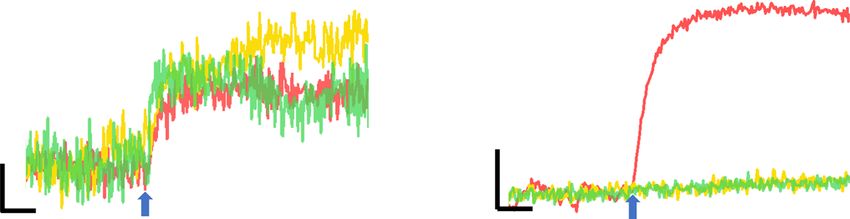
Shi et al. Light: Science & Applications (2021)10:143 Page 9 of 13
a b
Excitatoty pyramidal cell
Inhibitory interneuron
Patch clamp
TFOE
Glass pipette
20 μm Inhibitory interneuron 20 μm
c d
20 mV
20 mV
2s 2s
Excitatory pyramidal cell (5 μm) (–75 mV) Excitatory pyramidal cell (10 μm) (–75 mV)
e f
20 mV
20 mV
2s 2s
Inhibitory interneuron (5 μm) (–75 mV) Inhibitory interneuron (5 μm) (–40 mV)
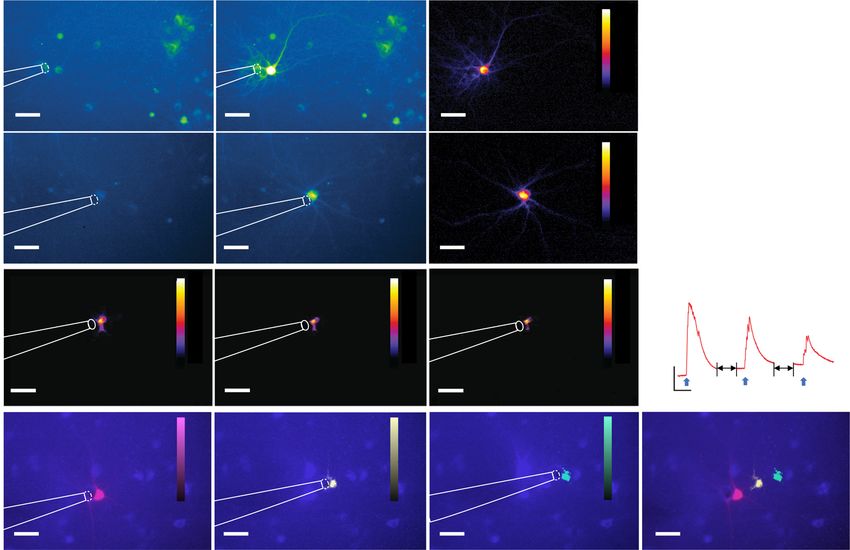
Fig. 5 Single neuron patch clamp with TFOE stimulation. a–b Two-photon imaging of patch clamp integrated with TFOE in a mouse brain slice
targeting GAD2-tdTomato negative pyramidal neurons and GAD2-tdTomato positive inhibitory interneurons. The patch pipette is visualized using
the cyan-green fluorescent dye Alexa Fluor 488 in the intracellular electrode solution. c, d Membrane voltage response in an excitatory pyramidal cell
upon TFOE stimulation (5 ms) at a distance of ~5 µm (c) and ~10 µm (d). e, f Voltage response in an inhibitory interneuron upon TFOE stimulation at
~5 µm at the membrane voltages of −75 mV (e) and −40 mV (f). Laser: 11.4 mW, 1.7 kHz, 5 ms duration.
primates47, and in humans19. However, due to the wave stimulation with single cell and subcellular precision, and
diffraction limit, focused ultrasound neuromodulation offers reveal the differential response to TFOE stimulation of
a spatial precision of a few millimeters19, which prohibits site- subcellular structures by specifically targeting the neuronal
specific modulation in small animals or single-neuron sti- soma, dendrites, and axons.
mulation and therefore lacks the capabilities to study cell- By harnessing the controllability of the pulsed laser, we
type-specific responses. The spatial resolution of the TFOE identified the accumulative effect of optoacoustic stimu-
generated acoustic field was found to be 39.6 µm, 5.5 times lation at the single-cell level, indicating that ultrasonic
smaller compared to the acoustic wavelength of 0.22 mm stimulus can be integrated over a finite duration to
corresponding to the peak frequency of 6.6 MHz in water. become effective. A previous study by Tyler et al. using
Utilizing the generated acoustic field, we demonstrate neural ultrasound with focal size of 2 mm, the relationship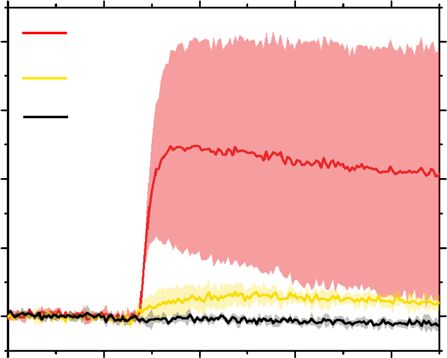
Shi et al. Light: Science & Applications (2021)10:143                                                        Page 10 of 13

between the temporal-averaged US intensity and the             activation of ion channels, are possibly involved. Future
success rate was found to be negative38. This differs from     systematic studies, for example, patch-clamp recording of
Mourad et al.’s study with ultrasound focal size of 1 mm,      TFOE stimulated neurons with genetically or pharma-
where positive relationship was reported39. These studies      ceutically modification of the ion channels could offer
provide conflicting evidence21, where the observed beha-        deeper insights of the more detailed mechanism56.
viors may due to changes in ultrasound parameters, or            In summary, this genetic-free, single-cell stimulation
selective modulation of specific regions. In another study      technique offers a new tool to understand the mechanism
by Pauly et al., an ultrasound with a focal spot of 4 mm in    of neuron stimulation. Moreover, for clinical application,
diameter was used to induce short-latency muscle con-          TFOE can be used as a surgical tool or an implant for
tractions in mice measured by electromyography (EMG),          precise stimulation of a single nerve. For example, TFOE
showing the ultrasonic stimulus could be integrated over       can be used to assist the SDR surgery. In a SDR surgery,
time, and the presence of energy threshold was demon-          precise stimulation of the individual dorsal root nerves is
strated, below which the response could not be evoked          needed to identify the abnormal one. Due to current
with even further elongation of the stimulation dura-          spread, the commonly used electric stimulation lacks
tion41. The result by Pauly et al. is consistent with the      sufficient spatial precision desired as the dorsal root
TFOE data. In addition to intrinsic cell properties, their     nerves can be as small as 0.27 ± 0.13 mm57. Such precision
observations could originate from non-specific neural           is even more challenging in children patients with cere-
network targeting and recording. The result from TFOE          bral palsy, as their nerves are finer. TFOE provides
with the capability of assessing single-neuron activity in a   superior stimulation precision needed. For fundamental
network-free condition further ascertains the stimulus         studies, the TFOE approach offers a non-genetic neural
accumulation effect as an intrinsic signal interpretation of   stimulation method with a tunable spatial resolution
individual neurons.                                            through varying the fiber diameters. For example, map-
  More importantly, successful TFOE stimulation has            ping the organization and connectivity of columns in
been achieved with a single laser pulse of 3 ns, which         primates requires precise stimulation of single columns,
generates an acoustic pulse of sub-microsecond. Pre-           roughly 200 μm in sizes. Compared to the electrical sti-
viously, single tone burst ultrasound with 10 acoustic         mulation, TFOE offers a spatial precision finer than
cycles and overall duration of 22.7 μs has been reported as    200 μm and MRI compatibility, making it possible to
the shortest acoustic stimuli for neuron modulation23.         assess functional outcome of the stimulation through
Therefore, our result represents significant improvement        MRI-guided insertion58 and brain fMRI recording in
of temporal resolution of current acoustic stimulation         humans and non-human primates. It is also non-genetic,
techniques.                                                    which overcoming the challenges facing by optogenetics
  Furthermore, TFOE allows integration of acoustic sti-        in primates. This capacity of TFOE will enable mapping of
mulation with whole-cell patch-clamp recordings. Our           columnar connectome in cortex, which will build a
electrophysiological recordings of TFOE stimulated single      foundation for further development of an optoacoustic
neurons in brain slices revealed distinct responses of         brain-machine interface.
excitatory pyramidal neurons and inhibitory interneurons
to TFOE stimulation. The distinct responses may origi-         Materials and methods
nate from differences in the intrinsic threshold or varia-     Optical fiber tapering
tions in the distribution of different ion channels.             To control the tapering, a multimode fiber (FT200EMT,
Moreover, the inhibitory neurons showed an elevated            Thorlabs, Inc., NJ, USA) was pulled at one end by a
threshold of action potential generation compared to           traction weight with the other end fixed. The pulling
excitatory neurons. This contrasts with findings using          force, determined by the weight of the traction object, was
electric stimulation, where the inhibitory neurons could       found to be proportional to the square of the tapered end
have a lower threshold than pyramidal cells48,49. This         radius, therefore used as the key parameter to control the
discrepancy can be attributed to the different mechanisms      diameter of the tapered end. In this way, with a pulling
between acoustic and electric stimulation. Several             force of 0.75 N, tapered fibers of 18.4 ± 0.9 μm (N = 5) in
hypotheses have been proposed for ultrasound neuro-            diameter were fabricated with high reproducibility.
stimulation, including the activation of mechanosensitive
ion channels50–53, the transient mechanical disruption of      Tapered fiber coating
the neural membrane including the opening of pores54,             To assure a maximum optoacoustic conversion effi-
and induction of capacitive currents by intramembrane          ciency and minimum light leakage in the tapered fiber,
cavitation54,55. In our study, the TFOE evokes electrical      CNT/PDMS/IPA composite was prepared. For PDMS, the
response results (Fig. 5e), indicating that two mechanisms,    silicone elastomer (Sylgard 184, Dow Corning Corpora-
specifically, transient disruption of the membrane and          tion, USA) was dispensed directly into a container
Shi et al. Light: Science & Applications (2021)10:143                                                       Page 11 of 13

carefully to minimize air entrapment, followed by mixing      balanced salt solution) (Thermo Fisher Scientific Inc.,
with the curing agent in a ratio of 10:1 by weight. Mul-      MA). Dissociated cells were washed with and triturated in
tiwall CNTs (
Shi et al. Light: Science & Applications (2021)10:143                                                                                                      Page 12 of 13

Jackson Laboratory, ME, USA) were used for visualization                             Supplementary information The online version contains supplementary
of inhibitory interneurons. Brain slices were prepared                               material available at https://doi.org/10.1038/s41377-021-00580-z.

from mice aged post-natal day 60 or greater (both gen-
                                                                                     Received: 3 February 2021 Revised: 9 June 2021 Accepted: 21 June 2021
ders). After anesthetization with isoflurane and decapita-
tion, brains were removed and immersed in 0 °C solution
of standard artificial cerebral spinal fluid (ACSF). For
recordings, slices were moved to the stage of a two-                                 References
photon imaging system. All recordings were conducted                                  1. Houweling, A. R. & Brecht, M. Behavioural report of single neuron stimulation
between 33 and 36 °C. Standard patch-clamp solutions                                      in somatosensory cortex. Nature 451, 65–68 (2008).
                                                                                      2. Li, C.-Y. T., Poo, M.-m. & Dan, Y. Burst spiking of a single cortical neuron
and electrodes with resistances between 3 and 4 MΩ were                                   modifies global brain state. Science 324, 643–646 (2009).
used. The electrode pipette was visualized using the cyan-                            3. Rizzo, J. F. III Update on retinal prosthetic research: the Boston Retinal Implant
green fluorescent dye Alexa Fluor 488 hydrazide (Thermo                                    Project. J. Neuro-Ophthalmol. 31, 160–168 (2011).
                                                                                      4. Palanker, D. et al. Design of a high-resolution optoelectronic retinal prosthesis.
Fisher Scientific Inc., MA, USA), which was added to the                                   J. Neural Eng. 2, S105 (2005).
intracellular electrode solution (0.3% weight/volume).                                5. Grunt, S., Becher, J. G. & Vermeulen, R. J. Long‐term outcome and adverse
Imaging was performed using a two-photon imaging                                          effects of selective dorsal rhizotomy in children with cerebral palsy: a sys-
                                                                                          tematic review. Dev. Med. Child Neurol. 53, 490–498 (2011).
system (Thorlabs, Inc., NJ, USA) with a mode-locked Ti:                               6. Boon, P. et al. Deep brain stimulation in patients with refractory temporal lobe
Sapphire laser (Chameleon Ultra II; Coherent, CA, USA)                                    epilepsy. Epilepsia 48, 1551–1560 (2007).
set to wavelengths between 920 nm and 950 nm, which                                   7. Mayberg, H. S. et al. Deep brain stimulation for treatment-resistant depression.
                                                                                          Neuron 45, 651–660 (2005).
was used to excite both the Alexa Fluor 488 and tdTo-                                 8. Rosin, B. et al. Closed-loop deep brain stimulation is superior in ameliorating
mato using a 20×, NA 1.0 objective lens (Olympus, MA,                                     parkinsonism. Neuron 72, 370–384 (2011).
USA). Laser scanning was performed using resonant                                     9. Ineichen, C., Shepherd, N. R. & Sürücü, O. Understanding the effects
                                                                                          and adverse reactions of deep brain stimulation: is it time for a
scanners and fluorescence was detected using two pho-                                      paradigm shift toward a focus on heterogenous biophysical tissue
tomultiplier tubes (Hamamatsu, JP) equipped with red                                      properties instead of electrode design only? Front. Hum. Neurosci. 12,
and green filters to separate emission from Alexa Fluor                                    468 (2018).
                                                                                     10. Boyden, E. S. et al. Millisecond-timescale, genetically targeted optical control of
488 and tdTomato. All other procedures were following                                    neural activity. Nat. Neurosci. 8, 1263–1268 (2005).
our past work59.                                                                     11. Kim, C. K., Adhikari, A. & Deisseroth, K. Integration of optogenetics with
                                                                                         complementary methodologies in systems neuroscience. Nat. Rev. Neurosci.
                                                                                         18, 222–235 (2017).
Data analysis                                                                        12. Wells, J. et al. Optical stimulation of neural tissue in vivo. Opt. Lett. 30, 504–506
  Calcium images were analyzed using ImageJ. Calcium                                     (2005).
traces, electrophysiological traces were analyzed and                                13. Wells, J. et al. Biophysical mechanisms of transient optical stimulation of
                                                                                         peripheral nerve. Biophys. J. 93, 2567–2580 (2007).
plotted using Origin and GraphPad Prism. All statistical                             14. Izzo, A. D. et al. Laser stimulation of the auditory nerve. Lasers Surg. Med. 38,
analysis was done using Origin. Data shown are mean ±                                    745–753 (2006).
SD.                                                                                  15. Cayce, J. M. et al. Infrared neural stimulation of primary visual cortex in non-
                                                                                         human primates. Neuroimage 84, 181–190 (2014).
                                                                                     16. Cayce, J. M. et al. Infrared neural stimulation of human spinal nerve roots
Acknowledgements                                                                         in vivo. Neurophotonics 2, 015007 (2015).
This work is supported by Brain Initiative R01 NS109794 to J.-X.C. and C.Y. and      17. Xu, A. G. et al. Focal infrared neural stimulation with high-field functional MRI:
National Institute of Health, United States, R01 NS052281 to J.A.W. We also              a rapid way to map mesoscale brain connectomes. Sci. Adv. 5, eaau7046
thank Y. Tian for help with the neuronal cultures.                                       (2019).
                                                                                     18. Chernov, M. M., Chen, G. & Roe, A. W. Histological assessment of thermal
Author details                                                                           damage in the brain following infrared neural stimulation. Brain Stimulation 7,
1
 Department of Chemistry, Boston University, 580 Commonwealth Avenue,                    476–482 (2014).
Boston, MA 02215, USA. 2Department of Biomedical Engineering, Boston                 19. Legon, W. et al. Transcranial focused ultrasound modulates the activity of
University, 44 Cummington Mall, Boston, MA 02215, USA. 3Center for Systems               primary somatosensory cortex in humans. Nat. Neurosci. 17, 322–329 (2014).
Neuroscience, Boston University, 610 Commonwealth Ave, Boston, MA 02215,             20. Tufail, Y. et al. Ultrasonic neuromodulation by brain stimulation with tran-
USA. 4Neurophotonics Center, Photonics Center, Boston University, 8 St. Mary’s           scranial ultrasound. Nat. Protoc. 6, 1453–1470 (2011).
Street, Boston, MA 02215, USA. 5Department of Electrical and Computer                21. Blackmore, J. et al. Ultrasound neuromodulation: a review of results,
Engineering, 8 St. Mary’s Street, Boston, MA 02215, USA. 6Department of                  mechanisms and safety. Ultrasound Med. Biol. 45, 1509–1536 (2019).
Biology, Boston University, 5 Cummington Mall, Boston, MA 02215, USA                 22. Naor, O., Krupa, S. & Shoham, S. Ultrasonic neuromodulation. J. Neural Eng. 13,
                                                                                         031003 (2016).
                                                                                     23. Tyler, W. J. et al. Remote excitation of neuronal circuits using low-intensity,
Author contributions                                                                     low-frequency ultrasound. PLoS ONE 3, e3511 (2008).
C.Y., J-X.C., L.S., Y.J., and L.L. conceived the idea using taper fibers for high-    24. Kodandaramaiah, S. B. et al. Automated whole-cell patch-clamp electro-
precision optoacoustic neurostimulation. L.S. and G.C. designed and fabricated           physiology of neurons in vivo. Nat. Methods 9, 585–587 (2012).
the TFOE. L.S. and Y.J. performed the in vitro experiments. F.R.F., Y.J., and L.S.   25. Wang, L. V. & Hu, S. Photoacoustic tomography: in vivo imaging from orga-
performed the patch-clamp experiment. H-Y.M. provided neuron cultures. L.S.,             nelles to organs. Science 335, 1458–1462 (2012).
Y.J., J-X.C., and C.Y. wrote the manuscript. F.F., J.W., and H-Y.M. revised the      26. Jiang, Y. et al. Optoacoustic brain stimulation at submillimeter spatial precision.
manuscript. J.A.W. and H-Y.M. provided guidance for the project.                         Nat. Commun. 11, 881 (2020).
                                                                                     27. Shi, L. et al. A fiber optoacoustic emitter with controlled ultrasound frequency
Conflict of interest                                                                      for cell membrane sonoporation at submillimeter spatial resolution. Photo-
The authors declare no conflicts of interests.                                            acoustics 20, 100208 (2020).
Shi et al. Light: Science & Applications (2021)10:143 Page 13 of 13
28. Noimark, S. et al. Polydimethylsiloxane composites for optical ultrasound 45. Kubanek, J. Neuromodulation with transcranial focused ultrasound. Neuro-
generation and multimodality imaging. Adv. Funct. Mater. 28, 1704919 (2018). surgical Focus 44, E14 (2018).
29. Noimark, S. et al. Carbon‐nanotube–PDMS composite coatings on optical 46. Tyler, W. J. Noninvasive neuromodulation with ultrasound? A continuum
fibers for all‐optical ultrasound imaging. Adv. Funct. Mater. 26, 8390–8396 mechanics hypothesis. Neuroscientist 17, 25–36 (2011).
(2016). 47. Deffieux, T. et al. Low-intensity focused ultrasound modulates monkey
30. Poduval, R. K. et al. Optical fiber ultrasound transmitter with electrospun visuomotor behavior. Curr. Biol. 23, 2430–2433 (2013).
carbon nanotube-polymer composite. Appl. Phys. Lett. 110, 223701 (2017). 48. Mahmud, M. & Vassanelli, S. Differential modulation of excitatory and inhibi-
31. Lyu, Y. et al. Semiconducting polymer nanobioconjugates for targeted pho- tory neurons during periodic stimulation. Front. Neurosci. 10, 62 (2016).
tothermal activation of neurons. J. Am. Chem. Soc. 138, 9049–9052 (2016). 49. Prestigio, C. et al. Spike-related electrophysiological identification of cultured
32. Shapiro, M. G. et al. Infrared light excites cells by changing their electrical hippocampal excitatory and inhibitory neurons. Molecular Neurobiology 56,
capacitance. Nat. Commun. 3, 736 (2012). 6276–6292 (2019).
33. Cohen, J. E. & Fields, R. D. Extracellular calcium depletion in synaptic trans- 50. Kubanek, J. et al. Ultrasound modulates ion channel currents. Sci. Rep. 6, 1–14
mission. Neuroscientist 10, 12–17 (2004). (2016).
34. Asteriti, S., Liu, C.-H. & Hardie, R. C. Calcium signalling in Drosophila photo- 51. Kubanek, J., Shukla, P., Das, A., Baccus, S. A. & Goodman, M. B. Ultrasound elicits
receptors measured with GCaMP6f. Cell Calcium 65, 40–51 (2017). behavioral responses through mechanical effects on neurons and ion chan-
35. Ha, G. E. & Cheong, E. Spike frequency adaptation in neurons of the central nels in a simple nervous system. J. Neurosci. 38, 3081–3091 (2018).
nervous system. Exp. Neurobiol. 26, 179–185 (2017). 52. Yoo, S., Mittelstein, D. R., Hurt, R. C., Lacroix, J. J. & Shapiro, M. G. Focused
36. Lin, C.-R. et al. Sonoporation-mediated gene transfer into adult rat dorsal root ultrasound excites neurons via mechanosensitive calcium accumulation and
ganglion cells. J. Biomed. Sci. 17, 44 (2010). ion channel amplification. Preprint at https://www.biorxiv.org/content/
37. Shemesh, O. A. et al. Temporally precise single-cell-resolution optogenetics. 10.1101/2020.05.19.101196v1 (2020).
Nat. Neurosci. 20, 1796–1806 (2017). 53. Ye, J. et al. Ultrasonic control of neural activity through activation of the
38. Tufail, Y. et al. Transcranial pulsed ultrasound stimulates intact brain circuits. mechanosensitive channel MscL. Nano Lett. 18, 4148–4155 (2018).
Neuron 66, 681–694 (2010). 54. Krasovitski, B., Frenkel, V., Shoham, S. & Kimmel, E. Intramembrane cavitation as
39. Mehić, E. et al. Increased anatomical specificity of neuromodulation via a unifying mechanism for ultrasound-induced bioeffects. Proc. Natl Acad. Sci.
modulated focused ultrasound. PLoS ONE 9, e86939 (2014). USA 108, 3258–3263 (2011).
40. Dana, H. et al. High-performance GFP-based calcium indicators for imaging 55. Plaksin, M., Shoham, S. & Kimmel, E. Intramembrane cavitation as a predictive
activity in neuronal populations and microcompartments. Nat. Methods 16, bio-piezoelectric mechanism for ultrasonic brain stimulation. Phys. Rev. X 4,
649–657 (2018). 011004 (2014).
41. King, R. L. et al. Effective parameters for ultrasound-induced in vivo neuro- 56. Gaub, B. M. et al. Neurons differentiate magnitude and location of mechanical
stimulation. Ultrasound Med. Biol. 39, 312–331 (2013). stimuli. Proc. Natl Acad. Sci. USA 117, 848–856 (2020).
42. Mihran, R. T., Barnes, F. S. & Wachtel, H. Temporally-specific modification of 57. Liu, Y., Zhou, X., Ma, J., Ge, Y. & Cao, X. The diameters and number of nerve
myelinated axon excitability in vitro following a single ultrasound pulse. fibers in spinal nerve roots. J. Spinal Cord. Med. 38, 532–537 (2015).
Ultrasound Med. Biol. 16, 297–309 (1990). 58. Chen, Y. et al. MRI-guided robotic arm drives optogenetic fMRI with con-
43. Nakamura, T. et al. Synergistic release of Ca2+ from IP3-sensitive stores evoked current Ca 2+ recording. Nat. Commun. 10, 2536 (2019).
by synaptic activation of mGluRs paired with backpropagating action 59. Fernandez, F. R., Rahsepar, B. & White, J. A. Differences in the electro-
potentials. Neuron 24, 727–737 (1999). physiological properties of mouse somatosensory layer 2/3 neurons in vivo
44. Micheva, K. D. et al. A large fraction of neocortical myelin ensheathes axons of and slice stem from intrinsic sources rather than a network-generated high
local inhibitory neurons. Elife 5, e15784 (2016). conductance state. Eneuro 5, 2 (2018).You can also read