Sea Level Dynamics and Coastal Erosion in the Baltic Sea Region
←
→
Page content transcription
If your browser does not render page correctly, please read the page content below

Sea Level Dynamics and Coastal Erosion in the Baltic Sea Region
     Ralf Weisse1, Inga Dailidiene2, Birgit Hünicke1, Kimmo Kahma3, Kristine Madsen4, Anders Omstedt5,
     Kevin Parnell6, Tilo Schöne7, Tarmo Soomere6, Wenyan Zhang1, Eduardo Zorita1
     1
       Institute of Coastal System Analysis and Modeling, Helmholtz Zentrum Hereon, Max-Planck-Str. 1, 21502 Geesthacht,
5    Germany
     2
       Klaipeda University, Marine Research Institute, Klaipeda, LT-92294, Lithuania
     3
       Finnish Meteorological Institute, Helsinki, Finland
     4
       Danish Meteorological Institute, Copenhagen, 2100, Denmark
     5
       University of Gothenburg, Department of Marine Sciences, Box 461, SE-405 30 Göteborg, Sweden
10   6
       Tallinn University of Technology, School of Science, Department of Cybernetics, Tallinn, 12618, Estonia
     7
       German Research Centre for Geosciences GFZ, Potsdam, 14473, Germany
     Correspondence to: Ralf Weisse (ralf.weisse@hereon.de)

     Abstract. There are a large number of geophysical processes affecting sea level dynamics and coastal erosion in the Baltic
     Sea region. These processes operate on a large range of spatial and temporal scales and are observed in many other coastal
15   regions worldwide. Together with the outstanding number of long data records, this makes the Baltic Sea a unique laboratory
     for advancing our knowledge on interactions between processes steering sea level and erosion in a climate change context.
     Processes contributing to sea level dynamics and coastal erosion in the Baltic Sea include the still ongoing visco-elastic
     response of the Earth to the last deglaciation, contributions from global and North Atlantic mean sea level changes, or from
     wind waves affecting erosion and sediment transport along the subsiding southern Baltic Sea coast. Other examples are storm
20   surges, seiches, or meteotsunamis contributing primarily to sea level extremes. All such processes have undergone considerable
     variations and changes in the past. For example, over the past about 50 years, the Baltic absolute (geocentric) mean sea level
     rose at a rate slightly larger than the global average. In the northern parts, due to vertical land movements, relative mean sea
     level decreased. Sea level extremes are strongly linked to variability and changes in large-scale atmospheric circulation.
     Patterns and mechanisms contributing to erosion and accretion strongly depend on hydrodynamic conditions and their
25   variability. For large parts of the sedimentary shores of the Baltic Sea, the wave climate and the angle at which the waves
     approach the nearshore are the dominant factors, and coastline changes are highly sensitive to even small variations in these
     driving forces. Consequently, processes contributing to Baltic sea level dynamics and coastline change are expected to vary
     and to change in the future leaving their imprint on future Baltic sea level and coastline change and variability. Because of the
     large number of contributing processes, their relevance for understanding global figures, and the outstanding data availability,
30   global sea level research and research on coastline changes may greatly benefit from research undertaken in the Baltic
     Sea.

                                                                    1
1 Introduction

     Regional climate change in the Baltic Sea basin has been systematically assessed in two comprehensive assessment reports:
     BACC I (BACC Author Team, 2008) and BACC II (BACC II Author Team, 2015) initiated by BALTEX and its successor
35   Baltic Earth (https://baltic.earth). As a follow-up, the present study represents one of the thematic Baltic Earth Assessment
     Reports (BEARs) which consist of a series of review papers summarizing and updating the knowledge around the major Baltic
     Earth science topics. Being part of the series, this study concentrates on sea level dynamics and coastal erosion in the Baltic
     Sea region.
     The Baltic Sea is an intra-continental, semi-enclosed sea in northern Europe that is connected to the Atlantic Ocean only
40   via the narrow and shallow Danish Straits (see Figure 1 for a map of geographical names). With an area of about
     417,000 km2 and a volume of about 21,200 km3 (Jakobsson et al., 2019), it contributes less than a tenth of a percent to
     the area and the volume of the global ocean (Eakins and Sharman, 2010). For that reason, contributions from the Baltic
     Sea to global sea level changes are small. Over the last centuries and decades, sea level and coastline changes in the
     Baltic Sea have received considerable attention in research anyway. There are several reasons:
45       1.   Historically, changes in sea levels and coastlines have influenced Baltic Sea harbors, settlements, and economic
              activity over millennia. As a result, the area comprises not only some of the longest available tide-gauge
              records worldwide, but also much longer observational evidence that challenged our understanding of sea level
              dynamics and land movements associated with the glacial isostatic adjustment (GIA) (e.g., BIFROST project
              members, 1996), and contributed significantly to our present understanding of large-scale sea level changes on
50            a global scale.
         2.   Processes and forcing contributing to Baltic sea level dynamics and coastline change vary substantially over
              short distances (Harff et al., 2017). For example, there is a pronounced north-south gradient in GIA leading to
              substantial differences in the rates of relative sea level change across the Baltic Sea (see below). Together with
              zonal and meridional changes in the geological composition of the coast and the variability of the wind- and
55            wave-driven hydrodynamics this leads to variations in the relative contributions of these factors to erosion and
              sedimentation in the order of kilometers. Time scales of processes and forcings also vary considerably, ranging
              from a few seconds (e.g. wind waves) to millennia (e.g. GIA). Again, this enables researchers to study a wide
              range of phenomena with larger and global relevance (e.g. glacial isostasy or characteristics of relative sea
              level changes).
60       3.   Finally, and from a regional perspective, regional mean and extreme sea level changes and erosion represent
              important indicators of regional climate variability and change. Any long-term change in mean or extreme sea
              levels as well as in erosion and accretion will have an immediate impact on society, influencing sectors such
              as coastal protection, shipping, or development of offshore renewable energy resources among others (e.g.,
              Weisse et al., 2015).

                                                                   2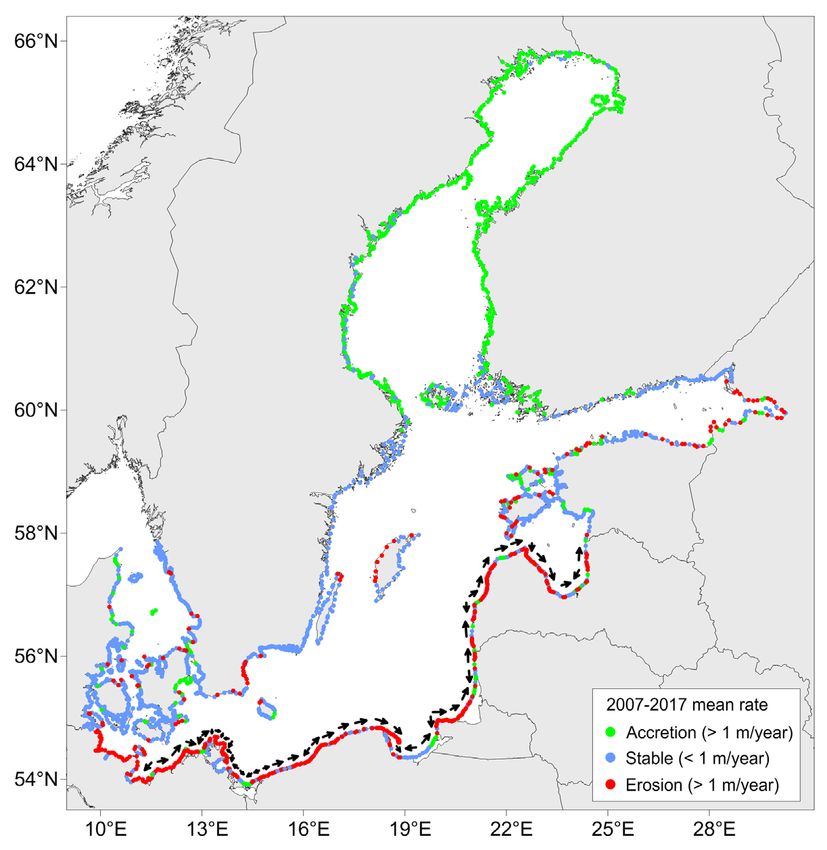
65
     Figure 1: Map of the Baltic Sea and geographical names used in this manuscript. The Øresund and the Belt Sea are together called
     the Danish Straits. The Bothnian Bay and the Bothnian Sea together form the Gulf of Bothnia.

     Historically, considerable progress in sea level research worldwide was made based on early Baltic Sea observations
     that indicated that sea levels were falling. Stones carved with runic texts, linking them to the coast, were found quite far
70   away from the present-day coastline. Shallow harbors were gradually abandoned as the water level apparently declined.
     In the 18th century, Celsius (1743) estimated the rate of falling water levels based on so-called seal rocks (Figure 2,
     left). Seal rocks were economically important for seal hunting and are therefore well described in the written records
     (Ekman, 2016).

                                                                    3
Figure 2: (Left) The Celsius seal rock at Lövgrunden outside the Swedish city of Gävle on the Bothnian Sea coast (Ekman, 2016).
75   The water level today is about 2 meters below the 1731 mark (photo courtesy of Martin Ekman). (Right) Stockholm annual sea level
     variations (black) and land rise (red) according to Ekman (2003) [redrawn from Omstedt (2015)].

     The reason for the sinking water levels was unclear and debated until it was understood that in the past thick layers of
     ice had covered Scandinavia and that sea levels were not falling but instead the land was rising elastically after the ice
     cover disappeared. The idea of postglacial uplift was proposed in the mid-19th century by Jamieson (1865) and then
80   later by others, although the causes of the uplift were strongly debated. Another major progress in ideas was not possible
     until new knowledge of the thermal history of the Earth due to changes in Sun-Earth orbital motions was available in
     the late 19th century and early 20th century (Milanković, 1920).
     Figure 2 (right) shows observed Baltic sea level change and land rise for Stockholm, one of the longest available tide-
     gauge records comprising almost 250 years of data. Apart from the long-term trend, substantial variability on different
85   time scales is inferred. A sketch illustrating processes contributing to such variability is shown in Figure 3. For the
     Baltic Sea, such processes can be separated into processes that alter the volume of the Baltic Sea and/or the total amount
     of water in the basin, and processes that redistribute water within the Baltic Sea (Samuelsson and Stigebrandt, 1996;
     Svansson, 1980). From analyses of tide-gauge data and dynamical consideration, we know that processes with
     characteristic time scales of about half a month or longer can change the volume of the water in the Baltic Sea. Due to
90   the limited transport capacity across the Danish Straits, processes with shorter time scales primarily redistribute water
     within the Baltic Sea (Johansson, 2014; Soomere et al., 2015; Männikus et al., 2019). At longer time scales, North
     Atlantic mean sea level changes and effects from large-scale atmospheric variability have the strongest influence on
     Baltic mean sea level variability and change apart from changes caused by movements in the Earth’s crust due to the
     GIA. For example, using experiments with a hydrodynamic model Gräwe et al. (2019) showed that for the period 1980-
95   2000 about 75% of the basin-averaged mean sea level change externally entered the Baltic Sea as a mass signal from

                                                                    4
the adjacent North Sea while the remainder was caused by above-average zonal wind speeds during that period (Gräwe
      et al., 2019). Variations in the freshwater budget (precipitation minus evaporation (P-E) and river runoff) can further
      contribute to seasonal and interannual sea level variations in the Baltic Sea in the order of centimeters to decimetres
      (Johansson, 2016; Hünicke and Zorita, 2006). Long-term average runoff exceeds P-E by about a factor of ten
100   (Leppäranta and Myrberg, 2009). However, presently no long-term trends in the freshwater budget are observed
      (Johansson, 2016; Rutgersson et al., 2014) that would add to presently observed rates of Baltic sea level change. On
      shorter time scales, processes such as changing wind- and atmospheric pressure patterns are the primary processes
      redistributing water masses within the Baltic Sea and are responsible for sea level variations occurring within the Baltic
      Sea (Hünicke and Zorita, 2006) and its semi-enclosed subbasins (Männikus et al., 2019). Other processes such as
105   seiches or wind waves have effects on the height of the sea surface on very short time scales ranging from seconds to
      hours.

      Figure 3: Processes contributing to sea level variability and change in the Baltic Sea [redrawn and modified from Johansson (2014)].

110   The primary control of the position of the shoreline is sea level (Harff et al., 2017). Much of the Baltic Sea shoreline
      (particularly in Finland and Sweden) is rock or consolidated sediments, which typically change over decades to
      millennia. Shorelines composed of unconsolidated sediments typically erode when sea level rises and accrete when sea
      level falls. However, several other factors modify the control that sea level exerts. Sediment availability and supply are
      fundamental. A useful conceptual model is the coastal sediment budget, with sediment transport being considered
115   within sediment compartments, which operate essentially independently, particularly with respect to alongshore
      sediment transport. Sediment compartments can be very small (hundreds of meters of shoreline) but also can range up
      to hundreds of kilometers. Where the sediment budget is in deficit, erosion occurs; where it is in surplus, the shoreline
      accretes. Overlying any long-term trend are shorter-term changes to the shoreline. Changes that occur after a storm

                                                                       5
event are typically called erosion, although technically if the sediment remains in the active sediment compartment,
120   this use of the term in this context may be seen as inaccurate. The Baltic Sea differs from many other coastal locations.
      In particular, short wind fetches mean that swell waves are generally insignificant (Broman et al., 2006; Soomere et
      al., 2012) and waves often approach the shoreline at a large angle (Soomere and Viška, 2014). That means that the
      Baltic Sea shorelines are very sensitive to wind direction. Wave periods are short, leading to the situation where waves
      can approach the shore at high angles, and the effects of an individual storm on beach processes and sediment transport
125   within a compartment can vary considerably depending on wind (and therefore wave) characteristics, overlying the
      effects of short term elevated water levels. Figure 4 provides a sketch of the main topographic coastal features and
      processes contributing to erosion and sedimentation at the Baltic Sea shores.

      Figure 4: Main coastal topographic features and erosion/accretion processes at the Baltic Sea shores [redrawn and modified from
130   Harff et al. (2017)].

      Being part of the thematic Baltic Earth Assessment reports, this study concentrates and reviews knowledge on sea level
      dynamics and coastal erosion in the Baltic Sea region. Section 2 provides an overview of the current state of knowledge
      for both, mean and extreme sea levels as well as for coastal erosion and sedimentation. This includes brief recaps of
      sources of data and relevant processes along with descriptions of variability and past, ongoing, and potential future
135   changes. Section 3 addresses several knowledge gaps, that emerged from reviewing the available publications.
      Eventually, conclusions and key messages are presented in Section 4.

                                                                    6
2 Current state of knowledge

      2.1 Mean sea level

      2.1.1 Sources of data

140   The primary sources for measuring mean sea level changes are tide gauges and radar altimetry from satellites. Both measure
      two different quantities, namely relative and absolute (geocentric) sea levels. Absolute sea level refers to the height of the sea
      surface relative to a geocentric reference such as the reference ellipsoid and is derived from satellite altimetry or global
      navigation satellite system (GNSS)-controlled tide gauges (Schöne et al., 2009; Schöne et al., 2011). Relative sea level refers
      to the height of the sea surface relative to the seafloor (or a local benchmark on land) and is derived from tide gauges or sea
145   level reconstructions. Contrary to absolute sea level, relative sea level is thus influenced both by variations in the height of the
      sea surface and by land uplift or subsidence.
      The tide gauge network of the Baltic Sea is one of the most densely spaced and longest-running networks in the world. Many
      stations have been in continuous operation since the early 19th century and some stations provide monthly averages for over
      200 years (Ekman, 2009; Bogdanov et al., 2000; Kowalewska-Kalkowska and Marks, 2011). There are about 45 operational
150   tide gauges with more than 60 years of data and with very good coverage of the western, southwestern, and northern Baltic
      Sea coasts (Hünicke et al., 2015). Eight additional gauges with data since 1961 in Latvian waters were recently added to this
      data set (Männikus et al., 2019). Monthly averaged data is often provided to, and open access through, the Permanent Service
      for Mean Sea Level (PSMSL; e.g., Holgate et al., 2013). The Copernicus Marine Environment Monitoring Service collects
      data in hourly resolution from a range of national stations in hourly resolution with daily updates, but with varying quality
155   control. The EMODnet Physics portal provides access to both data sources, and thus combines a substantial amount of long-
      term monthly and higher frequency Baltic sea level measurements. The tide gauges measure relative to specific reference
      levels that differ between Baltic countries for historical reasons (Ekman, 2009). There are efforts to connect Baltic Sea gauges
      to a common datum, such as the Baltic Sea Chart Datum 2000 (BSCD2000; Schwabe et al., 2020). Additionally, uncertainties
      in local reference levels are introduced by, e.g. different measuring techniques and sampling frequencies (Ekman, 2009),
160   changes in the reference points due to relocation of benchmarks, or man-made changes of the tide-gauge surroundings, such
      as coastal or port development. Examples, for the case of the Kronstadt gauge, are described in Bogdanov et al., (2000).
      Phenomena occurring on timescales of years to decades, such as subsidence, for example, the sinking of piers due to unstable
      foundations, or land sinking due to groundwater or gas extractions, can be other sources of uncertainties (Hünicke et al., 2015).
      Subsidence can further result from processes such as compaction of unconsolidated alluvial soils, oxidation of organic
165   materials, or increased surface load due to construction activities (e.g. Pelling and Blackburn, 2013).
      Radar satellite altimetry from different satellite missions is available continuously since 1991 (e.g., Schöne et al., 2010).
      Presently, the longest and most sound dataset is derived from a combination of the consecutive dual-frequency missions
      Topex/Poseidon, Jason-1, -2, and -3 (Legeais et al., 2018). The orbit repeats itself every 10 days allowing the construction of
      continuous time series since 1993. The missions form a pattern of ascending and descending orbits with an average cross-track

                                                                       7
170   distance of 100 km (at 60°N). Starting in 1991 with the European mission ERS-1 (followed by ERS-2, and the dual-frequency
      mission ENVISAT (ESA) and AltiKa (India/France)) the Baltic Sea is also mapped every 35 days with an average cross-track
      distance of 55 km (at 60°N). With the launch of ESA’s CryoSat-2 in 2010, a new altimetry concept was established using a
      synthetic aperture interferometric radar altimeter (SAR/SARin) to especially map ice parameters but also sea surface heights
      closer to the coastlines. In 2016 the European COPERNICUS program launched a mission on Sentinel-3A (followed in 2018
175   by Sentinel-3B) carrying forward the uninterrupted altimetry program with 27 day repeat periods. The recent launch of
      Sentinel-6A Michael Freilich in November 2020 will continue the important missions with unprecedented accuracy.

      2.1.2 Variability, change, and acceleration of Baltic Sea mean sea level

      Long-term changes of relative mean sea levels in the Baltic Sea are dominated by GIA, global sea level change, and other
      regional to local scale components and their interaction. This includes, for example, thermo- and halosteric contributions, or
180   effects from long-term changes in wind and surface air pressure, currents in the North Atlantic that affect large-scale sea level,
      or variations in freshwater input in the Baltic Sea (Figure 3).
      Global mean sea level rise since the beginning of the last century was estimated from tide gauge records with rates ranging
      between about 1–2 mm yr-1 (e.g., Oppenheimer et al., 2019). For the era of continuously operated satellite radar altimeters
      beginning in 1991, higher estimates ranging between about 3–4 mm yr-1 are reported (e.g., Nerem et al., 2018; Oppenheimer
185   et al., 2019). These trends cannot directly be compared because of the strong decadal variability inherent in the records (e.g.,
      Albrecht et al., 2011; Figure 5, right) and their different spatial representativeness. Since the majority of tide gauges is located
      at the coast, their data are more representative of coastal changes. Satellite data typically reflect open ocean changes and
      variability. Also, inhomogeneous data, comprising a few tide-gauge records in the 19th and early 20th centuries and satellite
      data with nearly global coverage in the 21st century, hamper quantification and comparability of trends (Jevrejeva et al., 2008).
190   For the Baltic Sea, an increase in absolute mean sea level of about 3.3 mm yr-1 was estimated based on available multi-mission
      1992–2012 satellite altimetry data (Stramska and Chudziak, 2013). This figure is broadly consistent with the global average
      rate over that period. Current (1993-2015/2017) altimetry-derived Baltic Sea mean sea level trends are still comparable with
      the global average (Madsen et al., 2019a; Table 1). Across, the Baltic Sea, the rates of absolute mean sea level rise vary between
      about 2-3 mm yr-1 in the southwestern parts and about 5–6 mm yr-1 in the northern parts for the period 1995-2019 (Passaro et
195   al., 2021; Figure 5, left).

                                                                        8
Figure 5: (Left) Trends in annual absolute mean sea level 1995-2019 derived from multi-mission satellite altimetry. Trends were
      provided by Baltic Seal (https://balticseal.eu). Data and methods are described in Passaro et al. (2021). [Redrawn and modified from
      Passaro et al. (2021)]. (Right) Time series of relative sea level trends in Warnemünde over successive 40-year periods; that is, the
200   trend in 2020 is representative for 1981-2020, the trend in 1980 for 1941-1980, etc. The orange line represents the median, the yellow
      area the 5-95% range of all 40-year trends. Note that the vertical land movement at Warnemünde is close to zero (0.55 ± 0.59 mm
      yr-1; estimate provided by https://www.sonel.org for the last about 11 years; accessed: 28. June 2021) [Redrawn and modified from
      https://sealevel-monitor.eu/].

      Relative mean sea level changes and their secular trends are strongly affected by vertical land movements and vary
205   considerably across the Baltic Sea. Geologically, the Baltic Sea region is divided into the uplifting Fennoscandian Shield in
      the North and the subsiding lowland parts in the South (Harff et al., 2007). Land uplift rates in the northern parts are in the
      order of several millimeters per year and are comparable to the climatically induced rates of sea level rise in the 21st century.
      Relative mean sea level trends in the Baltic Sea show a corresponding north-south gradient, reflecting these crustal deformation
      rates due to GIA: In the northern parts, relative mean sea level decreases with a maximum rate of about 8.2 mm yr-1 in the Gulf
210   of Bothnia (Hünicke et al., 2015). This corresponds to the area with maximum GIA-induced crustal uplift (Peltier, 2004;
      Lidberg et al., 2010). In the southern Baltic Sea, relative mean sea level increases at a rate of about 1 mm yr-1 with a gradient
      in a northeasterly direction (Richter et al., 2012; Groh et al., 2017). These findings are supported by numerous studies analyzing
      Baltic relative mean sea level trends on a national basis (Suursaar et al., 2006a; Dailidienė et al., 2012; Männikus et al., 2019).
      Different observation periods and analysis techniques hamper comparison to some extent. A more comprehensive figure on
215   Baltic sea level trends and variability was provided by Madsen et al. (2019a) who took a statistical approach to combine data
      from century-long tide gauge records with results from hydrodynamic modeling based on atmospheric reanalysis data, and
      compared the results with those from satellite altimetry records (Table 1). The analysis again emphasizes that the rate of sea
      level rise strongly depends on the period considered but that present-day rates are higher than previously observed. This is also
      supported by an analysis of trends over successive 40-year periods at the tide gauge Warnemünde that shows pronounced
220   variability in decadal sea level trends with present trends in the upper range of the observed values (Figure 5, right).

                                                                        9
Table 1: Rates of mean sea level rise for the Baltic Sea and estimated uncertainty (one standard deviation range) based on (Madsen
      et al., 2019a).
                                                                   Mean sea level rise                      Uncertainty
                                                                       (mm/year)                             (mm/year)
          Statistical model, 1900-1999                                     1.3                                  0.3
          Statistical model, 1915-2014                                     1.6                                  0.3
          Statistical model, 1993-2014                                     3.4                                  0.7
          Satellite data (CCI ), 1993-2015
                            1
                                                                           4.0                                  1.3
      1
          Here CCI refers to ESA Sea Level CCI ECV v2.0 (Quartly et al., 2017; Legeais et al., 2018)

      Atmospheric forcing in the form of wind and precipitation can affect the basin-average sea level through changes in the total
225   volume of water, but also the internal distribution of water volume within the Baltic Sea basin. Winds, and more particularly
      the strength of the westerly winds, modulate the exchange of water masses with the North Sea (Gräwe et al., 2019). During
      periods of weak or moderate wind conditions a two-layer system of in- and outflow prevails in the Danish Straits while during
      periods of strong winds in- or outflow occurs across the entire water column, the strength of which is controlled by the sea
      level gradient between the Kattegat and the western Baltic Sea (Sayin and Krauss, 1996; Stigebrandt, 1983; Mattsson, 1996).
230   The alignment of the prevailing wind directions in this region with the geographical orientation of the connecting straits
      between the Baltic and the North Seas favor such conditions in which stronger than normal westerly winds push water masses
      into the Baltic Sea, raising overall sea level and vice versa.
      On average, there is a strong salinity increase from the Northeast to the Southwest of the Baltic Sea. This gradient results from
      the along-basin separation between the main saltwater (Danish Straits) and freshwater (rivers discharging into the Gulf of
235   Finland and the Bothnian Sea) sources. It leads, through density, to a corresponding sea level gradient which, together with
      the volume of the freshwater input and the effects of the prevailing westerly winds, gives rise to a corresponding sea level
      variation of about 35–50 cm across the Baltic Sea (Ekman and Mäkinen, 1996). Kniebusch et al. (2019) showed that there is
      pronounced decadal variability in the freshwater forcing leading to a corresponding variability in the along-basin salinity
      gradient which in turn affects the sea level gradient. Over the period 1900-2008, Kniebusch et al. (2019) also detected a trend
240   in the salinity gradient but found the trend to be sensitive to the exact period chosen and small compared to the decadal
      variability. Likewise, precipitation anomalies affect the distribution of the Baltic mean sea level through corresponding
      changes in salinity and water density (Hünicke and Zorita, 2006). Presently no robust long-term trends in the freshwater budget
      are observed (Johansson, 2016; Rutgersson et al., 2014) that would add to presently observed rates of Baltic sea level change.
      The relation between Baltic sea level variability with the state of the large-scale atmospheric circulation has been the subject
245   of numerous studies (Kahma, 1999; Johansson et al., 2001; Lehmann et al., 2002; Dailidiene et al., 2006; Hünicke and Zorita,
      2006; Suursaar et al., 2006a; Johansson and Kahma, 2016; Chen and Omstedt, 2005, 2005; Omstedt et al., 2004). Mostly, these

                                                                           10
studies focused on relations between the NAO 1 and Baltic sea level. Generally, the positive phase of the NAO is associated
with enhanced westerly winds over the Baltic Sea area which causes sea level to rise. Correlations strongly vary by region
with higher values in the northern and the eastern parts and smaller values in the southern parts of the Baltic Sea. Moreover,
250 the magnitude of the correlations is not constant but changed over the 20th century, including both, periods with very high and
very low values (Figure 6). This suggests that the state of the NAO is a good but, for some periods, not the optimal indicator
to describe Baltic sea level variability associated with the atmospheric circulation. Based on that finding Karabil et al. (2018)
suggested an alternative pattern based on the pressure differences between the Bay of Biscay and Tromsø. Correlations between
this new index and Baltic sea level variability were found to be more stable, suggesting that this index is better suited to
255 describe the parts of Baltic sea level variability associated with the large-scale atmospheric circulation (Figure 6). Similar to
the NAO this new index exhibits pronounced interannual and decadal variability over the past about 120 years but does no
show a significant long-term change (Karabil et al., 2018).
Figure 6: (Left) Correlation between the NAO/the new index (BANOS) and winter mean sea level at Stockholm (STO), Warnemünde
(WAR), and Cuxhaven (CUX) together with the correlation between both indices. (Right): Correlation maps for the periods when
260 the correlation between the NAO and sea-level variability were minimum (top) and maximum (bottom). The two white points in the
bottom panel were used to construct the new BANOS index. Reproduced from Karabil et al. (2018). Distributed under a CC-BY
license.
The contribution of the different mechanisms behind current sea-level trends can be also estimated from the analysis of
simulations with regional ocean models driven by observed atmospheric and global mean sea level forcing (Gräwe et al.,
265 2019). This approach has the advantage that the effects of land movement on the Baltic sea level are explicitly neglected so
that the contribution from other factors can be disentangled. In the simulation of Gräwe et al. (2019), the Baltic sea level rose
at a rate of about 2 mm yr-1 over the past 50 years, a rate that is slightly larger than the global average. Most of this sea level
rise in the Baltic Sea was caused by a corresponding increase of sea level in the North Atlantic Ocean. Model results along
1
The North Atlantic Oscillation (NAO) basically describes a meridional pattern in sea level pressure (SLP) with higher than
normal SLP around the Azores and lower than normal SLPs over Island and vice versa. Variability of this pattern is physically
linked to the intensity of the westerlies in the European region.
11with data from Latvian waters (Männikus et al., 2020) further suggest a heterogeneous pattern of sea level rise, with larger
270 rates in the northern and smaller rates in the southeastern Baltic Sea that appears to be the result of a poleward shift of
atmospheric pressure systems (Gräwe et al., 2019).
For the future, global mean sea level rise is expected to have the largest impact on future Baltic sea level changes
(Grinsted, 2015; Hieronymus and Kalén, 2020). It is expected, that most of the future Baltic absolute sea level rise will
be strongly linked with corresponding large-scale changes in the North Atlantic and the factors modulating these
275 changes. These factors are mainly the thermal expansion of the water column, contributions from melting of the
Antarctic ice sheet (Grinsted, 2015), and imprints from the variability and change of the Atlantic Meridional
Overturning Circulation (Börgel et al., 2018).
For absolute sea level trends, the relative contribution from future melting of the Greenland and Antarctic ice sheets is the
major source for spatial variations across the Baltic Sea. Melting of ice from the large ice sheets leads to changes in the Earth’s
280 gravitational field, rotation, and crustal deformation the patterns of which are called sea level fingerprints (Plag and Jüttner,
2001). For any given place on Earth, these fingerprints are specific to the location of the ice melt. Baltic sea level is substantially
more sensitive to melting from Antarctica than from Greenland. For example, if an ice volume melts from Antarctica that is
equivalent to an increase of the global mean sea level of 10 cm, the increase of the absolute mean sea level in the Baltic Sea
would be about 11 cm (+10%). If the same volume melts from the Greenland ice sheet, the response of the Baltic Sea level
285 would be smaller and spatially more heterogeneous. Here the values would vary around zero such that the southern Baltic Sea
would experience an increase in absolute sea level of about 2 cm (20% of the globally averaged sea level rise from Greenland
melting), while the northern Baltic Sea would expect a corresponding sea level fall (Hieronymus and Kalén, 2020).
For the Swedish coast, Hieronymus and Kalén (2020) provided sea level projections accounting for such variations. When
compared to earlier estimates, this resulted in lower projections in 2100. However, as more recent estimates of potential future
290 contributions from Antarctic melting increased (Oppenheimer et al., 2019), Hieronymus and Kalén (2020) found their
projections still being broadly consistent with earlier estimates, because their more careful treatment of spatial inhomogeneities
was balanced by the larger estimates for Antarctic melting.
Stronger winds and increased run-off can further contribute to future Baltic sea level rise in the order of some cm
(Meier, 2006; Hünicke, 2010; Johansson, 2014; Karabil, 2017; Pellikka et al., 2018). Future changes in the Baltic Sea
295 freshwater budget may also affect the regional distribution of Baltic mean sea level (Hünicke et al., 2017). If present
links between atmospheric forcing and Baltic mean sea level are extrapolated into the future, their contribution to future
Baltic mean sea level can be estimated from climate projections. Presently such contributions are thought to be minor
(Weisse and Hünicke, 2019). As GIA continues and will persist to dominate relative mean sea level changes in the
northern parts of the Baltic Sea, these areas are expected to see a continued, although decelerated, decrease in relative
300 mean sea level in the future, while the southern parts are expected to experience a relative mean sea level rise slightly
exceeding the global average (Räisänen, 2017).
12One of the expected implications of anthropogenic climate change would be an acceleration in sea level rise over time.
So far, global mean sea level rise seems to have accelerated over the 20th century (Nerem et al., 2018; Oppenheimer et
al., 2019; Dangendorf et al., 2019) although there is still ongoing debate (Kleinherenbrink et al., 2019; Veng and
305 Andersen, 2020). Robust detection of acceleration is to some extent hampered by changes in the measurement system:
While most of the data over much of the 20th century originate from coastal tide gauges mostly in the Northern
Hemisphere, since 1991 satellite altimetry provides a nearly global figure mostly from the open ocean. Differences in
estimates of satellite intra-mission biases also have substantial effects on estimated acceleration rates (Kleinherenbrink
et al., 2019). As tide gauges in the Baltic Sea provide some of the longest, best quality controlled, and more
310 homogeneous records, they may provide some support in assessing acceleration. From a statistical analysis of long
Baltic sea level records, Hünicke and Zorita (2016) could indeed detect an acceleration in sea level rise. While the tests
were not powerful enough to detect a significant acceleration in most of the records taken individually, results are
robust for the set of gauges against different definitions of acceleration. The overall magnitude of the acceleration is
small, and if continued unchanged over the whole 21st century, would add just a few centimeters to the sea level rise.
315 The latter is, however, unlikely as an increase in the acceleration of sea level rise is expected for the future, in particular,
when the large ice sheets melt more rapidly.
Acceleration of Baltic sea level rise also displays a spatial pattern with accelerations in the northeastern parts three
times as large as those in the southwest. The spatial structure is compatible with what would be expected from an
expected deceleration of GIA. However, applying the theoretical deceleration calculated with models of the dynamics
320 of the Earth's crust (Spada et al., 2014) the resulting order of magnitude is still too small to explain the apparent
acceleration of relative coastal sea level. It has to be kept in mind that most tide-gauges are affected by the rather strong
noise of local vertical movements, and thus the detection of a second-order change, like acceleration, is challenging.
2.2 Extreme sea levels and wind-generated waves
2.2.1 Sources of data
325 Sea level extremes are measured using the same primary devices as for mean sea level; that is, tide gauges and radar altimetry.
For wind waves, also data from visual observations, wave buoys, or radars mounted on platforms are common. Spatial coverage
of instrumental wave measurements in the Baltic Sea is scarce and limited to a few regions. So far, no long-term data exists
from the central and eastern Baltic Proper and the Gulf of Riga (Suursaar et al., 2012). In the northern parts, measurements are
often limited to ice-free periods as buoys are usually removed during winter to prevent damage from ice. Homogeneity of data
330 can be problematic due to effects from the relocation of measurement sites or the replacement of instruments (Hünicke et al.,
2015). Wave data from measurements are often used in combination with reconstructions from numerical wave hindcasts
(Cieślikiewicz and Paplińska-Swerpel, 2008; Nikolkina et al., 2014; Björkqvist et al., 2018; Soomere et al., 2012), where they
provide a reasonable characterization of open sea wave fields.
132.2.2 Variability and change of Baltic sea level extremes and wind-generated waves
335 Baltic sea level extremes occur over a wide range of spatial and time scales. Contributions can arise from phenomena
acting at small scales, such as wind wave run-ups occurring at local scales with variations in the range of seconds, up
to phenomena such as variations in the volume of the entire Baltic Sea characterized by formation time scales of up to
a few weeks and even longer persistence (Soomere and Pindsoo, 2016). In between these ranges, other phenomena such
as storm surges contribute to sea level extremes. All these phenomena are generated mostly by meteorological and to
340 some extent by astronomical factors (Weisse and Hünicke, 2019). From a climate perspective, this indicates that any
relevant change in meteorological forcing may be associated with corresponding changes in Baltic sea level extremes.
The most prominent and most relevant phenomena contributing to sea level extremes in the Baltic Sea are storm surges,
wind waves, and a preconditioning that leads to increased water volumes and thus sea levels in the entire Baltic Sea
before the onset of a storm (Suursaar et al., 2006b; Madsen et al., 2015). Preconditioning is associated with periods of
345 prevailing westerly winds that increase the sea level gradient across the Danish Straits. In turn, the increased sea level
gradient leads to higher inflow and higher Baltic Sea water volumes (Samuelsson and Stigebrandt, 1996). While the
long-term average barotropic outflow from the Baltic Sea is about 7 km3 day-1 or 80.000 m3 s-1 (Winsor et al., 2001)
transports across the Danish Straits can reach values of up to about 45 km 3 day-1 in both directions, which corresponds
to a sea level change of about 12 cm day-1 over the entire Baltic Sea (Mohrholz, 2018). Major inflow events are
350 associated with typical volumes in the order of about 100 km 3, corresponding to a Baltic sea level increase of about 24
cm (Matthäus and Franck, 1992). Typically, such variations have time scales of about 10 days and longer (Soomere
and Pindsoo, 2016) while atmospheric variability on shorter time scales primarily leads to a redistribution of water
masses within the Baltic Sea basin (Kulikov et al., 2015) or between the Baltic Proper and the Gulf of Riga (Männikus
et al., 2019).
355 Storm surges refer to changes in sea level in coastal waters, caused primarily by strong onshore winds during storms
and secondarily by the action of spatially varying atmospheric pressure on the sea surface (Pugh and Woodworth, 2014)
and by wave set-up in specific locations (Soomere et al., 2013). They represent a substantial threat for the low-lying
coastal areas of the Baltic Sea, in particular in the southwestern parts (Wolski et al., 2014), the Gulf of Finland (Suursaar
and Sooäär, 2016; Averkiev and Klevannyy, 2010), the Gulf of Riga (Suursaar and Sooäär, 2016; Männikus et al.,
360 2019; Suursaar et al., 2006b), and the Gulf of Bothnia (Averkiev and Klevannyy, 2010). Comparing 50 years of hourly
sea level data from gauges across the entire Baltic Sea, Wolski and Wiśniewski (2020) showed that Pärnu in the Gulf
of Riga and Kemi in the Gulf of Bothnia are particularly prone to storm surges. In their analysis, these two gauges were
characterized by both, the highest average number of surges per year and the highest average number of hours per year
with extreme sea levels. Regarding height, a surge in November 1824 in the Gulf of Finland was responsible for the
365 highest recorded water level in the Baltic Sea (4.21 m above tide gauge zero in St. Petersburg, Wolski and Wiśniewski,
2020). In the western Baltic Sea, a storm in November 1872 caused water levels to exceed 3 m at many gauges (Feuchter
14et al., 2013; Wolski and Wiśniewski, 2020). For the Gulf of Riga/the western Baltic Sea, storm surge heights around 2
m/1–1.5 m are typical (Wolski and Wiśniewski, 2020).
Storm surges in the Baltic Sea can last from several hours to almost a day (Wolski and Wiśniewski, 2020). Because of
370 the seasonal cycle in wind speed, storm surges are highest and most frequent during fall and winter (Weidemann, 2014).
The presence of sea ice may substantially reduce the effectiveness of wind in generating storm surges. In winter in the
Gulf of Bothnia, the piling-up of water is strongly suppressed by the existence of sea ice (Zhang and Leppäranta, 1995).
When preconditioning exists, that is high Baltic Sea water volumes, even moderate wind and wind surges may lead to
coastal sea level extremes (e.g., Weisse and Weidemann, 2017).
375 Wind waves in the Baltic Sea show a pronounced seasonal cycle, with higher values in winter and smaller values in
summer. This behavior is associated with a corresponding seasonal cycle in wind speed (Björkqvist et al., 2018) and
leads to extensive variations in the wave energy flux (Soomere and Eelsalu, 2014). Generally, waves are higher in open
waters than in coastal waters. To date, the highest measured waves in the Baltic Sea were reported from a wave buoy
in the northern Baltic Proper. During a storm in December 2004, this buoy recorded a significant wave height of 8.2 m
380 (Björkqvist et al., 2018; Tuomi et al., 2011). During windstorm Gudrun in 2005, measured significant wave heights
reached 7.2 m in the Baltic Proper and 4.5 m in the Gulf of Finland. For this storm and away from sensors, model
simulations suggested the existence of extreme significant wave heights of up to 9.5 m off the northwestern coast of
Latvia (Soomere et al., 2008). More recently, very high waves with significant wave heights up to 8.1 m were also
recorded in the Sea of Bothnia (Björkqvist et al., 2020). However, in the Bothnian and the northern Baltic Seas, the
385 seasonal presence of sea ice typically modifies the wave climate and limits wave heights during the freezing season
(Tuomi et al., 2011).
In the coastal zone, the height of the wave extremes is considerably smaller, but other wave-related processes such as
wave set-up or run-up (swash) can make substantial contributions to short-term sea level extremes. Wave set-up refers
to a wave-induced increase in the mean water level caused by the release of momentum from the dissipation of a long
390 sequence of breaking waves and swash is caused by the run-up of single waves on the beach (Melet et al., 2018). For
example, for some coasts in the Gulf of Finland (Soomere et al., 2013; Soomere et al., 2020) and along the shores of
the West Estonian archipelago (Eelsalu et al., 2014) potential wave set-up may reach values of up to 70–80 cm.
Moreover, the shape of the shoreline and irregular bottom topography can strongly modify local wave conditions
(Tuomi et al., 2012; Tuomi et al., 2014), and wave set-up and run-up may both have a strong influence on the level of
395 the flooding and erosion at the shore (Dean and Bender, 2006). Coastal wave climate, its impacts, and its long-term
changes thus strongly depend on location.
Changes in the Baltic Sea volume, storm surges, and extreme sea levels are tightly coupled. As increased volumes
provide preconditioning for extremes in the entire sea (Pindsoo and Soomere, 2020), higher Baltic Sea volumes
generally lead to higher extremes under otherwise similar storm conditions (Weisse and Weidemann, 2017). More
15400 specifically, westerly storms not only cause surges on the eastern Baltic Sea coast but also increase the volume of the
sea. During subsequent storms, extreme sea levels are then higher than without preconditioning.
Two other noticeable effects may further contribute to Baltic sea level extremes: seiches and meteotsunamis. In the
Baltic Sea, seiches with periods of up to tens of hours and e-folding times of up to two days may develop under certain
atmospheric conditions (Leppäranta and Myrberg, 2009). Details of these oscillations are debated and are still not fully
405 understood. From numerical studies, Wübber and Krauss (1979) proposed a series of basin-wide seiches with periods
of up to 31 hours. Other authors argued that the existence of such basin-wide oscillations is not entirely supported by
data. They suggested, that such sea level oscillations in the Baltic Sea could alternatively be considered as an ensemble
of weakly coupled local seiches with periods between 17 and 27 hours in the Gulf of Riga, the Gulf of Finland, and the
Belt Sea (Jönsson et al., 2008). Oscillations with similar periods also occur in the West Estonian archipelago (Otsmann
410 et al., 2001). For the Gulf of Riga Suursaar et al. (2002) also note the existence of a five-hour barotropic seiche. When
favorably coupled with storm surges or in resonance with atmospheric forcing, such oscillations may contribute to very
high sea level extremes at the coast (Suursaar et al., 2006a; Weisse and Weidemann, 2017; Wolski and Wiśniewski,
2020). Meteotsunamis are generated by moving atmospheric disturbances that trigger resonant sea level fluctuations.
While not extremely frequent in the Baltic Sea, cases were described by Pellikka et al. (2014; 2020) for the Gulf of
415 Finland or by Holfort et al. (2016) for the western Baltic Sea. Amplitudes may be in the order of one meter (Pellikka
et al., 2014; 2020).
The contribution from tides to the height of Baltic sea level extremes is mostly small as the connection to the open
ocean and thus co-oscillation is limited. Overall, tidal ranges are mostly between about 2 and 5 cm (Witting, 1911 as
cited in Leppäranta and Myrberg, 2009). In the western sea areas, tidal ranges of up to 10–30 cm are observed (Defant,
420 1961 as cited in Leppäranta and Myrberg, 2009). Due to resonance, tidal ranges of up to 20 cm are also found near St.
Petersburg at the end of the Gulf of Finland (Medvedev et al., 2013). While co-oscillation is limited, locally generated
tides, albeit small, may also contribute in the same order of magnitude at some places (Schmager et al., 2008). In the
western Baltic Sea, tidal conditions are predominantly semi-diurnal while in the Gulf of Finland and the Gulf of Riga,
diurnal tides prevail (Medvedev et al., 2013; Schmager et al., 2008). While tidal ranges are generally small, they still have
425 noticeable effects on the return periods of sea level extremes (Särkkä et al., 2017)
Variability and long-term changes in Baltic extreme sea levels can occur for various reasons but are primarily linked
to changes in relative mean sea level and atmospheric conditions. Relative mean sea level changes will modify the base
upon which other atmospheric drivers of extremes will act although the response is not necessarily linear (e.g. Arns et
al., 2015). For example, for the same wind field, and hence surge levels, higher extremes are expected under higher
430 relative mean sea levels. Also, changes in the driving atmospheric conditions will lead to changes in the statistics of
waves, surges, etc. which in turn will affect the sea level extremes. Moreover, non-linear interaction between the
contributions, potentially non-stationary behavior of the population of extremes (Kudryavtseva et al., 2018), and local
16effects such as from bathymetry or the shape of the coastline can make overall effects on sea level extremes highly
non-additive (e.g., Arns et al., 2015).
435 Based on tide gauge data and for different periods, several studies revealed trends in Baltic sea level extremes. These
trends were found to originate mainly from a corresponding change in mean sea level (Marcos and Woodworth, 2017;
Ribeiro et al., 2014; Barbosa, 2008) or the increase in the magnitude of the preconditioning (Soomere and Pindsoo,
2016; Pindsoo and Soomere, 2020). For the periods from 1960 onwards Marcos and Woodworth (2017) showed that
the height and duration of sea level extremes increased/decreased at sites with increasing/decreasing relative mean sea
440 level and that these trends mostly disappear when the mean sea level signal is removed. Only for some of the eastern
and northernmost stations, trends indicate some contribution from corresponding changes in the large-scale atmospheric
circulation and regional wind patterns (Barbosa, 2008; Ribeiro et al., 2014). Using data from a hindcast simulation
ignoring GIA, Pindsoo and Soomere (2020) found increases in the height of Baltic sea level extremes for the period
1961-2004/2005. These increases were strongest in the Gulf of Finland, the Gulf of Riga and, the eastern Baltic proper
445 (Figure 7). Pindsoo and Soomere (2020) concluded that the increases along the Swedish coast and the Gulf of Bothnia
were almost entirely a result of global mean sea level rise and an increase in the maximum water volume of the entire
sea. On the other hand, they noted substantial contributions from stronger local storm surges to explain the higher
values along the eastern shorelines.
450 Figure 7: Trends of storm-season (from July to June of the subsequent year) maximum water level derived from simulated total
water level in 1961–2004/2005. Reproduced from Pindsoo and Soomere (2020) with permission from Elsevier and the authors.
17Long-term changes in the wave climate may further contribute to changing extremes through corresponding adjustments
of wave transformation in the surf zone (e.g., wave set-up and swash). So far, there is no conclusive large-scale figure
but results vary strongly depending on period and region. For the Arkona Basin, Soomere et al. (2012) analyzed wind
455 wave variability and trends based on 20 years of observation and a 45-year wave hindcast. They concluded that the
wave height in this area exhibits no long-term trend but reveals modest inter-annual and substantial seasonal variations.
For shorter periods (1993-2015), estimates from satellite altimetry data suggest a slight increase in annual mean
significant wave height in the order of 10% (about 12 cm or 0.005 m yr -1). Spatially, wave height increased in the
central and western parts of the sea and decreased in the eastern parts (Kudryavtseva and Soomere, 2017). Nikolkina
460 et al. (2014) analyzed a multi-ensemble wind wave hindcast covering the entire Baltic Sea using different atmospheric
forcing and periods (1970–2007 and 1957–2008). While these authors found the hindcasts consistently describing the
known spatial patterns with relatively severe wave climate in the eastern parts of the Baltic proper and its sub-basins
they could not infer consistent conclusions on long-term changes mainly due to differences in the atmospheric forcing
used in the model simulations.
465 As for mean sea level, extreme sea levels are linked and correlated with the large-scale atmospheric circulation and its
variability. Often, the NAO is used to characterize the state and the variability of the large-scale atmospheric circulation
(Johansson, 2014; Marcos and Woodworth, 2018). There are several mechanisms that contribute to the link between
Baltic sea level extremes and the NAO. The positive correlation between the phase of the NAO and mean sea level in
the northwestern European shelf seas (Woolf et al., 2003) suggests that higher than normal mean sea levels occur during
470 positive phases of the NAO. This would lead to an increase in the baseline sea level upon which wind- and pressure-
induced extremes will act. In addition, there is also a positive relationship between the phase of the NAO and the
frequency of westerly winds. Increased frequencies of westerly winds may lead to on average higher-than-normal water
volume in the Baltic Sea, which again would increase the baseline. Eventually, potential relationships between changes
in the NAO and regional wind patterns would contribute to corresponding changes in wind-surges and waves.
475 Using tide gauge data, Johansson (2014) and Marcos and Woodworth (2018) showed that the positive correlation
between the NAO and Baltic sea level extremes persisted even when long-term mean sea level changes were removed.
This indicates that the NAO influences on Baltic sea level extremes are not only limited to the effects of changes in the
mean but have contributions from NAO effects on Baltic Sea volume and/or locally generated wind surges and waves.
This conclusion was further supported by a model study in which a coupled North and Baltic Sea model was forced
480 solely by wind and sea level pressure from 1948–2011, thereby explicitly excluding effects from global mean sea level
rise and rising temperatures (Weidemann, 2014). In this experiment, periods of high water volume in the Baltic Sea
occurred more often during positive NAO phases and vice versa, and lower wind speeds were generally needed to
sustain higher sea level extremes when the volume was above normal (Weisse and Weidemann, 2017).
Future changes in sea level extremes in the Baltic Sea crucially depend on two factors: future changes in relative mean
485 sea level and future developments in large-scale atmospheric conditions associated with changing wind patterns. For
18some regions, changes in the frequency or thickness of sea ice may also have an impact. Relative sea level changes will
strongly vary across the Baltic Sea because of the existing spatial gradient in GIA and the spatial inhomogeneity
associated with the uncertain relative contributions of melting from Antarctica and Greenland (see section 2.1.2). For
the Baltic Sea, changing mean sea levels are expected to have larger effects on future extremes than changing
490 atmospheric circulation (Gräwe and Burchard, 2012). GIA is expected to continue at rates similar to that observed over
the last century. Absolute mean sea levels are expected to rise in the entire Baltic Sea, but exact rates are uncertain and
depend on models, scenarios, and periods considered (Grinsted, 2015; Hieronymus and Kalén, 2020, see also discussion
in section 2.1.2).
Potential future changes in long-term mean and extreme wind speeds are highly uncertain (Räisänen, 2017). In the fifth
495 assessment report of the Intergovernmental Panel on Climate Change (IPCC), a poleward shift of Northern Hemisphere
mid-latitude storm tracks and an ensemble average increase in the NAO index are reported as possible future
developments (Kirtman et al., 2013). Because of the large internal variability together with the large variability among
models and scenarios, there was, however, only medium confidence in these projected changes (Kirtman et al., 2013).
Recent studies indicate, that the poleward shift of the westerlies is most pronounced in summer and less obvious in
500 other seasons (Zappa and Shepherd, 2017). Because storm surges in the Baltic Sea are primarily a winter and fall
phenomenon, this implies that contributions from changes in atmospheric circulation to future Baltic Sea storm surge
climate remain uncertain. This is in agreement with climate model simulations investigated for the Second Assessment
of Climate Change for the Baltic Sea Basin (BACC II Author Team, 2015) that were highly inconsistent for projected
changes in wind speeds at the end of the 21st century (Christensen et al., 2015; BACC II Author Team, 2015).
505 Despite these uncertainties, some storm surge and wind wave projections seem to report relatively robust changes
towards 2100. Using data from a multi-model ensemble, driven with atmospheric data from eight different climate
models and the two emission scenarios RCP4.5 and RCP8.5, Vousdoukas et al. (2016) projected an increase in storm
surge heights in the order of about 5-10% across the entire Baltic Sea towards the end of the twenty-first century. For
wind waves, Groll et al. (2017) reported an increase of about 5-10% in mean and extreme wave heights using data from
510 two realizations of two emission scenarios. On the other hand, using a substantially larger ensemble consisting of data
from six climate models and three emission scenarios Dreier et al. (2021) found no consistent long-term changes in
wave climate along the German Baltic Sea coast, and their projected changes in extreme wave height varied between
about -10% and +6%. This again suggests that projections of future wind waves and storm surges in the Baltic Sea are
still highly dependent on the atmospheric scenario, climate model, and realization used for the projection. Nevertheless,
515 because of the larger effect of changing mean sea levels on the extremes, regions with expected increases in relative
mean sea level are still highly likely to experience an increase in sea level extremes.
192.3 Coastal erosion and sedimentation
2.3.1 Sources of data
Coastal erosion and sedimentation, and longer-term shoreline changes tend to be researched at local, sediment compartment,
520 or regional scales, where particular combinations of wind, wave, sediment characteristics and availability, and sea level
variations and extremes at a range of scales can be considered. Generally, remote sensing data have been widely applied to
investigate coastline change at various spatial and temporal scales. Different sources of remote sensing data include satellite
images (e.g., Tiepold and Schuhmacher, 1999), aerial photographs (e.g., Furmanczyk et al., 2011; Dudzinska-Nowak, 2017),
terrestrial (Eelsalu et al., 2015) and air-born laser scanning data (e.g. Hartleib and Bobertz, 2017), and orthophoto maps (e.g.,
525 Zhang et al., 2017; Dudzinska-Nowak, 2017). Such data were used, for example, to quantify the rates of coastline change over
the past decades along the sandy southern Baltic Sea coast and more recently for the Russian waters (Ryabchuk et al., 2020).
Also, historical maps with scales between 1:250000 and 1:5000 dating back to the 1820s have provided useful information on
the coastline change of the Baltic Sea at a longer time scale (Deng et al., 2017a; Hartleib and Bobertz, 2017). As tides are
small in the Baltic Sea, the baseline of the seaward-most foredune or cliff, which represents the cumulative effect of deposition
530 or erosion, has been used as an indicator to quantify coastline change (e.g., Dudzinska-Nowak, 2017; Zhang et al., 2015).
2.3.2 Variability and change of erosion and sedimentation
The Baltic Sea region can be geologically divided into the uplifting Fennoscandian Shield in the North and the subsiding
lowlands in the South (details see Fig. 2.8 in Harff et al., 2007). Coastline change is characterized by a corresponding
north-south gradient (Figure 8) along which the main driving force gradually shifts from GIA to atmospheric and
535 hydrodynamic forcing. Vertical land movement ranges from uplifts of up to almost 9 mm yr -1 in the North to subsidence
of up to 2 mm yr -1 in the South. Since the onset of the Holocene, these vertical movements have caused a persistent
marine regression at the northern coasts and a marine transgression along the southern coasts of the Baltic Sea (Harff
et al., 2007; 2011). The transitional area between the northern uplift and the southern subsidence is located at the
southern coast of the Gulf of Finland (Rosentau et al., 2017).
20You can also read