Self induced consensus of Reddit users to characterise the GameStop short squeeze
←
→
Page content transcription
If your browser does not render page correctly, please read the page content below
www.nature.com/scientificreports
OPEN Self‑induced consensus of Reddit
users to characterise the GameStop
short squeeze
Anna Mancini1,2,5, Antonio Desiderio1,2,5, Riccardo Di Clemente 3,4*
& Giulio Cimini 1,2*
The short squeeze of GameStop (GME) shares in mid-January 2021 has been primarily orchestrated
by retail investors of the Reddit r/wallstreetbets community. As such, it represents a paramount
example of collective coordination action on social media, resulting in large-scale consensus formation
and significant market impact. In this work we characterise the structure and time evolution of
Reddit conversation data, showing that the occurrence and sentiment of GME-related comments
(representing how much users are engaged with GME) increased significantly much before the
short squeeze actually took place. Taking inspiration from these early warnings as well as evidence
from previous literature, we introduce a model of opinion dynamics where user engagement can
trigger a self-reinforcing mechanism leading to the emergence of consensus, which in this particular
case is associated to the success of the short squeeze operation. Analytical solutions and model
simulations on interaction networks of Reddit users feature a phase transition from heterogeneous to
homogeneous opinions as engagement grows, which we qualitatively compare to the sudden hike of
GME stock price. Although the model cannot be validated with available data, it offers a possible and
minimal interpretation for the increasingly important phenomenon of self-organized collective actions
taking place on social networks.
Online social media have revolutionized the way we interact with peers, share information and form o pinions1,2,
giving rise to new large-scale social phenomena: for instance, the spreading of fake n ews3,4, the formation of echo
chambers and polarized opinions5,6, the organization of collective actions—from the Arab S pring7 to climate
change protests8. Recently an online mass coordination on r/wallstreetbets (WSB), a community of the social
media platform Reddit, was able to trigger a short squeeze of GameStop shares with a large impact on financial
markets9.
Reddit is a public discussion website whose users interact with each other by submitting new posts and add-
ing comments to existing posts or comments, thus creating tree-structured conversation threads. The forum
is organised into various independent subreddits, each dedicated to a specific topic. The subreddit WSB is a
community where users (retail investors but also non-skilled traders who use no-commission mobile apps such
as robinhood.com) discuss trading strategies and share their gains and losses. The hallmarks of WSB are the
irreverent jargon and edgy humor used in c onversations10, as well as the gambling attitude of its users who yet
seem to give good investment a dvice11. The popularity of this forum has steadily increased in recent years and
has exploded after the events of the GameStop saga.
GameStop (NYSE:GME) is a US video game retailer which was struggling in recent years due to competition
from digital distribution services as well as economic effects of the COVID-19 pandemic. As a result GME stock
price declined (reaching an all-time low of $2.57 on April 3, 2020), leading many hedge funds to short sell the
stock—meaning they would profit from its further decrease in price. On the contrary WSB users, likely driven by
the opportunity to make profit and possibly anger towards institutional i nvestors12, coordinated with the intent
to trigger a short squeeze, i.e., a rapid increase in the stock price due to the excess of demand and lack of avail-
ability. The resulting large-scale mass coordination (buying and holding GME shares) succeeded in driving up
the price of GME, attracting even more users and forcing short sellers to cover their positions at large losses, thus
further promoting the price rally. On January 28, 2021 GME shares reached an astounding high price of $483.00;
more than 1 million of its shares were deemed failed-to-deliver, which sealed the success of the short squeeze.
1
Physics Department and INFN, Unversità di Roma Tor Vergata, 00133 Rome, Italy. 2Centro Ricerche Enrico
Fermi, 00184 Rome, Italy. 3Department of Computer Science, University of Exeter, Exeter, UK. 4The Alan Turing
Institute, London NW12DB, UK. 5These authors contributed equally: Anna Mancini and Antonio Desiderio. *email:
r.di-clemente@exeter.ac.uk; giulio.cimini@roma2.infn.it
Scientific Reports | (2022) 12:13780 | https://doi.org/10.1038/s41598-022-17925-2 1
Vol.:(0123456789)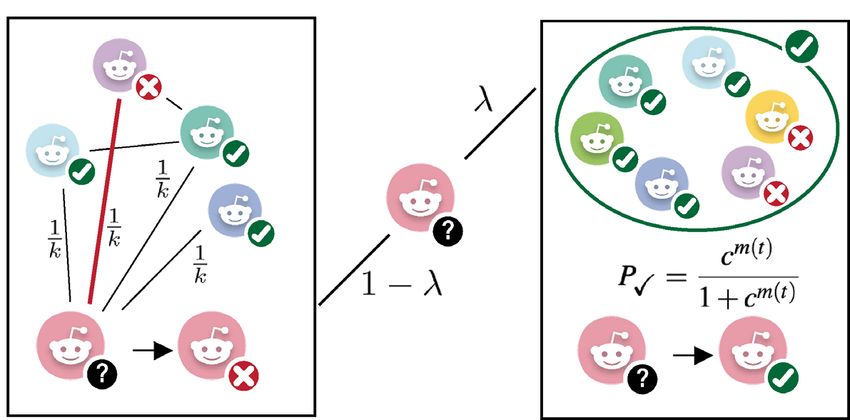
www.nature.com/scientificreports/
Such a highly coordinated financial ‘operation’ received a huge attention not only from the media and finan-
cial stakeholders, but from the academic community as well. Following a popular stream of literature aimed at
predicting stock market trends using social network m oods13,14 (with a recent focus on WSB and price move-
ments of cryptocurrencies15–17), most of the scholars’ attention has been devoted to understanding whether WSB
activity, conversation sentiment and user interactions could be used to predict retail trading activity and GME
returns, using linear regression models or machine-learning approaches18–24. Only a few empirical works address
the more fundamental question of how coordination or consensus could spontaneously emerge in this context.
Boylston et al.10 show that the jargon and humor of WSB members is a way to express and reinforce the com-
munity’s sense of identity. Semenova and W inkler24 find empirical evidence of psychological contagion among
WSB users, where an initial set of investors attracts a larger and larger group of excited followers—net of any
fundamental price movements. Lucchini et al.25 measure the growing user commitment to the GME operation
and social identity of WSB participants, describing the key role of a committed minority of users in triggering
the collective action. Anand and P atak19 go along the same line showing that it was a tiny minority of 462 most
influential subredditors whose posts most impacted the GME stock price.
In this paper we provide new empirical evidence on how consensus on the GME operation emerged in the
WSB community. We analyse discussions on WSB from September 01, 2019 to February 01, 2021 (see “Meth-
ods”), characterising how the forest of tree-like conversation threads grew as the GME saga unfolded. We measure
user engagement towards GME through the occurrence and mean sentiment of GME-related conversations.
These variables increased significantly far before January (in particular, the frequency of GME in conversations
peaks in correspondence to the major events in the GameStop saga) and thus provide early signs of the collec-
tive action.
All these empirical evidences suggest that an endogenous and self-reinforcing effect played a fundamental role
in triggering consensus formation on the GME operation. A possible way to include this mechanism in classical
models of opinion dynamics26–30 is through a self-induced global field that drives users towards collective unity31.
However, existing models that couple peer interaction to community-wide effects typically consider the presence
of external fields acting in the same way on all (or groups of) users, describing the effect of conventional media
or other exogenous factors32–34. Other models use endogenously-generated fields that align the user opinion with
the one held more frequently in the past, in order to mimic the effect of recommendation systems on opinion
formation35. Instead, in order to model opinion formation within the GameStop saga, we assume that a high
and widespread engagement with the GME collective operation increases the likelihood that users themselves
become committed and will actively participate to the short squeeze—since its success strongly depends on the
number of participants.
Therefore we propose to model opinion dynamics in this scenario considering that users form their opinions
either by interacting with peers or by following a global field, which is self-induced by the current status of the
community and whose strength is determined by the mean level of user engagement. Analytical mean-field
solutions of the model display a phase transition from a disordered state (where no opinion prevails) to full
consensus as user engagement grows. Model simulations on statistically validated social networks of WSB users,
extracted from their ‘reply-to’ interaction patterns, feature a broader transition that implies a non negligible level
of consensus even when engagement is low. However the transition becomes abrupt when, as data suggests, the
community grows together with the level of consensus reached.
Unfortunately, to fully validate the model we would need access to confidential information on actual pur-
chases of GME shares by WSB users, that existing laws prohibit to collect. Therefore the model stands as a mini-
mal yet solvable framework that offers only a possible way to qualitatively reproduce the explosive dynamics of
the GameStop event. Nevertheless the assumption of a self-induced field, which is supported by the empirical
analysis, leads to a spontaneous phase transition from disorder to order, which is seldom found in models of
opinion dynamics.
Results
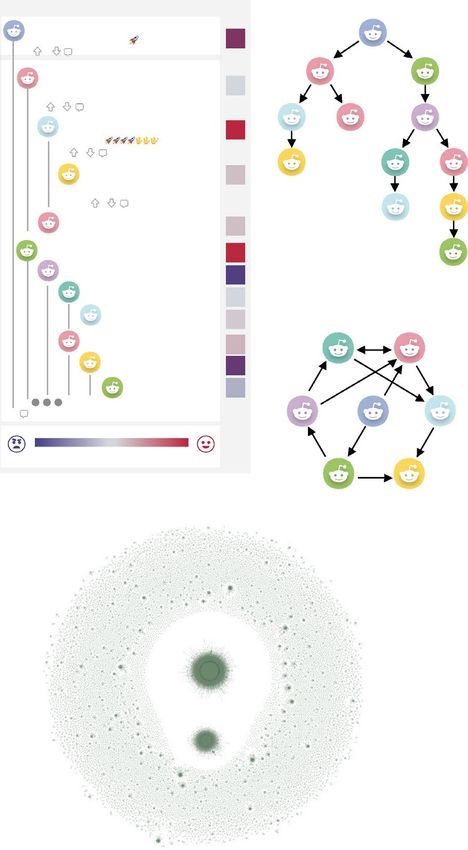
Reddit conversation patterns. Figure 1A shows the typical structure of a Reddit post with the comment
section underneath. Figure 1B highlights how this structure can be translated into a forest of trees: each post
corresponds to the root of a tree, while comments to this post or to other comments in the same thread repre-
sent the tree branches. Figure 1C shows how these trees can be used to extract a network of user-user ’reply to’
interactions (which we shall discuss later on). Visual inspection of daily forests, each containing all trees rooted
in posts published on the given date, gives a first idea of how the structure of WBS conversations looks like
and how it has evolved over time. Figure 1F shows the forest of Jan 21, 2021—the day before the short squeeze
was initiated, while Fig. 1G shows the forest of March 19, 2020, when WSB was not as popular and its activity
much less intense. We see how the daily forest has grown substantially in terms of overall number of comments
as well as number and size of trees. Note in particular how each daily forest is characterized by a giant tree: the
Daily Discussion Thread, created with the purpose of summarizing the events of the day and planning future
actions10, where users are encouraged to comment by WSB rules. Other very large trees are often present, such
as What Are Your Moves Tomorrow, whereas the GME Mega-thread appears in the daily discussions of January.
Figure 1D shows the monthly histograms of the cumulative number of trees by size, whose power law trends end
at large sizes due to deviations produced by such mega-threads. Moreover, the overall number of conversation
trees grows in time. The reason is not only an increasing number of WSB users who join the discussion, but also
their increasing activity in terms of number of contributed posts or comments. This can be seen in the monthly
histograms of the cumulative number of users by number of contributions shown in Fig. 1E. In this plot, the area
under the curves that grows in time indicates an increasing number of active users, whereas the increasingly fat
Scientific Reports | (2022) 12:13780 | https://doi.org/10.1038/s41598-022-17925-2 2
Vol:.(1234567890)www.nature.com/scientificreports/
A B Comments’ Tree
D E
S
Cumulative Count (Users)
Cumulative Count (Trees)
User 0 Posted 01/Jan/2021 10:12 U
GME YOLO update (Shares ONLY) 0.8
300 Reply Share Report Save
U U
User 1 Posted 01/Jan/2021 10:30
'Drove by the GameStop in my Uber and the line was out the door, all of
them were shoeshine boys and they yelled at me to buy GME, then yelled 0.0
“short squeeeeeeze”
1 Reply Share Report Save
U U U
User 2 Posted 01/Jan/2021 10:41
'I am putting all of the money If not, go all in on GME. No other stock 0.9
has this potential.'
2 Reply Share Report Save
U U U
User 3 Posted 01/Jan/2021 14:12
'I see a pattern, where people invest in everything AFTER the
0.1
bus has left. GME, PLTR, CRSR
5 Reply Share Report Save U U
User 1 Posted 01/Nov/2020 14:12
0.2
User 4 U
C Users’ Interaction
0.7
User 5
-0.8 Number of Vertices Number of Comments
User 6
User 2
0.0
-0.1 Network F
User 1
0.2 U U
User 3
-0.5
User 4 -0.3 Daily Discussion
125,341 Comments
U U U Thread
Sentiment Score
S
U U
Negative Positive
GME Megathread
G
Daily Discussion
Thread
What Are Your
What Are Your
Moves Tomorrow
Moves Tomorrow
Figure 1. Tree structure of Reddit conversations. (A) Reddit users can write posts to initiate a conversation and
can comment (reply) to posts or other comments. A sentiment score between −1 and +1 (negative and positive,
respectively) can be computed for each post and comment. (B) The conversation on the social network can
be represented by a forest of trees, where each post is the root of a tree and subsequent comments represent its
branches. (C) Trees can be used to extract a user-user network, where a link from user i to user j represents
the number of times i commented to posts/comments by user j. (D) Cumulative count of trees larger than a
given size (in terms of number of comments) for different months in the considered time span of data. (E)
Cumulative count of users that contributed more than a given number of posts/comments during different
months. (F, G) Sample representation of the forest of tree conversations for January 21, 2021 and March 19,
2020, respectively. Icons in (A–C) have been designed by Freepik. The schematic representation of a reddit
post in (A) has been recreated by the authors. The network representations on (F, G) have been created by the
authors using the software Gephi.
tail signals that these users are also contributing with more posts and comments. Further analyses on conversa-
tion trees are reported in the Supplementary Note 1.
Conversation content and sentiment. We now turn to the analysis of the content of WSB conversa-
tions and how it evolves in time. Since WSB is a community of users focused on trading, the occurrence of stock
tickers in the text of posts and comments represents a first indicator of what is a popular conversation topic.
The total number of occurrences for the various stock tickers follows a power law (Supplementary Note 2), with
some very large outliers—GME in particular is the most frequent one. In order to detect statistically significant
occurrences in time we compute their daily Z-scores (see “Methods”). Figure 2A shows the Z-scores for GME,
compared to the average Z-score of all t ickers36. We clearly see how the peaks given by significant Z-scores corre-
spond to major events of the GameStop saga: (2020-06-09) GME Q1 earning reports; (2020-09-21) RC Ventures
Scientific Reports | (2022) 12:13780 | https://doi.org/10.1038/s41598-022-17925-2 3
Vol.:(0123456789)www.nature.com/scientificreports/
A Volume Price GME in comments
Microsoft partnership
Average Z-Score std Z-Score
Citron prediction
Q1 GME earnings RC Ventures Q3 GME earnings GME New board
B Price Volume C
GME Price
GME comments
All tickers
Figure 2. Content and sentiment of WSB conversations across the GME saga. In the following plots we do
not consider daily data for weekends and US holidays, when activity on WSB is lower as the stock exchange is
closed. We also apply a 5-day moving average to the time series. (A) Z-score for the occurrences of ‘GME’ in
WSB conversations, compared to the mean Z-score for the occurrence of all stock tickers (shaded area). GME
peaks correspond to major events in the GameStop saga. We contextualize these events by also reporting the
Z-score of GME trading volumes and the closing price of GME shares. (B) For other three representative stocks
(AMC, MSFT, PLTR): Z-score of the ticker occurrences in conversations, Z-score of trading volumes and closing
price. (C) Mean sentiment (and standard deviation of the mean) of comments containing ‘GME’, with respect to
the same quantity computed on all comments. GME closing price is also reported for illustrative purposes.
increases its stake in GME to 9.98%; (2020-10-08) GameStop announces a multiyear strategic partnership with
Microsoft; (2020-12-08) GME Q3 earning reports, with 257% increase in e-commerce revenues; (2021-01-11)
GME announced a new Board of Directors; (2021-01-19) Citron Research predicted that GME’s price would fall
and belittled GME buyers on Twitter37. Notably these peaks become higher in time, signaling that the commu-
nity’s interest towards GameStop grows substantially until January, when GME monopolizes the conversation
on WSB. Additionally these peaks mostly coincide with those for the Z-score of GME trading volume (i.e., the
number of shares traded daily), pointing to a strong relation between the two variables. A similar but weaker sig-
nal can be found regarding conversations about other stocks, as shown in the examples reported in Fig. 2B. AMC
(AMC Entertainment Holdings Inc) is a penny stock that similarly to GME was suffering due to the COVID-19
pandemic and was then subject to a short squeeze in mid February 202118. This event is not covered by our data,
but we can already see a significant signal of AMC occurrences at the end of January. MSFT (Microsoft Corpora-
tion) is instead a more solid stock with a constant and regular price growth; in this case we do not observe signifi-
cant occurrences. At last PLTR (Palantir Technologies Inc) had its public debut at the end of September 2020, yet
it is remarkable that a significant interest from WSB users was present in the previous months. The peak in the
second half of November 2020 was due to a new contract of the company with the U.S. Army and a consequent
price jump of +170%, after which Citron Research labeled the stock as a gambling deal38.
Besides assessing the content of posts/comments by WSB users we also look at their sentiment. As discussed
in the introduction, this variable has been often pointed out as a predictor of market movements. We thus per-
form text sentiment analysis using VADER (Valence Aware Dictionary and sEntiment Reasoner)39, a python tool
that assigns to each piece of text a score between −1 (very negative) and +1 (very positive). In line with other
studies19,23, we adapt the VADER dictionary to the peculiar jargon and sarcasm used by WSB members (see
Scientific Reports | (2022) 12:13780 | https://doi.org/10.1038/s41598-022-17925-2 4
Vol:.(1234567890)www.nature.com/scientificreports/
“Methods” and Supplementary Note 3). Figure 2C shows an intensive sentiment indicator, i.e., the mean senti-
ment of all daily posts/comments that mention GME. We see that the signal is initially quite noisy due to the
low number of GME-related comments until mid-October; Then as early as the beginning of December it starts
to grow significantly (both with respect to its previous trend and to the mean sentiment of all comments), far
before the short squeeze of January. Overall we can associate these empirical evidences to a growing engagement
of users with GME, which in turn represents an early sign of consensus formation in the community concerning
the short squeeze operation. In light of these results, we now work out a model in which user engagement with a
collective cause can influence opinion dynamics and foster the emergence of consensus (or cooperation) thanks
to a self-induced feedback mechanism.
Voter model with self‑induced global feedback. We build on one of the most popular theoretical
frameworks of opinion dynamics: the voter model40,41. In the standard voter dynamics, N users are placed on
the nodes of a network and are endowed with a binary opinion s ∈ {−1, +1}. Starting at t = 0 from an initially
disordered configuration where each user i has opinion si (0) = ±1 with equal probability, at each time step
δt = N1 a user is chosen at random and copies the opinion of one of her neighbors. The magnetization or order
parameter m(t) = N1 i si (t) represents the average opinion at time t, or equivalently the level of consensus
reached, with m(t) ≃ 0 and m(t) = ±1 indicating no consensus and full consensus, respectively. The standard
model has been studied extensively on different population structures and has been adapted to a variety of dif-
ferent situations27,42. We are interested in a model formulation where, depending on how much users are engaged
with a collective cause, they are more keen on assuming a given opinion if that opinion is popular within the
community. Mathematically speaking, the model should include a tunable self-induced field acting on all users
simultaneously. Following an approach formally similar to35, we define the update rule as:
sj (t) with probability 1−
si (t + δt) = ki (1)
e(t) with probability
This expression, visually represented in Fig. 3A, has the following meaning. When user i is selected for the
update, with probability 1 − she copies the state of a random neighbor j (i.e., each neighbor is selected with
probability k1i , where ki is the degree or number of neighbors of i). Instead, with probability she follows a global
field given by the random variable e(t) = ±1. In order to have a self-induced field depending on the current level
of consensus, we impose that the probability of e(t) = +1 is
c m(t)
P1 [e(t)] = (2)
1 + c m(t)
When there is no consensus at all (i.e., m(t) = 0 ) we have P1 [e(t)] = 12 : the global field acts randomly on
each user and is equivalent to a white noise term. Instead m(t) → +1 leads to P1 [e(t)] → 1 and analogously
m(t) → −1 to P1 [e(t)] → 0: the global field is increasingly able to align users with the majority opinion. c ≥ 1
is a control parameter that we associate with the level of user engagement: the higher the value of c, the less
consensus is required for users to align with m(t).
We can understand the behavior of the model for different values of c through its analytical mean-field
solution (see “Methods”). Figure 3B shows sample realizations of the stochastic temporal dynamics of the mag-
netization (for a fixed value of = 0.1), while Fig. 3C shows the drift term v(m) rescaled by > 0 as a function
of m. For c = 1 we have P1 [e(t)] = 21 : the global field is always white noise that keeps the system in the initial
disordered configuration, as in the noisy voter model43,44. This is due to the drift and magnetization having always
opposite sign: the process is mean-reverting and the only equilibrium point is m∗ = 0. Such equilibrium remains
stable also when c > 1, though the drift towards it becomes less intense. At the singular point c = e2 we have
P1 [e(t)] = 21 [1 + tanh m(t)] and the drift vanishes in the region around m = 0: the initial stochastic dynamics
becomes purely diffusive, as in the standard voter m odel27. Finally for c above this threshold the drift pushes
the system away from m = 0 with a speed that grows with : the dynamics quickly reaches a new stable equi-
librium point that becomes closer to full consensus as c grows. Looking at the stable states |m∗ | of the dynamics
as a function of c (inset of Fig. 3C) we see that the system exhibits a classic second order phase transition from
disorder to order. These results are confirmed by numerical simulations of the model on Erdös-Rényi random
graphs (Fig. 3D). Only for very small values of < 0.1, for which the interaction between peers is largely domi-
nant, network effects make the transition less sharp. Furthermore, in this region the dynamics is very slow so
the system keeps memory of its initial configuration for a long time. This produces finite-time hysteresis loops
that slow down both the emergence of consensus from a disordered configuration and its dissolution from an
ordered one (see Supplementary Note 4).
Consensus on the WSB user network. We finally study how the model behaves on user-user interac-
tion networks extracted from WSB conversation data. We build a network for each month by placing a directed
link between two users i and j weighted by the number of times i commented on j’s posts/comments during that
period (Fig. 1C). We then extract the most significant connections using the disparity filter45 with significance
level α = 0.1 (see “Methods”). We focus on the four months preceding the GME short squeeze, from October
2020 to January 2021. Due to the explosion of activity in WSB, the network in January has many more nodes
than those in the previous months; however, the application of the disparity filter makes their density of con-
nections comparable (see Table 1). In particular, all four networks display a power law distribution of the con-
nectivity (Fig. 4A), with some deviations caused by many super-hubs appearing in January. Model simulations
on these networks reported in Fig. 4B (see the Supplementary Note 5 for further details) show that the degree
Scientific Reports | (2022) 12:13780 | https://doi.org/10.1038/s41598-022-17925-2 5
Vol.:(0123456789)www.nature.com/scientificreports/
A D
U U
U
U
U U
U
U U
U U
U U U U
B C
Figure 3. Voter model with self-induced global feedback. (A) Schematic representation of the update rule of
the model. At each time step, a user takes on the opinion of either a randomly chosen neighbor (with probability
1 − ) or is influenced (according to a control parameter c) by the current level of consensus in the community,
namely the magnetization m. (B) Sample stochastic realizations of the model dynamics: temporal evolution
of the magnetization m for different values of the parameter c setting the strength of the global feedback, for
= 0.1. (C) Re-scaled drift term v(m) of the model dynamics (according to the mean-field approximation, for
= 0) as a function of the magnetization of the system. Inset: stable equilibrium points |m∗ | as a function of c.
(D) Phase diagram of the model simulated on Erdös-Rényi random graphs of N = 10000 nodes and average
degree �k� = 20. Icons in (A) have been designed by Freepik.
Month Ntot Etot Nb Eb Ng Eg k
k 2
/ k
r γ
October 35850 564268 4235 11212 3542 8524 4.8 23.9 0.01 2.5
November 47536 761374 5765 14888 4730 11307 4.7 27.5 – 0.03 2.4
December 57822 913388 6675 18057 5474 13689 4.9 45.6 – 0.05 2.4
January 357039 3359500 17740 38365 12232 29504 4.7 231.1 – 0.15 2.6
Table 1. Size of the monthly user-user interaction networks. The subscript tot stands for the unfiltered data,
b for the backbone extracted with the disparity filter, g for the largest connected component of the graph.
Network statistics reported for these latter networks are the average degree k
, the average excess degree
k2
/ k
, the assortativity coefficient r and the slope of the degree distribution γ ≃ − ln P(k)/ ln k (fitted
starting from kmin = 10).
Scientific Reports | (2022) 12:13780 | https://doi.org/10.1038/s41598-022-17925-2 6
Vol:.(1234567890)www.nature.com/scientificreports/
A C
B D
x
x
x
x
x
x
Figure 4. WSB user interaction network and emergence of consensus. (A) Degree distributions of the monthly
user interaction (’reply-to’) networks, statistically validated using the disparity filter. (B) Phase transition of the
magnetization, obtained by simulating the model (for = 0.1) on the monthly networks, as compared to the
transition observed on Erdös-Rényi graphs. (C) Number of daily active users (who contribute at least one post/
comment) and daily closing price of GME shares. (D) Phase transition of the extensive order parameter of the
model (total magnetization for a community that grows as an exponential of m) according to the mean-field
solution and to numerical simulations on the January user network.
heterogeneity of real user interactions leads to the emergence a non-negligible level of consensus also for very
small values of user engagement c. This vanishing of the transition point is reminiscent of what occurs for other
processes on scale-free networks, such as epidemic spreading46 and coordination games47. Notably, the curves
for the networks of October, November and December collapse onto each other, as opposed to that of Janu-
ary which is smoother due to the presence of more super-hubs and of a disassortative pattern48 (see Table 1)
that ease the formation of an initial consensus. However magnetization alone does not allow for an appropri-
ate comparison between networks of different sizes, since it represents the average opinion and is therefore an
intensive variable. Equally important is the extent of consensus in terms of number of users. Indeed the success
of the short squeeze required a large number of investors who bought and held GME shares. Another factor to
take into account is the steep growth of the number of WSB users in correspondence with the short squeeze, as
shown in Fig. 4C. Altogether these observations suggest to consider an extensive order parameter, namely ∗
the
total sum of opinions within a population that grows with the level of consensus reached: M ∗ = m∗ N0 eq|m | (see
“Methods”). As shown in Fig. 4D this extensive magnetization features an abrupt transition, properly describing
a sudden and large-scale formation of consensus. For a user engagement level c that grows linearly in time (see
Fig. 2C), this transition is qualitatively similar to the sharp surge of GME price (see Fig. 4C), which ultimately
represents the best proxy for the success of the short squeeze.
Discussion
We remark that, in line with the standard statistical physics approach to social dynamics27, the proposed Voter-
like framework is not intended as a falsifiable model of the real microscopic dynamics of the short squeeze on
WSB. Rather it represents a minimal model that offers a possible explanation for key statistical patterns of the
collective coordination action. In particular the model is intended to show that if the opinion dynamics is based
on peer imitation, and if engagement or sentiment (corresponding to the control parameter c) grows up to the
point of activating a self-induced global field, then it is possible to obtain an abrupt formation of consensus. The
resulting order-to-disorder transition (depending on whether the global field activates or just represents noise)
cannot be reproduced with traditional Voter frameworks, where consensus is reached very slowly due to a dif-
fusive dynamics. Unfortunately, empirical validation of this model is impossible using solely WSB conversation
data, for two reasons: (1) we do not know how to map engagement/sentiment to the control parameter, and (2)
since the user opinion (the order parameter) corresponds to participation or not to the short squeeze, we would
need to know users’ purchase transaction data, which are obviously not available due to privacy reasons.
Scientific Reports | (2022) 12:13780 | https://doi.org/10.1038/s41598-022-17925-2 7
Vol.:(0123456789)www.nature.com/scientificreports/
The empirical evidence we are able to provide with our data is shown in the Results section above as well as in
Supplementary Note 6. Figure 3C shows that the control parameter, as represented by the mean sentiment, grows
as we approach the short squeeze date. Supplementary Fig. 6 supports the peer imitation dynamics at the basis
of the Voter model, using the sentiment of conversations among interacting users (rather than their opinion, for
which we have no data). Similar evidence of social influence on the sentiment of comments by WSB users has
been also reported in24. Figure 4D shows that the phase transition of the extensive magnetization is qualitatively
comparable to the only empirical data available to proxy the real dynamics of users opinions: the price hike of
GME shares. At last, in Supplementary Fig. 7 we further assume to know a linear mapping between the mean
sentiment and the control parameter c to perform a more quantitative comparison. This latter exercise follows
the same setup of the various w orks18–24 that try to use sentiment to predict stock price movements, however
with a different aim: showing that the abrupt formation of consensus in the model is qualitatively similar to the
GME price change due to the short squeeze.
Conclusion
The empirical and theoretical results presented in this work can be useful to better understand the dynamics
of consensus formation and collective actions on social networks. These phenomena have become increasingly
relevant in recent years and have entered the financial domain with the GME case. This event is unlikely to
remain isolated, particularly in the current financial context which sees the growing influence of retail and non-
professional investors due to the emergence of commission-free trading and leverage platforms. While the ethical
aspects of the “democratization of trading and investing”49 and the “David vs Goliath” contrast between small
investors versus hedge f unds50 can be widely debated, their effects on market quality are certainly tangible51,52.
An inherent limitation of our empirical analyses is that we have focused on a single unprecedented financial
mass action. Although we have briefly shown some similar case studies as well as counterexamples, a more in-
depth analysis of several (possibly future) events of the same type can help corroborate or falsify our fi ndings17.
Another empirical limitation is that we have derived the users interaction network from Reddit conversation data,
while part of the coordination of the GME operation happened on other platforms as well, like Discord. From
the theoretical viewpoint, besides the model validation issues discussed above, it would be interesting to consider
other popular models of opinion dynamics, such as the majority-vote m odel53 or the threshold m
odel54, with
the addition of a self-induced global field. Additionally, more realistic models can be developed that couple the
dynamics of opinion formation with a growing size of the population. At last, there is the very practical question
of understanding how the dynamics of mass coordination reflect quantitatively on financial market movements.
All these issues certainly represent interesting directions for future r esearch55,56.
Methods
Dataset. We retrieved Reddit conversation data from P ushshift57, an API that regularly copies activity data
of Reddit and other social networks. We queried the service to retrieve information about WSB posts and com-
ments (summarized in Supplementary Table 1) from September 01, 2019 to February 01, 2021. Note that our
dataset covers the days following the short squeeze (25, 26, 27 January 2021) which were released by the service
only on August 31, 2021. Overall our data contains 22 099 235 comments and 865 597 posts. The dataset was
cleaned by removing posts/comments by Reddit bots (Supplementary Table 2) as well as by “[deleted]” users
(i.e., users who deleted their account before Pushshift could acquire their contributions). This latter operation
was performed only for the analyses that required a unique userID (i.e., user activity statistics and user-user
interaction networks), but not for those analyses that considered each post or comment on its own (i.e., tree
statistics, ticker occurrences and sentiment). Data on stock price and traded volumes (Supplementary Table 3)
for GME and other tickers were retrieved from the API service of https://polygon.io.
Ticker occurrences and Z‑scores. To measure the popularity of a given stock in WSB conversations we
computed xs (t), the count of how many times the ticker symbol of the stock s (e.g., ’GME’ for GameStop) appears
as a regular
expression in the raw
text of posts/comments of day t. The mean µs (t) = 1t tt ′ =1 xs (t ′ ) and variance
2
σs2 (t) = 1t tt ′ =1 xs (t ′ ) − µs (t) of the time series xs (t) (starting from March 01, 2020) are used to obtain the
Z-score Zs (t) = [xs (t) − µs (t)]/σs (t). The baseline Z(t) is the average Z-score of all stocks on day t (computed
over tickers with a symbol of at least three characters and appearing more than 10 times over the whole time
interval).
Sentiment analysis and VADER lexicon. VADER (Valence Aware Dictionary and sEntiment Rea-
soner)39 is an algorithm that assigns a piece of text with a compound score between −1 (very negative) and +1
(very positive). VADER is sensitive to both the polarity and intensity of the text, taking into account punctuation
and word shape (ALL CAPS) used to add emphasis, degree modifiers that alter intensity (boosters such as “very”
and dampeners such as “kind of ”), slang and acronyms. VADER is based on a lexicon of words and emojis, each
with an associated score ranging from −4 to +4 according to its meaning (from negative to positive). In line with
other studies19,23, we adapted VADER to the typical jargon and sarcasm of WSB users by adding to its lexicon
the words reported in Supplementary Table 4. In Supplementary Note 3 we show the importance of considering
such modified lexicon to detect the patterns of growing sentiment, also excluding the presence of biases arising
from changes of jargon during time.
Voter model with self‑induced global field. The analytic mean-field solution of the model (full calcula-
tions in the Supplementary Note 7) leads to the following stochastic differential equation for the evolution of the
magnetization of the system:
Scientific Reports | (2022) 12:13780 | https://doi.org/10.1038/s41598-022-17925-2 8
Vol:.(1234567890)www.nature.com/scientificreports/
(3)
dm = v(m)dt + D(m)dW
where W is the standard Wiener process while the drift and diffusion coefficients are
v(m) = [fc (m) − m]
1 (4)
(1 − )(1 − m2 ) + 1 − mfc (m)
D(m) =
N
c m −1
with fc (m) = 2P1 (e) − 1 = c m +1 . The formal solution for m ≃ 0 is
√
e− (1−ln c)t
mt = √ We2 (1−ln √c)t −1 (5)
2N (1 − ln c)
For c ≤ e2 the sign of the drift coefficient is always opposite to the sign of m and the only equilibrium point
is m = 0. For c ≥ e2 zero is no longer a stable point, for as soon as m = 0 the drift pushes the system towards
a new equilibrium. sets the speed at which the new stationary state is reached: the larger the stronger the
drift so the quicker the system will reach equilibrium. The critical value c = e2 corresponds to a purely diffusive
process driven by D(m), which is of order O N1 and thus can always be neglected except at the critical point.
D(m) is what drives the system out of the initial equilibrium state m = 0, but as soon as m = 0 the drift kicks
in, governing the evolution of m.
Model simulations always start from an initial disordered configuration where each user is randomly assigned
opinion s = ±1 with equal probability, such that m(0) ≃ 0. The dynamics is run until the magnetization reaches
the stationary value m∗. Values shown in plots are averaged over 1000 independent runs. The extensive magneti-
zation M ∗ = m∗ N is defined using a∗population size N that grows exponentially with |m∗ | from a baseline level
N0. Parameters used for N = N0 eq|m | are N0 = 10 000 (roughly the number of active users before January, see
Fig. 3C) and q = 6, in order to have N ≈ 200, 000 when |m∗ | ≃ 0.5. We remark that this change of N is modeled
ex-post, as in simulations the number of users is fixed. A possibly more realistic scenario would consists in hav-
ing new nodes entering the system as the voter dynamics takes place. However it is reasonable to expect that a
growing population may have an effect on the reaching of consensus only when the system is close to the critical
point, i.e., in the region where the drift vanishes.
User network construction. For each month we reconstruct the network of social interactions by con-
sidering only posts and comments contributed during that month. Each user who contributed at least one of
these posts/comments is represented as a node; each weighted directed link wij represents the number of times
user i commented on posts/comments by user j. In order to filter out the less informative links and keep only
those that are more likely to represent a significant interaction, we firstly removed all users who commented just
once and then extracted the network backbone through the disparity filter45. This algorithm assesses the statis-
tical significance of links with respect to a null model where the weights of the links originating from a node
are produced by a random assignment from wija/siuniformkdistribution. Specifically, a link is deemed statistically
significant
if it satisfies αij = 1 − (ki − 1) 0 (1 − x) i −2 dx < α, where α is the significance level and ki and
si = j wij are respectively the degree and strength of node i. The statistically validated network is then a binary
undirected network made up of those links which at least in one direction satisfy the former condition (in the
case where a node i with ki = 1 is connected to a node j with kj > 1, the link is kept only if node j satisfies the
criterion). Note that in the case of a directed network the incoming and outgoing links associated with a node
must be considered separately. At last, in our simulations we considered only the largest connected component
of the network (see Table 1).
Deriving the interaction network of users from direct reply-to information is a popular approach in the
literature on Twitter, where interactions inferred in this way can be validated against the follower/following
relationships among users (when these are available)58. On top of this approach we also use statistical validation
to filter out less-frequent interactions, according to user a ctivity59. We remark that other approaches to infer user
interactions have been used in the literature, such as connecting users who belong to the same comment chain
and whose distance is within two or three comments of each o ther60. We have checked that using this approach
leads to results that are quantitatively very close to those reported in Fig. 4B. Indeed the topological details of
the user interaction network only have a second-order effect on the shape of the magnetization transition, as the
phenomenon is qualitatively the same also in random Erdös-Rényi networks.
Data availability
Reddit conversation data used in this study can be retrieved from the Pushshift API at https://w
ww.r eddit.c om/r/
pushshift/. Stock price and traded volumes data are instead obtained by the Polygon API at https://polygon.io.
Received: 13 March 2022; Accepted: 2 August 2022
References
1. Kaplan, A. M. & Haenlein, M. Users of the world, unite! The challenges and opportunities of social media. Business Horizons 53,
59–68. https://doi.org/10.1016/j.bushor.2009.09.003 (2010).
2. Heidemann, J., Klier, M. & Probst, F. Online social networks: A survey of a global phenomenon. Computer Netw. 56, 3866–3878.
https://doi.org/10.1016/j.comnet.2012.08.009 (2012).
Scientific Reports | (2022) 12:13780 | https://doi.org/10.1038/s41598-022-17925-2 9
Vol.:(0123456789)www.nature.com/scientificreports/
3. Del Vicario, M. et al. The spreading of misinformation online. Proc. Natl. Acad. Sci. USA 113, 554. https://doi.org/10.1073/pnas.
1517441113 (2016).
4. Lazer, D. M. et al. The science of fake news: Addressing fake news requires a multidisciplinary effort. Science 359, 1094–1096.
https://doi.org/10.1126/science.aao2998 (2018).
5. Bakshy, E., Messing, S. & Adamic, L. A. Exposure to ideologically diverse news and opinion on Facebook. Science 348, 1130–1132.
https://doi.org/10.1126/science.aaa1160 (2015).
6. Bail, C. A. et al. Exposure to opposing views on social media can increase political polarization. Proc. Natl. Acad. Sci. USA 115,
9216–9221. https://doi.org/10.1073/pnas.1804840115 (2018).
7. Wolfsfeld, G., Segev, E. & Sheafer, T. Social media and the Arab Spring: Politics comes first. Int. J. Press/Politics 18, 115–137. https://
doi.org/10.1177/1940161212471716 (2013).
8. Segerberg, A. & Bennett, W. L. Social media and the organization of collective action: Using Twitter to explore the ecologies of
two climate change protests. Commun. Rev. 14, 197–215. https://doi.org/10.1080/10714421.2011.597250 (2011).
9. GameStop short squeeze. https://en.wikipedia.org/wiki/GameStop_short_squeeze. Accessed 8 August 2022.
10. Boylston, C., Palacios, B., Tassev, P. & Bruckman, A. WallStreetBets: Positions or ban. arXiv.org/abs/2101.12110 (2021).
11. Buz, T. & de Melo, G. Should you take investment advice from WallStreetBets? A data-driven approach. https://a rxiv.o rg/a bs/2 105.
02728 (2021).
12. Chohan, U. W. Counter-hegemonic finance: The GameStop short squeeze. https://doi.org/10.2139/ssrn.3775127 (2021).
13. Bollen, J., Mao, H. & Zeng, X. Twitter mood predicts the stock market. J. Comput. Sci. 2, 1–8. https://doi.org/10.1016/j.jocs.2010.
12.007 (2011).
14. Broadstock, D. C. & Zhang, D. Social-media and intraday stock returns: The pricing power of sentiment. Finance Res. Lett. 30,
116–123. https://doi.org/10.1016/j.frl.2019.03.030 (2019).
15. Phillips, R. C. & Gorse, D. Predicting cryptocurrency price bubbles using social media data and epidemic modelling. in 2017 IEEE
Symposium Series on Computational Intelligence (SSCI),1–7. https://doi.org/10.1109/SSCI.2017.8280809(2017).
16. Wooley, S., Edmonds, A., Bagavathi, A. & Krishnan, S. Extracting cryptocurrency price movements from the Reddit network senti-
ment. in Proceedings of the 18th IEEE International Conference on Machine Learning and Applications, ICMLA 2019, 500–505.
https://doi.org/10.1109/ICMLA.2019.00093(2019).
17. La Morgia, M., Mei, A., Sassi, F. & Stefa, J. The doge of Wall Street: Analysis and detection of pump and dump cryptocurrency
manipulations. arXiv.org/abs/2105.00733 (2021).
18. Lyócsa, Š, Baumöhl, E. & Výrost, T. Yolo trading: Riding with the herd during the GameStop episode. Finance Res. Lett.https://doi.
org/10.1016/j.frl.2021.102359 (2021).
19. Anand, A. & Pathak, J. The role of Reddit in the GameStop short squeeze. Econ. Lett. 211, https://doi.org/10.1016/j.econlet.2021.
110249 (2022).
20. Betzer, A. & Harries, J. P. How online discussion board activity affects stock trading: The case of GameStop. Finan. Markets Portfolio
Manag. https://doi.org/10.1007/s11408-022-00407-w (2022).
21. Hu, D., Jones, C. M., Zhang, V. & Zhang, X. The rise of Reddit: How social media affects retail investors and short-sellers’ croles in
price discovery. https://doi.org/10.2139/ssrn.3807655 (2021).
22. Long, C., Lucey, B., Yarovaya, L., Chieu, N. D. & City, H. C. M. ’I just like the stock’ versus ’fear and loathing on main street’ : The
role of Reddit sentiment in the GameStop short squeeze. https://doi.org/10.2139/ssrn.3822315 (2021).
23. Wang, C. & Luo, B. Predicting \$GME stock price movement using sentiment from Reddit r/wallstreetbets. in Proceedings of the
Third Workshop on Financial Technology and Natural Language Processing, 22–30. https://aclanthology.org/2021.finnlp-1.4.pdf
(2021).
24. Semenova, V. & Winkler, J. Reddit’s self-organised bull runs: Social contagion and asset prices. arXiv.org/abs/2104.01847 (2021).
25. Lucchini, L. et al. From Reddit to Wall Street: The role of committed minorities in financial collective action. R. Soc. Open Sci. 9,
https://doi.org/10.1098/rsos.211488 (2022).
26. Lazer, D. et al. Computational social science. Science 323, 721–723. https://doi.org/10.1126/science.1167742 (2009).
27. Castellano, C., Fortunato, S. & Loreto, V. Statistical physics of social dynamics. Rev. Modern Phys. 81, 591–646. https://doi.org/10.
1103/RevModPhys.81.591 (2009).
28. Acemoglu, D. & Ozdaglar, A. Opinion dynamics and learning in social networks. Dynamic Games Appl. 1, 3–49. https://doi.org/
10.1007/s13235-010-0004-1 (2011).
29. Noorazar, H. Recent advances in opinion propagation dynamics: A 2020 survey. Eur. Phys. J. Plus 135, 521. https://doi.org/10.
1140/epjp/s13360-020-00541-2 (2020).
30. Baronchelli, A. The emergence of consensus: A primer. R. Soc. Open Sci. 5, https://doi.org/10.1098/rsos.172189 (2021).
31. Kearns, M., Judd, S., Tan, J. & Wortman, J. Behavioral experiments on biased voting in networks. Proc. Natl. Acad. Sci. USA 106,
1347–1352. https://doi.org/10.1073/pnas.0808147106 (2009).
32. Michard, Q. & Bouchaud, J. P. Theory of collective opinion shifts: From smooth trends to abrupt swings. Eur. Phys. J. B Condensed
Matter Complex Syst. 47, 151–159. https://doi.org/10.1140/epjb/e2005-00307-0 (2005).
33. Bhat, D. & Redner, S. Nonuniversal opinion dynamics driven by opposing external influences. Phys. Rev. E 100, https://doi.org/
10.1103/PhysRevE.100.050301 (2019).
34. Majmudar, J. R., Krone, S. M., Baumgaertner, B. O. & Tyson, R. C. Voter models and external influence. J. Math. Sociol. 44, 1–11.
https://doi.org/10.1080/0022250X.2019.1625349 (2020).
35. De Marzo, G., Zaccaria, A. & Castellano, C. Emergence of polarization in a voter model with personalized information. Phys. Rev.
Res. 2, https://doi.org/10.1103/PhysRevResearch.2.043117 (2020).
36. Toole, J. L., Ulm, M., González, M. C. & Bauer, D. Inferring land use from mobile phone activity. in Proceedings of the ACM SIG-
KDD International Workshop on Urban Computing,1–8. https://doi.org/10.1145/2346496.2346498 (Association for Computing
Machinery, Beijing, China, 2012).
37. https://twitter.com/CitronResearch/status/1351544479547760642. Accessed 8 August 2022.
38. https://twitter.com/CitronResearch/status/1332340510623555585. Accessed 8 August 2022.
39. Hutto, C. & Gilbert, E. Vader: A parsimonious rule-based model for sentiment analysis of social media text. in Proceedings of the
International AAAI Conference on Web and Social Media, vol. 8, 216–225, https://ojs.aaai.org/index.php/ICWSM/article/view/
14550 (2014). Accessed 8 August 2022.
40. Clifford, P. & Sudbury, A. A model for spatial conflict. Biometrika 60, 581–588. https://doi.org/10.1093/biomet/60.3.581 (1973).
41. Holley, R. A. & Liggett, T. M. Ergodic theorems for weakly interacting infinite systems and the voter model. Ann. Probability 3,
643–663. https://doi.org/10.1214/aop/1176996306 (1975).
42. Redner, S. Reality-inspired voter models: A mini-review. Comptes Rendus Physique 20, 275–292. https://doi.org/10.1016/j.crhy.
2019.05.004 (2019).
43. Kirman, A. Ants, rationality, and recruitment. Quart. J. Econ. 108, 137–156. https://doi.org/10.2307/2118498 (1993).
44. Granovsky, B. L. & Madras, N. The noisy voter model. Stochastic Process. Appl. 55, 23–43. https://doi.org/10.1016/0304-4149(94)
00035-R (1995).
45. Serrano, M. Á., Boguñá, M. & Vespignani, A. Extracting the multiscale backbone of complex weighted networks. Proc. Natl. Acad.
Sci. USA 106, 6483–6488. https://doi.org/10.1073/pnas.0808904106 (2009).
Scientific Reports | (2022) 12:13780 | https://doi.org/10.1038/s41598-022-17925-2 10
Vol:.(1234567890)www.nature.com/scientificreports/
46. Pastor-Satorras, R. & Vespignani, A. Epidemic spreading in scale-free networks. Phys. Rev. Lett. 86, 3200–3203. https://doi.org/
10.1103/PhysRevLett.86.3200 (2001).
47. Cimini, G. Evolutionary network games: Equilibria from imitation and best response dynamics. Complexityhttps://doi.org/10.
1155/2017/7259032 (2017).
48. Newman, M. E. J. Mixing patterns in networks. Phys. Rev. E 67, https://doi.org/10.1103/PhysRevE.67.026126 (2003).
49. Aramonte, S. & Avalos, F. The rising influence of retail investors. Tech. Rep., BIS Quarterly Review (2021). https://www.bis.org/
publ/qtrpdf/r_qt2103v.htm. Accessed 8 August 2022.
50. Pelaez, A., R. Winston, E. & Samuel, J. David and Goliath revisited: How small investors are changing the landscape of financial
markets. in Northeast Decision Sciences Institute. https://doi.org/10.7282/00000176(2021).
51. Eaton, G. W., Green, T. C., Roseman, B. & Wu, Y. Retail trader sophistication and stock market quality: Evidence from brokerage
outages. https://doi.org/10.2139/ssrn.3776874 (2021).
52. Allen, F., Hass, M., Nowak, E., Pirovano, M. & Tengulov, A. Squeezing shorts through social media platforms. Tech. Rep. 21-31,
Swiss Finance Institute Research Paper Series (2021). https://doi.org/10.2139/ssrn.3823151 .
53. de Oliveira, M. J. Isotropic majority-vote model on a square lattice. J. Stat. Phys. 66, 273–281. https://doi.org/10.1007/BF01060069
(1992).
54. Granovetter, M. Threshold models of collective behavior. Am. J. Sociol. 83, 1420–1443. https://doi.org/10.1086/226707 (1978).
55. Gianstefani, I., Longo, L. & Riccaboni, M. The echo chamber effect resounds on financial markets: A social media alert system for
meme stocks. https://doi.org/10.2139/ssrn.4053771 (2022).
56. Sornette, D., Lera, S., Lin, J. & Wu, K. Non-normal interactions create socio-economic bubbles. https://arxiv.org/abs/2205.08661
(2022). Accessed 8 August 2022.
57. Baumgartner, J., Zannettou, S., Keegan, B., Squire, M. & Blackburn, J. The Pushshift Reddit Dataset. in Proceedings of the 14th
International AAAI Conference on Web and Social Media, ICWSM 2020, vol. 14,840–847. https://o js.a aai.o
rg/i ndex.p
hp/I CWSM/
article/view/7347 (2020). Accessed 8 August 2022.
58. Sousa, D., Sarmento, L. & Mendes Rodrigues, E. Characterization of the twitter @replies network: Are user ties social or topical?
in Proceedings of the 2nd International Workshop on Search and Mining User-Generated Contents, SMUC ’10, 63–70. https://
doi.org/10.1145/1871985.1871996 (Association for Computing Machinery, New York, NY, USA, 2010).
59. Becatti, C., Caldarelli, G., Lambiotte, R. & Saracco, F. Extracting significant signal of news consumption from social networks: The
case of twitter in Italian political elections. Palgrave Commun. 5, 91. https://doi.org/10.1057/s41599-019-0300-3 (2019).
60. Hamilton, W., Zhang, J., Danescu-Niculescu-Mizil, C., Jurafsky, D. & Leskovec, J. Loyalty in online communities. in Proceedings
of the International AAAI Conference on Web and Social Media 11, 540–543. https://o js.a aai.o
rg/i ndex.p hp/I CWSM/a rticl e/v iew/
14972 (2017). Accessed 8 August 2022.
Acknowledgements
This work has been supported by the “Deep ’N Rec” Progetto di Ricerca di Ateneo, University of Rome Tor
Vergata. The icons in Figs. 1A–C and 3A have been designed by Freepik.
Author contributions
A.M. and A.D. performed the analysis and realised the figures. A.D. gather the data. R.D.C. and G.C. designed the
analysis and supervised the project. G.C., R.D.C., A.M., A.D. wrote the paper. All authors discussed the results
and contributed to the final manuscript.
Competing interests
The authors declare no competing interests.
Additional information
Supplementary Information The online version contains supplementary material available at https://doi.org/
10.1038/s41598-022-17925-2.
Correspondence and requests for materials should be addressed to R.C. or G.C.
Reprints and permissions information is available at www.nature.com/reprints.
Publisher’s note Springer Nature remains neutral with regard to jurisdictional claims in published maps and
institutional affiliations.
Open Access This article is licensed under a Creative Commons Attribution 4.0 International
License, which permits use, sharing, adaptation, distribution and reproduction in any medium or
format, as long as you give appropriate credit to the original author(s) and the source, provide a link to the
Creative Commons licence, and indicate if changes were made. The images or other third party material in this
article are included in the article’s Creative Commons licence, unless indicated otherwise in a credit line to the
material. If material is not included in the article’s Creative Commons licence and your intended use is not
permitted by statutory regulation or exceeds the permitted use, you will need to obtain permission directly from
the copyright holder. To view a copy of this licence, visit http://creativecommons.org/licenses/by/4.0/.
© The Author(s) 2022
Scientific Reports | (2022) 12:13780 | https://doi.org/10.1038/s41598-022-17925-2 11
Vol.:(0123456789)You can also read