SFO Wake Turbulence Measurement System: Sensors and Data Descriptions
←
→
Page content transcription
If your browser does not render page correctly, please read the page content below
DOT-VNTSC-FAA-07-03
DOT/FAA/AR-07/11
                      SFO Wake Turbulence
                      Measurement System:
                      Sensors and Data
                      Descriptions
                      October 2006

                      David C. Burnham, Ph.D.
                      Kevin L. Clark
                      James N. Hallock, Ph.D.
                      Stephen M. Hannon, Ph.D.
                      Leo G. Jacobs
                      Robert P. Rudis
                      Melanie A. Soares
                      Frank Y. Wang, Ph.D.

                      Research and Innovative Technology Administration
                      John A. Volpe National Transportation Systems Center
                      Cambridge, MA 02142-1093

                      Technical Report
                      March 2000 to July 2004

                      This document is available to the public through the National Technical
                      Information Service, Springfield, VA 22161

                      U.S. Department of Transportation
                      Federal Aviation Administration
Form Approved
                              REPORT DOCUMENTATION PAGE                                                                                                              OMB No. 0704-0188
 Public reporting burden for this collection of information is estimated to average 1 hour per response, including the time for reviewing instructions, searching existing data sources, gathering and maintaining the data
 needed, and completing and reviewing the collection of information. Send comments regarding this burden estimate or any other aspect of this collection of information, including suggestions for reducing this burden,
 to Washington Headquarters Services, Directorate for Information Operations and Reports, 1215 Jefferson Davis Highway, Suite 1204, Arlington, VA 22202-4302, and to the Office of Management and Budget,
 Paperwork Reduction Project (0704-0188), Washington, DC 20503.

 1. AGENCY USE ONLY (Leave blank)                                          2. REPORT DATE                                                            3. REPORT TYPE AND DATES COVERED
                                                                                                   October 2006                                                        Technical Report
                                                                                                                                                                    March 2000 to July 2004
 4. TITLE AND SUBTITLE                                                                                                                                            5. FUNDING NUMBERS
 SFO Wake Turbulence Measurement System: Sensors and Data Descriptions                                                                                                     FAA-VNTSC-GWA-07
 6. AUTHOR(S)                                                                                                                                                                  PPA-FA27
 David C. Burnham et. al.
 7. PERFORMING ORGANIZATION NAME(S) AND ADDRESS(ES)                                                                                                               8. PERFORMING ORGANIZATION
                                                                                                                                                                  REPORT NUMBER
 U.S. Department of Transportation
 Research and Innovative Technology Administration                                                                                                                       DOT/VNTSC-FAA-07-03
 Volpe National Transportation Systems Center
 Advanced Communication, Navigation and Surveillance Technologies Division
 Cambridge, MA 02142-1093
 9. SPONSORING/MONITORING AGENCY NAME(S) AND ADDRESS(ES)                                                                                                          10. SPONSORING/MONITORING AGENCY
                                                                                                                                                                  REPORT NUMBER
 U.S. Department of Transportation
 Federal Aviation Administration                                                                                                                                             DOT/FAA/AR-07/11
 System Operations Service Unit
 Washington, DC 20591
 11. SUPPLEMENTARY NOTES

 12a. DISTRIBUTION/AVAILABILITY STATEMENT                                                                                                                         12b. DISTRIBUTION CODE
 This document is available to the public through the National Technical Information Service,
 Springfield, Virginia 22161.
 13. ABSTRACT (Maximum 200 words)
 This report addresses aspects of an extensive aircraft wake turbulence measurement program conducted at San Francisco
 International Airport (SFO) over a two-year period. Specifically, this report describes the sensors used for data collection and the
 resulting data sets that were used for analysis of the Simultaneous Offset Instrument Approach (SOIA) procedure proposed for use
 at SFO. Three anemometer Windlines were deployed perpendicular to and between Runways 28L and 28R to measure and record
 wake vortex motion between the runways near the threshold and touchdown regions. Because Runways 28L and 28R are used for
 80% of SFO arrivals, the SFO wake turbulence Windline dataset, comprising approximately 250,000 arrivals, is the largest ever
 accumulated. Pulsed Lidar wake measurements were made for approximately one month at a location where aircraft were
 approximately 500 feet above San Francisco Bay (about 9,000 feet from the thresholds). The ambient wind at 20 feet above ground
 was monitored on either side of the two runways, and a wind Sodar was used to measure wind profiles up to a height of 656 feet.
 Automated Surface Observation System (ASOS) winds at 33 feet above ground were also obtained.
 14. SUBJECT TERMS                                                                                                                                                      15. NUMBER OF PAGES
 IFR approaches, parallel runways, wake turbulence, wake vortices, Windline, Lidar, SOIA, SFO                                                                                                   68
                                                                                                                                                                        16. PRICE CODE

 17. SECURITY CLASSIFICATION                            18. SECURITY CLASSIFICATION                             19. SECURITY CLASSIFICATION                             20. LIMITATION OF ABSTRACT
 OF REPORT                                              OF THIS PAGE                                            OF ABSTRACT
                                                                                                                                                                                          Unlimited
                Unclassified                                            Unclassified                                            Unclassified
NSN 7540-01-280-5500                                                                                                                                                              Standard Form 298 (Rev. 2-89)
                                                                                                                                                                                   Prescribed by ANSI Std. 239-18
                                                                                                                                                                                                         298-102

                                                                                                                 i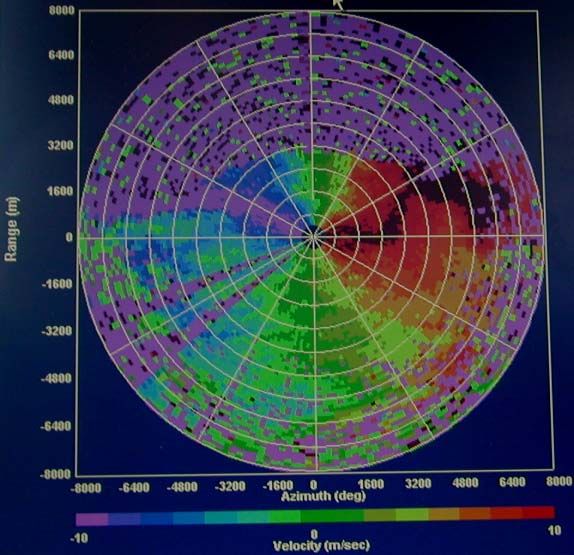
DOT/RITA/Volpe Center

                                                      PREFACE

Although the United States has one of the best air traffic systems in the world, continued growth in air
travel is severely straining the system. The challenge to relieving congestion and increasing capacity
is made more difficult by the fact that the traditional solution of building more runways can, in many
instances, only be implemented over a long period of time due to environmental and other restrictions.
Because of wake turbulence concerns, airports with closely-spaced parallel runways (CSPR) —
defined as having centerline separations of less than 2,500 feet* — are required to limit arrival opera-
tions to a single traffic stream under reduced ceiling/visibility conditions. At San Francisco Interna-
tional Airport (SFO), this restriction effectively halves arrival capacity and produces extensive delays.

Current CSPR rules (embodied in Federal Aviation Administration [FAA] Order 7110.65) are de-
signed to deal with all possible situations — e.g., combinations of aircraft size, wind speed/direction,
and runway threshold stagger. As a result, the rules are overly conservative in some situations. The
Simultaneous Offset Instrument Approach (SOIA) procedure was developed at San Francisco Inter-
national Airport (SFO) to improve CSPR arrival capacity when the ceiling/visibility do not allow
dual-stream visible approach operations. In response to SFO’s SOIA plans, the Department of
Transportation (DOT) Research and Innovative Technology Administration (RITA) Volpe National
Transportation Systems Center (Volpe Center), in support of the FAA, conducted a wake turbulence
measurement program at SFO to characterize the transport properties of wake vortices between the
parallel runways 28L and 28R. This report describes the SFO Wake Turbulence Measurement
System (WTMS) and documents the data collected by it.
The primary goal of this report is to guide users of the SFO WTMS datasets in selecting appropriate
data for future analyses. Critical issues in this regard are data validation, aircraft-wake matching and
processing algorithms. Data from this measurement program have been used to study the effects of
crosswind on wake vortices, in order to (a) assess the longitudinal spacing requirements of SOIA, and
(b) improve models for wake vortex transport in ground effect.

This project could not have been successfully completed without the cooperation and help of several
individuals and groups working at SFO. Particular thanks go to Paul Candelaire, FAA Facilities Man-
ager, and his technicians who helped us establish connectivity from our test site trailer to the Air
Traffic Control Tower. Others who contributed to the project’s success include: Trig McCoy, SFO
Operations Manager; Dennis Reed, SFO Operations Coordinator for Airfield Construction; Jim Chui
and Hugo Tupac, SFO Engineering; Scott Speers, FAA Assistant Tower Chief; David Ong, SFO Air-
craft Noise Abatement Office; and Petullia Mandap, FAA Western Region District Office.

*
  CSPR is defined herein as parallel runways having centerline separation of less than 2,500 feet, because, in this regime,
wake-based aircraft separation rules may (depending upon the operation and meteorological conditions) govern approaches
and departures. In other contexts, CSPR is sometimes defined as parallel runways with centerlines separated by less than
4,300 feet, because, in this regime, conducting simultaneous ILS approaches during instrument meteorological conditions
requires use of a precision aircraft monitoring (surveillance) system.

                                                             ii
DOT/RITA/Volpe Center

                                            ABSTRACT

A program was conducted at San Francisco International Airport (SFO) to acquire landing aircraft
wake vortex transport data between parallel Runways 28L and 28R. Three anemometer Windlines
were deployed perpendicular to and between Runways 28L and 28R to measure and record wake
vortex motion between the runways near the threshold and touchdown regions. The three closely-
spaced measurement planes permitted wake vortices to be displayed, in real time for the first time, as
continuous tubes, rather than as point locations in a single measurement plane. Real-time displays
were placed at several airport locations and a near-real-time display was provided over the Internet.
Data collection lasted for approximately two years.

Because Runways 28L and 28R are used for 80% of SFO arrivals, the SFO wake turbulence Windline
dataset, comprising approximately 250,000 arrivals, is the largest ever accumulated. Pulsed Lidar
wake measurements were made for approximately one month at a location where aircraft were
approximately 500 feet above San Francisco Bay (about 9,000 feet from the thresholds). Concurrent
Lidar and Windline data were collected for one day near the runway thresholds, for the purpose of
sensor data comparison/validation. The ambient wind at 20 feet above ground was monitored on
either side of the two runways, and a wind Sodar was used to measure wind profiles up to a height of
600 feet. Automated Surface Observation System (ASOS) winds at 33 feet above ground were also
obtained.

This report describes the data collection and processing procedures for the Windlines, and documents
the datasets available from the Windline and Lidar measurements. The report is intended to guide
potential dataset users in selecting the most appropriate data for a particular analysis.

Key Words: IFR approaches, parallel runways, wake turbulence, wake vortices, Windline, Lidar,
SOIA, SFO

                                                  iii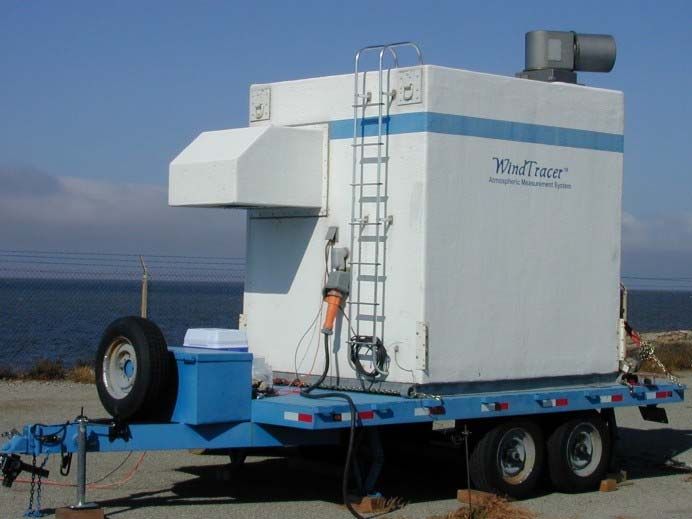

DOT/RITA/Volpe Center

                                                          TABLE OF CONTENTS

Section                                                                                                                                                         Page
   REPORT DOCUMENTATION PAGE ....................................................................................................... i

   PREFACE .................................................................................................................................................ii

   ABSTRACT..............................................................................................................................................iii

   TABLE OF CONTENTS........................................................................................................................... v

   LIST OF FIGURES ................................................................................................................................ viii

   LIST OF TABLES..................................................................................................................................... x

   LIST OF ACRONYMS..............................................................................................................................xi

   SUMMARY............................................................................................................................................S-1

            PURPOSE ...............................................................................................................................................S-1

            EQUIPMENT LAYOUT...........................................................................................................................S-1
            CHRONOLOGY ......................................................................................................................................S-1
                      Windlines ......................................................................................................................................S-1
                      Pulsed Lidar..................................................................................................................................S-1
            VALIDATION ...........................................................................................................................................S-3
            DATA PROCESSING .............................................................................................................................S-3
                      Windlines ......................................................................................................................................S-3
                      Pulsed Lidar..................................................................................................................................S-3
   1.       INTRODUCTION ........................................................................................................................ 1-1

            1.1       APPROACHES TO CLOSELY-SPACED PARALLEL RUNWAYS ......................................... 1-1
            1.2       SIMULTANEOUS OFFSET INSTRUMENT APPROACH (SOIA) PROCEDURE.................. 1-1
            1.3       OTHER PURPOSES OF SFO WTMS....................................................................................... 1-4

            1.4       REPORT OUTLINE..................................................................................................................... 1-4

   2.       WAKE SENSOR DEVELOPMENT AND DEPLOYMENTS ....................................................... 2-1

            2.1       WINDLINE.................................................................................................................................... 2-1
                      2.1.1       Concept ........................................................................................................................... 2-1
                      2.1.2       Original Implementations................................................................................................ 2-2
                      2.1.3       Recent Implementations................................................................................................. 2-3
            2.2       PULSED LIDAR........................................................................................................................... 2-3

                                                                                 v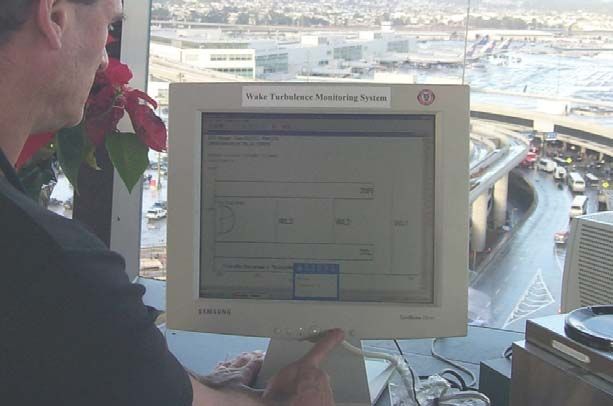
DOT/RITA/Volpe Center

                2.2.1      Concept ........................................................................................................................... 2-4
                2.2.2      Recent Implementations................................................................................................. 2-4
       2.3      AIRCRAFT DETECTION AND IDENTIFICATION .................................................................... 2-5

  3.   SFO WTMS INSTALLATION ..................................................................................................... 3-1

       3.1      DATA COLLECTION ARCHITECTURE.................................................................................... 3-1
                3.1.1      Requirements.................................................................................................................. 3-1
                3.1.2      Implementation................................................................................................................ 3-1
                          3.1.2.1 Data Recording Files........................................................................................ 3-1
                          3.1.2.2 Real-Time Processing...................................................................................... 3-1
       3.2      WINDLINES ................................................................................................................................. 3-3
                3.2.1      Airport Installation ........................................................................................................... 3-3
                3.2.2      Sample Wake Behavior.................................................................................................. 3-4
                3.2.3      Windline Hardware ......................................................................................................... 3-4
                3.2.4      Post-Time Windline Processing..................................................................................... 3-6
       3.3      AIRCRAFT DETECTORS........................................................................................................... 3-9
                3.3.1      Noise................................................................................................................................ 3-9
                3.3.2      Video.............................................................................................................................. 3-10
       3.4      AIRCRAFT IDENTIFICATION .................................................................................................. 3-11
                3.4.1      Mode S Receiver .......................................................................................................... 3-11
                3.4.2      TAMIS............................................................................................................................ 3-11
       3.5      METEOROLOGICAL SENSORS............................................................................................. 3-11
       3.6      PULSED LIDAR......................................................................................................................... 3-12
                3.6.1      Capabilities.................................................................................................................... 3-13
                3.6.2      Operational Modes ....................................................................................................... 3-14
                3.6.3      Real-Time Display......................................................................................................... 3-15
                          3.6.3.1 Elevation-Angle Scan Mode .......................................................................... 3-15
                          3.6.3.2 Variable Azimuth Display (VAD) Scan Mode................................................ 3-16
                          3.6.3.3 Plan Position Indicator (PPI) Scan Mode...................................................... 3-17
       3.7      REAL-TIME WINDLINE DISPLAYS......................................................................................... 3-17
                3.7.1      Local Display................................................................................................................. 3-17
                3.7.2      Display Options............................................................................................................. 3-18
                3.7.3      Web Display .................................................................................................................. 3-19
       3.8      USER EXPERIENCE WITH REAL-TIME DISPLAYS............................................................. 3-19
                3.8.1      Local .............................................................................................................................. 3-19
                3.8.2      World Wide Web........................................................................................................... 3-21

  4.   DATASETS................................................................................................................................. 4-1

       4.1      COORDINATE SYSTEM ............................................................................................................ 4-1

                                                                          vi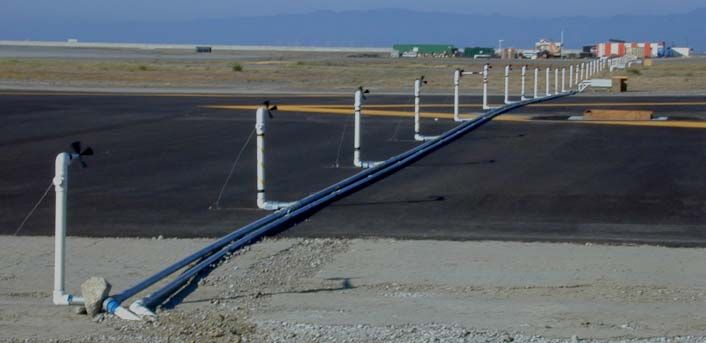
DOT/RITA/Volpe Center

                    4.1.1      Origin and Axes............................................................................................................... 4-1
                    4.1.2      Wind Components .......................................................................................................... 4-1
           4.2      WINDLINE.................................................................................................................................... 4-1
                    4.2.1  Processing Parameters .................................................................................................. 4-1
                          4.2.1.1 Initial SFO Parameter Set................................................................................ 4-2
                          4.2.1.2 Alternative Parameter Sets.............................................................................. 4-3
                    4.2.2 FAA Aircraft Wake Classes............................................................................................ 4-3
                    4.2.3      SFO Traffic ...................................................................................................................... 4-3
                    4.2.4      Crosswind Distribution.................................................................................................... 4-4
                    4.2.5      Windline Detection Probability........................................................................................ 4-8
                    4.2.6      Wake Duration .............................................................................................................. 4-11
                    4.2.7      First Wake Detection .................................................................................................... 4-14
           4.3      PULSED LIDAR......................................................................................................................... 4-19
                    4.3.1      Out of Ground Effect (OGE)......................................................................................... 4-19
                    4.3.2      In Ground Effect (IGE).................................................................................................. 4-19
           4.4      METEOROLOGICAL DATA ..................................................................................................... 4-20
                    4.4.1      ASOS............................................................................................................................. 4-21
                    4.4.2      Windline......................................................................................................................... 4-21
                    4.4.3      Sodar ............................................................................................................................. 4-21
                    4.4.4      Lidar............................................................................................................................... 4-22

  5.       CONCLUSIONS ......................................................................................................................... 5-1

  REFERENCES .................................................................................................................................... R-1

                                                                             vii
DOT/RITA/Volpe Center
LIST OF FIGURES
Figure Page
Figure S-1. On-Airport Installation of SFO WTMS..................................................................................................S-2
Figure S-2. Layout of SFO WTMS Showing Windline 1 and Two Lidar Sites ......................................................S-2
Figure 1-1. SFO Airport Diagram............................................................................................................................. 1-2
Figure 1-2 Plan View of the SFO SOIA Procedure ............................................................................................... 1-3
Figure 2-1. B-777 Aircraft over SFO Windline 1 ..................................................................................................... 2-1
Figure 2-2. Sample SFO Windline 1 Measured and Processed Data................................................................... 2-2
Figure 2-3. CTI Pulsed Lidar at SFO....................................................................................................................... 2-4
Figure 3-1. SFO WTMS Network Architecture (Except Pulsed Lidar and Cameras)........................................... 3-2
Figure 3-2. SFO WTMS Equipment Locations ....................................................................................................... 3-3
Figure 3-3. SFO Windline Display ........................................................................................................................... 3-5
Figure 3-4. SFO Windline 1 ..................................................................................................................................... 3-5
Figure 3-5. WL1 at Threshold of Runway 28L after Apron Construction .............................................................. 3-6
Figure 3-6. Summary of SFO Windline Processing................................................................................................ 3-8
Figure 3-7. Aircraft Detector Locations for Both Runways after 28L Apron Construction .................................. 3-10
Figure 3-8. Aircraft Detectors: Runway 28L (left), Runway 28R (right) ............................................................... 3-10
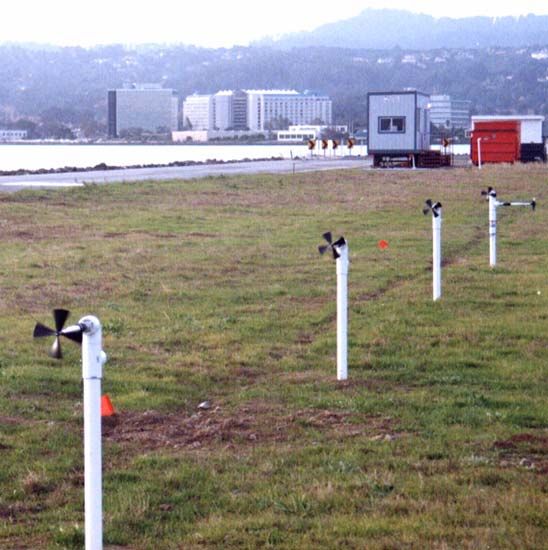
Figure 3-9. Sodar and 20-ft Anemometer Pole (beyond Runway 28L end of WL1) .......................................... 3-11
Figure 3-10. Two Lidar Sites Near SFO Airport.................................................................................................... 3-12
Figure 3-11. B-747 Viewed above Pulsed Lidar Housing .................................................................................... 3-13
Figure 3-12. Pulsed Lidar Scanner........................................................................................................................ 3-13
Figure 3-13. Real-Time Screen for Lidar Elevation-Angle Scan Mode ............................................................... 3-15
Figure 3-14. Real-Time VAD Wind Profile ............................................................................................................ 3-16
Figure 3-15. Real-Time PPI View of Radial Wind Component............................................................................ 3-17
Figure 3-16. Pilot’s View......................................................................................................................................... 3-18
Figure 3-17. Controller’s View................................................................................................................................ 3-18
Figure 3-18. Equal-Axis Plan View........................................................................................................................ 3-18
Figure 3-19. Full-Screen Equal-Axis Plan View.................................................................................................... 3-19
Figure 3-20. Shadow Cab Overlooking SFO Airport ............................................................................................ 3-20
Figure 3-21. WTMS Display in Tower Cab ........................................................................................................... 3-20
Figure 4-1. SFO Coordinate System....................................................................................................................... 4-1
Figure 4-2. Crosswind Distribution for Arrivals by Aircraft Weight Sublass (linear scale) .................................... 4-6
Figure 4-3. Crosswind Distribution for Arrivals by Aircraft Weight Subclass (logarithmic scale).......................... 4-7
Figure 4-4. Vortex Detection Probability vs. Crosswind for RWY 28L and Four Aircraft Wake Subclasses....... 4-9
viiiDOT/RITA/Volpe Center
LIST OF FIGURES (cont.)
Figure Page
Figure 4-5. Vortex Detection Probability vs. Crosswind for RWY 28R and Four Aircraft Wake Subclasses .... 4-10
Figure 4-6. WL1 Vortex Detection Probability vs. Age for Four Aircraft Weight Subclasses and Four Parameter
Sets .................................................................................................................................................................. 4-12
Figure 4-7. WL1 Vortex Detection Probability vs. Age for Five Parameters Sets for Four Aircraft Weight
Subclasses ...................................................................................................................................................... 4-13
Figure 4-8. Locations and Crosswinds for First WL1 Vortex Detection: Parameter Sets: 002 (top) and 020
(bottom): Subclasses: L+ through H+ (left), H+ (right); In Each Box: 28L Arrivals & Starboard Vortices (top)
and 28R Arrivals & Port Vortices (bottom). .................................................................................................... 4-15
Figure 4-9. Locations and Crosswinds for First WL2 Vortex Detection: Parameter Sets: 002 (top) and 020
(bottom): Subclasses: L+ through H+ (left), H+ (right); In Each Box: 28L Arrivals & Starboard Vortices (top)
and 28R Arrivals & Port Vortices (bottom) ..................................................................................................... 4-16
Figure 4-10. Locations and Crosswinds for First WL3 Vortex Detection: Parameter Sets: 002 (top) and 020
(bottom): Subclasses: L+ through H+ (left), H+ (right); In Each Box: 28L Arrivals & Starboard Vortices (top)
and 28R Arrivals & Port Vortices (bottom) ..................................................................................................... 4-17
Figure 4-11. Sodar Measurement Validity vs. Height........................................................................................... 4-22
Figure 4-12. Sodar Valid Measurements vs. Height............................................................................................. 4-22
ixDOT/RITA/Volpe Center
LIST OF TABLES
Table Page
Table 1-1. FAA Aircraft Wake Turbulence Classes................................................................................................ 1-1
Table 4-1. Variable Windline Processing Parameter Sets ..................................................................................... 4-1
Table 4-2. FAA Aircraft Wake Turbulence Classes................................................................................................ 4-3
Table 4-3. Arrival Counts with Valid Windline Data for H+, H- and B5 Classes ................................................... 4-4
Table 4-4. Arrival Counts with Valid Windline Data for L+ Classes ....................................................................... 4-5
Table 4-5. Interpretation of Crosswind Sign............................................................................................................ 4-8
Table 4-6. Summary of Lidar Single-Azimuth Track Files at Site 1 ..................................................................... 4-20
Table 4-7. Summary of Lidar Dual-Azimuth Track Files at Site 1........................................................................ 4-20
Table 4-8. Summary of Single-Azimuth Track Files at Site 2 .............................................................................. 4-20
Table 4-9. Sodar Data Summary........................................................................................................................... 4-21
xDOT/RITA/Volpe Center
LIST OF ACRONYMS
ASOS Automated Surface Observation System
ATC Air Traffic Control
C/L Centerline
CSPR Closely-Spaced Parallel Runways
CTI Coherent Technologies, Inc. (now part of Lockheed Martin Corp.)
CW Continuous Wave
DEN Denver Stapleton Airport
DFW Dallas-Fort Worth Airport
DME Distance Measuring Equipment
DOS Disk Operating System
DOT Department of Transportation
DSL Digital Subscriber Line
FAA Federal Aviation Administration
FMC Final Monitor Controller
GPS Global Positioning System
IFR Instrument Flight Rules
IGE In Ground Effect
ILS Instrument Landing System
IMC Instrument Meteorological Conditions
JFK New York Kennedy Airport
LAN Local Area Network
LDA Localizer-type Directional Aid
LHR London Heathrow Airport
LIDAR LIght Detection And Ranging
MAP Missed Approach Point
MCGTOW Maximum Certificated Gross TakeOff Weight
MEM Memphis Airport
MVICW Maximum Vortex-Induced CrossWind
NASA National Aeronautics and Space Administration
OGE Out of Ground Effect
xiDOT/RITA/Volpe Center
LIST OF ACRONYMS (cont.)
ORD Chicago O’Hare Airport
PPI Plan Position Indicator
PRM Precision Runway Monitor
RITA Research and Innovative Technology Administration
RVR Runway Visual Range
SFO San Francisco International Airport
SODAR SOund Detection And Ranging
SOIA Simultaneous Offset Instrument Approach
SSD Sum of Squared Differences
STL Lambert – St. Louis International Airport
TAMIS Total Airport Management Information System
UTC Universal Coordinated Time
VAD Variable Azimuth Display
VMC Visual Meteorological Conditions
VAOs Visual Approach Operations
WTMS Wake Turbulence Measurement System
YYZ Toronto Pearson Airport
xiiDOT/RITA/Volpe Center
SUMMARY
PURPOSE
This report documents the San Francisco International Airport (SFO) Wake Turbulence Measurement
System (WTMS) and the datasets derived from that system during the collection campaign conducted
from March 2000 to October 2002. While the impetus for the SFO WTMS data collection effort was
to support development of the Simultaneous Offset Instrument Approach (SOIA) procedure, the
extensive data obtained may be useful for other purposes.
SFO has crossed pairs of parallel runways, numbered 1-19 L/R and 10-28 L/R. Both pairs have
centerline spacing of 750 feet. When visual approach operations (VAOs) are permitted, often
simultaneous paired arrivals on Runways 28L and 28R are conducted, with simultaneous departures
intermixed on Runways 1L and 1R. VAOs are generally authorized at SFO when the ceiling is above
3500 feet and the visibility is greater than 4 statute miles. Much of the data collected by the SFO
WTMS are from paired arrivals to Runways 28L and 28R.
EQUIPMENT LAYOUT
Figure S-1 shows the on-airport WTMS installation, including three Windlines, two 20-foot poles for
ambient wind measurements, a Sodar wind profiler, and an equipment trailer. Windline 1 was
1,275 feet long, was located 250 feet before the Runway 28L/R thresholds and covered the entire
approach region under the arrivals including the runway aprons. Windlines 2 and 3 were each
500 feet long and covered only the region between Runways 28L and 28R. The Windlines were
separated by 750 feet in the longitudinal (along-runway) direction.
Figure S-2 shows the two sites where the Pulsed Lidar was operated. At the First site, used most of
the time, the Pulsed Lidar measured wakes generated by aircraft at an altitude of approximately 500
feet above San Francisco Bay, 1.4 nautical miles from the runway thresholds. For one day the Lidar
was located at the Second site where it could scan above Windline 1.
CHRONOLOGY
Windlines
Installation of the Windline portion of the SFO WTMS started in late 1999 and was completed in
March 2000. The first data collection period ended in May 2001 when construction started on a new
apron for Runway 28L. Windline 1 was reinstalled on the new 28L apron. The second data collection
period started in September 2001 and was completed in October 2002. The site was subsequently
restored to its original condition.
Pulsed Lidar
The Coherent Technologies, Inc. (CTI) Pulsed Lidar was deployed at SFO for one month, starting in
September 2001. Measurements over Windline 1 were conducted on September 25, 2001.
S-1DOT/RITA/Volpe Center
LEGEND
Trailer
20-Foot Pole `
Sodar Windline 3
Nominal
Touchdown
Windline 2
28L 28R
Apron installed
between data
collection periods Threshold
Windline 1
Figure S-1. On-Airport Installation of SFO WTMS
Figure S-2. Layout of SFO WTMS Showing Windline 1 and Two Lidar Sites
S-2DOT/RITA/Volpe Center
VALIDATION
The Windline data collection process involved validation at several levels:
Data collection system operating correctly;
Windline data recorded correctly;
Enough Windline anemometers operating correctly to give valid wake detections; and
Windline aircraft detections matched with valid arrivals.
Validation efforts were more thorough for the first data collection period. For the second period, the
Windline anemometers were validated only for Windline 1, which had been determined to be the most
useful for SOIA analysis.
DATA PROCESSING
Windlines
The SFO WTMS recorded Windline data in several different formats. The most useful for off-line
processing was the “run” file, which contains data for one or two arrivals (one on each of Runways
28L and 28R), starting 10 seconds before the first arrival and having a maximum possible wake age
(for the first arrival) of 180 seconds. If paired arrivals were separated by less than 50 seconds, then
their wake data were saved in a single run file. However, if they were separated by 50 seconds or
more, their wake data were stored in separate run files. For these situations, the Windline processing/
analysis program looks in both the run file containing the arrival and the following run file in order to
analyze the behavior of the wakes.
Windline processing/analysis software development continued after completion of SFO data
collection. The next set of Windlines installed by the Volpe Center, at Lambert – St. Louis Inter-
national Airport (STL) beginning in 2003, re-enforced attention on Windlines like SFO Windlines 2
and 3 that measure only between two parallel runways. This additional attention resulted in process-
ing improvements which have minor only impact for SFO Windline 1 but significant impact for SFO
Windlines 2 and 3.
In analyzing Windline data, it should be borne in mind that Windline determinations of vortex lateral
position are robust. However, as the Windline anemometers are far be below the vortex core,
Windline estimates of vortex height and circulation are less reliable.
Pulsed Lidar
The CTI Pulsed Lidar was a developmental wake sensor at the time of SFO WTMS data collection.
Four major versions of the wake vortex processing algorithms have been released since the WTMS
Lidar data were processed, and have provided significant improvements. Generally, for the SFO
Lidar data sets, vortex locations are well defined. However, the circulation values and vortex
identification have uncertainties. Future analysis of SFO Lidar data must take account of these issues
and should consider re-processing the recorded “raw” data using the most recent software release.
S-3DOT/RITA/Volpe Center
1. INTRODUCTION
This section explains the rationale for the San Francisco International Airport (SFO) Wake
Turbulence Measurement System (WTMS) data collection effort and outlines the rest of the report.
1.1 APPROACHES TO CLOSELY-SPACED PARALLEL RUNWAYS
Separation standards for instrument approaches to a single run-
way prevent hazardous wake encounters by requiring increased Table 1-1. FAA Aircraft
Wake Turbulence Classes
longitudinal spacing (from those based on radar considerations)
when an aircraft in a lighter wake class follows an aircraft in a Class MCGTOW* (W, k lb)
heavier class (Table 1-1). The same longitudinal spacing rules are Heavy 255 < W
utilized for aircraft approaching Closely-Spaced Parallel Runways B-757 N/A
(CSPR, defined as having centerline spacing less than 2,500 feet) Large 41 ≤ W ≤ 255
under instrument rules.* That is, CSPR are treated as a single Small W < 41
runway (arrival traffic are regarded as a single stream) for wake * MCGTOW = Maximum Certificated
separation purposes. This “2500-foot rule” greatly reduces the Gross Takeoff Weight
utility of CSPR.
SFO has crossed pairs of parallel runways (Figure 1-1), both pairs having centerline spacing of 750
feet. When visual approach operations (VAOs) are permitted, simultaneous paired arrivals on
Runways 28L and 28R are often conducted, with simultaneous departures intermixed on Runways 1L
and 1R. FAA Order 7110.65, Air Traffic Control (Ref. 1) defines a visual approach as “ATC [Air
Traffic Control] authorization for an aircraft on an IFR [Instrument Flight Rules] flight plan to proceed
visually to the airport of intended landing.” VAOs are generally authorized at SFO when the ceiling is
above 3500 feet and the visibility is greater than 4 statute miles. Much of the data collected by the
SFO WTMS are from paired arrivals to Runways 28L and 28R.
Wake turbulence safety for CSPR arrivals is actually enhanced when the longitudinal spacing for two
aircraft is kept sufficiently small that the wake from the leading aircraft does not have time to transport
to the runway of the following aircraft. This wake avoidance method is used for the paired visual
approaches normally executed on Runways 28L and 28R at SFO. When ceiling or visibility
conditions deteriorate to the point that VAOs are not permitted, then the CSPR instrument rule must
be followed and the landing capacity of Runways 28L and 28R is reduced to approximately half the
visual capacity.
1.2 SIMULTANEOUS OFFSET INSTRUMENT APPROACH (SOIA) PROCEDURE
The SOIA procedure (Ref. 2) was developed as a means to recover some of the capacity lost during
cloud cover below 3500 feet. The SFO SOIA involves the following airport systems: (a) a Precision
Runway Monitor (PRM) consisting of a high-accuracy/high-update-rate beacon radar, radar data
processing and alerting algorithms, and a color display for a dedicated controller position; (b) an
*
In other contexts, CSPR is sometimes defined as parallel runways with centerlines separated by less than 4,300 feet,
because, in this regime, conducting simultaneous ILS approaches during instrument meteorological conditions requires use
of a precision aircraft monitoring (surveillance) system.
1-1DOT/RITA/Volpe Center
Figure 1-1. SFO Airport Diagram
Instrument Landing System (ILS) on Runway 28L; and (c) a Localizer-type Directional Aid (LDA)
on Runway 28R.
1-2DOT/RITA/Volpe Center
LDA Guidance
MAP
3.4 nmi
Visual Guidance
3000 ft
28R
750 ft
28L ILS Guidance
Figure 1-2 Plan View of the SFO SOIA Procedure
During operational use, the SOIA paired-approach procedure (schematically depicted in Figure 1-2)
consists of the following steps:
1. The aircraft bound for Runway 28L makes a normal straight-in approach using Instrument
Landing System (ILS) glide slope and localizer guidance.
2. The aircraft bound for Runway 28R makes an LDA approach, also using lateral and glide
slope guidance. The LDA approach path is angled away from the runway centerline by 2.5
degrees and reaches a distance of 3,000 feet from the Runway 28L centerline at the Missed
Approach Point (MAP), which is defined as 4.0 nautical miles in range from the airport
Distance Measuring Equipment (DME) transponder.
3. If the pilot conducting an approach to 28R can see the 28L-bound aircraft and the ground
before descending to the MAP, the pilot reports this and accepts a visual approach. If a
“visual” is accepted, after reaching the MAP, the pilot performs an S-turn (or sidestep
maneuver) to align the aircraft with Runway 28R and proceeds for landing. If a visual
approach is not accepted, the pilot must execute a missed approach.
4. A Final Monitor Controller (FMC) is assigned to monitor the flight paths of the aircraft during
the operation. The FMC utilizes surveillance data from the PRM radar, which is displayed on
the PRM high resolution color display.
Relative to parallel straight-in approaches, the SOIA procedure greatly reduces the region where wake
encounters might occur — namely only where the flight paths are finally lined up with the runway
centerlines.
In response to the SFO SOIA plans, the Department of Transportation (DOT) Research and Inno-
vative Technology Administration (RITA) Volpe National Transportation Systems Center (Volpe
Center), in support of the FAA, conducted a wake turbulence measurement program at SFO to
characterize the transport properties of wake vortices between the parallel runways 28L and 28R.
This report describes the SFO Wake Turbulence Measurement System (WTMS) and documents the
data collected by it.
1-3DOT/RITA/Volpe Center
SFO WTMS was designed to cover the region where wake encounters might occur for aircraft
following the SOIA procedure (particularly the trailing aircraft approach Runway 28R):
Windline measurements cover the region near the ground where the ground-induced motion
can speed wake transport between the runways, and
Pulsed Lidar measurements cover the region near 500-foot altitude where the crosswind might
be stronger than near the ground.
Another report (Ref. 3) summarizes the SFO WTMS results pertinent to SOIA.
1.3 OTHER PURPOSES OF SFO WTMS
The geography of the Runway 28L-28R region dictated where sensors could be deployed. The
location for Windline 1 was completely constrained. Windlines 2 and 3 were added to explore wake
behavior in the vicinity of the nominal touchdown point. Observations of SFO traffic showed that
many aircraft floated in ground effect far beyond the nominal touchdown point.
The installation of three adjacent Windlines had another advantage over earlier sensor installations.
Vortex detections on the three Windlines could be connected to display the vortex location as a tube
rather than simply as a point in a plane. The vortex display could be more like that obtained by flow
visualization. Under most atmospheric conditions, wake vortices are invisible. As a result, their
existence is known to pilots and controllers but their location and strength are unclear. To provide a
better understanding of wakes, real-time displays were placed at several locations in the SFO tower
building and a near-real-time display was available over the Internet.
1.4 REPORT OUTLINE
The primary intent of this report is to document the SFO WTMS sensors and the resulting datasets, so
that the datasets can be used for future analyses with a full understanding of (a) strengths and
weaknesses of the measurements, and (b) available processing options. Chapter 2 places the SFO
WTMS in the context of wake sensor development and deployments, both prior to and after the SFO
deployment. Chapter 3 outlines the SFO WTMS installation and describes the real-time and post-time
processing features that were implemented. Chapter 4 provides detailed information about the
datasets derived from the SFO WTMS measurements and provides guidance for selecting the correct
dataset for analysis. Chapter 5 draws conclusions about the SFO dataset.
1-4DOT/RITA/Volpe Center
2. WAKE SENSOR DEVELOPMENT AND DEPLOYMENTS
Wake turbulence data collection by the Volpe Center at U.S. and foreign airports, under FAA and
National Aeronautics and Space Administration (NASA) sponsorship, started in the early 1970s. The
same sensor types have been used, in different forms, at many different airports. This chapter places
the SFO datasets in the context of earlier and subsequent datasets by presenting a historical review of
the wake sensors deployed at SFO — Windlines and Pulsed Lidar.* Fundamental differences in
various datasets are explained.
2.1 WINDLINE
2.1.1 Concept
Windlines are based on the concept that,
near the ground, every wake vortex pair
generates opposite-sign crosswind peaks
that are located under the vortex cores. The
crosswind profile is measured by an array of
single-axis anemometers installed on a
baseline perpendicular to the aircraft’s flight
path (Figure 2-1).
Windlines are not manufactured commer-
cially. Instead they are designed and fabri-
cated specifically for each project, based on
the project technical/operational require-
ments and the space available near the
airport’s runway(s) of interest. The basic
Figure 2-1. B-777 Aircraft over SFO Windline 1
components of an airport installation are the
anemometers, poles and fixtures for mounting the anemometers, dataloggers (which perform analog-
to-digital conversion, real-time processing, and storage), and cabling/conduit inter-connecting the
anemometers and dataloggers.
Post-test Windline data processing software has been developed to the point that algorithms can
automatically estimate the lateral transport, circulation, and height of wakes from arrivals on a single
runway or a CSPR pair, for an anemometer array of essentially arbitrary length, spacing and
placement (i.e., in front of or beside the runway, on either or both sides). Real-time arrival wake data
processing software has been developed for special situations such as SFO. Departure wakes have
been measured less frequently, and their processing is less mature.
Figure 2-2 illustrates data collected by SFO Windline 1 and processed by the Windline software for a
B-747-400 arrival on Runway 28R. Lateral position values are for the SFO WTMS coordinate
*
Consistent with their scientific origins, the SFO WTMS instruments generally utilized the metric system for measurement
and recording. However, to the maximum extent possible, the descriptions and sample results presented herein are in
English units, as these are standard for aviation.
2-1DOT/RITA/Volpe Center
SFO Airport Date 011025 Run 200 Distance from 250 (ft)
B744 Arrived on 28R at 153504 Runway Threshold
Headwind = 0.3 (knots) Crosswind = 4.6 (knots)
Height (ft) Line 1 Only Primary Vortices
Vortex Age = 4 seconds
100
28L C/L 28R C/L
0 Ç Ç 800
-200 0 200 400 600 1000
Crosswind (knots)
10 Vortex Age = 4 seconds
0
28L C/L 28R C/L
-10
-200 Ç
0 200 400 600 Ç 800 1000
Lateral Position (ft)
Figure 2-2. Sample SFO Windline 1 Measured and Processed Data
system: the origin is at Runway 28L centerline (C/L) and the positive direction is toward Runway
28R. The bottom plot is a snapshot of the crosswind 4 seconds after the aircraft passed Windline 1.
The port vortex is sensed as a strong negative crosswind (from Runway 28R toward Runway 28L)
centered at a lateral position of 700 feet. The starboard vortex is sensed as a strong positive crosswind
(from Runway 28L toward Runway 28R) at a lateral position of 875 feet. Small squares depict the
anemometer measurements and the solid line is a curve fitted to the measurements. The analytic form
of the curve is based on a model for vortex behavior. The upper plot shows the calculated vortex
locations in the plane above the Windline, based on the model (see Section 3.2.4).
2.1.2 Original Implementations
Windlines were first implemented (Ref. 4) in the 1970s, and have been used to measure landing wakes
at New York’s Kennedy Airport (JFK), Denver’s Stapleton Airport (DEN), London’s Heathrow
Airport (LHR) and Chicago’s O’Hare Airport (ORD). Windlines have also been used to measure
departure wakes at Toronto’s Pearson Airport (YYZ) and ORD. Characteristics of these Windlines
are:
Crosswind propeller anemometers were installed at a height of 10 feet and lateral spacing of
50 feet.
Anemometer signals were sampled at 16 Hz and stored (originally on magnetic tape).
An on-site operator identified the aircraft generating the measured wakes.
Windline data were processed in 2-second blocks. Visual data analysis used printer plots
showing: (a) the location of the anemometers having largest positive and negative crosswind
values, and (b) the number of the 32 samples that indicated the peak crosswind. The track was
terminated when the peak anemometer jumped discontinuously to a different location.
2-2DOT/RITA/Volpe Center
2.1.3 Recent Implementations
The current series of Volpe Center Windline installations started at JFK airport, on the approach to
Runway 31R:
Both vertical wind and crosswind anemometers were installed on 28-foot poles with 50-foot
lateral spacing.
Data were recorded as 2-second averages.
Data collection and processing were both completely automated.
An analytic model was fitted to the data and then used to estimate vortex circulation and
height, in addition to lateral position. The height and circulation values are, however, less
robust than the lateral position values.
Implementations similar to the JFK Windline were installed at other airports, with changes dictated by
airport-specific considerations. For example, the SFO deployment addressed in this report had the
following differences:
Because of the Windlines proximity to the runways, 3-foot poles were used (see Figure 2-1).
At that height the vertical wind component is effectively zero, so only the crosswind
component was measured. However, the pole spacing was halved to 25 feet, to give the same
spatial measurement rate for use in fitting the data to a model.
Because anemometers could not be installed on the runways, the second and third SFO
Windlines could not completely cover the region under the approach path. Consequently,
vortex detection had to wait for wake lateral transport onto the Windline, not just vertical
descent.
The Windline processing algorithms/software had to be modified to permit simultaneous
tracking of wakes generated by arrivals on both runways; as many as four vortices could be
present at the same time.
Windlines have the following limitations:
Vortex detection is effective for wakes generated near the ground or descending toward the
ground. However, detection sensitivity for vortices rising from the ground can be much less
than for vortices remaining close to the ground. Thus, the apparent lifetimes for rising vortices
can be shorter than their actual lifetimes.
When vortices are transported laterally by the ambient crosswind, the downwind vortex
usually rises because of interaction with the ambient windshear at the ground. Thus, care must
be taken in analyzing Windline transport distances from these vortices, which present the most
significant safety risk for CSPR operations.
2.2 PULSED LIDAR
The Pulsed Lidar represents a major improvement in spatial coverage (up to several thousand yards)
over the Continuous Wave (CW) Lidar that was developed in the 1970s. The CW Lidar obtained
range resolution by beam focusing, and had a maximum effective range of approximately 250 yards.
2-3DOT/RITA/Volpe Center
2.2.1 Concept
Pulsed Doppler Lidars function by transmitting pulses of light into the atmosphere and detecting
frequency shifts that are induced by motion of natural particulates or aerosols suspended in the
atmosphere. The motion of the scatterers, arising due to the wind and/or vortex, alters the frequency
of the scattered light via the Doppler effect. The return signal is detected by a photodetector, and the
resulting electrical signal is then amplified, digitized and analyzed via various spectral techniques.
The processed return signals for multiple pulses are averaged together as the system's scanner is swept
through the region of interest. Time gating, coupled with the pulsed transmission, enables resolution
of features in range. The Doppler Lidar can only sense the component of the local velocity vector that
is along the beam look direction (i.e., line-of-sight velocity).
The Doppler lidar pulses travel through the atmosphere at the speed of light and operate at an infrared
wavelength of around 2 microns (0.000,006,6 feet). This short wavelength helps counteract the fact
that any pulsed remote sensor has a tradeoff between range and velocity resolution that depends upon
the speed of propagation and the wavelength of illumination. At the 2 micron wavelength, the laser
light is invisible to the naked eye and is eyesafe at power levels that give good backscatter signals
from natural aerosols in the atmosphere.
2.2.2 Recent Implementations
In the early 1990s the Air Force and NASA
funded the initial Pulsed Lidar development
for wake measurements. The NASA Pulsed
Lidar used a Coherent Technologies, Inc.
(CTI) transceiver and was deployed at JFK
airport from 1996 through 1998 and at Dallas-
Fort Worth (DFW) airport in 2000. NASA
developed its own processing algorithm for
these tests. CTI developed an alternative
algorithm using Air Force and NASA data.
The first wake measurements with the current
CTI Pulsed Lidar system were conducted at
DFW in 2000. The SFO WTMS was the first
major deployment of the current CTI Pulsed
Lidar for wake measurements (Figure 2-3). Figure 2-3. CTI Pulsed Lidar at SFO
The CTI Pulsed Lidar operates with a range
resolution of 200 feet and a velocity resolution of less (better) than 6 feet/second. Pulses are
transmitted at 500 Hz. Spectra are generated in real time for overlapping range gates with spacing less
than 200 feet. Spectra are averaged over 25 pulses to reduce fluctuations, resulting in an update rate of
20 Hz.
The Lidar beam is expanded to an aperture of approximately 4 inches before it enters the scanner. The
Lidar scanner can point the beam in azimuth and elevation. The most useful wake scan mode uses a
fixed azimuth angle perpendicular to the flight path and scans through the wake in elevation.
2-4You can also read


