Simulating sediment discharge at water treatment plants under different land use scenarios using cascade modelling with an expert-based ...
←
→
Page content transcription
If your browser does not render page correctly, please read the page content below
Hydrol. Earth Syst. Sci., 25, 6223–6238, 2021
https://doi.org/10.5194/hess-25-6223-2021
© Author(s) 2021. This work is distributed under
the Creative Commons Attribution 4.0 License.

Simulating sediment discharge at water treatment plants
under different land use scenarios using cascade
modelling with an expert-based erosion-runoff
model and a deep neural network
Edouard Patault1 , Valentin Landemaine2 , Jérôme Ledun3 , Arnaud Soulignac4 , Matthieu Fournier1 ,
Jean-François Ouvry3 , Olivier Cerdan2 , and Benoit Laignel1
1 Normandie UNIV, UNIROUEN, UNICAEN, CNRS, M2C, FED-SCALE, Rouen, France
2 BRGM, 3 avenue Claude Guillemin, BP6009, 45060 Orléans CEDEX 2, France
3 AREAS, 2 avenue Foch, 76460 Saint-Valéry-en-Caux, France
4 BRGM, 1039 rue de Pinville, 34000 Montpellier, France

Correspondence: Edouard Patault (edouardpatault@gmail.com) and Matthieu Fournier (matthieu.fournier@univ-rouen.fr)

Received: 10 July 2020 – Revised: 22 September 2020 – Accepted: 19 April 2021 – Published: 9 December 2021

Abstract. Excessive sediment discharge in karstic regions          was found by a classical trial-and-error procedure, and the
can be highly disruptive to water treatment plants. It is essen-   model was trained on 2 significant hydrologic years. Evalu-
tial for catchment stakeholders and drinking water suppliers       ation on a test set showed a good performance of the model
to limit the impact of high sediment loads on potable water        (NSE = 0.82), and the application of a monthly backward-
supply, but their strategic choices must be based on simula-       chaining nested cross-validation revealed that the model is
tions integrating surface and groundwater transfers and tak-       able to generalize on new datasets. Simulations made for the
ing into account possible changes in land use. Karstic en-         four land use scenarios suggested that ploughing up 33 %
vironments are particularly challenging as they face a lack        of grasslands would increase sediment discharge at the wa-
of accurate physical descriptions for the modelling process,       ter treatment plant by 5 % on average. By contrast, eco-
and they can be particularly complex to predict due to the         engineering and best farming practices will significantly re-
non-linearity of the processes generating sediment discharge.      duce sediment discharge at the water treatment plant (respec-
The aim of the study was to assess the sediment discharge          tively in the ranges of 10 %–44 % and 24 %–61 %). The cou-
variability at a water treatment plant according to multiple       pling of these two strategies is the most efficient since it
realistic land use scenarios. To reach that goal, we devel-        affects the hydro-sedimentary production and transfer pro-
oped a new cascade modelling approach with an erosion-             cesses (decreasing sediment discharge from 40 % to 80 %).
runoff geographic information system (GIS) model (Wa-              The cascade modelling approach developed in this study of-
terSed) and a deep neural network. The model was used in           fers interesting opportunities for sediment discharge predic-
the Radicatel hydrogeological catchment (106 km2 in Nor-           tion at karstic springs or water treatment plants under mul-
mandy, France), where karstic spring water is extracted to         tiple land use scenarios. It also provides robust decision-
a water treatment plant. The sediment discharge was simu-          making tools for land use planning and drinking water sup-
lated for five design storms under current land use and com-       pliers.
pared to four land use scenarios (baseline, ploughing up of
grassland, eco-engineering, best farming practices, and cou-
pling of eco-engineering/best farming practices). Daily rain-
fall time series and WaterSed modelling outputs extracted at
connected sinkholes (positive dye tracing) were used as input
data for the deep neural network model. The model structure

Published by Copernicus Publications on behalf of the European Geosciences Union.
6224       E. Patault et al.: Simulating sediment discharge at water treatment plants under different land use scenarios

1   Introduction                                                  can therefore be a difficult task (Savary et al., 2017; Jourde
                                                                  et al., 2018). Based on systemic approaches, as initiated by
In karstic environments, erosion and runoff can lead to a         Mangin (1984), karst can be considered a system able to
high load of sediments in surface and underground streams.        transform an input (rainfall) into an output (discharge), and
Sediment discharge (SD) can occur through rapid and di-           the input–output relation can be evaluated using mathemat-
rect transfer via sinkholes and/or via re-suspension of sed-      ical functions. This approach can be considered a “black-
iment in the karst network itself (Masséi et al., 2003). For      box” model to some extent, and recent research emphasized
suppliers of drinking water, excessive sediment input can be      the advantages of using data-driven techniques, such as deep
highly disruptive, requiring additional treatment or, in the      neural networks (DNNs) in similar situations (Yaseen et al.,
worst cases, temporary shutdowns of a water treatment plant       2015; Kratzert et al., 2018, 2019). DNNs are advanced ar-
(WTP; Stevenson and Bravo, 2019). Impacts can be signifi-         tificial neural networks (ANNs) which have been gaining
cant, including restrictions on the use of drinking water. Up-    momentum since 2012 in the computer sciences and whose
per Normandy (France) is particularly affected, and the eco-      adoption has been gradual in hydrology (Shen, 2018). DNNs
nomic cost linked to the restrictions on the use of drinking      are now commonly used for modelling real-world problems
water due to excessive sediment inputs in raw water was           due to their ability to represent and generalize complex non-
estimated at EUR 5 million during the period 1992–2018            linear relationships between inputs and outputs (Meyers et
(Patault et al., 2021a); 10 000 to 20 000 people are still af-    al., 2016, 2017; Hafeez et al., 2019). DNNs can help by
fected every year by restrictions on the use of drinking wa-      providing both stronger predictive capabilities and a com-
ter in the region (ARS, 2013). Reducing sediment delivery         plementary avenue toward knowledge discovery in the hy-
to sinkholes is therefore essential for catchment managers in     drologic sciences (Shen et al., 2018). Limited but conclu-
order to reduce the impact on potable water supply. One way       sive applications were made to predict inflows to reservoirs,
to achieve this would be to build a complex decision-making       water levels of combined sewage outflow structures, turbid-
process modelling chain, integrating surface and ground-          ity, and flood forecasting in karst regions and integrated in
water transfers. Several approaches have been proposed to         rainfall–runoff modelling to better predict streamflows (Siou
model erosion/runoff and the karstic response induced by          et al., 2011; Bai et al., 2016; Savary et al., 2017; Hu et al.,
rainfall, but these approaches are often treated separately,      2018; Kratzert et al., 2018). The main objectives of this study
which does not make it possible to evaluate the impact of         were (i) to develop a cascade modelling approach able to
a change in land use on the sediment load delivered to a          simulate hydro-sedimentary transfer at a WTP for specific
WTP. Many studies in the literature have focused on hills-        daily rainfall events and (ii) to evaluate the impact of differ-
lope erosion processes using different types of erosion mod-      ent land use scenarios on the SD variability. This study was
els (Merritt et al., 2003; De Vente et al., 2013). Empirical      conducted in the Radicatel hydrogeological catchment (Nor-
models, such as RUSLE (Renard and Freidmund, 1994), are           mandy, France), where spring water is extracted to a WTP.
frequently used because of limited data requirements but are      We benefited from the use of an existing expert-based geo-
not able to fully represent spatial and temporal dynamics of      graphic information system (GIS) model (WaterSed), devel-
erosion processes at the catchment scale (Verstraeten et al.,     oped and successfully applied to the studied area, to simulate
2007). Physical models, such as WEPP or LISEM (Laflen             the impact of land use management on hydro-sedimentary
et al., 1991; Takken et al., 1999), can more accurately de-       transfers to connected sinkholes. Rainfall event characteris-
scribe processes but may require many input parameters that       tics and WaterSed outputs were then used as input for a data-
are not available for application to large areas. Expert-based    driven model (i.e. a DNN) to simulate SD at the WTP. The
models (e.g. STREAM, WaterSed; Cerdan et al., 2001; Lan-          cascade modelling approach was applied to multiple design
demaine, 2016) offer an interesting compromise focusing on        storms (DS) under different scenarios in order to simulate
the main driving factors of runoff and erosion. These mod-        hydro-sedimentary transfer in the hydrogeological catchment
els have been designed with cultivated areas of the European      and evaluate the efficiency of different land use management
loess belt in mind and are particularly efficient where Horto-    strategies.
nian overland flow dominates (Souchère et al., 2005; Evrard
et al., 2010; Landemaine, 2016). Some hillslope erosion stud-
ies conducted in similar karstic environments do not account      2   Study site
for the transmissivity loss of water and sediment in sinkholes.
Other studies that have focused on modelling karst processes      The study site is in the Pays de Caux (Normandy, France)
have mainly examined karstic floods but, for the most part,       on the right bank of the Seine River about 30 km from the
have overlooked sedimentary fluxes (see the review of Hart-       Seine estuary (Fig. 1a). The climate is temperate with an av-
mann et al., 2014). Due to the non-linearity of the processes     erage temperature of 11 ◦ C. Annual precipitation ranges be-
generating sediment at karstic springs and the lack of ac-        tween 600 and 1100 mm yr−1 with a rainy season occurring
curate physical descriptions of karstic environments, mod-        between October and May. The karst is typical of the geo-
elling surface–subsurface interactions with physical models       logical setting of the lower Seine Valley. The karstic chalk

Hydrol. Earth Syst. Sci., 25, 6223–6238, 2021                                      https://doi.org/10.5194/hess-25-6223-2021
E. Patault et al.: Simulating sediment discharge at water treatment plants under different land use scenarios                     6225

Figure 1. (a) Location of the study site in the lower Seine Valley (Normandy, France) on the right bank of the Seine River (Hanin, 2011)
and (b) location of the water treatment plant of Radicatel and the seven connected sinkholes. The background map was retrieved from
BD Ortho © IGN.

plateaus of the north-eastern side of the Normandy region             tively connected to the springs (in situ dye tracing already
are part of the western edge of the Paris Basin. The elevation        performed and confirming the connection). The WTP of Rad-
ranges from 138 to 0 m a.s.l. (above sea level), and the me-          icatel is exploited by the Le Havre-Seine Métropole (LHSM)
dian slope is 5.9 %. The geology consists of Cenomanian to            to supply Le Havre inhabitants. Turbidity (NTU) is measured
Campanian chalk overlaid by thick surficial formations. The           with a nephelometer at the inlet of the pumping station and
major formation is composed of clay with flints, which re-            has been recorded since 1987 (Fig. 2). The maximum turbid-
sults from the weathering of the chalk (Laignel, 2003), loess,        ity value is recorded every day (1t = 1 d) and LHSM pro-
and tertiary sands (Lautridou, 1985). The thickness of the            vided access to the entire turbidity time series (1987–2017).
formation overlying the chalk ranges from 5 to 10 m. Water            Incomplete periods or hydrologic years with missing data
infiltrates from the uplands of the chalk aquifer to the valleys      were discarded. Twenty-two hydrologic years with a com-
via rapid transfer through a highly developed karstic network         plete time series of turbidity were kept for the rest of the
and via slower drainage through the thick surficial forma-            study.
tions.
   The hydrogeological catchment of Radicatel covers
106 km2 and the WTP is located at the interface of the Seine          3   Methodology
alluvium and the karstic chalk (Fig. 1b). Water is pumped
                                                                      The proposed cascade modelling for the simulation of SD at
from four different springs and seven pumping wells near
                                                                      a WTP incorporates two different models that can be used
the WTP (Chédeville, 2015). According to the information
                                                                      separately or as part of an integrated modelling framework.
system for groundwater management in Seine–Normandy
                                                                      These components are described in detail in the following
(http://sigessn.brgm.fr/, last access: 1 September 2020), hy-
                                                                      sections.
drogeological investigations reported seven sinkholes posi-

https://doi.org/10.5194/hess-25-6223-2021                                           Hydrol. Earth Syst. Sci., 25, 6223–6238, 2021
6226       E. Patault et al.: Simulating sediment discharge at water treatment plants under different land use scenarios

Figure 2. Cumulative daily rainfall (mm) extracted from the SAFRAN database over the Radicatel hydrogeological catchment and maximum
daily turbidity (NTU) observed at the water treatment plant from 1987 to 2017.

3.1    Expert-based GIS model                                       of the input data, and there is no specific rule for selecting
                                                                    these parameters (Le et al., 2019). Neural networks are ad-
The WaterSed model uses a raster-based distributed approach         justed during a training stage when the parameters are cal-
to model the spatial distribution of runoff and soil erosion        culated iteratively in a gradient descent that seeks to mini-
within a catchment for a given rainfall event. The WaterSed         mize a mean squared error. For efficient learning, input vari-
model is an upgrade of the STREAM model (Souchère et                ables were rescaled between 0 and 1 using normalization
al., 1998; Cerdan et al., 2001) simulating hydrological pro-        and re-transformed for the simulations using the normaliza-
cesses by conceptualizing each raster grid cell as a reser-         tion parameters. The mean squared error (MSE) was cho-
voir whose properties are calculated at the event scale and         sen as a loss function, and the adaptive moment estimation
by routing both water and sediment according to the surface         (Adam) was adopted as the model optimization algorithm.
flow network. The WaterSed model requires several datasets          After training, the quality of the model is evaluated on a test
to compute runoff and erosion for any location in the catch-        set. The ability of the model on the test set is known as gen-
ment: (i) a digital elevation model (DEM) to extract the slope      eralization, and it can be influenced by overfitting during the
and the runoff flow network, (ii) a stream network (used to         training stage. To avoid overfitting and increase model ro-
modify the DEM to ensure a steady downstream gradient               bustness, we used two regularization methods in this study:
according to the observed hydrographic network) and river           (i) early stopping and (ii) cross-validation. Early stopping is
width, (iii) a land cover and soil texture map to associate         an efficient regularization method that prevents the model
each land cover in the catchment with the appropriate soil          from overfitting (Sjörberg and Ljung, 1992). We visually
surface characteristics, (iv) decision tables, adapted for the      monitored the learning curves and stopped the training as
local conditions, to associate each soil surface characteris-       soon as the validation error reached a minimum. Then, we
tic (soil surface crusting, surface roughness, and crop cover)      rolled back the model parameters to the point where the val-
observed in the land cover or field with a steady-state infiltra-   idation error was at the minimum. The choice of the train-
tion rate, a Manning roughness coefficient, a single potential      ing/test set remains arbitrary and may need to be evaluated
sediment concentration, and a soil erodibility value (Cerdan        to compute a robust estimate of model error. With time se-
et al., 2002a), and (v) rainfall events including total precipi-    ries data, care must be taken when splitting the data in order
tation, antecedent moisture (48 h), and effective rainfall du-      to prevent data leakage (Cochrane, 2018). To address this is-
ration.                                                             sue, we adapted a monthly backward-chaining nested cross-
                                                                    validation procedure, which provides an almost unbiased es-
3.2    Deep neural network                                          timate of the true error (Varma and Simon, 2006). The proce-
                                                                    dure contains an inner loop for parameter tuning and an outer
In this study, a multi-layer feed-forward network (DNN) was         loop for error estimation (see Fig. B1). The parameters that
built under Python version 3.6 using the high-level API Keras       minimize error are chosen on the inner loop, and we add an
(Chollet, 2015) and Tensorflow (Abadi et al., 2016) as a            outer loop, which splits the data into multiple training/test
background engine. A multi-layer feed-forward neural net-           sets. Then, the error is averaged on each split to evaluate
work is an interconnection of perceptrons in which data and         the overall performance of the model. The optimum structure
calculations flow in a single direction, from the input data        and configuration of the network (model design) were found
to the outputs. The number of layers in a neural network            by a classical trial-and-error procedure (training-evaluation
is the number of layers of perceptrons. The number of hid-
den layers and perceptrons depends on the characteristics

Hydrol. Earth Syst. Sci., 25, 6223–6238, 2021                                        https://doi.org/10.5194/hess-25-6223-2021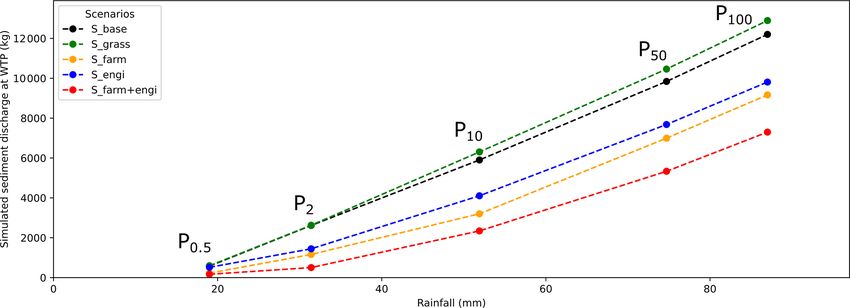
E. Patault et al.: Simulating sediment discharge at water treatment plants under different land use scenarios              6227

process through optimization of errors; Ortiz-Rodriguez et       map (three classes: clay, silt, and sand) was derived from
al., 2013).                                                      the Regional Pedological Referential (RRP) with a precision
                                                                 of 1 : 250 000. The parametrization consists of a character-
3.3    Performance evaluation                                    ization of the main parameters influencing runoff and infil-
                                                                 tration in the studied context: soil surface crusting, surface
The performance of the model was evaluated through the           roughness, and crop cover. These soil surface characteris-
Nash–Sutcliffe efficiency (NSE) and the root mean square         tics were defined for each month and for each crop class
error (RMSE). The RMSE corresponds to the standard devi-         according to the cropping calendar developed by Evrard et
ation of the residuals (prediction errors). The residuals are    al. (2010) and Delmas et al. (2012). Steady-state infiltration
a measure of the distance from the data points of the re-        and potential sediment concentration were assigned to each
gression line. They evaluate how the predictions match to        soil surface characteristic according to Cerdan et al. (2001,
the observations, and values may range from no fit (+∞) to       2002b). The WaterSed model requires Manning’s roughness
perfect fit (0) based on the relative change in the data. The    coefficient in order to compute flow velocity. Based on soil
NSE (Nash and Sutcliffe, 1970) indicates the model’s abil-       surface characteristics, Manning’s values were derived from
ity to predict variables different from the mean and gives       surface roughness (Morgan, 2005) and the percentage of crop
the proportion of the initial variance accounted for by the      cover (Gilley et al., 1991). Last, soil surface characteristics
model. NSE values vary between −∞ (poor model) and 1,            were also used to define the soil erodibility factor, varying
indicating a perfect fit between observed and predicted val-     in the [0–1] interval, by adapting the table developed by
ues. Finally, to ensure that the model does not suffer from a    Souchère et al. (2003). Calibration parameters were extracted
weakness when making simulations during extreme events,          from a previous study (Landemaine, 2016; Landemaine et
we performed an additional evaluation using the generalized      al., 2020b) conducted in the Austreberthe catchment, located
extreme value (GEV) distribution that is broadly applied to      30 km east of the Radicatel catchment. For the training phase
extreme events such as rainfall or river discharges (Carreau     of the DNN, erosion and runoff were calculated with the Wa-
et al., 2013; De Michele and Avanzi, 2018). The GEV dis-         terSed model for 269 events to reduce computational efforts,
tribution was fitted to SD time series at the WTP of Radi-       considering that erosion and runoff occur only for significant
catel. The maximum annual SD observed at the WTP was             rainfall events (P > 2.5 mm d−1 , the threshold below which
extracted for all complete hydrologic years (i.e. annual max-    no effective rainfall is generated, and runoff and sediment
imal blocks; n = 22) and the distribution was fitted using       discharge entering connected sinkholes were set to 0).
the package “extRemes” of the R software (R Development
Core Team, 2008; Gilleland and Katz, 2016; see Fig. C1).         4.2   DNN data
We compared the SD simulated at the WTP by the DNN to
the values calculated by the GEV.                                Cumulative daily rainfall (mm) from 1987 to 2017 was ex-
                                                                 tracted from the SAFRAN database over the hydrogeolog-
                                                                 ical catchment of Radicatel. SAFRAN data are hydrocli-
4     Data
                                                                 matic data covering France at a resolution of 8 km on an ex-
Appropriate data handling can help address various concerns      tended Lambert-II projection and produced by Météo-France
in DNN modelling, such as its ability to generalize beyond       (Quintana-Segui et al., 2008; Vidal et al., 2010). We used
training limits (Kourgialas et al., 2015). Moreover, cascade     the rainfall time series (i.e. daily cumulative rainfall, P, and
modelling with a GIS and a DNN can require important com-        48 h antecedent rainfall, P48 ) retrieved from the SAFRAN
putational effort; therefore, the input data must be carefully   database and WaterSed modelling outputs – runoff (RWS )
selected.                                                        and sediment discharge (SDWS ) – at connected sinkholes as
                                                                 input data for the DNN model. The SD time series at the Rad-
4.1    WaterSed data                                             icatel WTP was retrieved from turbidity data and considered
                                                                 the output for the DNN. In this study, turbidity data distribu-
To compute erosion and runoff, the WaterSed model needs          tion was explored using scatter plots (Fig. A1). The turbid-
a DEM. The DEM (5 m resolution) was retrieved from               ity data were chosen so that they include the best dispersion
BD Alti® . Depressions in the DEM were filled accord-            of values (0–370 NTU) and a strong recurrence of extreme
ing to the algorithm developed by Wang and Liu (2006).           turbidity values (> 150 NTU). Thus, 2 significant hydro-
The stream network location and width were provided by           logic years (H12–H13; from 1 October 1998 to 30 Septem-
BD TOPO® . To define the soil surface characteristics needed     ber 2000) were selected, accounting for 731 daily events.
by the WaterSed model, we computed a land cover map              These 2 hydrologic years were selected as the training/test
and a soil texture map. The land cover map was developed         set of the model. Data were split as a training set (70 %) and a
for 2016 by combining two national databases: the French         test set (30 %) while respecting the chronology of daily rain-
Land Parcel Identification System (RPG) and the Soil Ob-         fall amounts. The training set was also split into training and
servatory of Upper Normandy (OSCOM). The soil texture            stop sets to fine-tune the hyperparameters (70 %–30 %). At

https://doi.org/10.5194/hess-25-6223-2021                                     Hydrol. Earth Syst. Sci., 25, 6223–6238, 2021
6228 E. Patault et al.: Simulating sediment discharge at water treatment plants under different land use scenarios
Table 1. Design storms defined for the Radicatel catchment and on the Radicatel catchment, which have been included
considered for the simulations. in the WaterSed model.
Return Daily 6 min 48 h Season – Ploughing up of grassland (S_grass): based on re-
period cumulative maximum antecedent gional benchmarks (DRAAF; https://draaf.normandie.
(year) rainfall intensity rainfall
agriculture.gouv.fr/, last access: 1 September 2020)
(mm) (mm h−1 ) (mm)
for the 1970–2010 period in the studied region (Pays
0.5 19 25 45 Winter de Caux), we observed an average conversion rate of
2 31.4 25 45 Winter grasslands up to 900 ha yr−1 . Extrapolation by 2050 led
10 51.9 45 0 Spring to the conversion of 33 % of existing grasslands. The ex-
50 74.7 45 0 Spring trapolated rate was applied on the Radicatel catchment.
100 87 45 0 Spring Grasslands were ploughed up based on a slope criterion,
taking into account the working conditions of farmers
and prioritizing those with mild slopes (< 12 %) and
the Radicatel WTP, the mean pumping flow rate is estimated therefore mainly located on the plateau upstream of the
to 19 733 m3 d−1 , and the volume of water pumped in 2018 catchment.
was approximately 7.2 million m3 . SD (kg d−1 ) was assessed
considering turbidity time series, mean pumping flow rate – Eco-engineering (S_engi): based on expert knowledge,
at the Radicatel WTP, and the relation between turbidity 181 fascines and 13.1 ha of grass strips were imple-
and sediment concentration resulting from field investiga- mented in addition to existing erosion control mea-
tions ([mg L−1 ] = 0.96 · [NTU]; R 2 = 0.97; Hanin, 2011). In sures to mitigate runoff/erosion on the catchment and
accordance with previous studies by Masséi et al. (2006) and reduce rapid transfer via the connected sinkholes. Grass
Hanin (2011) in a karstic environment in Normandy, a lag of strips were deployed on the flow paths in the vicinity of
1 d was applied to the SD time series to properly match the the sinkholes. Fascines were deployed throughout the
rainfall input. catchment, also on flow paths and along plot bound-
aries. This scenario allows for a shift from a 0.19 per
4.3 Design storms and land use scenarios 30 ha erosion control measure density to nearly 1 per
30 ha, which is advised to promote sedimentation and
Five design storms were constructed for the cascade mod- landscape restructuring (Ouvry et al., 2019). The local-
elling approach based on expert knowledge and depth– ization was optimized according to the baseline scenario
duration–frequency curves of the French Meteorological simulations.
Survey (Météo-France) available from 1996 to 2006 on the
studied area (Table 1). We considered winter events for low – Best farming practices (S_farm): this scenario promotes
return period rainfall (0.5 and 2 years). In the studied region, the adoption of farming practices improving infiltration
even low daily rainfall depths can lead to severe erosion by on the catchment (increasing crop cover or delaying the
water runoff due to saturated soils induced by heavy cumu- formation of the slaking crust). Fifty percent of the plots
lated rainfall on antecedent days (Le Bissonnais et al., 2002; were randomly selected and applied a 15 % increase in
Evrard et al., 2010). For higher return periods (i.e. 10, 50, infiltration capacity, respecting the actual proportions
and 100 years), we considered spring events that are charac- of winter and spring crops on the catchment. The ap-
terized by stronger rainfall intensities and that can be partic- plied value was set based on the study of Maetens et
ularly damaging in this region (Evrard et al., 2007). al. (2012), who synthesized the reduction in erosion and
Four land use change scenarios for the year 2050 were runoff following different agricultural practices across
investigated and compared to a baseline land use sce- Europe. According to their results, a 15 % increase in
nario (2018). The scenarios were incorporated into the model infiltration capacity can be regarded as a conservative
in order to simulate SD variability at the WTP and evaluate assumption that can be easily achieved through simpli-
their impacts. All scenarios are described below. fied agricultural techniques (e.g. minimum tillage, no
till, direct seeding, crop cover).
– Baseline scenario (S_base): this scenario served as a
reference and was built considering the latest available – Coupling eco-engineering and best farming prac-
land use data on the catchment (see Sect. 3.3). Exist- tices (S_farm + engi): both scenarios, S_farm and
ing erosion control measures in 2018 were considered S_engi, were combined. Experiments carried out in the
and extracted from a regional database (BD CASTOR; study area suggested that combining both approaches is
http://bdcastor.fr/, last access: 1 September 2020). The necessary to reduce the impact on sensitive or vulnera-
database contained 45 dams/retention ponds, 16 ponds, ble areas (Ouvry et al., 2012).
1 fascine, and 4 hedges for the actual land use scenario
Hydrol. Earth Syst. Sci., 25, 6223–6238, 2021 https://doi.org/10.5194/hess-25-6223-2021E. Patault et al.: Simulating sediment discharge at water treatment plants under different land use scenarios 6229
Figure 3. Cumulative sediment discharge (kg) and runoff (m3 ) simulated by the WaterSed model, extracted and summed over all positively
connected sinkholes from October 1998 to September 2000.
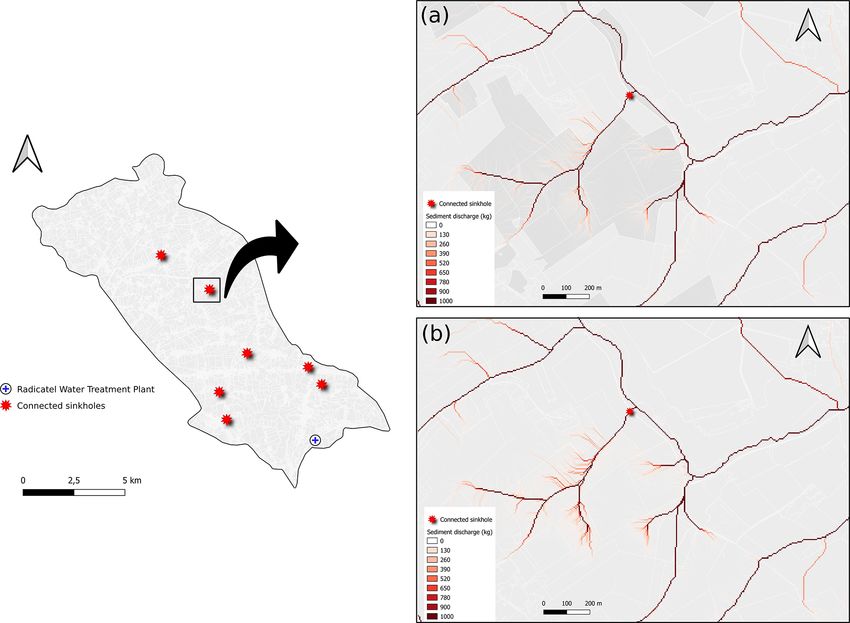
Figure 4. Observed and simulated sediment discharge (kg) at the water treatment plant using the DNN model.
5 Results were transported during seven major events (i.e. 0.95 % of
the time). Over the 126 events, the maximum RWS and
5.1 Modelling the inputs SDWS reached 38 471 m3 and 38 380 kg (µSDWS = 2102 kg;
µRWS = 1705 m3 ; σ SDWS = 5826 kg; σ RWS = 4437 m3 ).
In order to feed the DNN, erosion and runoff were sim-
ulated with the WaterSed model for 269 rainfall events 5.2 DNN: calibration and generalization
over the entire Radicatel catchment. We used the WaterSed
parametrization that was carried out on the adjacent catch- The final structure of the DNN was composed of one input
ment (La Lézarde; Landemaine et al., 2020a) and that had layer with four variables, two hidden layers, and one out-
already proved to be valid in the same area of the Pays put layer with the targeted variable. We set 40 neurons in
de Caux (Landemaine, 2016; Landemaine et al., 2020b) the hidden layers as follows: 30–10. We used the rectified
and Belgium (Baartman et al., 2020). For each event, Wa- linear (ReLU) activation function for the two hidden layers.
terSed outputs – i.e. runoff (RWS ; m3 ) and sediment dis- The optimal number of iterations was set to 15 and the batch
charge (SDWS ; kg d−1 ) values – were independently ex- size to 1. We used the runoff and sediment discharge sim-
tracted over the connected sinkholes and summed to con- ulated by the WaterSed model for the 2 selected hydrologic
sider a unique contribution from the seven sinkholes to the years as inputs for the DNN. The rainfall time series (P , P48 )
spring. Figure 3 shows that from October 1998 to Septem- available on the catchment were also considered as inputs. A
ber 2000, rainfall events led to a significant cumulative runoff turbidity time series recorded at the WTP was transformed
and sediment discharge to the sinkholes (RWS = 213 225 m3 ; into sediment discharge knowing the mean pumping flow
SDWS = 262 806 kg). Most of the events occurred during rate at the Radicatel WTP and considering a mean sediment
spring (SDWS_spr = 131 672 kg; RWS_spr = 94 732 m3 ) and concentration of 1 mg L−1 from field investigations made by
winter (SDWS_win = 88 413 kg; RWS_win = 62 590 m3 ). Sed- Hanin (2011). Thus, sediment discharge at the WTP was con-
iment discharge and runoff occurred on the catchment for sidered as output of the DNN. The DNN was trained from
only 126 events over the 269 simulated; 61 % of the SDWS October 1998 to February 2000 (n = 511 daily events). The
(i.e. 162 168 kg) and 52 % of the RWS (i.e. 110 877 m3 ) remaining period from March 2000 to September 2000 was
https://doi.org/10.5194/hess-25-6223-2021 Hydrol. Earth Syst. Sci., 25, 6223–6238, 20216230 E. Patault et al.: Simulating sediment discharge at water treatment plants under different land use scenarios Figure 5. Boxplots of the performance metrics over the training and test sets using the monthly backward-chaining nested cross-validation. Figure 6. Simulated sediment discharge (kg) at the water treatment plant of Radicatel for the five design storms and the land use baseline scenario by (1) generalized extreme value distribution and (2) DNN modelling. The grey bars represent the 95 % confidence intervals. used as the test set (n = 220 daily events). Modelling results France), which evaluated the proportion of direct transfers at (Fig. 4) suggested a good agreement between observed and 73 % during erosive events. simulated SD at the WTP over the test set, with a NSE crite- The monthly backward-chaining nested cross-validation rion reaching 0.82 and a RMSE around 383 kg. The tempo- procedure made it possible to assess the generalization ca- ral variability was also well reproduced. The results over the pacity of the DNN on a new dataset. This procedure removed training set were slightly worse and reached a NSE of 0.6 and 1 month from the initial dataset (i.e. 731 events) and was a RMSE of 420 kg. Over the investigated period, the cumu- repeated 12 times while keeping at least 1 full hydrologic lative SD observed at the WTP reached 158 611 kg, whereas year as input for the modelling. The modelling results were the simulated cumulative SD reached 129 253 kg (underesti- more efficient for the inner loop (Fig. 4) than for the outer mation of 19 %). Comparing SDWS and observed SD at the loops (Figs. 5 and B1). Overall, the median NSE value for WTP resulted in a 60 % recovery rate from WaterSed outputs, the training and test sets for the outer loops was above 0.5. which was consistent with previous hydrogeological tracing The median RMSE value on the training and test sets was results on connected sinkholes. Hanin (2011) suggested the on the same order of magnitude as for the complete dataset existence of fast karstic connections between sinkholes and (300–500 kg). The difficulties of the model in generalizing springs on the Radicatel catchment, with a 62 % recovery suggested a classical problem in machine learning, the bias– rate. For the 126 events for which erosion and runoff oc- variance dilemma (Geman et al., 1992). Ideally, the model curred on the catchment, the cumulative amount for both should accurately reflect irregularities in the training data observed and simulated SD was estimated to 88 114 and while generalizing to data testing, but it was not possible to 78 870 kg respectively, suggesting that direct transfers ac- achieve both at the same time. The higher NSE and lower count for 55 %–61 %. These results were consistent with RMSE values on training sets suggest a complex model with previous published results of Masséi et al. (2003) in the high variance and a reliable bias that represents the training same karstic environment (Norville catchment, Normandy, data fairly well but that presents a learning risk on the test Hydrol. Earth Syst. Sci., 25, 6223–6238, 2021 https://doi.org/10.5194/hess-25-6223-2021
E. Patault et al.: Simulating sediment discharge at water treatment plants under different land use scenarios 6231
data. The model can thus represent part of the random noise pecially their coarsest elements (AREAS, 2012). The third
of the learning dataset. scenario (S_farm) represented the adoption of good farm-
To validate the approach for extreme values, we simulated ing practices (i.e. +15 % infiltration capacity) on 50 % of the
overall SD for the baseline scenario at the connected sink- plots. It can be observed that this scenario significantly re-
holes and for the five DS using the WaterSed model. Then, duced sediment production on the hillslopes (Fig. 8a and b).
we used these modelling results as inputs for the DNN model The simulated SDS_farm ranged from 741 to 134 001 kg, lead-
and applied them to the five DS. Secondly, we compared the ing to an average decrease of 49 % compared to the baseline
results with the calculated GEV distribution (Fig. 6). The SD scenario results. The simulated values on runoff ranged from
simulated at the WTP by the DNN model can be considered 720 to 47 442 m3 . This scenario was more effective in re-
to be in good agreement with the values calculated by the ducing SD and runoff, on average, than the eco-engineering
GEV, even if the latter shows a high dispersion for higher scenario. The SD decrease induced by good farming prac-
return periods. tices ranged from 25 % to 90 % at the connected sinkholes.
In parallel, we selected the 1 % highest sediment discharge The fourth scenario (S_farm + engi) combined both effects
on records from October 1998 to September 2000, which rep- of the erosion control measures and good farming practices.
resented 28 % of the total sediment discharge observed at the We observed the highest decrease in sediment discharge and
WTP, and compared the results with simulated sediment dis- runoff at connected sinkholes. The simulated values on SD
charge in a scatter plot. We observed a good relation between ranged from 547 to 97 739 kg and from 598 to 45 051 m3 for
those two variables (R 2 = 0.72; Fig. D1), which strengthens runoff.
our confidence in the model for simulating extreme events. DS characteristics and simulated SD/runoff by the Wa-
While the performance of deep learning-based methods in terSed model at connected sinkholes, and for all scenarios,
modelling extreme events is discussed (Zhang et al., 2019), were injected as inputs in the DNN model. In the base-
the results obtained here provide confidence in the model’s line scenario, simulated SD at the WTP ranged from 576 to
ability to simulate them due to a careful selection of input 12 200 kg (see Sect. 4.2), and Fig. 9 shows the global trends
data that allow the model to learn patterns of extreme events of the scenario modelling results. For the S_grass scenario,
in historical time series. simulated SD at the WTP was slightly higher than the base-
line scenario, reaching 12 894 kg for the 100-year DS. This
5.3 Prospective analysis scenario resulted in an average increase of 4.5 % for the
SD at the WTP. The SD increase was less significant in
Once the calibration was completed and the architecture of small return periods (+0.42 %–3.29 %) than longer return
the DNN defined, we applied the cascade modelling for all periods (+5.68–6.82 %). In the second scenario (S_engi),
predefined scenarios. As a first step, and using the WaterSed the modelling results suggested a significant SD decrease at
model, we simulated SDWS and RWS at the connected sink- the WTP. The simulated SD ranged from 515 to 9810 kg,
holes for the three additional scenarios and the five DS, which led to an average decrease of 25.4 %. The SD reduc-
comparing them to the baseline scenarios (Fig. 7a and b). tion was particularly effective on the 2-year DS, reaching
For the first scenario (S_grass), 33 % of grasslands were a decrease of 44.7 %. The smallest SD reduction was ob-
ploughed up, which led to an increase in the spatial extent served for the 0.5-year DS (10 %) and ranged from 19 % to
of runoff generation on the catchment. SDS_grass ranged from 30 % on longer return periods. These results were consistent
8468 to 188 264 kg for the five DS, with an average increase with those found by Fournier et al. (2008), who showed by
of 4.74 % compared to the results of the baseline scenario. a parametric interpolation model that erosion control mea-
The effect on runoff was higher, with an average increase sures at connected sinkholes on the Caumont aquifer led to
of 8.4 % for the five DS, ranging from 2211 to 67 097 m3 . a 36 % decrease in the turbidity in the Varras WTP (Nor-
The second scenario (S_engi) considered the implementa- mandy, France). The third scenario (S_farm) was more ef-
tion of erosion control measures by 2050 (i.e. 181 fascines ficient, with simulated SD ranging from 223 to 9165 kg
and 13.1 ha of grass strips), which led to a global decrease and an average decrease of 43 %. The SD reduction ranged
in sediment flux rates. Simulated SDS_engi to connected sink- from 28.9 % to 61.3 % and was more efficient for the 0.5-
holes ranged from 1659 to 133 458 kg, resulting in an average and 2-year return periods (55.6 %–61.3 %). For the last sce-
decrease of 44 %. This scenario was more effective in small nario (S_farm + engi), we observed a global decrease of
return periods (i.e. 0.5 and 2 years), with a SD decrease be- 59.6 %. The simulated SD values at the WTP ranged from
tween 79 % and 55 % respectively. Erosion control measures 167 to 7298 kg. This scenario was more efficient for the 0.5-,
were less effective on the three other DS, with decreases 2-, and 10-year return periods (70 % on average).
ranging from 25 % to 34 %. The effects on runoff were not
as important, with an average decrease of 7 %. This was not
surprising because the considered management plan only in-
cluded 13.1 ha of grass strips, and the main interest of the
fascines lies in their ability to trap suspended sediments, es-
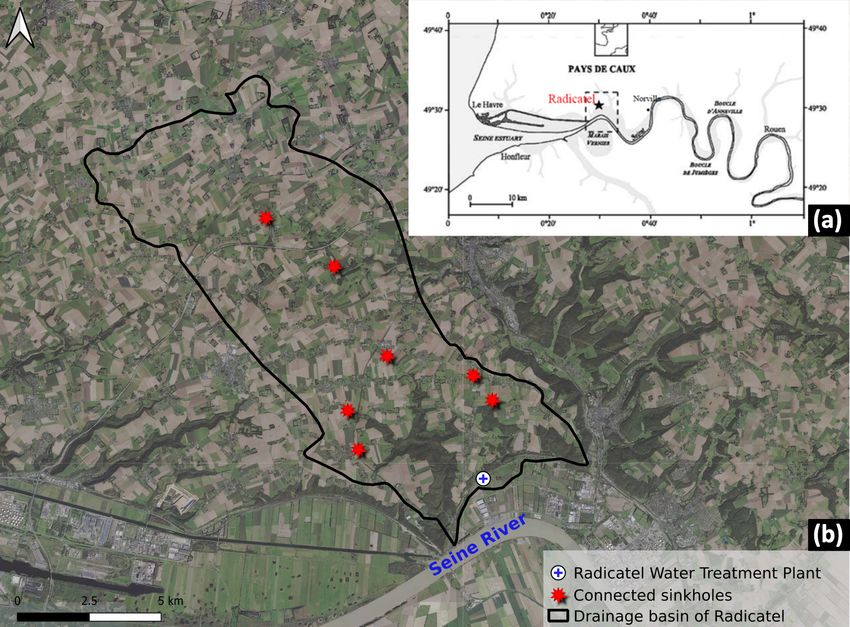
https://doi.org/10.5194/hess-25-6223-2021 Hydrol. Earth Syst. Sci., 25, 6223–6238, 20216232 E. Patault et al.: Simulating sediment discharge at water treatment plants under different land use scenarios Figure 7. WaterSed modelling results according to the five designed storms for the four scenarios: simulated (a) sediment discharge (kg) and (b) runoff (m3 ), extracted and summed over the seven connected sinkholes on the Radicatel catchment (S_base: baseline scenario in 2018; S_grass: 33 % of grasslands ploughed up; S_farm: +15 % infiltration capacity on 50 % of the plots; S_engi: implementation of 181 fascines and 13.1 ha of grass strips; S_farm + engi: combination of S_farm and S_engi). Figure 8. Mapping of flow path and sediment discharge for (a) the scenario including an increase of 15 % of the infiltration capacity on selected plots (stronger grey colour) and (b) the baseline scenario, for the 10-year return period designed storm on the Radicatel catchment. Hydrol. Earth Syst. Sci., 25, 6223–6238, 2021 https://doi.org/10.5194/hess-25-6223-2021
E. Patault et al.: Simulating sediment discharge at water treatment plants under different land use scenarios                     6233

Figure 9. Simulated sediment discharge (kg) for designed storms and all scenarios at the Radicatel water treatment plant (WTP) using the
DNN model (S_base: baseline scenario in 2018; S_grass: 33 % of grasslands ploughed up; S_farm: +15 % infiltration capacity on 50 % of
the plots; S_engi: implementation of 181 fascines and 13.1 ha of grass strips; S_farm + engi: combination of S_farm and S_engi).

6     Discussion                                                      90 %) and therefore decrease the SD at the WTP (from 10 %
                                                                      to 61 %). The first strategy leads to a decrease in sediment
6.1    Cascade modelling approach: strength and                       production through simplified cultural techniques, while the
       uncertainties                                                  second affects transfer processes. The adoption of better
                                                                      farming practices (e.g. increase in crop cover, no-tillage, re-
The original cascade modelling approach developed in this             duced tillage) inducing an increase of 15 % of the infiltration
study allowed the evaluation of surface and subsurface sed-           capacity on 50 % of the agricultural plots of the catchment
iment transfer processes. As karstic processes are complex            appears to be slightly more efficient than the implementation
and difficult to model due to the lack of knowledge of their          of eco-engineering infrastructures (181 fascines + 13.1 ha of
geometry, the cascade modelling with a process-based GIS              grass strips) at reducing SD at the WTP. These results thus
model and a data-driven model (i.e. DNN) proved to be a               show that it is more interesting to adopt a land use strategy
powerful tool. This approach is efficient at assessing the im-        aimed at reducing hydro-sedimentary production directly on
pact of different land use scenarios on drinking water quality        cultivated plots than transfer processes on the catchment, but
at drinking water treatment plants. Despite very encouraging          these strategies could be combined. Additional simulations
results, one may notice that the cascade model was trained on         integrating both effects of best farming practices on culti-
only 2 years of complete selected measurements and there-             vated plots and the implementation of eco-engineering in-
fore may not have captured the full distribution of possible          frastructures show a 10-fold effect. As illustrated in Fig. 9,
cumulative daily rainfall on the catchment and/or turbidity           the coupling of the two strategies makes it possible to reduce
values at the drinking water treatment plant. The degree of           significantly the SD at the WTP. The combined effect will
confidence in the model’s output could be further improved            not add up, but we can expect an improved decrease in sedi-
with longer time series. Two limitations of the presented cas-        ment discharge at the WTP from 40 % to 80 %. Both land use
cade approach are the data availability and its ability to be         strategies can also provide interesting effects on biodiversity
validated at other study sites, as the turbidity data backups are     and ecosystem services (Posthumus et al., 2015) and/or can
not always properly done in all WTPs. One specific issue for          improve soil resilience and promote sustainable agriculture
DL applications in the hydrological sciences, as mentioned            (Lal, 2014). Public policies leading to the implementation of
by Sit et al. (2020), is that data provided by the authorities        erosion control measures can be economically viable and ef-
are dispersed and that they occasionally have mismatches in           ficient (Patault et al., 2021b). Even if some simplified cultural
temporal or spatial coverage. We thus encourage the drinking          techniques may imply negative returns for farmers, they may
water supplier to keep turbidity records to allow the applica-        be eligible for agri-environment payments (Posthumus et al.,
tion of these data-driven models and to ensure that the time          2015). The implementation of these land use strategies may
series do not have interruptions.                                     also require specific maintenance to keep their initial perfor-
                                                                      mance (Frankl et al., 2018) or specific training and machines
6.2    Implications for future land use strategies
                                                                      for farmers.
The modelling results in this study suggest that two different           According to the simulations, the ploughing up of 33 % of
land use strategies (i.e. increase in infiltration capacity and       grasslands for the benefit of agricultural plots on the catch-
eco-engineering) can significantly reduce the SD incoming             ment by 2050 will not increase significantly the SD at the
to connected sinkholes during extreme rainfall events (up to          WTP (less than 5 % on average). Our simulations just ex-

https://doi.org/10.5194/hess-25-6223-2021                                           Hydrol. Earth Syst. Sci., 25, 6223–6238, 2021
6234 E. Patault et al.: Simulating sediment discharge at water treatment plants under different land use scenarios
tended the current trend observed in the studied region. De- Appendix A: Scatter plot of turbidity time series
spite everything, some precautions must be taken regarding
the results of this scenario, which could be higher or lower
depending on the localization of the ploughed-up plots. The
same observations were made by Souchère et al. (2005), who
suggested, according to their results, that the efficiency of
all developments in reducing erosion and runoff is linked to
their location within the catchment. Indeed, it is well known
that hydrologic connectivity may lead to increments in runoff
(Appels et al., 2011).
Figure A1. Scatter plot of turbidity time series recorded at the water
7 Conclusions
treatment plant in the Radicatel catchment, Normandy, France.
In this study, a new cascade modelling approach was de-
veloped in order to help decision-makers choose an adapted
erosion and runoff management strategy to reduce the im- Appendix B: Monthly backward-chaining nested
pact of sediment discharge on drinking water supply. The cross-validation
expert-based GIS model (WaterSed) was used to simulate
erosion and runoff at connected sinkholes (positive dye trac-
ing) on the Radicatel catchment (Normandy, France) and
used to feed a data-driven model (i.e. deep neural network)
to simulate karstic transfers. This new approach does not re-
quire knowledge of the geometry of the karstic system stud-
ied and demonstrated the value of understanding hillslope
erosion and runoff processes to model underground hydro-
sedimentary transfers in karstic systems. Our modelling re-
sults suggest that the cascade model performed well during
the calibrating phase. The cascade model was able to gen-
eralize on unknown datasets through an adapted monthly
backward-chaining nested cross-validation procedure, and
the cascade model was efficient at simulating extreme events. Figure B1. Monthly backward-chaining nested cross-validation
The results also suggest that a land use change scenario con- procedure developed to test the generalization capacity of the model
sidering the adoption of simplified cultural techniques can (modified after Cochrane, 2018).
significantly reduce sediment discharge at the water treat-
ment plant (up to 61 %). This scenario also outperformed the
one which considered the implementation of eco-engineering
control measures reducing erosion and runoff on the catch-
ment (up to 45 % at the water treatment plant). The coupling
of the two previous land use strategies can be even more ef-
fective since it operates on both the hydro-sedimentary pro-
duction and transfer processes (decreasing SD at WTP from
40 % to 80 %). Finally, ploughing up 33 % of actual grass-
lands on the catchment will not significantly increase sedi-
ment discharge at the water treatment plant. However, the re-
sults might be influenced by the spatial organization of grass-
lands on the catchment that is a key parameter for hydro-
sedimentary connectivity and hydro-sedimentary transfers to
the sinkholes. In the framework of this study, we suggest con-
ducting a specific study on this hypothesis.
Hydrol. Earth Syst. Sci., 25, 6223–6238, 2021 https://doi.org/10.5194/hess-25-6223-2021E. Patault et al.: Simulating sediment discharge at water treatment plants under different land use scenarios 6235
Appendix C: Generalized extreme values distribution Competing interests. The contact author has declared that neither
they nor their co-authors have any competing interests.
Disclaimer. Publisher’s note: Copernicus Publications remains
neutral with regard to jurisdictional claims in published maps and
institutional affiliations.
Acknowledgements. This study is based on research undertaken as
part of the EVAPORE project, “EVAluation de l’efficacité des POli-
tiques publiques pour les actions visant à REduire les impacts du
ruissellement”, to evaluate the efficiency of public policy in reduc-
ing erosion and runoff impacts in Normandy, France. The authors
are thankful to the University of Rouen, AREAS, and BRGM, who
co-founded this project. The authors are also thankful to the LHSM,
“Le Havre Seine Métropole”, who provided access to their data.
Figure C1. Generalized extreme value distribution modelled with Financial support. This research has been supported by the Seine-
the “exTremes” R package on the sediment discharge time series Normandy Water Agency (grant no. 1071837).
(22 hydrologic years) at the water treatment plant of the Radicatel
catchment.
Review statement. This paper was edited by Dominic Mazvimavi
and reviewed by two anonymous referees.
Appendix D: Scatter plot of extreme events
References
Abadi, M., Agarwal, A., Barham, P., Brevdo, E., Chen, Z., Citro,
C., Corrado, G. S., Davis, A., Dean, J., Devin, M., Ghemawat, S.,
Goodfellow, I., Harp, A., Irving, G., Isard, M., Jia, Y., Jozefow-
icz, R., Kaiser, L., Kudlur, M., Levenberg, J., Mane, D., Monga,
R., Moore, S., Murray, D., Olah, C., Schuster, M., Shlens, J.,
Steiner, B., Sutskever, I., Talwar, K., Tucker, P., Vanhoucke,
V., Vasudevan, V., Viegas, F., Vinyals, O., Warden, P., Watten-
berg, M., Wicke, M., Yu, Y., and Zheng, X.: TensorFlow: Large-
Scale Machine Learning on Heterogeneous Systems, available
Figure D1. Scatter plot of the observed versus simulated sediment at: https://www.tensorflow.org/ (last access: 1 September 2020),
discharge by the DNN at the WTP for the 1 % highest sediment 2016.
discharge on record. Appels, W. M., Bogaart, P. W., and van der Zee, S. E.
A. T. M.: Influence of spatial variations of microtopogra-
phy and infiltration on surface runoff and field scale hy-
drological connectivity, Adv. Water Resour., 34, 303–313,
Code and data availability. The code that supports the findings of https://doi.org/10.1016/j.advwatres.2010.12.003, 2011.
this study is available on request from the corresponding author AREAS: Fascines & Haies pour réduire les effets du ruis-
(Matthieu Fournier). sellement érosif, Caractérisation de l’efficacité et conditions
d’utilisation, p. 68, available at: https://www.areas-asso.fr/
images/expeautres/efficacite_haies_fascines_AREAS_68p.pdf
Author contributions. EP, MF, BL, VL, OC, JFO, JL, and AS con- (last access: 1 September 2020), 2012.
ceptualized the study. EP and VL made the formal analysis. BL, OC, ARS: Bilan 2013 de la qualité des eaux destinées à la con-
MF, and JFO worked on the funding acquisition and the project ad- sommation humaine et la protection des captages en Seine-
ministration. EP worked on visualization and edition of the paper. Maritime, available at: https://www.normandie.ars.sante.fr/sites/
EP, VL, MF, and OC took responsibility for the methodology, soft- default/files/2017-03/bilan_76_qualite_eau_2013.pdf (last ac-
ware, investigation, original draft preparation, and reviewing of the cess: 1 September 2020), 2013.
paper. Baartman, J. E. M., Nunes, J. P., Masselink, R., Dar-
boux, F., Bielders, C., Degre, A., Cantreul, V., Cerdan,
O., Grangeon, T., Fiener, P., Wilken, F., Schindewolf, M.,
https://doi.org/10.5194/hess-25-6223-2021 Hydrol. Earth Syst. Sci., 25, 6223–6238, 20216236 E. Patault et al.: Simulating sediment discharge at water treatment plants under different land use scenarios and Wainwright, J.: What do models tell us about water Fournier, M., Mouhri, A., Ratajczak, M., Rossi, A., Slimani, S., and sediment connectivity?, Geomorphology, 367, 107300, and Mesquita, J.: Fonctionnement hydrogéologique de l’aquifère https://doi.org/10.1016/j.geomorph.2020.107300, 2020. de Caumont et incidence des aménagements de bassin versant Bai, Y., Chen, Z., Xie, J., and Li, C.: Daily reservoir inflow forecast- sur la qualité des eaux du forage des Varras, available at: ing using multiscale deep feature learning with hybrid models, J. https://www.unicaen.fr/m2c/IMG/pdf/rapportsersaep.pdf?262/ Hydrol., 532, 193–206, 2016. 447a7b605f6dbc8a8df025b439812a0bc73d39bf (last access: Carreau, J., Neppel, L., Arnaud, P., and Cantet, P.: Extreme rainfall 1 September 2020), 2008. analysis at ungauged sites in the south of France: Comparison of Frankl, A., Prêtre, V., Nyssen, J., and Salvador, P.-G.: The three approaches, Journal de la Société Française de Statistique, success of recent land management efforts to reduce soil 154, 119–138, 2013. erosion in northern France, Geomorphology, 303, 84–93, Cerdan, O., Souchère, V., Lecomte, V., Couturier, A., and Le Bis- https://doi.org/10.1016/j.geomorph.2017.11.018, 2018. sonnais, Y.: Incorporating soil surface crusting processes in an Geman, S., Bienenstock, E., and Doursat, R.: Neural networks and expert-based runoff model: Sealing and transfer by runoff and the bias/variance dilemma, Neural Comput., 4, 1–58, 1992. erosion related to agricultural management, Catena, 46, 189– Gilleland, E. and Katz, R. W.: extRemes 2.0: An extreme 205, https://doi.org/10.1016/S0341-8162(01)00166-7, 2001. Value Analysis Package in R, J. Stat. Softw., 72, 1–39, Cerdan, O., Le Bissonnais, Y., Souchère, V., Martin, P., and https://doi.org/10.18637/jss.v072.i08, 2016. Lecomte, V.: Sediment concentration in interrill flow : Gilley, J. E., Kottwitz, E. R., and Wieman, G. A.: Roughness coef- interactions between soil surface conditions, vegeta- ficients for selected residue materials, J. Irrig. Drain. Eng., 117, tion and rainfall, Earth Surf. Proc. Land., 27, 193–205, 503–514, 1991. https://doi.org/10.1002/esp.314, 2002a. Hafeez, S., Sing Wong, M., Chak Ho, H., Nazeer, M., Nichol, J., Cerdan, O., Le Bissonnais, Y., Couturier, A., and Saby, N.: Mod- Abbas, S., Tang, D., Ho Lee, K., and Pun, L.: Comparison of elling interrill erosion in small cultivated catchments, Hydrol. machine learning algorithms for retrieval of water quality indica- Process., 3226, 3215–3226, https://doi.org/10.1002/hyp.1098, tors in case-II waters: a case study of Hong-Kong, Remote Sens., 2002b. 11, 617, https://doi.org/10.3390/rs11060617, 2019. Chédeville, S.: Etude de la variabilité du fonctionnement hydro- Hanin, G.: Contrôles structural et hydrogéologique sur la dy- sédimentaire des karsts de l’Ouest du Bassin de Paris à partir namique d’un champ captant en contexte crayeux karstique et sa de la comparaison des remplissages sédimentaires karstiques an- sensibilité aux variations du signal climatique: Implications en ciens, actuels et du signal turbide des eaux souterraines, Thèse de matière de vulnérabilité de la ressource, PhD thesis, University doctorat, Université de Rouen-Normandie, France, p. 458, 2015. of Rouen-Normandy, France, p. 320, 2011. Chollet, F.: Keras, available at: https://github.com/fchollet/keras Hartmann, A., Goldscheider, N., Wagener, T., Lange, J., and Weiler, (last access: 1 September 2020), 2015. M.: Karst water resources in a changing world: Review of hy- Cochrane, C.: Time Series Nested Cross-Validation, drological modeling approaches, Rev. Geophys., 52, 218–242, available at: https://towardsdatascience.com/ https://doi.org/10.1002/2013RG000443, 2014. time-series-nested-cross-validation-76adba623eb9, last ac- Hu, C., Wu, Q., Jian, S., Li, N., and Lou, Z.: Deep learning with cess: 10 November 2021. a long short-term memory networks approach for rainfall-runoff Delmas, M., Pak, L. T., Cerdan, O., Souchère, V., Le Bis- simulation, Water, 10, 1543, https://doi.org/10.3390/w10111543, sonnais, Y., Couturier, A., and Sorel, L.: Erosion and sed- 2018. iment budget across scale: a case study in a catchment Jourde, H., Masséi, N., Mazzilli, N., Binet, S., Batiot-Guilhe, of the European loess belt, J. Hydrol., 420, 255–263, C., Labat, D., Steinmann, M., Bailly-Comte, V., Seidel, J.- https://doi.org/10.1016/j.jhydrol.2011.12.008, 2012. L., Arfib, B., Charlier, J.-B., Guinot, V., Jardani, A., Fournier, De Michele, C. and Avanzi, F.: Superstatistical distribution of daily M., Aliouache, M., Babic, M., Bertrand, C., Brunet, P., Boyer, precipitation extremes: A worldwide assessment, Scient. Rep., 8, J.-F., Bricquet, J.-P., Camboulive, T., Carrière, S.-D., Celle- 14204, https://doi.org/10.1038/s41598-018-31838-z, 2018. Jeanton, H., Chalikakis, K., Chen, N., Cholet, C., Clauzon, De Vente, J., Poesen, J., Verstraeten, G., Govers, G., Vanmaer- V., Dal Soglio, L., Danquigny, C., Défargue, C., Denimal, S., cke, M., Van Rompaey, A., Arabkhedri, M., and Boix-Fayos, Emblanch, C., Hernandez, F., Gillon, M., Gutierrez, A., Hi- C.: Predicting soil erosion and sediment yield at regional dalgo Sanchez, L., Hery, M., Houillon, N., Johannet, A., Jou- scales: Where do we stand?, Earth-Sci. Rev., 127, 16–29, ves, J., Jozja, N., Ladouche, B., Leonardi, V., Lorette, G., Loup, https://doi.org/10.1016/j.earscirev.2013.08.014, 2013. C., Marchand, P., de Montety, V., Muller, R., Ollivier, C., Siv- Evrard, O., Bielders, L. C., Vandaele, K., and van Wesemael, B.: elle, V., Lastennet, R., Lecoq, N., Maréchal, J-C., Perotin, L., Spatial and temporal variation of muddy floods in central Bel- Perrin, J., Petre, M.-A., Peyraube, N., Pistre, S., Plagnes, V., gium, off-site impacts and potential control measures, Catena, Probst, J.-L., Simler, R., Stefani, V., Valdes-Lao, D., Viseur, S., 70, 443–454, https://doi.org/10.1016/j.catena.2006.11.011, and Wang, X.: SNO KARST: A French network of observa- 2007. tories for the multidisciplinary study of critical zone processes Evrard, O., Nord, G., Cerdan, O., Souchère, V., Le Bissonnais, Y., in karst watersheds and aquifers, Vadose Zone J., 17, 180094, and Bonté, P.: Modelling the impact of land use change and rain- https://doi.org/10.2136/vzj2018.04.0094, 2018. fall seasonality on sediment export from an agricultural catch- Kourgialas, N. N., Dokou, Z., and Karatzas, G. P.: Statistical analy- ment of the northwestern European loess belt, Agr. Ecosyst. En- sis and ANN modeling for predicting hydrological extremes un- viron., 138, 83–94, https://doi.org/10.1016/j.agee.2010.04.003, der climate change scenarios: The example of a small Mediter- 2010. ranean agro-watershed, J. Environ. Manage., 154, 86–101, 2015. Hydrol. Earth Syst. Sci., 25, 6223–6238, 2021 https://doi.org/10.5194/hess-25-6223-2021
You can also read