The Dimensions of the Phosphorus Status of European Beech Forest Ecosystems
←
→
Page content transcription
If your browser does not render page correctly, please read the page content below
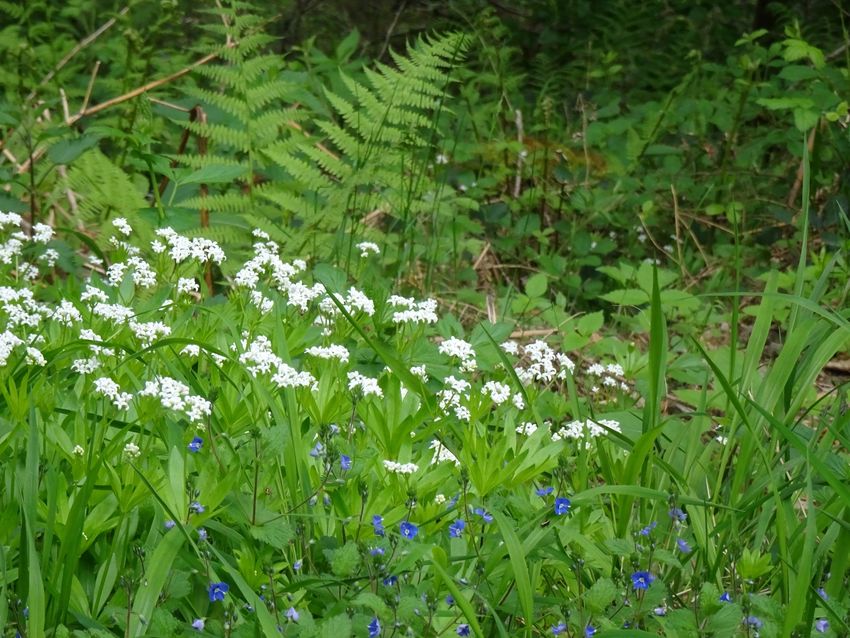
The Dimensions of the Phosphorus Status of
 European Beech Forest Ecosystems
Friederike Lang, Jaane Krüger, Jürgen Bauhus, Hans-Peter Dietrich, Frank Hagedorn, Cornelia Herschbach,
 Klaus Kaiser, Jörg Niederberger, Jörg Prietzel, Heike Puhlmann, Ulrike Talkner
 Uni Freiburg, LWF Freising, WSL Birmensdorf, Uni Halle, TU München, FVA Freiburg, NW-FVA Göttingen

 The motivation for the joint research project:

 ECOSYSTEM NUTRITION: Forest Strategies for limited Phosphorus Resources

Contact: Fritzi.lang@soil.uni-freiburg.de

 How to describe the P status of ecosystems?

European Beech
 central questions:

 • Properties?
 • Processes?
 osp horus Soil Microorganisms • Indicators?
 Ph s • Interactions?
 Statu

 Soils
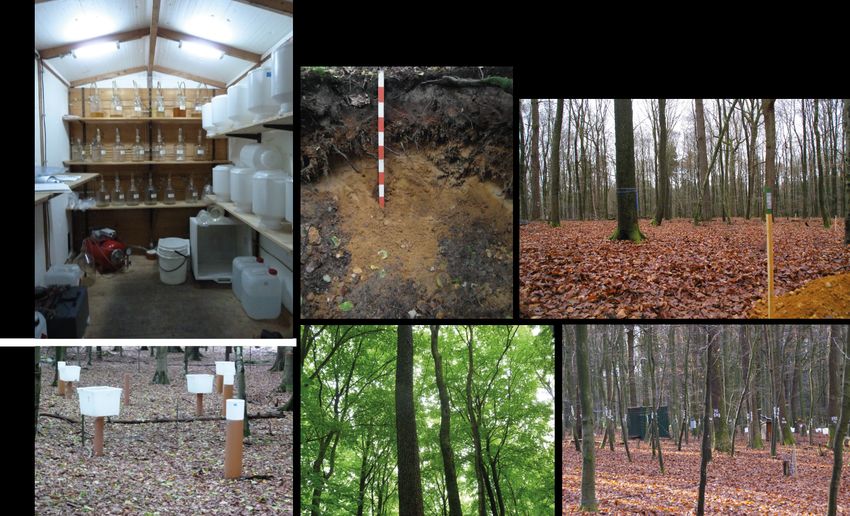
The study sites
 Study sites of the joint project present beech
 forest ecosystems
 with different
 parent materials
 and thus different
 total P stocks

 * * *
 SILICATE

• European beech-dominated stands
 (100 – 140 years)
• ICP-Forests, Level II monitoring sites
 (exception: MAN)
• Operated by state forest institutions Mangfall Schänis Tuttlingen Mangfall Tuttlingen
 MAN S SCH TUT NE MAN N TUT SW
* NxP fertilization experiment
 Total P
 • P-fertilization: 09/2016 50 kg P ha-1 Stock (1m) CARBONATE
 [t ha-1] 1685
 SPP
 • Final sampling: 09/2018
 2.6 2.4 2.1 1.4 1.3

European Beech – P leaf concentrations and stoichiometry
 140

 120

 value relative to BBR [%]
 100

 80

 60
 P stock soil
 40 P concentration leaf

 20

 0
 BBR
 BBR MIT
 MIT VES
 VES MANS CON
 MAN CON SCH TUT
 SCHA TUTNE LUE
 LUE MANN TUT
 MAN TUTSW
 S NE N SW lower limit leaf P conc.
 Leaf [mg P g-1] 1.5 1.7 1.6 1.4 1.2 1.1 1.2 1.2 1.3 1.1 1.2 mg g-1 (Göttlein, 2015)
 Leaf SD 0.21 0.16 0.14 0.14 0.18 0.09
 Upper N:P limit:
 Leaf N:P 16.2 16.0 14.6 20.6 21.6 18.9 18.9 22.4 18.9 (Mellert & Göttlein, 2012)
Contact: Fritzi.lang@soil.uni-freiburg.de

 Sensitivity of beech compartments to decreasing soil P supply

 P-concentration of different compartments of adult beeches
 at the poorest silicate site relative to the concentration at the
 richest site
 Strongest decrease of P
 leaf concentration in sapwood
 and coarse roots
 beechnut identified as storage pools of
 beech (Yang et al. 2016;
 fine root FF Netzer et al. 2017; Zavisic and
 Polle, 2018)
 fine root MS

 bark

youngest tree ring

 coarse root

 0 10 20 30 40 50 60 70 80 90

 Soil P stock: 18% of the P-richest site
European Beech – response to P fertilization

 Adult trees Regeneration
 140 years 15 years
 1.0

 0.8

Concentration 0.6
 higher
 than control 0.4 Response ratio:

 0.2
 _
 0.0 = ln
 _
Concentration -0.2
 lower -0.4
 than control BBR MIT LUE
 -0.6
 Leaves Wood Leaves Twigs Stem
Contact: Fritzi.lang@soil.uni-freiburg.de

 Soils – P depth distribution at silicate sites

LUE: BBR:
Hyperdystric folic P concentration [mg/kg] Dystric skeletic
cambisol (Arenic. 0 500 1000 1500 2000 2500 3000 3500
 cambisol
Loamic. Nechic. 20 (Hyperhumic,
 forest floor
Protospodic) Loamic)
 0

 -20
 soil depth [cm]

 mineral soil
 -40

 -60

 BBR
 -80 MIT
 VES
 CON
 -100
 LUE

 Lang et al. 2017

Depth distribution of P-uptake by European beech roots

 Contribution of different soil horizons for P uptake by European beech [%]

 Horizon P-poor P-rich
 LUE BBR
 Forest Floor 42 19
 A 54 19
 B 4 25
 C 0,1 39

Calculated based on P mobilisation from the soil phase (DGT approach,
unpublished) and distribution of fine root surface area (Löw et al. 2020)
Conclusions for soil P availability indicators

 1.9
 R² = 0.83
 1.8
Leaf concentration mg g-1

 1.7 Soil P-stocks (FF down to
 1m) provided close
 1.6
 correlation with longterm
 1.5 mean leaf concentration;
 1.4
 Soil P-stock 0-10 cm
 1.3 showed no correlations
 1.2
 1.1
 1
 0 100 200 300 400 500 600 700 800 900
 Soil stock of citrate extractable P [kg ha-1]
Microorganisms – P stoichiometry
 25 1000 Intense P
 mobilisation from
 SOM
 20 800
 …by microorganisms
 15 600 Bergkemper et al. 2016
 Cmic/Pmic

 Corg/Porg
 Pistocchi et al. 2018

 ...by beech + EMF
Intense P 10 400
 Hauenstein et al. 2018
mobilisation from Spohn et al. 2018
soil minerals
 5 200
…by microorganisms
Pistocchi et al. 2020, 0 0
Rodionov et al. 2020 290 310 330 350 370 390 410 430 450

...by beech Cleaf/Pleaf
Meller et al. 2019 BBR LUE
 Microbial P storage Microbial P exchange
Chen et al. 2019: 33P/14C/15N incubation experiment Data of Carbonate sites from Prietzel et al, in prep.
P-poor beech forests rely on tight re-cycling of P within the forest floor

 90
 P rich
 80
 P poor
 70
 60
 Trade-offs:
 50 • Low capability to retain inorganic
 P (fertilization experiment)
 40
 • High vulnerability to drought
 30 (Brödlin et al. 2019)
 20
 10
 0
 P residence time in FF [a] (based on netto Cmic stock FF [kg ha-1] Cfine root /Cmic
 turnover)

 P residence time in FF [a] Cmic stock FF
 Cfine root/Cmic
 (based on net turnover) [kg ha-1]
P-storage by
 European Beech P storage by
 ACQUIRING soil Microorganisms

 Share of „flowing“ P
 P storage by mineral soils

 RECYCLING

P interchange by
soil microorganisms Internal P-recycling by
 European Beech
Contact: Fritzi.lang@soil.uni-freiburg.de
Ecosystem Nutrition conference 2021
New Approaches to
Ecosystem Nutrition
Phosphorus and Beyond

Freiburg
 Thank you!
October 25 - 28, 2021
Submission deadline: 1 July 2021
 • FORECOMON organizing team
 • Members of SPP 1685
 • ICP Forests community
 • State Forest Institutions:
 Baden-Württemberg, Bayern,
 Niedersachsen, Thüringen
 • WSL
 • Thünen-Institute, Braunschweig
 • Special thanks to: Andrea Hölscher,
 Henning Meesenburg, Stefan Raspe
 • DFG, SNF
Sensitivity of beech compartments to decreasing soil P supply

 values for different plant compartments at the P-poorest
 site relative to the P-richest site [%]

 leaf

 beechnut

 fine root FF Increased by factor 50

 fine root MS biomass-stock
 P-concentration
 bark

 youngest tree ring

 coarse root

 0 20 40 60 80 100 120 140

 Soil P stock: 18% of the P-richest site
180

 160
 P stock soil
 value relative to BBR [%] 140 P concentration leaf

 120 Pmic/Cmic [%BBR]

 100
 Microorganisms show
 80 stronger response to
 decreasing soil P than
 60 beeches

 40 Possible reason:
 Higher P-resorption from
 20 leaves at P-poor sites
 0 BBR
 BBR
 MIT
 MIT
 VES
 VES
 MAN CON
 MAN S CON
 SCH
 SCHA
 TUT
 TUT NE
 LUE
 LUE
 MAN TUT
 MAN
 Resorption efficiency
 S NE N N TUT
 SW SW
 study sites LUE: 60%
Microbial C:P 12 7 10 13 50 19 20 31 BBR: 10%
Leaf C:P 342 303 305 357 418 425 409 436 391 485 Meller et al. 2019
Microbial C:N 14 10 13 11 5 7 16 6
Dissolved P fluxes from the forest floor into the mineral soil of
 the P-fertilization experiment (over 26 months)

 Low capability of the FF at the
 P-poor site to retain high
 amounts of inorganic P
 P-rich site: P-poor site:
 Efficient mobilisation Efficient
 and uptake from mobilisation from
 inorganic sources organic sources
 …by microorganisms …by microorganisms
 Bergkemper et al. 2016, Bergkemper et al. 2016
 Pistocchi et al. 2020, Pistocchi et al. 2018
 Rodionov et al. 2020 Spohn et al. 2018
 Siegenthaler, sub. Siegenthaler, sub.
 ...by beech ...by beech + EMF
 Meller et al. 2019 Hauenstein et al. 2018
 Spohn et al. 2018

* Values for BBR roughly estimated based on Fetzer et al. 2021; values for MIT and LUE measured by resin accumulators
Stoichiometry carbonate sites
 60 1000

 900
 50
 800

 700
 40
 600
 Cmic/Pmic

 30 500

 400
 20
 300

 200
 10
 100

 0 0
 250 300 350 400 450
 Cleaf/Pleaf
Microorganisms – P stoichiometry

Decreasing
soil P stock
 BBR MIT VES MAN CON SCH TUT LUE MAN TUT
 S NE N SW

Microbial C:P 12 7 10 13 50 19 20 31
A horizons
Leaf C:P 342 303 305 357 418 425 409 436 391 485

Microbial C:N 14 10 13 11 5 7 16 6
A horizons

 BBR LUE
 Microbial P storage Microbial P exchange
 Chen et al. 2019: 33P/14C/15N incubation experiment

 Data of Carbonate sites from Prietzel et al, in prep.
Feinwurzelgrößenverteilung Auflage/A-Horizont
Feinwurzelgrößenverteilung Unterboden

Häufigkeit
You can also read