The motion of trees in the wind: a data synthesis
←
→
Page content transcription
If your browser does not render page correctly, please read the page content below
Biogeosciences, 18, 4059–4072, 2021
https://doi.org/10.5194/bg-18-4059-2021
© Author(s) 2021. This work is distributed under
the Creative Commons Attribution 4.0 License.

The motion of trees in the wind: a data synthesis
Toby D. Jackson1 , Sarab Sethi2 , Ebba Dellwik3 , Nikolas Angelou3 , Amanda Bunce4 , Tim van Emmerik5 ,
Marine Duperat6 , Jean-Claude Ruel6 , Axel Wellpott7 , Skip Van Bloem8 , Alexis Achim9 , Brian Kane10 ,
Dominick M. Ciruzzi11 , Steven P. Loheide II11 , Ken James12 , Daniel Burcham13 , John Moore14 , Dirk Schindler15 ,
Sven Kolbe15 , Kilian Wiegmann16 , Mark Rudnicki17 , Victor J. Lieffers18 , John Selker19 , Andrew V. Gougherty20 ,
Tim Newson21 , Andrew Koeser22,23 , Jason Miesbauer24 , Roger Samelson25 , Jim Wagner26 , Anthony R. Ambrose27 ,
Andreas Detter28 , Steffen Rust29 , David Coomes1 , and Barry Gardiner30
1 Department   of Plant Sciences, University of Cambridge, CB2 3EA, UK
2 Department   of Mathematics, Imperial College London, London, SW7 2AZ, UK
3 Department of Wind Energy, Technical University of Denmark, Frederiksborgvej 399, Roskilde, 4000, Denmark
4 Department of Natural Resources and the Environment, University of Connecticut, Mansfield, CT 06269, USA
5 Hydrology and Quantitative Water Management Group, Wageningen University, Wageningen, 6708, the Netherlands
6 Department of Wood and Forest Sciences, Laval University, Quebec, QC G1V 0A6, Canada
7 Bavarian State Institute of Forestry (LWF), Hans-Carl-von-Carlowitz-Platz 1, 85354 Freising, Germany
8 Baruch Institute of Coastal Ecology and Forest Science, Clemson University, P.O. Box 596,

Georgetown, SC 29442, USA
9 Centre de recherche sur les matériaux renouvelables, Département des sciences du bois et de la forêt,

Université Laval, Québec, QC G1V 0A6, Canada
10 Department of Environmental Conservation, University of Massachusetts, Amherst, MA 01003, USA
11 Department of Civil and Environmental Engineering, University of Wisconsin Madison, Madison, WI 53706, USA
12 School of Ecosystem and Forest Sciences, Faculty of Science, University of Melbourne, Melbourne, 3052, Australia
13 Centre for Urban Greenery and Ecology, National Parks Board, 259569, Singapore
14 Timberlands Ltd., Rotorua 3010, New Zealand
15 Environmental Meteorology, University of Freiburg, D-79085 Freiburg, Germany
16 Argus Electronic GmbH, Erich-Schlesinger-Str. 49d, 18059 Rostock, Germany
17 College of Forest Resources and Environmental Science, Michigan Technological University,

Houghton, MI 49931, USA
18 Department of Renewable Resources, University of Alberta, Edmonton, Alberta T6G 2R3, Canada
19 Biological and Ecological Engineering, Oregon State University, Corvallis, OR 97331, USA
20 Department of Botany, University of British Columbia, Vancouver, British Columbia V6T 1Z4, Canada
21 Department of Civil and Environmental Engineering, Western University, London, Ontario N6G 1G8, Canada
22 Department of Environmental Horticulture, IFAS, University of Florida, Gainsville, 32607, USA
23 Gulf Coast Research and Education Center, University of Florida, 14625 County Road 672, Wimauma, FL 33598, USA
24 The Morton Arboretum, Lisle, IL 60532, USA
25 College of Earth, Ocean, and Atmospheric Sciences, Oregon State University, Corvallis, OR 97331, USA
26 Oregon Research Electronics, Tangent, OR 97389, USA
27 Department of Integrative Biology, UC Berkeley, Berkeley, CA 94720-3140, USA
28 Brudi and Partner TreeConsult, Berengariastr. 9, 82131 Gauting, Germany
29 Faculty of Resource Management, University of Applied Science and Art, Göttingen, Germany
30 Institut Européen de la Forêt Cultivée, 69 route d’Arcachon, 33612, Cestas, France

Correspondence: Toby D. Jackson (tobydjackson@gmail.com)

Received: 16 November 2020 – Discussion started: 28 December 2020
Revised: 28 May 2021 – Accepted: 31 May 2021 – Published: 6 July 2021

Published by Copernicus Publications on behalf of the European Geosciences Union.
4060                                                    T. D. Jackson et al.: The motion of trees in the wind: a data synthesis

Abstract. Interactions between wind and trees control en-           ties (Dargahi et al., 2020; Jackson et al., 2019; Sellier and
ergy exchanges between the atmosphere and forest canopies.          Fourcaud, 2009). Therefore, just as some types of trees have
This energy exchange can lead to the widespread damage of           recognizable architectures, we expect them to have distinc-
trees, and wind is a key disturbance agent in many of the           tive patterns of motion in response to wind loading. For ex-
world’s forests. However, most research on this topic has           ample, trees in dense forests generally have a slender form
focused on conifer plantations, where risk management is            with a small crown near the top (MacFarlane and Kane,
economically important, rather than broadleaf forests, which        2017), which leads to a slow, pendulum-like motion (Sellier
dominate the forest carbon cycle. This study brings together        and Fourcaud, 2009).
tree motion time-series data to systematically evaluate the            Previous data syntheses have focused on the fundamental
factors influencing tree responses to wind loading, including       sway frequency (f0 ) of conifers and have found that larger,
data from both broadleaf and coniferous trees in forests and        heavier trees sway more slowly than shorter, lighter ones
open environments.                                                  (Moore and Maguire, 2004). This finding demonstrates that
   We found that the two most descriptive features of tree mo-      conifers can be approximated by a cantilever beam (i.e. a
tion were (a) the fundamental frequency, which is a measure         beam with distributed mass), but it is unclear whether this
of the speed at which a tree sways and is strongly related to       model extends to other types of trees. Jackson et al. (2019)
tree height, and (b) the slope of the power spectrum, which is      demonstrated that tree architecture strongly influences f0 us-
related to the efficiency of energy transfer from wind to trees.    ing a combination of field data and finite element simula-
Intriguingly, the slope of the power spectrum was found to re-      tions. Additionally, a tree’s f0 has been observed to change
main constant from medium to high wind speeds for all trees         over time in response to variations in tree mass and elasticity.
in this study. This suggests that, contrary to some predictions,    These changes can be used as a proxy to measure phenology
damping or amplification mechanisms do not change dramat-           (Bunce et al., 2019; Gougherty et al., 2018) and water status
ically at high wind speeds, and therefore wind damage risk is       of trees (Ciruzzi and Loheide, 2019) at high time resolution
related, relatively simply, to wind speed.                          (e.g. every 10 min or hour) using low-cost sensors. There-
   Conifers from forests were distinct from broadleaves in          fore, tree motion characteristics are expected to change with
terms of their response to wind loading. Specifically, the fun-     the seasons, with the presence or absence of leaves in de-
damental frequency of forest conifers was related to their          ciduous trees and the freezing soil in high latitudes having
size according to the cantilever beam model (i.e. vertically        important effects (Bunce et al., 2019).
distributed mass), whereas broadleaves were better approx-             Energy is transferred from the wind to a tree due to aero-
imated by the simple pendulum model (i.e. dominated by              dynamic drag and is then dissipated by damping mechanisms
the crown). Forest conifers also had a steeper slope of the         in the tree. The balance between energy transfer from the
power spectrum. We interpret these finding as being strongly        wind to the tree and energy dissipation by damping deter-
related to tree architecture; i.e. conifers generally have a sim-   mines a tree’s risk of wind damage. A number of processes,
ple shape due to their apical dominance, whereas broadleaves        both amplifying and damping the tree motion, have been sug-
exhibit a much wider range of architectures with more dom-          gested to become significant in the high wind speed regime,
inant crowns.                                                       for example, damping by branching, whereby the branching
                                                                    patterns of open-grown trees increase damping efficiency by
                                                                    transferring energy to the outermost branches where it can
                                                                    be efficiently dissipated (de Langre, 2008, 2019; Spatz and
1   Introduction                                                    Theckes, 2013; Theckes et al., 2011). Another example is
                                                                    the dynamic amplification of the tree motion as the peak en-
Tree size and growth rate are influenced by their local             ergy of the wind spectrum approaches the natural frequency
wind environment (Bonnesoeur et al., 2016; MacFarlane and           of the tree, inducing resonant effects (Blackburn et al., 1988;
Kane, 2017) which in turn has an impact on forest carbon            Ciftci et al., 2013; Holbo et al., 1980; Oliver and Mayhead,
storage and dynamics. Monitoring the motion of trees in the         1974; Rodriguez et al., 2008). We cannot measure these pro-
wind can help us understand this interaction and model the          cesses in the field, but the slope of the power spectrum (Sfreq )
risk of wind damage (Moore et al., 2018), which is a key            can be used as an overall measure of energy transfer between
driver of the forest carbon cycle in both temperate and trop-       wind and tree at different frequency ranges (van Emmerik et
ical regions (Espírito-Santo et al., 2014; Schelhaas et al.,        al., 2017, 2018). The spectrum of the tree is essentially the
2003; Senf and Seidl, 2020).                                        spectra of the wind, modified by the properties of the tree
   Trees have characteristic and recognizable swaying pat-          (Gardiner, 1992; Kerzenmacher and Gardiner, 1998; Mayer,
terns. This means that tree motion time series are distinct         1987; Sellier et al., 2008). Therefore, the slope of the tree
from each other and from the time series of local wind              spectrum (Sfreq ) is the result of the energy transfer between
speeds. These tree motion characteristics are determined by         wind and tree, as well as the energy transfer within the tree
tree size, shape, and, to a lesser extent, material proper-

Biogeosciences, 18, 4059–4072, 2021                                                    https://doi.org/10.5194/bg-18-4059-2021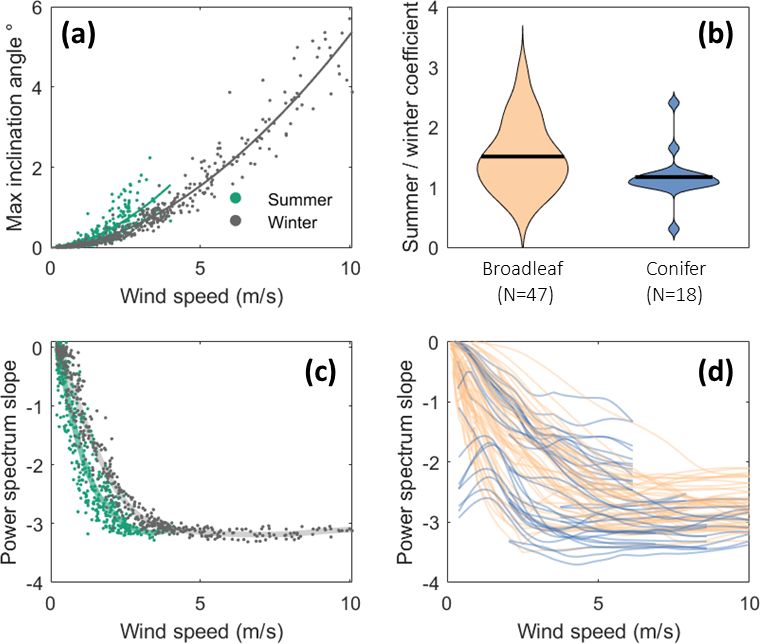
T. D. Jackson et al.: The motion of trees in the wind: a data synthesis                                                     4061

itself. We calculate Sfreq for each hour of tree motion data       trees, which hinders detailed analysis at high time resolu-
and look for changes with increasing wind speed.                   tion. We therefore focus on analyses which do not require
   This study brings together data on tree motion from tropi-      high-resolution wind speed data (although we explore these
cal, temperate, and boreal regions to explore key similarities     data in Supplement S2). For the purposes of our analyses, we
and differences in the motion of these trees in the wind. We       categorized trees as broadleaf or conifer and as open-grown
do this by comparing features calculated from the tree motion      or forest (as defined by the data owners). Table 1 gives an
time-series data. While Sfreq and f0 are clearly important fea-    overview of the data sets.
tures of tree motion, thousands of other time-series features
have been developed across multiple disciplines which may          2.2   Data processing and feature extraction
provide further insight. Fulcher and Jones (2017) compiled a
set of over 7700 time-series features, and Lubba et al. (2019)     We resampled each time series to the lowest sampling fre-
distilled them to the most descriptive and minimally redun-        quency in the data set (4 Hz) to avoid sampling rate con-
dant 22 features (“catch22” features). We use these catch22        founding our analysis. This frequency was sufficient to cap-
features, as well as f0 and Sfreq (and associated features de-     ture tree motion characteristics for all trees in our sample.
scribed in the methods), to systematically explore the sim-        Although each type of sensor measures a different property
ilarities and differences in the way trees move. We expect         of tree motion, these properties are very strongly correlated
to find differences between conifers and broadleaves due to        and are complementary measures of tree motion. Each type
their different architectures (Jackson et al., 2019), as well as   of sensor has its own units, so absolute values are only com-
between open-grown trees and those in forests.                     parable for this sensor type. All sensors are susceptible to a
   The specific questions we address are the following:            drift in the measurements resulting in an offset which varies
                                                                   slowly with temperature and other environmental factors.
Q1. What models best predict the fundamental frequency of
                                                                   This is particularly evident in the strain gauges presumably
    broadleaf trees and conifers?
                                                                   because they are directly attached to the tree and so respond
Q2. Are characteristics of tree motion distinct between tree       to the daily changes in tree diameter. We removed this offset
    groups (conifers, broadleaves, forest, open-grown)?            using a 10 min high-pass Butterworth filter and applied the
                                                                   same filter to inclinometer and accelerometer data to ensure
Q3. To what extent does increasing wind speed (or the              a fair comparison. This filter effectively removes the low-
    change between summer and winter) change the char-             frequency (variations slower than 10 min) part of the tree
    acteristics of tree motion?                                    motion, including any mean displacement and offset in the
                                                                   data. This period seems reasonable to capture most effects of
2     Methods                                                      wind–tree interaction, although open-grown trees exposed to
                                                                   strong winds may be displaced from their resting position for
2.1    Description of the data                                     continuous long periods of time due to the mean wind speed
                                                                   on this timescale (Angelou et al., 2019; James et al., 2006).
We collated data from 20 studies that included 243 trees           Therefore, different data filtering techniques may be more
and more than 1 million hours of tree motion data at reso-         appropriate for open-grown trees (Angelou et al., 2019).
lutions ranging from 4 to 20 Hz. These collated data are now          We selected 1 h samples during the windiest conditions
available online (Jackson et al., 2021). These studies used        available for each tree and calculated all tree motion features
three types of sensor: (1) strain gauges which measure the         for all 243 trees in our data set. We first calculated features
bending strains at the base of the tree (Moore et al., 2005),      from the combined horizontal components of tree motion.
(2) inclinometers measuring the changing inclination angle         We fitted an extreme value distribution and retained the shape
of the trunk (Bunce et al., 2019; Schindler et al., 2010), and     parameter, k, which does not depend on the absolute values
(3) accelerometers measuring the acceleration at the top of        and so is comparable across sites. The scale and location pa-
the trunk (van Emmerik et al., 2017). We refer to these in         rameters of the extreme value distribution depend on absolute
general as measures of tree deflection. Five studies addition-     values, and we did not use them in this study. Next, we cal-
ally measured branch motion, which is not used here but may        culated features from tree motion along a single axis of mo-
provide further insight in future studies. Some data sets span     tion, since combining the two horizontal axes distorts impor-
multiple years, while others are confined to a short time dur-     tant features such as f0 . The coordinate systems of each tree
ing windy conditions. Most data sets contained tree height         were not aligned with the wind direction. We therefore used
(H ) and diameter at breast height (dbh) measurements and          a principal component analysis to select the axis with highest
tree species data. Many of the individual studies in our data      variance, the “stream-wise” component, and the perpendicu-
set did not measure high-resolution (>1 Hz) wind speeds be-        lar “cross-stream” component. We calculated the ratio of the
cause this requires sonic anemometers and so would substan-        explained variance in the two components, a measure of how
tially increase the cost of the field study. Also, in most cases   elliptical the tree sway pattern is. We found that the cross-
the wind measurements were not in the same location as the         stream component did not contribute additional information,

https://doi.org/10.5194/bg-18-4059-2021                                                   Biogeosciences, 18, 4059–4072, 2021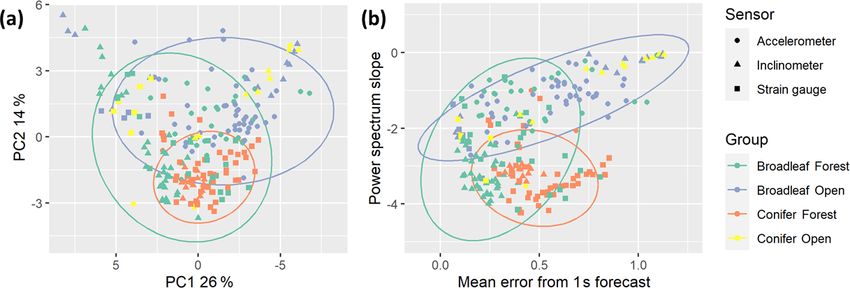
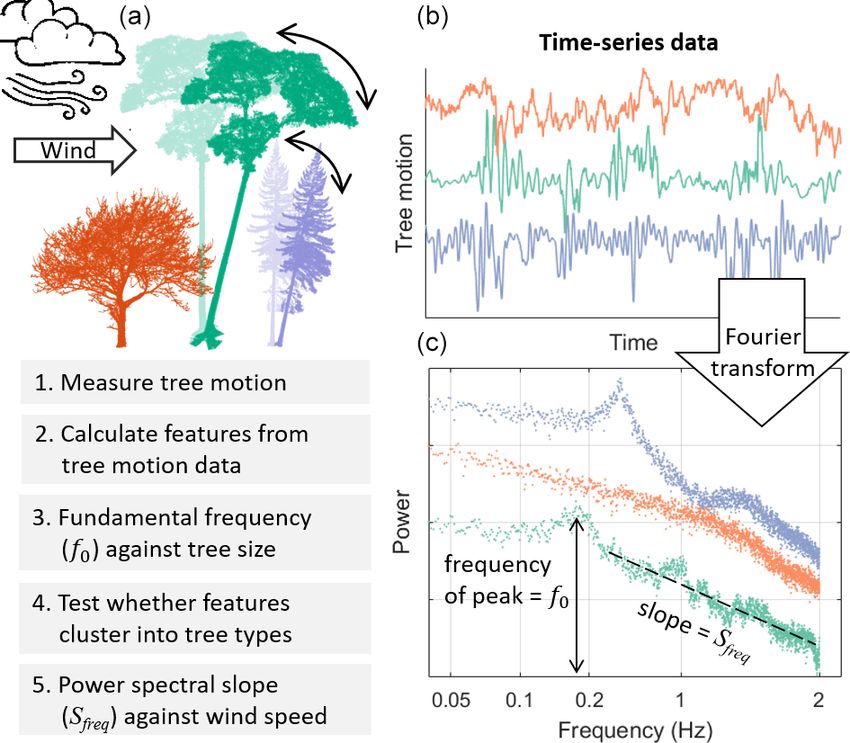
4062                                                        T. D. Jackson et al.: The motion of trees in the wind: a data synthesis

Table 1. Overview of the data sets used in this study. Links to download the data sets are provided in the “Data availability” section.

   Site                   Country         Year    Group               No. trees    Sensor             Resolution (Hz)     Wind resolution
   Rivox                  UK              1988    Conifer forest           4       Displacement              10           10 Hz
   Kershope               UK              1989    Conifer forest          11       Strain gauges             10           10 Hz
   Whitecourt             Canada          1999    Conifer forest          10       Inclinometers             10           0.2 Hz
   Clocaenog              UK              2005    Conifer forest           9       Strain gauges              4           10 Hz
   Kyloe                  UK              2006    Conifer forest           9       Strain gauges              4           10 Hz
   Belchertown            USA, MA         2006    Broadleaf open           9       Strain gauges             20           –
   Various                Australia       2006    Mixed open               9       Strain gauges             20           1 Hz
   Guanica                Puerto Rico     2007    Broadleaf forest         9       Strain gauges              4           –
   –                      USA, OR         2011    Broadleaf open           3       Accelerometer             20           –
   Gauting                Germany         2011    Conifer open             2       Accelerometer             20           –
   Hechendorf             Germany         2012    Conifer open             2       Strain gauges              6           –
   Storrs                 USA, CT         2013    Broadleaf forest        13       Inclinometer              10           30 min
   Alexandra              Singapore       2013    Broadleaf open           4       Accelerometer             10           –
   Orange                 USA, CT         2015    Broadleaf forest        14       Inclinometer              10           30 min
   Torrington             USA, CT         2015    Mixed forest            14       Inclinometer              10           30 min
   Manaus                 Brazil          2015    Broadleaf forest        19       Accelerometer             10           15 min
   Various                USA             2016    Broadleaf open           9       Accelerometer             10           –
   Hartheim               Freiburg        2016    Conifer forest           4       Inclinometers             10           10 Hz
   Morton Arboretum       USA, IL         2016    Broadleaf open           8       Accelerometers            10           –
   Wytham                 UK              2016    Broadleaf forest        21       Strain gauges              4           1 Hz
   Risø                   Denmark         2017    Broadleaf open           1       Strain gauges             20           20 Hz
   Danum                  Malaysia        2017    Broadleaf forest        19       Strain gauges              4           1 Hz
   Fond du Lac            USA, WI         2018    Broadleaf forest         4       Accelerometer             16           5 min
   Trout Lake             USA, WI         2018    Broadleaf open           8       Accelerometer             16           1 min
   Montmorency            Canada          2018    Conifer forest          15       Strain gauges              5           5 Hz
   Big Sur                USA, CA         2018    Conifer forest           2       Accelerometer              5           10 min
   Appalachian Lab        USA, MD         2019    Broadleaf open          20       Accelerometer             10           –
   Various                Germany         2019    Mixed open              16       Inclinometer              20           –
   Freiburg               Germany         2019    Conifer open             1       Accelerometer             10           10 Hz
   Hartheim               Germany         2019    Conifer open             1       Accelerometer             10           10 Hz
   Göttingen              Germany         2019    Broadleaf open           1       Inclinometer              20           –

and so all analysis in this study used the stream-wise compo-             Emmerik et al., 2017). Since different frequency ranges rep-
nent of tree sway only. This is similar to using a time series            resent different physical scales of energy transfer between
from a single, horizontal axis of motion which is aligned with            wind and trees (see Fig. 1), we calculated this slope for
the dominant direction of the wind loading.                               multiple frequency ranges (0.05–0.8, 0.8–2, and 0.05–2 Hz).
   We centred and scaled the stream-wise component of                     We test the sensitivity of this feature to different frequency
tree sway and calculated the catch22 features (Lubba et al.,              ranges and fitting methods in the Supplement (S1) and found
2019). These 22 features were selected to be maximally de-                that the trends and differences between trees are not sen-
scriptive over a wide range of time-series data. Examples                 sitive to the choice of frequency range, although the abso-
of these features are (1) the time interval between succes-               lute values are. We tested calculating Sfreq with reference to
sive extreme events above the mean, (2) the mean error from               the tree’s f0 , but this method proved too noisy at low wind
forecasting the next value of the time series as the mean of              speeds. Finally, we extracted the frequency, width, height,
the previous three, and (3) the centroid of the Fourier power             and dominance of the f0 peak from the stream-wise compo-
spectrum. For more details of these features please see the               nent. The dominance was defined as the ratio of the funda-
Supplement and the original publications (Fulcher and Jones,              mental peak height to the sum of all the heights of all other
2017; Lubba et al., 2019).                                                peaks in the spectrum (Jackson et al., 2019). In this study
   We also calculated the power spectral density of the                   we focus on the features which help distinguish between tree
stream-wise component using Welch’s method (Welch,                        types or are correlated with tree size. We do not discuss those
1967). We then calculated the slope of the power spec-                    features which do not meet these criteria, although these fea-
trum, Sfreq , by fitting a linear model between log-transformed           tures may also exhibit interesting trends that warrant further
frequency and log-transformed power spectral density (van                 study.

Biogeosciences, 18, 4059–4072, 2021                                                           https://doi.org/10.5194/bg-18-4059-2021
T. D. Jackson et al.: The motion of trees in the wind: a data synthesis                                                                4063

Figure 1. Overview of the study design. (a) Conceptual diagram of data collection showing three “types” of trees (colours) swaying in the
wind. (b) A 5 min sample of tree motion data for three trees. (c) Fourier transformed data used to calculate the fundamental frequency, slope
of the power spectrum, and related features.

2.3   Linear models of fundamental frequency against                     2.4   Classifying tree types based on tree motion features
      tree size and tree type

The aim of this analysis was to test whether the previously              The aim in this analysis was to test whether different types
observed relationship between f0 and tree size holds across              of trees exhibited distinct, characteristic motion in the wind.
the additional data in this study, especially the broadleaves.           We note that we could not account for systematic differ-
In addition to the detailed tree motion data for the 243 trees           ences in wind conditions with these data. We first tested
described above, we collated summary data on f0 and tree                 whether the trees grouped into the predefined groups (open-
size for a further 591 trees (Baker, 1997; Moore and Maguire,            grown broadleaf, forest broadleaf, open-grown conifers, for-
2004). We used a linear regression on log-transformed data               est conifer) using a principal component analysis. We then
to explore the relationship between                                      used supervised methods (linear discriminant analysis and
                                      q f0 and tree size. We             multinomial regression) to determine which two features best
                                          1
tested the simple pendulum model         H , where H is the tree         classified the trees into types. We also used a 10-fold cross-
                                        dbh
height, and a cantilever beam model     H2
                                            . This study improves        validation with a 50 : 50 training to testing data ratio to test
upon previous work (Jackson et al., 2019) by (1) increasing              whether the trees could be classified by type according to the
the sample size in the underrepresented open-grown trees,                features of their motion using a random forest model. We as-
(2) calculating f0 in a consistent way across the 243 time se-           sessed the classification accuracy using Cohen’s kappa (Co-
ries instead of using summary data, and (3) testing the simple           hen, 1960). We centred and scaled all features prior to anal-
pendulum model. Initial results showed that different models             ysis.
were more appropriate for conifers and broadleaves, so we                   Note that our sample did not contain enough open-
performed a separate analysis for each tree type instead of us-          grown conifers to perform statistical analysis on this group.
ing multiple linear regressions. We report the best fit models           We therefore performed the above analysis on 89 forest
based on the coefficient of determination (R 2 ) and Akaike’s            broadleaves and the 63 open-grown broadleaves and the 63
information criterion (AIC) (Pan, 2001).                                 forest conifers. The 17 open-grown conifers were projected
                                                                         onto the resulting axes in Fig. 3. Since the sample sizes in

https://doi.org/10.5194/bg-18-4059-2021                                                           Biogeosciences, 18, 4059–4072, 2021
4064 T. D. Jackson et al.: The motion of trees in the wind: a data synthesis
each group were not equal, we randomly resampled the larger Table 2. Summary statistics for linear models predicting funda-
groups to the size of the smallest (N = 63) and repeated each mental frequency using the cantilever beam model and the sim-
analysis with this approach 50 times. We use this evenly sam- ple pendulum model for three groups of trees. The data were log-
pled data set in the linear discriminant analysis and random transformed prior to model fitting.
forest classification analysis but not in the principal compo-
nent analysis because it did not make a substantial difference. Group N Model R2 AIC
We tested whether the classification analysis was likely Conifer forest 631 Cantilever beam 0.67 −354
impacted by the unequal tree size distributions in each Simple pendulum 0.29 142
tree type category. We used a subset of 169 trees (86
Broadleaf forest 111 Cantilever beam 0.13 78
forest broadleaves, 54 forest conifers, and 29 open-grown
Simple pendulum 0.61 −11
broadleaves) for which we have raw tree motion data, as
well as tree size data. We used a mixed-effects model (lme4) Broadleaf open 89 Cantilever beam 0.55 110
to predict tree size from the tree motion features and tree Simple pendulum 0.67 82
type (included in the model as a factor). We conducted sepa-
rate analyses for tree height and dbh, and the best predictors
were ordered using a two-way stepwise procedure based on trees, we cannot assume all sites have similar wind spectra.
minimizing AIC (Pan, 2001). The factor “tree type” was the We therefore study the change in Sfreq with wind speed for
seventh most explanatory feature in the model of height and all 103 trees individually. We display these data by fitting a
ninth in the model of dbh (see Supplement S4 for details). smoothing spline to them.
This demonstrates that tree size is more strongly related to
tree motion features than it is to tree type. Therefore, the re-
lationship between tree type and tree motion features is un- 3 Results
likely to be confounded by differences in tree size, and hence
the results of our classification analyses are valid. 3.1 Relationship between tree size and fundamental
frequency
2.5 Tracking changes in key tree motion characteristics
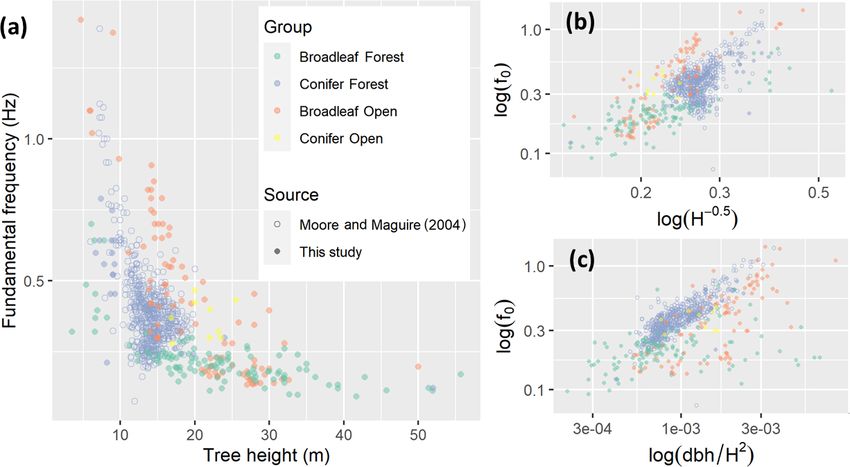
with increasing wind speed Figure 2 shows an overall decrease in f0 with tree height, es-
pecially between 5 and 20 m. These short trees are mostly
The aim of this analysis was to test whether the relationship from conifer forests, the majority of which were included
between tree motion and wind speed varies between summer in a previous review (Moore and Maguire, 2004). The
and winter and whether Sfreq changes in a predictable way open-grown broadleaves display a similar sharp decrease
with wind speed. For the data sets with long-term tree motion in f0 with height, although they are offset by approximately
and wind speed data (N = 103 trees, 74 forest broadleaves 0.5 Hz, which may be due to their wider stems. Table 2 shows
and 29 forest conifers), we calculated each of the features that the best predictor of f0 for the conifers was the can-
described above for every hour of data available. We also cal- dbh
tilever beam model f0 ∼ H 2 as demonstrated by Moore
culated the hourly mean wind speed, the maxima, and 99th and Maguire (2004). This is unsurprising, since data from
percentile of the tree deflection. We fitted a linear model to the previous review dominate this group of trees, but this re-
the relationship between tree deflection and squared wind lationship still holds in the new data for forest conifers. How-
speed for each tree separately and saved the coefficient, the ever, for both open-grown and forest broadleaves the simple
slope of this fit line. We then calculated the ratio of the slope q
in summer (defined as 1 May–31 September) to the slope pendulum model f0 ∼ H1 was the best predictor of f0 .
in winter. For deciduous trees, this ratio indicates whether It is important to note that the taller trees in our study are
the increased drag due to leaves in summer causes increased almost exclusively broadleaves, and almost all were from a
deflection or whether other mechanisms such as sheltering forest environment. Also, a mixed-effects model showed that
and damping compensate. We excluded trees with low sam- f0 was the feature most strongly correlated with tree height
ple sizes (T. D. Jackson et al.: The motion of trees in the wind: a data synthesis 4065 Figure 2. (a) Fundamental frequency against tree height on a linear scale. Small panels on log–log scales show fundamental frequency against (b) the simple pendulum model and (c) the cantilever beam model. Figure 3. Features of tree motion from 229 trees during summer high (local) wind speed conditions projected on (a) first two principal component axes (arbitrary units) and (b) maximally discriminant axes (original units, unscaled). Ellipses represent Student’s t distributions around the data and were only drawn around groups with sufficient samples: broadleaf forest (N = 86), conifer forest (N = 63), and broadleaf open (N = 63). are grouped together and cover a small proportion of the by catch22 features, primarily the mean error from a rolling variance in both panels. The open-grown conifers seem to three-sample mean forecasting. The second principal com- mainly overlap with the open-grown broadleaves, but we did ponent, while it only explained 14 % of the variation, helped not have enough samples to test this statistically. The forest distinguish between the groups of trees. The second principal broadleaves covered the largest area and overlapped with all component comprised mainly spectral features, specifically other groups. We tested whether sample size affected this pat- Sfreq and the height of the fundamental frequency peak. tern by randomly sampling a subset of the forest broadleaves Figure 3b shows how the trees group along the two most to the same sample size as the other types and repeating the discriminant features, determined using linear discriminant analysis and found no substantial change in the distribution. analysis and multinomial regression. It shows a clear sepa- As expected, given that the catch22 features were designed ration between forest conifers and open-grown broadleaves, to be minimally redundant, the principal components did not driven by Sfreq , which is related not only to the damping ef- explain a large amount of the total variation across all fea- ficiency of the tree but also to the energy spectrum of the tures (Fig. 3a). The first principal component was driven local wind loading (see “Discussion”). We note that a mixed- https://doi.org/10.5194/bg-18-4059-2021 Biogeosciences, 18, 4059–4072, 2021
4066                                                   T. D. Jackson et al.: The motion of trees in the wind: a data synthesis

effects model analysis showed that Sfreq was strongly corre-       However, since our data set contains a wide variety of sen-
lated with dbh but that tree group, included in the model as       sors, some of which are extremely sensitive and which all ex-
a factor, was not (see Supplement S2 for details). The x axis      hibit similar patterns, we do not believe that the noise at low
provides the best separation of forest broadleaves from the        wind speeds is the (main) reason for the pattern. We found
other groups based on the mean error from a 1 s forecast (pre-     no systematic difference in this behaviour between types of
dicting the fourth value from the previous three in a 4 Hz sig-    trees.
nal). This feature describes how predictable the signal is at
short timescales and is likely influenced by both the speed
and responsiveness of the tree motion, as well as the level of     4     Discussion
noise in the signal.
                                                                   4.1    Key features of tree motion
   We performed multiple classification tasks using a ran-
dom forest model with evenly balanced groups (N = 63),             As expected, we found that f0 was a key feature of tree
a 50 : 50 training to testing data split, and a 10-fold cross-     motion, being strongly correlated with tree height (Figs. 2
validation approach. In all cases we found that the stream-        and S3–S4) and playing an important role in distinguish-
wise catch22 features improved classification ability com-         ing between tree types. We showed that Sfreq was stable at
pared to using only the features from the literature but that      medium-high wind speeds (Fig. 4d) and this was the feature
the cross-stream features added minimal further informa-           which best distinguished the different types of trees. The fact
tion. We found a moderate classification ability, Cohen’s          that two features previously used in the literature remain im-
kappa = 0.646, for the three-group classification (omitting        portant when compared to the catch22 features, which were
open-grown conifers due to lack of data). Two group classi-        specifically designed for time-series classification, demon-
fication analyses for the forest broadleaves against the other     strates that these two features capture key characteristics of
groups had slightly lower accuracy (kappa = 0.533 for open-        tree motion. Interestingly, the width, height, and dominance
grown broadleaves and kappa = 0.639 for forest conifers).          of the fundamental frequency peak were not important fea-
However, the two-group classification between open-grown           tures in this analysis; i.e. they did not explain much of the
broadleaves and forest conifers resulted in a high accuracy,       difference between tree types and were not strongly corre-
kappa = 0.90. These results align with our qualitative inter-      lated with tree size.
pretation of the overlap between groups in Fig. 3, as de-             We also found that a number of catch22 features were
scribed above.                                                     important for classifying tree types and were highly corre-
                                                                   lated with tree size (S3–S4). In particular, the mean error
3.3    Changes in tree response with wind speed                    from a rolling three-sample mean forecast was important
                                                                   in distinguishing tree types (Fig. 3b). We interpret this fea-
Figure 4a shows a typical power-law relationship between           ture as a measure of the regularity of the tree motion at 1 s
tree deflection (in this case measured as inclination) and         timescales (all signals were analysed at 4 Hz). This regular-
wind speed. Figure 4b shows how much more deflection oc-           ity could be related to the wind conditions (i.e. a turbulent
curs for a given wind speed in summer as compared to win-          wind in a multi-layered forest leading to lower regularity)
ter. As expected, we found that the deflection of the decid-       or the properties of the tree. For example, a small fast mov-
uous broadleaves increased more than that of the conifers          ing conifer would be less predictable, and a large broadleaf
(p10 h       forest trees in our clustering analyses (Fig. 3) and a rel-
of data (N = 93). As in Fig. 4c, we see an initial decline fol-    atively low accuracy in classifying these groups based on
lowed by a constant Sfreq above a given threshold. Part of this    their motion. We did, however, observe that the open-grown
trend is likely driven by noise at low wind speeds since the       conifers overlapped mostly with the open-grown broadleaves
sensors will not reliably measure very low-level tree motion.      rather than the forest conifers, but the low sample size in this

Biogeosciences, 18, 4059–4072, 2021                                                   https://doi.org/10.5194/bg-18-4059-2021
T. D. Jackson et al.: The motion of trees in the wind: a data synthesis 4067 Figure 4. Changes in tree motion characteristics with wind speed for trees in forests. (a) Tree inclination angle against wind speed measured outside the forest for an example deciduous tree (Acer rubrum in Orange, Connecticut) in summer and winter with power-law fit lines overlaid. (b) Ratio of power-law fit slopes in summer and winter for all trees with >10 h of data in both seasons, excluding tropical trees. The horizontal black lines represent the median value. (c) Slope of the power spectrum (between 0.05 and 2 Hz) for a single tree (same as panel a) in summer and winter with smoothing splines overlaid. (d) Same as panel (c) but for all trees. Trends are approximated by smoothing splines, and summer and winter data are combined. group (N = 17) hindered any statistical analysis. Given their (Q1). This is likely due to the higher, heavier, and more dis- markedly divergent growth forms (MacFarlane and Kane, tinct crowns of broadleaves determining the characteristics 2017), we expected open-grown trees to behave quite dif- of their motion more strongly than the distributed crowns of ferently to the slender trees found in a forest environment conifers. Together, these findings support the theory that the (Q2). This lack of difference could be due to the diversity motions of coniferous trees are relatively similar due to their of broadleaves in this sample and difficulty of defining the simple architecture (Jackson et al., 2019), whereas the oppo- boundary between open-grown and forest trees (in this study site is true of broadleaves in general. On this basis, we would the data owners provided their own interpretation). This neg- expect emergent tropical trees, which also have a simple and ative result may be interpreted as good news from a wind consistent architecture, to respond to wind in a similarly pre- damage modelling point of view since it suggests that exist- dictable way. If this is the case (we did not have sufficient ing models (developed for conifer forests) may be generaliz- data from tall trees to test this theory here), this could en- able to open-grown trees. able a simple yet accurate wind damage model for tropical We found a consistent and distinct grouping of the for- forests focussing only on the large trees which store the ma- est conifers in both the supervised and unsupervised cluster- jority of the forest carbon (Bastin et al., 2015). We note that ing analyses (Fig. 3) which is also reflected in the classifi- the conifers in this study were considerably smaller than the cation analysis. This was driven by their steeper Sfreq , which broadleaf trees. We suggest that the simpler pendulum model suggests a difference in either the wind–tree energy transfer may be valid for a wider range of tree sizes than the can- or the damping mechanisms. We also found that the f0 of tilever beam model, and it would be interesting to test this conifers was best predicted by the cantilever beam model for a range of tall conifers. (i.e. a beam with distributed weight) (Moore and Maguire, It is important to note that, in order to maximize the num- 2004). Broadleaves, however, were best approximated by the ber of trees in our study, the clustering analyses did not in- pendulum model (i.e. dominated by the weight of the crown) corporate any wind data. Therefore, differences in wind envi- https://doi.org/10.5194/bg-18-4059-2021 Biogeosciences, 18, 4059–4072, 2021
4068                                                   T. D. Jackson et al.: The motion of trees in the wind: a data synthesis

ronment may confound differences in tree response. For ex-         Rifai et al., 2016), which suggests that large trees are more
ample, the grouping of the conifers could be explained if pat-     vulnerable to wind damage. However, post-damage assess-
terns of wind flow over conifer forests are generally similar,     ments may be confounded by other processes, such as disease
but wind flow over broadleaf forests and open-grown trees          or lightning, driving the observed pattern in tree mortality.
is more variable. This emphasizes the importance of collect-       Wind damage risk was measured directly on living trees and
ing high-resolution (>1 Hz) wind data alongside tree motion        found to increase in two conifer forests (Duperat et al., 2020;
data to understand the details of this interaction. These data     Hale et al., 2012) and a tropical forest in Malaysia (Jackson
are currently lacking for open-grown trees and especially for      et al., 2020). It would be highly valuable to extend this anal-
tropical forests.                                                  ysis across all trees with long-term data in this study to test
                                                                   whether this trend is consistent. However, the different types
4.3    Trends with increasing wind speed and seasonal              of sensors used to measure tree motion and their mounting
       differences                                                 positions made these data difficult to interpret in terms of risk
                                                                   across sites. We recommend the use of strain gauges to mea-
As expected, maximum tree deflection (measured by either           sure tree motion in this case since they provide comparable
acceleration, inclination, or bending strain) increased with       absolute values which can be related to the risk of mechanical
wind speed (Fig. 4a). We found that the gradient of this in-       damage. In addition, the low number of trees in each individ-
crease was generally steeper in summer for the deciduous           ual experiment limited the applicability of a mixed-effects
trees (Q3) (Fig. 4b) presumably because their leaves provide       model in this context. We note that this research question
a larger sail area. This effect is consistent with an increased    could be answered with local hourly wind speed measure-
drag on trees with leaves found in previous studies (Dell-         ments and therefore does not require sonic anemometers and
wik et al., 2019; Kane and Smiley, 2006). High wind speeds         so could be achieved at low-cost. To aid comparison between
are more common in winter, so losing leaves will reduce a          sites, locally measured wind speeds could be related to some
tree’s risk of wind damage. However, for some deciduous            near-surface reference wind speed available at hourly resolu-
trees this ratio was below 1, which could be explained by in-      tion, such as the hourly 10 m wind gust product provided by
creased sheltering from nearby trees. We also found a slight       the European Centre for Medium-Range Weather Forecasts.
increase in the tree deflection in summer for some conifers           Collating this data set highlighted the paucity of data avail-
which could be explained by soil conditions or wood proper-        able for open-grown conifers, with the exception of James
ties, especially in the sites which freeze in winter, although     et al. (2006). The low number of these trees in our data set
additional measurements would be required to test this.            precluded statistical analysis, and further data collection in
   The spectrum of the tree (characterized by Sfreq ) is es-       this area would be highly valuable. We also note the low
sentially the spectra of the wind, modified by the proper-         representation of tropical forests, which are likely to be the
ties of the tree. We observed a remarkably constant Sfreq          most complex due to their structure and diversity. Neither of
from medium to high wind speeds. This plateau in Sfreq sug-        the two tropical sites in this study had high-resolution wind
gests that the frequencies at which energy is transferred from     speed data for high wind periods.
the wind to the tree do not change in the high wind speed             A number of single-site studies have demonstrated in-
regime. This plateau in Sfreq suggests that no important ad-       triguing relationships between fundamental frequency and
ditional damping or amplification mechanisms emerge above          ecological processes such as phenology, water status, rain
this threshold, meaning that wind damage risk is likely sim-       interception, and drought (Bunce et al., 2019; Ciruzzi and
ply to increase with wind speed. We note that the classifica-      Loheide, 2019; van Emmerik et al., 2018; Gougherty et
tion analysis and correlation of features with tree size used      al., 2018). Extending these analyses across the full data set
these stable, high wind speed Sfreq values.                        would allow us to test how robust these relationships are and
   We could not explain the fact that Sfreq increased from low     therefore whether trees can be used as indicators of ecologi-
to medium wind speeds. We found a wide variation between           cal processes in other ecosystems. This could be particularly
individual trees in the shape of this curve, as well as the        interesting in sites which freeze in winter since this will have
stable value, but we found no consistent difference between        a profound effect on the wood elasticity. Additional data col-
seasons, suggesting it is not driven by leaf streamlining pro-     lection for these purposes should use inertial measurement
cesses.                                                            units (IMUs) which combine accelerometers, inclinometers,
                                                                   and magnetometers because the signals have a lower drift
4.4    Future research directions                                  than the strain gauges.
                                                                      In addition, there has been a long-standing debate on the
A number of research questions arise from this study and the       potential role of resonance between the wind and the tree
collation of this data set. Most importantly, does wind dam-       leading to wind damage (i.e. a high-energy frequency in the
age risk increase with tree height? Damage assessments after       wind spectra coinciding with f0 ) (Blackburn et al., 1988;
destructive windstorms have shown a larger proportion of tall      Holbo et al., 1980; Oliver and Mayhead, 1974; Rodriguez et
trees uprooted or snapped (Magnabosco Marra et al., 2018;          al., 2008; Schindler et al., 2010; Schindler and Mohr, 2018).

Biogeosciences, 18, 4059–4072, 2021                                                   https://doi.org/10.5194/bg-18-4059-2021
T. D. Jackson et al.: The motion of trees in the wind: a data synthesis 4069
Previous work used singular spectrum analysis to show that to estimating wind damage risk and understanding the role
the oscillatory component of tree sway diminished with wind of wind in forest ecology more generally.
speed for four forest Scots pine trees (Schindler and Mohr,
2018). This result shows that no resonance between wind and
tree occurs at the observed wind speeds and that resonance is Code availability. All code created for this analysis is avail-
unlikely to occur at higher wind speeds. It would be useful to able here: https://github.com/TobyDJackson/Tree_motion_data_
test whether this result holds across all the trees in the current synthesis (Jackson, 2021). Please contact the corresponding author
study. if you have any questions or need additional materials.
The subset of data with high-resolution wind speed mea-
surements could be used to explore energy transfer and
Data availability. This data set is a product of the work of
damping efficiency of different trees. In particular, the iden-
many researchers, and collaborations are encouraged. Most of
tification of Sfreq as a key feature of tree motion, possibly the data used in this study are available in a single repository
related to the drag factor and damping efficiency, warrants at https://doi.org/10.5281/zenodo.4911395 (Jackson et al., 2021)
further exploration (van Emmerik et al., 2018). Further data which also stores metadata for all trees used in this study. Other
collection aimed at understanding the mechanisms involved data sets are available in individual repositories as follows. The Sin-
in energy transfer from the wind to the tree should use arrays gapore data are available at https://doi.org/10.7910/DVN/FHJBYG
of sonic anemometers above and below the canopy close to (Burcham, 2020). The Montmorency data are available at
the target trees to collect high-resolution (>5 Hz) local wind https://doi.org/10.5683/SP2/WZIKSR (Duperat et al., 2019).
speed data. We suggest future studies of this kind combine The Manaus data are available at https://data.4tu.nl/articles/
multiple sensors to measure tree motion and follow a stan- dataset/Tree_of_19_Amazon_trees/12714989/1 (van Em-
dardized protocol to calibrate the sensors and so ensure data merik et al., 2021). The Wytham Woods data are avail-
able at https://doi.org/10.5285/533d87d3-48c1-4c6e-9f2f-
are comparable between studies.
fda273ab45bc (Jackson, 2018a). The Danum Valley data are
available at https://doi.org/10.5285/657f420e-f956-4c33-b7d6-
98c7a18aa07a (Jackson, 2018b). The Trout Lake and Fond du
Lac data are available at http://www.hydroshare.org/resource/
5 Conclusions 38ae9d9fb88d49f9ad2eed1ee07475c0 (Ciruzzi and Loheide,
2021). For any questions regarding data availability please contact
In this study, we collated data on tree motion in order to ex- the corresponding author.
plore the key similarities and differences amongst trees, as
well as possible trends with tree size and wind speed. We
compared trees and tested trends based on features extracted Supplement. The supplement related to this article is available on-
from the tree motion time series. line at: https://doi.org/10.5194/bg-18-4059-2021-supplement.
We found that trees in conifer forests exhibit similar re-
sponses to wind loading and that these were distinct from
those of broadleaves, presumably as a result of their simpler Author contributions. TDJ, BG, DS, and ED conceived the idea.
branching architecture. However, we could not reliably dis- TDJ collated the data, which were contributed by JS, AVG, DB,
DMC, SPL, MD, JCR, TvE, AB, BK, KJ, ED, NA, BG, DS, SK,
tinguish between open-grown and forest broadleaves based
AW, AK, RS, JM, MR, ARA, AA, VJL, SVB, JW, AD, and SR. TDJ
on their motion in the wind despite their substantial archi-
conducted the analysis with input from SS, DS, BG, TN, NA, and
tectural differences. Our analysis confirms previous studies ED. DC contributed to the writing process. All authors contributed
showing that the fundamental frequency, which describes the to the writing process and agreed on the final version.
speed of tree sway, is a robust feature with which to com-
pare the motion of trees and which is strongly related to tree
size. Future studies should examine how the fundamental fre- Competing interests. The authors declare that they have no conflict
quency of trees changes over time since this is related to tree of interest.
mass and elasticity and hence to a range of important ecolog-
ical processes such as leaf phenology and water status.
We also found that the slope of the power spectrum, which Disclaimer. Publisher’s note: Copernicus Publications remains
is related to the wind–tree energy transfer, is an important neutral with regard to jurisdictional claims in published maps and
feature in distinguishing tree types and displayed consistent institutional affiliations.
trends with wind speed. All trees in this study exhibited a re-
markably constant slope of the power spectrum from medium
to high wind speeds in both summer and winter. This sug- Acknowledgements. We would like to thank everyone who assisted
gests that the relationship between wind loading and tree with data collection and the local authorities who granted access to
the field sites. We would also like to thank the editors and reviewers
deflection is simply related to wind speed in the high wind
who helped substantially improve this manuscript.
speed range. This result could be an important contribution
https://doi.org/10.5194/bg-18-4059-2021 Biogeosciences, 18, 4059–4072, 20214070 T. D. Jackson et al.: The motion of trees in the wind: a data synthesis
Financial support. Toby D. Jackson and David Coomes were sup- https://doi.org/10.7910/DVN/FHJBYG, last access: 1 September
ported by the Natural Environment Research Council (grant no. 2020.
NE/S010750/1). Sarab Sethi was support by the Engineering and Ciftci, C., Brena, S. F., Kane, B., and Arwade, S. R.: The
Physical Sciences Research Council (grant no. EP/R511547/1). effect of crown architecture on dynamic amplification fac-
Tim van Emmerik was supported by the 4TU Federation project tor of an open-grown sugar maple, Trees, 27, 1175–1189,
Plantenna. Jean-Claude Ruel and Marine Duperat were supported https://doi.org/10.1007/s00468-013-0867-z, 2013.
by the Natural Sciences and Engineering Research Council of Ciruzzi, D. M. and Loheide, S. P.: Monitoring tree sway as an in-
Canada (grant no. RGPIN-2016-05119) and the Canadian Wood Fi- dicator of water stress, Geophys. Res. Lett., 46, 12021–12029,
bre Centre (grant no. CWFC1820009). Skip Van Bloem was sup- https://doi.org/10.1029/2019GL084122, 2019.
ported by the US Department of Agriculture (grant no. PR00-NRI- Ciruzzi, D. and Loheide, S.: Continuous acceleration time se-
001). Steven P. Loheide II and Dominick M. Ciruzzi were supported ries for tree sway monitoring in a temperate, humid en-
by the National Science Foundation (grant no. EAR-1700983) and vironment, HydroShare [Dataset], http://www.hydroshare.org/
US Forest Service agreement (grant no. 18-JV-11242308-016) un- resource/38ae9d9fb88d49f9ad2eed1ee07475c0, last access: 2
der Focus Area 3 of the US EPA Great Lakes Restoration Initiative. February 2021.
Mark Rudnicki and Victor J. Lieffers were supported by NSERC Cohen, J.: A coefficient of agreement for nom-
(grant no. IRCSA 233737-98). Andrew V. Gougherty was sup- inal scales, Educ. Psychol. Meas., 20, 37–46,
ported by National Science Foundation (grant no. IOS-1461868). https://doi.org/10.1177/001316446002000104, 1960.
Roger Samelson was supported by National Science Foundation Dargahi, M., Newson, T., and R. Moore, J.: A numerical approach
(grant no. OCE-1600109 and OCE-1853039). Barry Gardiner was to estimate natural frequency of trees with variable properties,
supported by the Research Council of Norway (grant no. 301745 Forests, 11, 915, https://doi.org/10.3390/f11090915, 2020.
MARCSMAN). de Langre, E.: Effects of wind on plants,
Annu. Rev. Fluid Mech., 40, 141–168,
https://doi.org/10.1146/annurev.fluid.40.111406.102135, 2008.
Review statement. This paper was edited by Akihiko Ito and re- de Langre, E.: Plant vibrations at all scales: a review, J. Exp. Bot.,
viewed by two anonymous referees. 70, 3521–3531, https://doi.org/10.1093/jxb/erz209, 2019.
Dellwik, E., van der Laan, M. P., Angelou, N., Mann, J.,
and Sogachev, A.: Observed and modeled near-wake flow
behind a solitary tree, Agr. Forest Meteorol., 265, 78–87,
https://doi.org/10.1016/j.agrformet.2018.10.015, 2019.
References Duperat, M., Ruel, J.-C., and Gardiner, B.: Impact of thinning in
naturally regenerated balsam fir stand, Scholars Portal Data-
Angelou, N., Dellwik, E., and Mann, J.: Wind load estimation on verse [Dataset], V1, https://doi.org/10.5683/SP2/WZIKSR (last
an open-grown European oak tree, For. An Int. J. For. Res., 92, access: 4 September 2020), 2019.
381–392, https://doi.org/10.1093/forestry/cpz026, 2019. Duperat, M., Gardiner, B., and Ruel, J.-C.: Testing an in-
Baker, C. J.: Measurements of the natural fre- dividual tree wind damage risk model in a naturally re-
quencies of trees, J. Exp. Bot., 48, 1125–1132, generated balsam fir stand: potential impact of thinning on
https://doi.org/10.1093/jxb/48.5.1125, 1997. the level of risk, For. An. Int. J. For. Res., 94, 141–150,
Bastin, J. F., Barbier, N., Réjou-Méchain, M., Fayolle, A., Gourlet- https://doi.org/10.1093/forestry/cpaa023, 2020.
Fleury, S., Maniatis, D., De Haulleville, T., Baya, F., Beeckman, Espírito-Santo, F. D. B., Gloor, M., Keller, M., Malhi, Y., Saatchi,
H., Beina, D., Couteron, P., Chuyong, G., Dauby, G., Doucet, J. S., Nelson, B., Junior, R. C. O., Pereira, C., Lloyd, J., Frol-
L., Droissart, V., Dufrêne, M., Ewango, C., Gillet, J. F., Gon- king, S., Palace, M., Shimabukuro, Y. E., Duarte, V., Men-
madje, C. H., Hart, T., Kavali, T., Kenfack, D., Libalah, M., doza, A. M., López-González, G., Baker, T. R., Feldpausch, T.
Malhi, Y., Makana, J. R., Pélissier, R., Ploton, P., Serckx, A., R., Brienen, R. J. W., Asner, G. P., Boyd, D. S., and Phillips,
Sonké, B., Stevart, T., Thomas, D. W., De Cannière, C., and O. L.: Size and frequency of natural forest disturbances and
Bogaert, J.: Seeing Central African forests through their largest the Amazon forest carbon balance, Nat. Commun., 5, 3434,
trees, Sci. Rep., 5, 13156, https://doi.org/10.1038/srep13156, https://doi.org/10.1038/ncomms4434, 2014.
2015. Fulcher, B. D. and Jones, N. S.: hctsa: A computational
Blackburn, P., Petty, J. A., and Miller, K. F.: An assessment of the framework for automated time-series phenotyping us-
static and dynamic factors involved in windthrow, Forestry, 61, ing massive feature extraction, Cell Syst., 5, 527–531,
29–43, https://doi.org/10.1093/forestry/61.1.29, 1988. https://doi.org/10.1016/j.cels.2017.10.001, 2017.
Bonnesoeur, V., Constant, T., Moulia, B., and Fournier, M.: Forest Gardiner, B. A.: Mathematical modelling of the static and dy-
trees filter chronic wind-signals to acclimate to high winds, New namic characteristics of plantation trees, in: Franke, Mathemat-
Phytol., 210, 850–860, https://doi.org/10.1111/nph.13836, 2016. ical Modelling of Forest Ecosystems, edited by: J. and Roeder,
Bunce, A., Volin, J. C., Miller, D. R., Parent, J., and A., Frankfurt am Main, Sauerläinder’s Verlag, 40–61, 1992.
Rudnicki, M.: Determinants of tree sway frequency Gougherty, A. V., Keller, S. R., Kruger, A., Stylinski, C. D., El-
in temperate deciduous forests of the Northeast more, A. J., and Fitzpatrick, M. C.: Estimating tree phenology
United States, Agr. Forest Meteorol., 266/267, 87–96, from high frequency tree movement data, Agr. Forest Meteorol.,
https://doi.org/10.1016/J.AGRFORMET.2018.11.020, 2019. 263, 217–224, https://doi.org/10.1016/j.agrformet.2018.08.020,
Burcham, D.: Ambient vibration of mature Hopea 2018.
odorata trees, Harvard Dataverse [Dataset], V1,
Biogeosciences, 18, 4059–4072, 2021 https://doi.org/10.5194/bg-18-4059-2021T. D. Jackson et al.: The motion of trees in the wind: a data synthesis 4071 Hale, S. E., Gardiner, B. A., Wellpott, A., Nicoll, B. C., and Achim, composition of Amazon forests, Glob. Change Biol., 24, 5867– A.: Wind loading of trees: Influence of tree size and competition, 588, https://doi.org/10.1111/gcb.14457, 2018. Eur. J. For. Res., 131, 203–217, https://doi.org/10.1007/s10342- Mayer, H.: Wind-induced tree sways, Trees, 1, 195–206, 010-0448-2, 2012. https://doi.org/10.1007/BF01816816, 1987. Holbo, H. R., Corbett, T. C., and Horton, P. J.: Aeromechani- Moore, J., Gardiner, B., and Sellier, D.: Tree mechanics and wind cal behavior of selected Douglas-fir, Agr. Meteorol., 21, 81–91, loading, in: Plant Biomechanics, Springer International Publish- https://doi.org/10.1016/0002-1571(80)90056-4, 1980. ing, Chamber, 79–106, 2018. Jackson, T.: Strain measurements on 21 trees in Wytham Moore, J. R. and Maguire, D. A.: Natural sway frequencies Woods, UK. NERC Environmental Information Data Centre, and damping ratios of trees: concepts, review and synthe- [Dataset], https://doi.org/10.5285/533d87d3-48c1-4c6e-9f2f- sis of previous studies, Trees-Struct. Funct., 18, 195–203, fda273ab45bc (last access: 21 May 2020), 2018a. https://doi.org/10.1007/s00468-003-0295-6, 2004. Jackson, T.: A time-series of strains in response to wind Moore, J. R., Gardiner, B. A., Blackburn, G. R. A., Brick- measured on 19 trees in Danum Valley, Malaysia, man, A., and Maguire, D. A.: An inexpensive instru- NERC Environmental Information Data Centre, [Dataset], ment to measure the dynamic response of standing trees https://doi.org/10.5285/657f420e-f956-4c33-b7d6- to wind loading, Agr. Forest Meteorol., 132, 78–83, 98c7a18aa07a (last access: 20 July 2020), 2018b. https://doi.org/10.1016/j.agrformet.2005.07.007, 2005. Jackson, T.: Tree motion data synthesis, Github [Dataset], https:// Oliver, H. R. and Mayhead, G. J.: Wind measurements in a github.com/TobyDJackson/Tree_motion_data_synthesis, last ac- pine forest during a destructive gale, Forestry, 47, 185–194, cess: 1 May 2021. https://doi.org/10.1093/forestry/47.2.185, 1974. Jackson, T., Shenkin, A., Moore, J., Bunce, A., Emmerik, T. van, Pan, W.: Akaike’s information criterion in general- Kane, B., Burcham, D., James, K., Selker, J., Calders, K., Origo, ized estimating equations, Biometrics, 57, 120–125, N., Disney, M., Burt, A., Wilkes, P., Raumonen, P., Menaca, https://doi.org/10.1111/j.0006-341X.2001.00120.x, 2001. J. G. de T., Lau, A., Herold, M., Goodman, R. C., Fourcaud, Rifai, S. W., Urquiza Muñoz, J. D., Negrón-Juárez, R. I., Ramírez T., and Malhi, Y.: An architectural understanding of natural Arévalo, F. R., Tello-Espinoza, R., Vanderwel, M. C., Lichstein, sway frequencies in trees, J. R. Soc. Interface, 16, 20190116, J. W., Chambers, J. Q., and Bohlman, S. A.: Landscape-scale https://doi.org/10.1098/RSIF.2019.0116, 2019. consequences of differential tree mortality from catastrophic Jackson, T., Bunce, A., James, K., Wellpott, A., Van Bloem, wind disturbance in the Amazon, Ecol. Appl., 26, 2225–2237, S., Achim, A., and Gardiner, B.: The motion of trees in the https://doi.org/10.1002/eap.1368, 2016. wind – a collection of multiple data sets, Zenodo [Dataset], Rodriguez, M., De Langre, E., and Moulia, B.: A scaling law for the https://doi.org/10.5281/ZENODO.4915883, last access: 15 June effects of architecture and allometry on tree vibration modes sug- 2021. gests a biological tuning to modal compartmentalization, Am. J. Jackson, T. D., Shenkin, A. F., Majalap, N., Bin Jami, J., Bin Sailim, Bot., 95, 1523–1537, https://doi.org/10.3732/ajb.0800161, 2008. A., Reynolds, G., Coomes, D. A., Chandler, C. J., Boyd, D. S., Rodriguez, M., Ploquin, S., Moulia, B., and de Langre, E.: The mul- Burt, A., Wilkes, P., Disney, M., and Malhi, Y.: The mechani- timodal dynamics of a walnut Ttree: Experiments and models, cal stability of the world’s tallest broadleaf trees, Biotropica, 53, J. Appl. Mech., 79, 44505, https://doi.org/10.1115/1.4005553, 110–120, https://doi.org/10.1111/btp.12850, 2020. 2012. James, K. R., Haritos, N., and Ades, P. K.: Mechanical stabil- Schelhaas, M.-J. J., Nabuurs, G.-J. J., and Schuck, A.: Natural dis- ity of trees under dynamic loads, Am. J. Bot., 93, 1522–1530, turbances in the European forests in the 19th and 20th centuries, https://doi.org/10.3732/ajb.93.10.1522, 2006. Glob. Change Biol., 9, 1620–1633, 2003. Kane, B. and Smiley, E. T.: Drag coefficients and crown area Schindler, D. and Mohr, M.: Non-oscillatory response estimation of red maple, Can. J. For. Res., 36, 1951–1958, to wind loading dominates movement of Scots pine https://doi.org/10.1139/x06-086, 2006. trees, Agr. Forest Meteorol., 250/251, 209–216, Kerzenmacher, T. and Gardiner, B.: A mathematical https://doi.org/10.1016/j.agrformet.2017.12.258, 2018. model to describe the dynamic response of a spruce Schindler, D., Vogt, R., Fugmann, H., Rodriguez, M., Schönborn, tree to the wind, Trees-Struct. Funct., 12, 385–394, J., and Mayer, H.: Vibration behavior of plantation-grown Scots https://doi.org/10.1007/s004680050165, 1998. pine trees in response to wind excitation, Agr. Forest Meteorol., Lubba, C. H., Sethi, S. S., Knaute, P., Schultz, S. R., Fulcher, 150, 984–993, https://doi.org/10.1016/j.agrformet.2010.03.003, B. D., and Jones, N. S.: catch22: Canonical time-series 2010. characteristics, Data Min. Knowl. Discov., 33, 1821–1852, Sellier, D. and Fourcaud, T.: Crown structure and wood properties: https://doi.org/10.1007/s10618-019-00647-x, 2019. Influence on tree sway and response to high winds, Am. J. Bot., MacFarlane, D. W. and Kane, B.: Neighbour effects on tree archi- 96, 885–896, https://doi.org/10.3732/ajb.0800226, 2009. tecture: functional trade-offs balancing crown competitiveness Sellier, D., Brunet, Y., and Fourcaud, T.: A numerical model of tree with wind resistance, edited by M. Larjavaara, Funct. Ecol., 31, aerodynamic response to a turbulent airflow, Forestry, 81, 279– 1624–1636, https://doi.org/10.1111/1365-2435.12865, 2017. 297, https://doi.org/10.1093/forestry/cpn024, 2008. Magnabosco Marra, D., Trumbore, S. E., Higuchi, N., Ribeiro, G. Senf, C. and Seidl, R.: Mapping the forest disturbance regimes of H. P. M., Negrón-Juárez, R. I., Holzwarth, F., Rifai, S. W., dos Europe, Nat. Sustain., 4, 63–70, https://doi.org/10.1038/s41893- Santos, J., Lima, A. J. N., Kinupp, V. F., Chambers, J. Q., and 020-00609-y, 2020. Wirth, C.: Windthrows control biomass patterns and functional https://doi.org/10.5194/bg-18-4059-2021 Biogeosciences, 18, 4059–4072, 2021
You can also read


