Web Application Troubleshooting - White Paper - VIAVI Solutions
←
→
Page content transcription
If your browser does not render page correctly, please read the page content below
VIAVI Solutions
White Paper

Web Application
Troubleshooting

Increasingly many business applications are being built with web frontends. In order to
manage these applications, network managers require both solutions capable of isolating
HTTP transaction details and providing analysis, as well as the knowledge to interpret the
analysis and successfully resolve issues.

This paper provides foundational knowledge for
IT professionals managing web applications by:
                                                    To ensure business apps run
y Exploring the meaning of critical HTTP
  status codes                                      smoothly, network teams need
y Illustrating logical troubleshooting workflows
                                                    solutions providing detailed HTTP
y Demonstrating how to provide evidence
                                                    analysis and the knowledge to
  web developers can act upon                       quickly understand errors and
                                                    resolve the issue.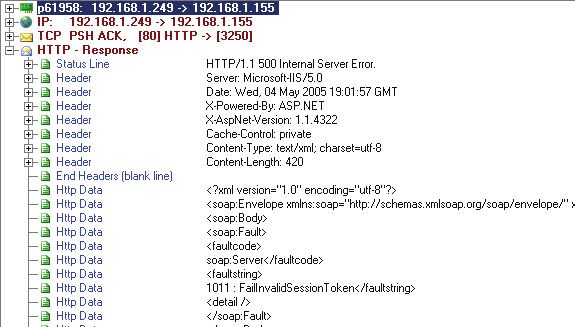
HTTP Status Codes                                                        Establish Troubleshooting Workflows
In looking at web transactions and packets, it’s first                   The HTTP status codes not only provide an indication
important to be familiar with the various response                       to the network engineer of what might be happening
status codes. The following table outlines some of the                   within the application, they can also be valuable to the
more common HTTP status codes and what they mean                         web application developer for resolving potential issues.
to the network engineer.                                                 But how do you isolate potential error codes?

                                                                         In this example, a user complains that a web application
Status Code    Description    Code Meaning
                                                                         is running slow, but it’s not enough to understand that
100            Continue       This could be indicative of a couple of
                              things. Too many redirections could        the server took too long to fulfill a user request. The
                              show some inefficiency internal to the
                                                                         engineer needs to drill down to isolate the exact server
                              web app design. It may also show some
                              form of load balancing was being used.     error and cause of the problem.
200            OK             Standard response for successful HTTP
                              request. This is what engineers want       They begin by looking at a snapshot of HTTP Requests
                              to see in web communications.
                                                                         and Responses, which shows the type of requests
3xx            Redirection    This could be indicative of a couple of
                              things. Too many redirections could        that occurred during the timeframe represented in the
                              show some inefficiency internal to
                              the web app design. It may also show       horizontal graph. This is a first step in understanding
                              some form of load balancing was            what type of request and what response times occurred
                              being used.
                                                                         for each request.
401            Unauthorized   Authentication either failed or was
                              not provided.
403            Forbidden      Client issue of application making an
                              illegal request. Server is refusing to
                              respond.
404            Not Found      Requested resource was not found.
                              Subsequent requests from client
                              permissible.
500            Internal       Generic error for when server failed to
               Server Error   fulfill a request.
502            Bad Gateway Server was acting as a gateway or
                           proxy, and received invalid response
                           from upstream server.
503            Service        Server currently unavailable; either       In the next graph, different HTTP status code responses
               Unavailable    overloaded or temporarily down. If
                                                                         occurring during this same time period are listed.
                              server is under high memory pressure,
                              it will temporarily refuse new requests.   Looking at the status codes, notice that some of these
                              If this error code persists, server may
                              need additional memory or memory           are errors. Most notable is the “HTTP 500 = Internal
                              configuration settings may need to         Server Error” for 10.0.38.178. This type of 500 range
                              be changed.
                                                                         error indicates the server is having trouble processing
                                                                         the request.
HTTP status codes show what is
occurring within the app, and are
valuable for app developers to
resolve issues.

                                                                                                            Error responsible for
                                                                                                             server slowdown

2 Web Application Troubleshooting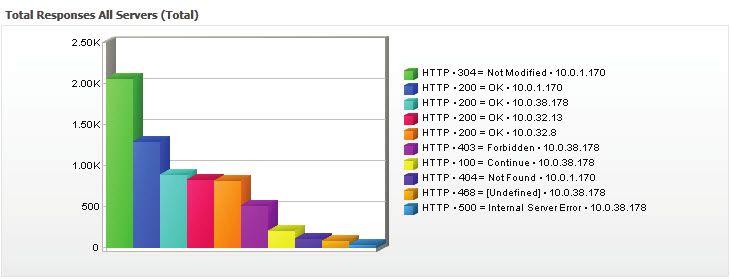
Long-term packet capture and
logical workflows are key to quickly
navigating to application errors.
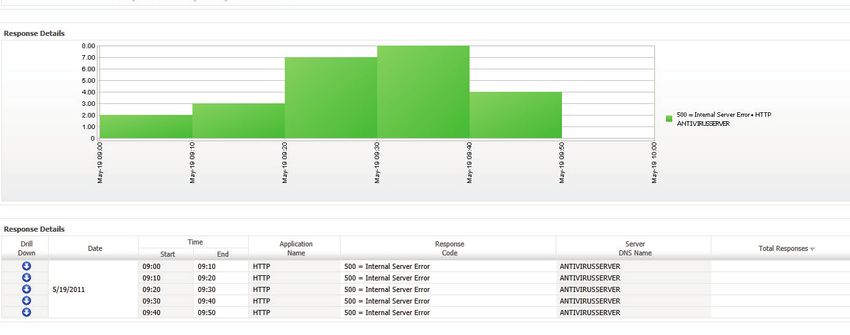
Investigating further, this is where it’s important to
have both trending and long-term packet capture
technologies in place to see how prevalent the problem
is and isolate the exact cause. With trending activated,
Drill down to the cause of
the engineer can see when and how often server errors the error
occurred. The trouble ticket indicates the user complaint
was between 9:00 am and 9:40 am. The report showed In this situation, the error was caused by a Failed Session
the frequency of errors, and identified the problem Token. There is a host of other information that will help
server for this time period. the web application designers resolve the issue and
eliminate this particular problem from reoccurring.
Periods with greatest number
of errors
With a comprehensive understanding of HTTP status
codes and a logical troubleshooting workflow, network
managers are able to resolve web application errors
quickly and provide actionable information to web
developers to effectively solve the problem.
From within this report, you can drill down and mine
the packets associated with this server and condition
and analyze them for the specific issue. In this case, the
process is automated using the Observer® Platform.
With the reporting capabilities available as a part of the
Apex™ dashboards, simply drill down to GigaStor™ and
mine the packets associated with the problem.
Contact Us +1 844 GO VIAVI © 2021 VIAVI Solutions Inc.
(+1 844 468 4284) Product specifications and descriptions in this
document are subject to change without notice.
To reach the VIAVI office nearest you, webapplicationprimer-wp-ec-ae
visit viavisolutions.com/contact 30176224 901 0914
viavisolutions.com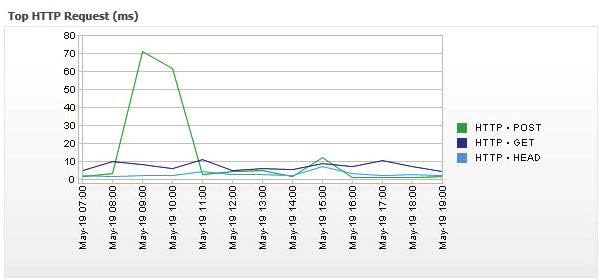
You can also read