Aerosol effects on electrification and lightning discharges in a multicell thunderstorm simulated by the WRF-ELEC model
←
→
Page content transcription
If your browser does not render page correctly, please read the page content below

Atmos. Chem. Phys., 21, 14141–14158, 2021
https://doi.org/10.5194/acp-21-14141-2021
© Author(s) 2021. This work is distributed under
the Creative Commons Attribution 4.0 License.

Aerosol effects on electrification and lightning discharges in a
multicell thunderstorm simulated by the WRF-ELEC model
Mengyu Sun1,6 , Dongxia Liu1 , Xiushu Qie1,6 , Edward R. Mansell2 , Yoav Yair3 , Alexandre O. Fierro2,4,5 ,
Shanfeng Yuan1 , Zhixiong Chen1,6 , and Dongfang Wang1
1 Key Laboratory of Middle Atmosphere and Global Environment Observation, Institute of Atmospheric Physics,
Chinese Academy of Sciences, Beijing, China
2 NOAA National Severe Storms Laboratory, Norman, Oklahoma, USA
3 School of Sustainability, Interdisciplinary Center (IDC) Herzliya, Herzliya, Israel
4 Cooperative Institute for Mesoscale Meteorological Studies, University of Oklahoma, Norman, Oklahoma, USA
5 Department of Forecasting Models, Zentralanstalt für Meteorologie und Geodynamik (ZAMG), Vienna, Austria
6 College of Earth and Planetary Sciences, University of the Chinese Academy of Sciences, Beijing, China

Correspondence: Xiushu Qie (qiex@mail.iap.ac.cn) and Dongxia Liu (liudx@mail.iap.ac.cn)

Received: 18 December 2020 – Discussion started: 18 January 2021
Revised: 2 August 2021 – Accepted: 7 August 2021 – Published: 24 September 2021

Abstract. To investigate the effects of aerosols on light-       1   Introduction
ning activity, the Weather Research and Forecasting (WRF)
Model with a two-moment bulk microphysical scheme and            Lightning activity is related to two important factors:
bulk lightning model was employed to simulate a multicell        dynamic–thermodynamic and microphysical characteristics
thunderstorm that occurred in the metropolitan Beijing area.     (e.g., Williams et al., 2005; Rosenfeld et al., 2008; Guo et
The results suggest that under polluted conditions lightning     al., 2016; Wang et al., 2018; Zhao et al., 2020). Since the
activity is significantly enhanced during the developing and     dynamic–thermodynamic processes affect the development
mature stages. Electrification and lightning discharges within   of thunderstorm significantly, lightning activity is influenced
the thunderstorm show characteristics distinguished by dif-      by various dynamic–thermodynamic variables: temperature
ferent aerosol conditions through microphysical processes.       (Price, 1993), relative humidity in the lower and middle
Elevated aerosol loading increases the cloud droplets num-       troposphere (Xiong et al., 2006; Fan et al., 2007), convec-
bers, the latent heat release, updraft and ice-phase particle    tive available potential energy (Qie et al., 2004; Stolz et al.,
number concentrations. More charges in the upper level are       2015), and many others.
carried by ice particles and enhance the electrification pro-       The impacts of aerosols on the development of thunder-
cess. A larger mean-mass radius of graupel particles further     storms especially in metropolitan areas have been researched
increases non-inductive charging due to more effective col-      extensively. Observational studies have indicated that the en-
lisions. In the continental case where aerosol concentrations    hancement of lightning activity is related to increased cloud
are low, less latent heat is released in the upper parts and,    condensation nuclei (CCN) concentration (e.g., Westcott,
as a consequence, the updraft speed is weaker, leading to        1995; Orville et al., 2001; Kar et al., 2009; Wang et al., 2011;
smaller concentrations of ice particles, lower charging rates    Chaudhuri and Middey, 2013; Thornton et al., 2017; Yair,
and fewer lightning discharges.                                  2018; Qie et al., 2021). Kar et al. (2009) found a positive
                                                                 correlation between PM10 and SO2 concentration and light-
                                                                 ning flash densities around major cities in South Korea. A
                                                                 positive relationship between levels of particle pollution and
                                                                 lightning flash counts was also indicated by Chaudhuri and
                                                                 Middey (2013).

Published by Copernicus Publications on behalf of the European Geosciences Union.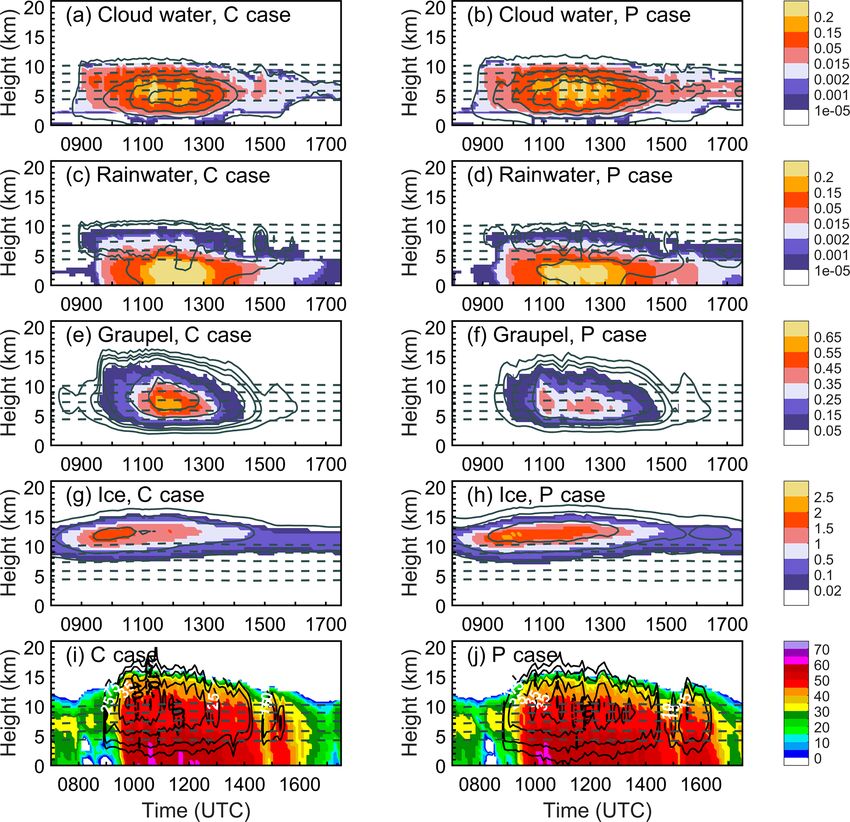
14142                                                M. Sun et al.: Aerosol effects on electrification and lightning discharges

   Furthermore, a variety of numerical simulations (e.g.,
Mitzeva et al., 2006) have demonstrated the effects of aerosol
on enhancing lightning activity. Using the Weather Research
and Forecasting (WRF) Model with explicit spectral bin mi-
crophysics, Khain et al. (2010) found elevated aerosols in-
creased the number of cloud droplets and the release of la-
tent heat by acting as CCN. Therefore, more liquid water
was lifted to the mixed-phase region by strong updrafts,
with more ice-phase particles produced which can affect
charge separation and lightning formation (Takahashi, 1978;
Saunders and Peck, 1998; Takahashi, 1983; Mansell et al.,
2005; Yair, 2008; Yair et al., 2010, 2021). Mansell and
Ziegler (2013) suggested that greater CCN concentration
led to greater lightning activity up to a point by testing a
wide range of CCN concentrations in a 3D model with two-
moment bulk microphysics and stochastically branched dis-          Figure 1. Spatial distributions of BLNET stations (red triangles),
charge parameterization (Mansell et al., 2002). They also          and ground-based automatic weather stations (black dots) in the
                                                                   Beijing region.
noted that average graupel density stayed high at lower CCN
but dropped at higher CCN because smaller droplets caused
lower rime density. Zhao et al. (2015) showed that enhancing
aerosol concentration resulted in an enhancement of electri-       Sect. 3 introduces the design of simulations, Sect. 4 presents
fication processes due to the increasing growth rate of snow       the results, and Sect. 5 discusses and summarizes the study.
and graupel particles. However, Tan et al. (2017) simulated
a thunderstorm in the city of Changchun with a 3D cumulus
model coupled with an aerosol module, electrification and          2     Data sources
lightning discharge, showing that the ice crystal and graupel
number increased while the graupel mixing ratio decreased          2.1    Observational dataset
as the aerosol concentration increased.
   The microphysical processes under different CCN con-            Total flash numbers were obtained from the Beijing Light-
centrations, especially the initiation and growth of ice-phase     ning Network (BLNET), which consists of 16 stations which
particles, varied in different simulation studies. There are       have covered areas extending 110 km east–west and 120 km
few studies that have discussed the aerosol effects on thun-       north–south since 2015 (refer to Fig. 1). The BLNET pro-
derstorm with explicit electrification and discharge parame-       vides 3D location results of flashes, including both intra-
terization in the model simultaneously (e.g., Mitzeva et al.,      cloud (IC) and cloud-to-ground (CG) lightning (Wang et
2006; Mansell and Ziegler, 2013; Zhao et al., 2015). The           al., 2016). The average detection efficiency of the BLNET
detailed effects of aerosols on the discharging need further       is 93.2 % for the total flashes (Srivastava et al., 2017). In
study.                                                             this study, the 3D location lightning radiation pulses were
   By analyzing lightning data from the Beijing Lightning          grouped into flashes based on the criteria of 400 ms and
Network (BLNET) and PM2.5 (particulate matter with aero-           15 km. These grouping criteria were modified from the al-
dynamic diameter less than or equal to 2.5 µm) data, Sun et        gorithm in Srivastava et al. (2017). In Sect. 3, the lightning
al. (2020) found a positive relationship between flash counts      frequency from BLNET was calculated in 6 min intervals,
and PM2.5 concentration prior to the occurrence of a thunder-      corresponding to the time span of Doppler radar scanning.
storm. As a megacity, Beijing has higher aerosol concentra-        In addition, the radar reflectivity data were obtained from
tion resulting from anthropogenic air pollution. Still, the ef-    an S-band Doppler radar (Chinese CINRAD-SA) near the
fects of aerosols on both electrification and discharges have      Beijing urban area (39.81◦ N, 116.47◦ E) and were updated
been rarely discussed in this area using numerical simula-         every 6 min. The vertical levels vary from 500 m to 20 km
tion. Therefore, in this paper we present sensitivity studies on   and were processed into composite radar reflectivity with a
how the different CCN concentrations influence the charac-         horizontal resolution (0.01◦ × 0.01◦ ). The precipitation data
teristics of thunderclouds over the metropolitan Beijing area      were taken from 295 gauge stations in a weather monitoring
using WRF-ELEC (Fierro et al., 2013). We conducted sen-            network of automatic weather stations in the Beijing region
sitivity studies to evaluate the response of the microphysical     (refer to Fig. 1), with spacing of approximately 3 km in the
properties, as well as electrification and lightning processes,    urban area. The real-time hourly average ground levels of
to aerosol characteristics. This paper is organized as follows:    PM2.5 are from the China National Environmental Monitor-
Sect. 2 describes the data and methodology used in the study,      ing Center (http://106.37.208.233:20035/, last access: 16 Au-
                                                                   gust 2021).

Atmos. Chem. Phys., 21, 14141–14158, 2021                                           https://doi.org/10.5194/acp-21-14141-2021
M. Sun et al.: Aerosol effects on electrification and lightning discharges                                                    14143

                                                                      2.3   Model overview

                                                                      The WRF Model (version 3.9.1) coupled with a bulk light-
                                                                      ning model (BLM; Fierro et al., 2013) and a two-moment
                                                                      bulk microphysics scheme (Mansell et al., 2010; Mansell
                                                                      and Ziegler, 2013) was used to simulate the multicell thun-
                                                                      derstorm that occurred on 11 August 2017 in the Beijing
                                                                      metropolitan area.
                                                                         The simulations employ the two-moment bulk micro-
                                                                      physics scheme of Mansell et al. (2010), which predicts
                                                                      both the mass mixing ratio and number concentration for
                                                                      a range of hydrometeor species (droplets, rain, ice crys-
                                                                      tals, snow, graupel and hail). Microphysical processes in-
                                                                      clude cloud droplet nucleation, condensation, collection–
                                                                      coalescence, riming, ice multiplication, freezing and melt-
                                                                      ing, and conversion between different hydrometeors. It is
                                                                      noted that the predicted graupel density is variable (300–
                                                                      900 kg m−3 ), which makes it possible for the single graupel
                                                                      category to represent a range of particles from high-density
                                                                      frozen drops (or small hail) to low-density graupel (Mansell
Figure 2. Sounding profiles for Beijing at 00:00 UTC on 11 Au-        et al., 2010). The graupel growth processes include the col-
gust 2017. The solid black and blue lines represent the temperature   lection of ice crystals by graupel, collection of snow parti-
and dew point, respectively.                                          cles by graupel, deposition of vapor to graupel, collection of
                                                                      supercooled water (cloud droplets and/or raindrops) by grau-
                                                                      pel and conversions between hydrometeors. Further details of
2.2   Synoptic background
                                                                      the interactions among particles can be found in Mansell and
A mesoscale convective system over the Beijing area influ-            Ziegler (2013), Mansell et al. (2010), and Ziegler (1985). The
enced by a strong Mongolia cold vortex on 11 August 2017              CCN concentration is predicted as a bulk activation spec-
was simulated in this study. Based on the weather map at              trum and initially mixed well vertically, following Eq. (1) of
00:00 UTC (figure not shown), there was a prevailing west-            Mansell et al. (2010):
ward airflow in the south of the cold vortex, which brought
dry cold air in the middle layer. At a low level of 850 hPa,          NCCN = CCN × S k ,                                         (1)
the southwesterly jet transported a warm and humid air mass,
forming an unstable condition together with the cold air mass         where CCN is the assumed CCN concentration, S is the su-
above. The sounding profile over Beijing (39.9◦ N, 116.2◦ E)          persaturation with respect to liquid water and k = 0.6. The
exhibited an unstable thermodynamic condition for thunder-            initiation of cloud droplets (for both cloud base and in-cloud)
storm initialization, as shown in Fig. 2, with surface-based          is based on Twomey (1959) and adjusted by Mansell et
convective available potential energy (CAPE) of 3937 J kg−1           al. (2010).
at 00:00 UTC. The special terrain condition with mountains               Explicit charging physics includes both non-inductive
in the northwest and ocean in the southeast (Qie et al., 2020),       charging (Saunders and Peck, 1998) and inductive or po-
as well as the heat island effect and elevated aerosol load-          larization charging (Ziegler et al., 1991). We employed the
ing in the urban region (Zhang et al., 2013; Liu et al., 2018),       non-inductive electrification scheme described by Saunders
likely enhanced the convection and was responsible for the            and Peck (1998) and adjusted by Mansell et al. (2005) in
occurrence of heavy rainfall and large hail as well as inten-         this study. The magnitude of charge separated within a grid
sive lightning activity in the Beijing area. According to the         cell (δq) is calculated from the non-inductive critical charg-
surface-based automatic weather observation network in Bei-           ing curve as a function of temperature and the riming accre-
jing, the average rainfall in the urban area and the eastern          tion rate (RAR), following Eq. (2) of Mansell et al. (2005):
region was 10–30 mm, locally exceeding 100 mm. The total                                b
                                                                             a
lightning flashes of this case accounted for one-third of the         δq = BDn,I Vg − VI q± (RAR) ,                              (2)
total number of lightning flashes during the 2017 warm sea-
                                                                                                                         a is the
                                                                      where B, a and b are a function of crystal size; Dn,I
son (Chen et al., 2020).
                                                                      mean volume diameter of the ice crystal or snow category;
                                                                      Vg and VI are the mass-weighted mean terminal fall speeds
                                                                      for graupel and ice crystal; and q± (RAR) is the charge sep-
                                                                      aration as a function of the RAR from Brooks et al. (1997)

https://doi.org/10.5194/acp-21-14141-2021                                           Atmos. Chem. Phys., 21, 14141–14158, 2021
14144                                                 M. Sun et al.: Aerosol effects on electrification and lightning discharges

adjusted by Mansell et al. (2005). Non-inductive (i.e., inde-        Table 1. Settings for the nested simulations.
pendent of external electric fields) charge separation result-
ing from rebounding collisions between various ice-phase              Model option            Outer D01              Inner D02
particles (ice, graupel, snow, hail) is parameterized based           Domain coverage         6 km, 442 × 391        2 km, 496 × 496
on results obtained from laboratory experiments (Takahashi,           Vertical levels         40                     40
1978; Saunders et al., 2001; Mansell et al., 2005). Induc-            Time step               30 s                   10 s
tive charging requires a pre-existing electric field to induce        Microphysics scheme     NSSL two-moment        NSSL two-moment
charge on the surfaces of the colliding particles (Mansell et         Longwave radiation      RRTM                   RRTM
                                                                      Shortwave radiation     Dudhia                 Dudhia
al., 2005). Numerical experiments (Mansell et al., 2010) have
                                                                      Boundary layer          BouLac PBL             BouLac PBL
found that total inductive charging is about an order of mag-         Land surface            Unified Noah LSM       Unified Noah LSM
nitude weaker than non-inductive charging but can be impor-
tant for lower-charge regions. Only collisions between cloud
droplets and ice-phase particles (graupel, ice, hail) are con-
                                                                     represents the sum of flashes B (t) that extend into the grid
sidered for inductive electrification. The electric field is sim-
                                                                     column for all the time steps within the time period T . Fur-
ulated by solving the Poisson equation for the electric poten-
                                                                     ther, flash extent density (FED) is given by Eq. (6). Thus, the
tial 8:
                                                                     predicted flash extent density over the Beijing area in Sect. 3
            ρtot                                                     is the FED calculated in 6 min intervals:
∇ 28 = −         ,                                             (3)
             ε                                                                    X
                                                                     FED(T ) =        FOD(T ).                                   (6)
where ρtot is the net space charge and ε is the elec-
tric permittivity of air (8.8592 × 10⁻¹² F m−1 ). A message-         2.4   Design of the simulations
passing-interface (MPI) black box multigrid iterative solver
or BoxMG algorithm (Dendy, 1987) is extended to solved               The nested model configuration for the simulations is shown
Eq. (3). And then the three components of the electric field         in Table 1. The WRF-ELEC model is configured by a two-
and its magnitude are computed from Eq. (4):                         way interactive nested domain. The outer domain (D01) has
                                                                     horizontal grid spacing of 6 km (442 × 391 grid points), and
E = −∇8.                                                      (4)
                                                                     the inner domain (D02) is 2 km (496 × 496 grid points), both
The discharge model parameterization from Ziegler and                centering at 40◦ N, 116.05◦ E. The number of vertical lev-
MacGorman (1994) assumes a cylindrical region (Fierro et             els is 40, and the top is set to 50 hPa for the two domains.
al., 2013). A flash is initiated when the electric field ex-         The model physics configuration is the Unified Noah Land
ceeds a breakdown threshold, which is a variant of the ver-          Surface Model (LSM; Chen and Dudhia, 2001). The long-
tical electric profile of Dwyer (2003) at a model grid point         wave and shortwave radiation are parameterized following
(from here on, we shall use the term “grid points” for short).       the Rapid Radiation Transfer Model (RRTM; Mlawer et al.,
A discharge is centered at the initiation grid points within a       1997) and the Dudhia scheme (Dudhia, 1989), respectively.
cylinder that extends vertically through the depth of the do-        The Bougeault–Lacarrere planetary boundary layer (BouLac
main. If the space charge magnitude at a grid point exceeds a        PBL) scheme is used to parameterize the boundary layer
specific space charge threshold (0.1 nC m−3 herein), this grid       processes (Bougeault and Lacarrere, 1989). Simulations be-
point will be involved in discharge within the cylinder dur-         gan at 00:00 UTC on 11 August 2017 and were integrated
ing this time step. After each discharge, the charge magni-          for 24 h. The period of interest was from 09:00 UTC until
tude is set to 70 % (Rawlins, 1982; Ziegler and MacGorman,           17:00 UTC (time in the simulations). The 3-hourly National
1994) of the summed magnitude for all grid points. Then the          Centers for Environmental Prediction (NCEP) Global Fore-
charges will be redistributed throughout all discharge vol-          cast System (GFS) data with a 0.5◦ × 0.5◦ resolution are used
umes and the electric field is recalculated. The discharge in        to establish the initial and boundary conditions.
each time step will be terminated until the maximum elec-               To survey the aerosol effects on the structure of thun-
tric field no longer exceeds the breakdown threshold. An es-         derstorm and lightning activity, two sensitivity experiments
timate of the flash origin density (FOD) rate (over a time           are performed with different CCN concentrations: a pol-
period T = t2 − t1 ) is computed following Eq. (5):                  luted case (P case) and a continental case (C case). Figure 3
                                                                     shows hourly average mass concentration of PM2.5 on 11 Au-
               Zt2                                                   gust 2017. The hourly average value of the observed PM2.5
          G
FOD(T ) =            B (t) dt,                                (5)    concentration before the thunderstorm initiation (more than
          C                                                          110 µg m−3 ) is much higher than the 3-year mean PM2.5 con-
               t1
                                                                     centration (69.4 ± 54.8 µg m−3 ) in the Beijing area (Liu et
where G is the horizontal grid cell area and C the cylinder          al., 2018). Therefore, the CCN concentration is selected as
cross-sectional area (set in the following simulations to ra-        the P case which is consistent with observation. The initial
dius R = 12 km; Fierro et al., 2013). In this study, the integral    value for the P case is set as a number mixing ratio rela-

Atmos. Chem. Phys., 21, 14141–14158, 2021                                             https://doi.org/10.5194/acp-21-14141-2021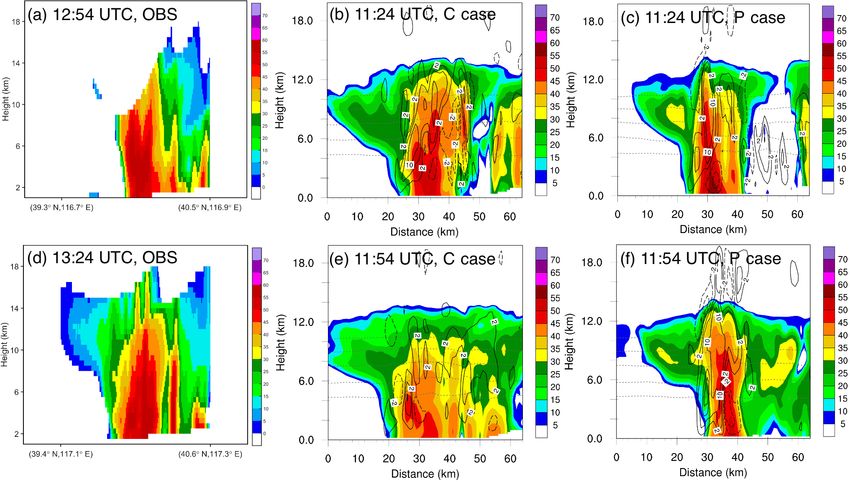
M. Sun et al.: Aerosol effects on electrification and lightning discharges                                                14145

                                                                  in the polluted case. Note that the modeled reflectivity dif-
                                                                  fers from the observation in the northwestern area (115.4–
                                                                  116.0◦ E; Fig. 4a, c and e); the impacts of aerosol on light-
                                                                  ning activity will only be evaluated in the southeastern Bei-
                                                                  jing area (39.4–40.6◦ N, 116.0–117.5◦ E, shown in Fig. 4d;
                                                                  hereafter “domain” for short).
                                                                     Precipitation measurements from around 300 gauge sta-
                                                                  tions in the Beijing area are compared with the WRF simu-
                                                                  lations. Figure 6 shows the hourly peak rainfall rate from the
                                                                  rain gauges and from simulations for the P case and C case.
                                                                  As noted, the formation of the thunderstorm in the simula-
                                                                  tions occurred about 1.5 h earlier than in the observation. So
                                                                  we display the simulations and observation with a 1 h time
                                                                  shift. It can be seen that the peak rainfall rate reaches the
Figure 3. Hourly mass concentration of PM2.5 on 11 August 2017
                                                                  maximum at the same stage of development in both simula-
in the Beijing urban area.                                        tions (at 12:00 UTC) and the measurement (at 13:00 UTC).
                                                                  The rainfall in the P case continues for around 9 h, which
                                                                  is consistent with the gauge measurement, while the rain-
tive to sea level air density ρ0 : 2000/ρ0 × 10−6 kg−1 , where    fall in the C case lasts 1 h less than the observation. The
ρ0 = 1.225 kg m−3 , and the local number concentration is         maximum peak rainfall rate in the P case is 97.3 mm h−1 ,
2000 × (ρair /ρ0 ) cm−3 . And the initial number concentration    which is larger than the measurement (and the C case) with
for the C case is set at 1200 × (ρair /ρ0 ) cm−3 , consistent     a value of 80 mm h−1 (77.3 mm h−1 ). The difference in the
with typical continental conditions (e.g., Hobbs and Rangno,      rainfall rate is further analyzed through a comparison of
1985; Mansell et al., 2005). The relatively high prescribed       the spatial distribution of precipitation. Figure 7 displays
CCN concentration guaranteed small droplet diameters and          the 6-hourly accumulated precipitation from the observa-
should effectively delay the warm-rain process in the model       tion (11:00–17:00 UTC) and from the simulations for the P
(Mansell and Ziegler, 2013).                                      and C cases (10:00–16:00 UTC). Both the simulations repro-
                                                                  duce the precipitation in the southeastern region, where the
                                                                  gauge measurements show the accumulated rainfall exceed
3     Results                                                     100 mm. The coverage of the simulated precipitation in the
                                                                  P case extends to the northeast area compared to the C case
3.1    Radar reflectivity, precipitation and lightning            (Fig. 7c), which is more consistent with the observation. This
       flashes of multicell                                       area is included in our analyzed region shown in Fig. 4d.
                                                                     The temporal variation in total flashes from BLNET is
Figure 4 shows the observed and simulated radar reflectiv-        shown in Fig. 8a, including both intra-cloud (IC) and cloud-
ity in different periods for both cases, with the formation of    to-ground (CG) lightning. The lightning frequency gradually
thunderstorms in the simulation earlier than the observation      increased during 11:00–12:00 UTC and rose significantly af-
by about 1.5 h. Data assimilation was not applied in the cur-     ter 12:00 UTC, reached its peak value at 12:30 UTC, and then
rent study, although assimilation of observational data can       decreased gradually. According to the evolution of radar re-
effectively improve high-impact weather forecasting (Sun et       flectivity and lightning activity (Van Den Broeke et al., 2008;
al., 2014; Lynn et al., 2015; Gustafsson et al., 2018). And the   Kumjian et al., 2010; Liu et al., 2021), the real and simulated
spin-up of the background aerosols is relatively short (Lynn      developments of the thunderstorm are shown in Table 2. The
et al., 2020). These reasons probably lead to the earlier oc-     temporal evolution of predicted FED over the Beijing area
currence of the simulated thunderstorm. So we display the         under the polluted and continental cases are shown in Fig. 8b;
simulation and observation with a ∼ 90 min time difference.       both of them start earlier than the observation by about 1.5 h.
It is clear that both simulated times in the P case exhibit       Compared to the continental case, the variation in predicted
an overall good agreement with the evolution and morphol-         flashes under polluted conditions is more consistent with the
ogy of the radar echo, especially evidenced by the northeast–     observation. The predicted FED for the P case and measured
southwest orientation of the radar echo at 11:54 UTC in the       flashes increase significantly after 10:00 UTC (11:30 UTC
simulated polluted case (13:24 UTC in the observation). We        in the observation) and reach a peak at around 11:00 UTC
also present the comparison of radar reflectivity as a function   (12:30 UTC in the observation). In contrast, the predicted
of height from the observation and simulations in the cor-        flashes for the C case reach a peak at around 10:30 UTC,
responding periods (Fig. 5). According to the intensity and       earlier than the P case and measured lightning flashes, and
top height of the radar echo, the observed radar reflectivity     then decrease dramatically. Within the duration of the thun-
is in better agreement with simulated radar reflectivity only     derstorm, the overall FED in the polluted case is noticeably

https://doi.org/10.5194/acp-21-14141-2021                                       Atmos. Chem. Phys., 21, 14141–14158, 2021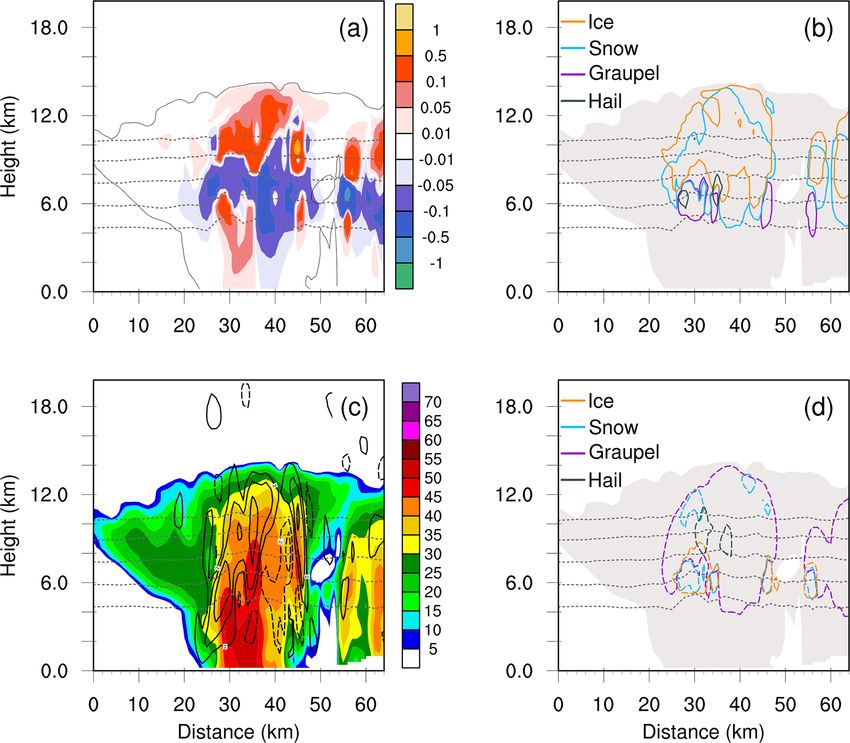
14146                                                  M. Sun et al.: Aerosol effects on electrification and lightning discharges

Figure 4. Radar reflectivity (unit dBZ) between observation and simulation for the C and P cases; the simulation was earlier than the
observation by about 1.5 h. (a–b) Observation at 12:54 and 13:24 UTC. (c–d) Simulation for the C case at 11:24 and 11:54 UTC. (e–
f) Simulation for the P case at 11:24 and 11:54 UTC. The red rectangle in (d) denotes the region where the simulated results are analyzed in
this study. BJ is Beijing.

about 50 % higher than in the C case. The enhanced lightning            velopments of the thunderstorm were well simulated, here
activity simulated in the P case is in good agreement with              we try to analyze the differences in the lightning activity for
the observation. Simulations under the polluted case do not             both cases.
outperform the C case in comparison to the observations in                 Figure 9 displays the number of initiations over the Bei-
some aspects. For example, the maximum peak rainfall rate               jing area for the C case and P case during different periods.
is larger than the measurement (and the C case, Fig. 6). The            To examine the details of the lightning response to aerosols,
intensity of radar reflectivity and precipitation are strength-         the intensity of lightning activity can be categorized into
ened under polluted conditions. Previous numerical simula-              four levels by the lightning grid points in each time step:
tions also suggested that greater aerosol concentrations lead           light (50–100 grid points), moderate (100–200 grid points),
to enhanced convection up to a point (e.g., Wang et al., 2011;          heavy (200–300 grid points) and extreme (> 300 grid points).
Mansell et al., 2013; Lynn et al., 2020). Given that the de-            Then the number of points (grid columns) in each category

Atmos. Chem. Phys., 21, 14141–14158, 2021                                                 https://doi.org/10.5194/acp-21-14141-2021
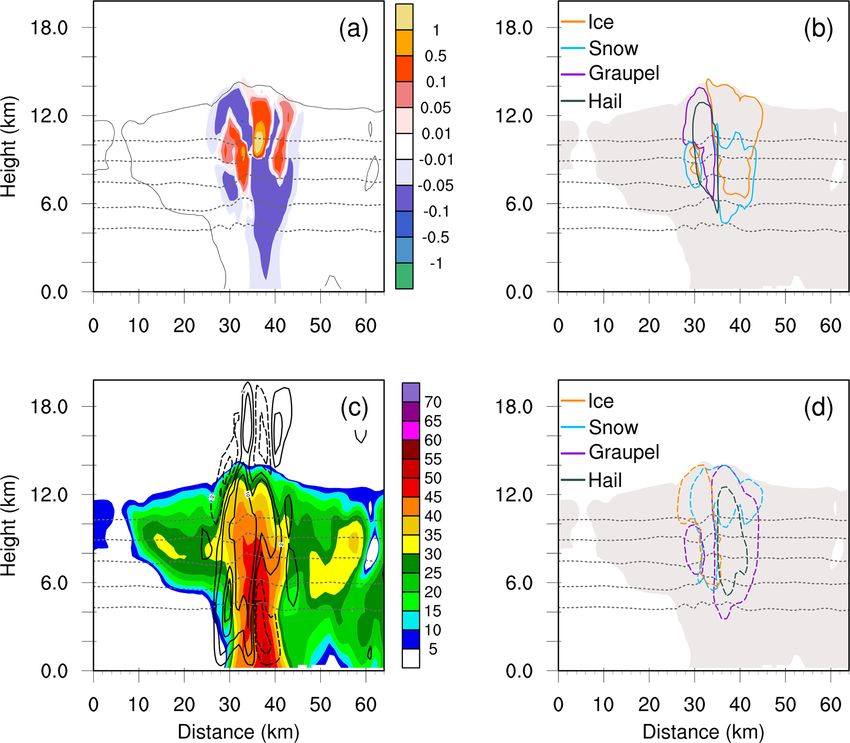
M. Sun et al.: Aerosol effects on electrification and lightning discharges                                                         14147

Figure 5. Comparison between observation and simulations of vertical cross section of radar reflectivity (unit dBZ) along the black line
shown in Fig. 4a–f. (a) Observation (black line shown in Fig. 4a). (b) C case (black line in Fig. 4c). (c) P case (black line in Fig. 4e).
(d) Observation (black line shown in Fig. 4b). (e) C case (black line in Fig. 4d). (f) P case (black line in Fig. 4f).

                                                                       Table 2. Temporal evolution of the thunderstorm.

                                                                                             Observation            Simulations
                                                                                                  (UTC)          C case           P case
                                                                         Formation                 10:48          09:18          09:18
                                                                         Beginning stage     10:48–11:30    09:18–09:30    09:18–10:00
                                                                         Developing stage    11:30–12:30    09:30–10:30    10:00–11:00
                                                                         Mature stage        12:30–13:30    10:30–12:00    11:00–12:36
                                                                         Dissipating stage   13:30–18:06    12:00–15:36    12:36–16:36

Figure 6. Temporal evolution of the peak rainfall rate for obser-      in the P and C case (Fig. 9d), but the lightning intensity under
vation and simulations. The dashed black line represents the ob-       polluted conditions is still stronger compared to the C case.
servation; the red line corresponds to the P case, and the blue line   Hence, the results indicate that elevated aerosol loading en-
corresponds to the C case. The x axis above is for the observation;    hances lightning activities especially in the developing and
the x axis below is for the simulations.                               mature stages of thunderstorms. In the following we will of-
                                                                       fer a possible explanation for this effect.

is counted hourly as the “number of initiations”. A com-               3.2   Microphysical properties of multicell
parison of the different lightning intensity categories reveals
that the simulated lightning activities increase during 10:30–         To investigate the effects of aerosols on lightning activities,
12:30 UTC (Fig. 9b and c) under high aerosol loading, corre-           we first analyze the simulated microphysical properties in
sponding to the developing and mature stages of the thunder-           both the continental and polluted sensitivity studies. Fig-
storm. During 09:30–10:30 UTC, while different categories              ure 10a–h show the temporal variations in the vertical pro-
of lightning intensity are enhanced for both the P case and            files for different hydrometeors. For each quantity, the mass
the C case (Fig. 9a), it is noted that the maximum lightning           mixing ratio and number concentration of hydrometeors are
initiation occurs at the extreme level for the P case. In the          averaged horizontally over the analyzed region at a given
dissipating stage, lightning activities decrease dramatically          altitude. The domain-averaged microphysical properties for

https://doi.org/10.5194/acp-21-14141-2021                                             Atmos. Chem. Phys., 21, 14141–14158, 2021
14148                                                     M. Sun et al.: Aerosol effects on electrification and lightning discharges

Figure 7. Comparison of accumulated precipitation (units: mm) between observation (11:00–17:00 UTC) and simulations (10:00–
16:00 UTC). (a) Observation. (b) P case and (d) C case. And (c) difference in accumulated precipitation (units: mm) between the P and
C cases. BJ is Beijing.

Table 3. Domain-averaged properties of hydrometeors.                      Table 4. Comparison of convective properties.

                              Number           Mean-mass                                                     C case           P case
                           concentration        radius
                                                                                   Time                  10:36 UTC        10:48 UTC
                            (103 kg−1 )          (µm)
                                                                                   Height                   10.5 km          12.5 km
                          C case   P case    C case      P case                    Maximum velocity      50.4 m s−1       53.5 m s−1
                                                                                   Cloud top height           15 km            15 km
     Cloud droplets         3930     7910      6.5          6.1
                                                                                   Cloud base height         0.5 km           0.5 km
     Raindrops             0.069    0.031    154.1        179.9
     Ice crystals           2280     3850   3235.8       2994.9
     Graupel               0.028    0.012    322.4        479.5
                                                                             It can be seen that elevated aerosol loading results in in-
                                                                          creasing cloud droplet concentrations (Fig. 10b and Table 3).
the various hydrometeors are summarized in Table 3. The                   Under polluted conditions, more aerosols could be activated
domain-averaged mean-mass radiush of hydrometeors in Ta-                  into cloud droplets and more water vapor condenses onto
ble 3 is calculated following Eq. (7):                                    these droplets, leading to large cloud water content and a
                                                        1/3             small droplet size (Lynn et al., 2007; Wang et al., 2011; Zhao
                1   Sum(ρair (i, j, k) × qh (i, j, k))                    et al., 2015; Jiang et al., 2017). Thereby, relatively more la-
radiush =         ×                                             ,   (7)
                ch Sum(ρair (i, j, k) × nh (i, j, k))                     tent heat of condensation is released in the P case where large
                                                                          cloud water content exists, which can be seen in the vertical
where ρair is the air density and ch , qh and nh are the density,         distribution of peak latent heat (after 10:00 UTC, Fig. 12).
mass concentration, and number concentration of hydrome-                  The temporal variation in the domain-averaged mean-mass
teor species h (Mansell et al., 2010), respectively. Figure 10i–          radius for cloud droplets is shown in Fig. 11. Under pol-
j display the time–height plots of maximum radar reflectivity             luted conditions, cloud droplets with smaller mean-mass
and vertical velocities. The related convective properties are            radii are too small to be converted into raindrops. As a conse-
shown in Table 4.                                                         quence, the rainwater mass mixing ratio is less in the polluted

Atmos. Chem. Phys., 21, 14141–14158, 2021                                                 https://doi.org/10.5194/acp-21-14141-2021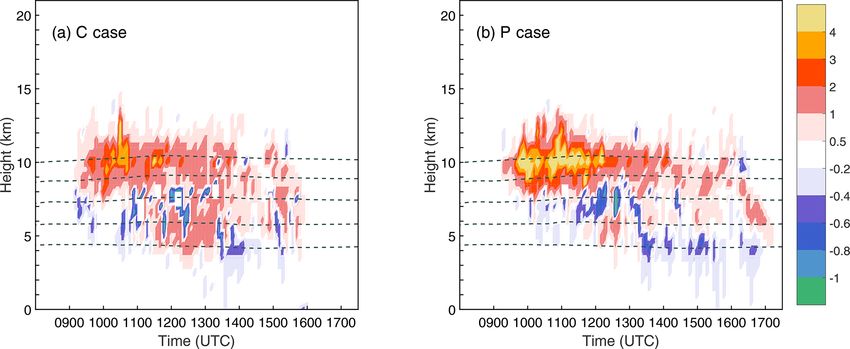
M. Sun et al.: Aerosol effects on electrification and lightning discharges                                                      14149

                                                                       imum of peak latent heat in the P case occurs above 10 km
                                                                       at 09:30 UTC (Fig. 12). As noted, the latent heat shown in
                                                                       Fig. 12 results from both condensation and freezing. At the
                                                                       beginning stage of the thunderstorm, the cloud and rainwa-
                                                                       ter contents in both simulations are close (Fig. 10), which
                                                                       could be seen from the similar vertical distribution of peak
                                                                       latent heat for the temperatures warmer than −30 ◦ C (before
                                                                       10:00 UTC, Fig. 12). The high value of latent heat that ex-
                                                                       isted in the higher levels (above 10 km) reveals a large release
                                                                       of frozen latent heat, indicating that more cloud droplets are
                                                                       lifted to the upper levels (< −40 ◦ C) and converted into ice
                                                                       crystals (e.g., homogeneous freezing). Previous studies have
                                                                       also found that elevated aerosol loading contributes to the in-
                                                                       crease in frozen latent heat (e.g., Khain et al., 2005; Lynn et
                                                                       al., 2007; Storer et al., 2010; Li et al., 2017). The increased
                                                                       frozen latent heat during this period, together with relatively
                                                                       enhanced condensation latent heat, further ensures vigorous
                                                                       vertical growth and leads to the maximum updraft occurring
                                                                       at 10:48 UTC in the P case.
                                                                          In contrast, the domain-averaged mass mixing ratio of
                                                                       graupel is less in the P case (Fig. 10e and f). Less graupel
Figure 8. Temporal variation in (a) observed total lightning fre-
quency and (b) simulated flash extent density (FED). In (a), orange    content under polluted conditions is rather surprising, since
represents IC lightning and blue represents CG lightning. The solid    previous simulation studies (Wang et al., 2011; Zhao et al.,
line represents the storm volume associated with radar reflectivity    2015) have found that there could be more graupel at the ma-
exceeding 30 dBZ. In (b), the red line represents the P case and the   ture stage of thunderstorms, by virtue of enhanced convec-
blue line represents the C case.                                       tion and more cloud droplets lifted to the mixed-phase re-
                                                                       gion. This could happen if starting from a much lower CCN
                                                                       concentration (< 400 cm−3 ); in this study, with higher CCN
case compared to in the continental one (Fig. 10d). Instead,           concentration (> 1000 cm−3 ), the reduced raindrop freezing
these cloud droplets could be transported to higher levels             (Fig. 10d) probably explains the lower density of graupel. As
(< −40 ◦ C) by the strong updrafts resulting from increased            mentioned before, the predicted graupel density is variable
latent heat. Previous studies have shown that larger vertical          (Mansell et al., 2010). When graupel collects supercooled
velocities are driven by increased microphysical latent heat-          water in wet growth mode, the supercooled water is assumed
ing (Wang et al., 2011; Mansell and Ziegler, 2013; Altaratz            to increase the graupel density if it is less than 900 kg m−3 .
et al., 2017; Fan et al., 2018; Li et al., 2019). As shown in Ta-      And the collected ice crystals are only allowed to add graupel
ble 4, the maximum updraft in the P case (53.5 m s−1 ) occurs          volume at the minimum density of graupel (300 kg m−3 ) in
above 12 km, while the height of maximum velocity for the              the simulations. This probably means that the reduced rain-
C case (50.4 m s−1 ) is 10.5 km. As a result, the mixed-phase          water content results in significant reduction in the graupel
processes are enhanced and there are more ice crystals in the          mass mixing ratio under polluted conditions. Other simula-
P case above 10 km (Fig. 10h), probably due to the homoge-             tions also found a decrease in the graupel mixing ratio under
neous freezing of more but smaller cloud droplets (Straka and          polluted conditions and partly attributed the decrease to the
Mansell, 2005; Mansell et al., 2010). Observations and sim-            melting of graupel particles (Tan et al., 2017). In this study,
ulations also found that the content of ice crystals could be          the graupel content is higher in the C case, probably owing to
greater under polluted conditions, resulting from more con-            higher rainwater content and corresponding raindrop freez-
densation latent heat and strengthened updrafts (Khain et al.,         ing. It is worth noting that the number concentration of grau-
2008; Koren et al., 2014; Wang et al., 2011; Zhao et al., 2015;        pel in the polluted case is rather less compared to the conti-
Tan et al., 2017; Lynn et al., 2020). The number concen-               nental one (Table 3), with 12 kg−1 for the P case and 28 kg−1
tration of ice crystals is much larger under polluted condi-           for the C case, respectively. Such a phenomenon could offer a
tions (Table 3), with a domain average of 3850 × 103 kg−1              partial explanation for the graupel of larger mean-mass radii
for the polluted case and 2280 × 103 kg−1 for the continental          appearing in the P case (Fig. 11c and Table 3). The domain-
case. The size of raindrops in the P case is larger, which is          averaged mean-mass radius of graupel reaches 479.5 µm for
also found in Wang et al. (2011), probably due to the melt-            the P case, compared to 322.4 µm for the C case. In contrast
ing of ice-phase particles. These differences between cloud,           to the small difference in the mean-mass radius of ice crys-
rain droplets and ice crystals are directly influenced by the          tals between the polluted and continental cases (Fig. 11d),
increasing aerosol loading. It is worth noting that the max-           the radius of graupel is much larger in the P case. This likely

https://doi.org/10.5194/acp-21-14141-2021                                            Atmos. Chem. Phys., 21, 14141–14158, 2021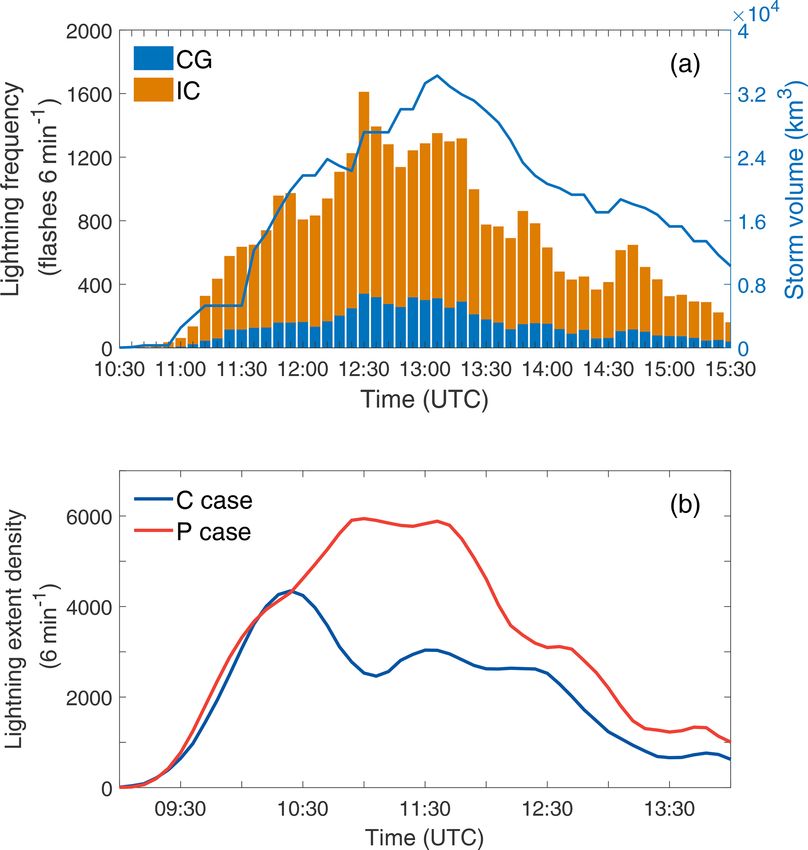
14150                                                   M. Sun et al.: Aerosol effects on electrification and lightning discharges

Figure 9. Number of initiations for different lightning intensity categories, i.e., light (50–100 grid points), moderate (100–200 grid points),
heavy (200–300 grid points) and extreme (> 300 grid points), at different times, simulated for the P and C cases.

results in a larger collision efficiency between graupel and              density for the P case is more than +4 nC m−3 during this
other ice-phase particles, enhancing non-inductive charging.              period, but the peak charge density is less than +2 nC m−3
Snow and hail are also involved in the electrification. By col-           in the C case. With the development of the thunderstorm, the
lecting droplets and ice-phase particles, the aggregation of              charge density decreases gradually for both cases. At the up-
snow is partially similar to the accretion of graupel (Zrnic              per levels, the peak charge density is still greater and lasts
et al., 1993; Ziegler, 1985) and the snow content is also less            longer under polluted conditions.
in the P case (figure not shown). Small hail could be repre-                 To analyze the relationship between hydrometeors and
sented by frozen drops in the graupel category (Mansell et                electrification, vertical cross sections are shown in Figs. 14a
al., 2010). And the differences in the hail between the two               and 15a, which display the total charge distribution at the ma-
simulations (figure not shown) are not as obvious as those of             ture stage of the thunderstorm in the polluted (11:54 UTC)
graupel or ice crystal.                                                   and continental cases (11:24 UTC), respectively. The cross
   Increasing aerosol loading affects the key microphysical               sections were taken near the urban region, and the location
processes, especially in the ice-phase processes, yielding                varied depending on the location of the maximum value of
larger ice crystal content (or mass) and larger graupel size.             radar reflectivity in both simulations. It is noted that the
Both larger ice crystal content and graupel size would in-                vertical profiles of the charge distribution are more detailed
evitably affect lightning activity by affecting the rate and              than the domain-averaged charge structure shown in Fig. 13.
magnitude of charge separated during ice–graupel collisions.              The charge structure with positive charge in the upper levels
                                                                          and negative charge in the lower levels was simulated in the
3.3   The relationship between electrification,                           C case. There were positive charge appeared in the lower-
      microphysics and dynamics                                           negative-charge center (Fig. 15a), which means that this
                                                                          charge structure is a little different from the normal dipole
The time series of the peak positive (negative) charge density            (upper charge positive, lower charge negative; e.g., Thomas
in the two cases are shown in Fig. 13. The domain-averaged                et al., 2001). While the positive charge magnitude in the
peak charge structure in the P case is similar to that of the             lower levels for the C case is relatively small to form normal
C case before 12:00 UTC, with the positive charge region dis-             tripole, in which a dominant region of negative charge with
tributed above the negative charge region. In both cases, the             positive charge above and a positive charge below with ap-
maximum peak positive charge density occurs above 8.5 km                  proximately the same order of magnitude of charge (Simpson
(< −30 ◦ C), while the peak charge density for the polluted               and Scrase, 1937; Williams, 1989). In the polluted case, with
case is significantly greater, especially at the developing and           a negative charge region in the upper level (above 13 km),
mature stages (10:00–12:00 UTC). The peak positive charge                 the updraft region exhibited a charge structure with a posi-

Atmos. Chem. Phys., 21, 14141–14158, 2021                                                   https://doi.org/10.5194/acp-21-14141-2021
M. Sun et al.: Aerosol effects on electrification and lightning discharges 14151 Figure 10. (a–h) Temporal variation in the vertical profiles of the domain-averaged mass mixing ratio (g kg−1 , shaded) and number con- centration (kg−1 , solid lines) of (a) cloud water in the C case, (b) cloud water in the P case, (c) rainwater in the C case, (d) rainwater in the P case, (e) graupel in the C case, (f) graupel in the P case, (g) ice in the C case and (h) ice in the P case. Contour levels in (a–h) are 106 , 2 × 10⁷ , 5 × 10⁷ and 108 kg−1 for the cloud water number concentration; 100 and 300 kg−1 for rainwater; 10, 30, 50, 100, 300, 500, 700 and 1000 kg−1 for graupel; and 0.1 × 10⁷ , 1 × 10⁷ and 5 × 10⁷ kg−1 for ice. (i–j) Time–height maximum simulated radar reflectivity (color shading, unit dBZ) and maximum vertical velocities (solid line and white label: 10, 15, 25, 35, 45 m s−1 ; dashed line and black label: −10, −15 m s−1 ) for (i) the C case and (j) the P case. The 0, −10, −20, −30 and −40 ◦ C isotherms are shown by the dashed gray lines in (a)–(j). tive charge center located at the middle and a negative charge itive charge center located at 8–12 km in the P case. Less center at the lower level (e.g., Mansell et al., 2005; Zhang et ice-phase particles appear in upper level in the continental al., 2021). For the total net space charge density, the max- case compared to the polluted one, corresponding to a rela- imum of positive charge density at the mature stage in the tively weaker charge center. Figures 14c and 15c show the P case is up to +1 nC m−3 , which is much higher than that in cross sections of the simulated radar reflectivity and vertical the C case (less than +0.5 nC m−3 ). velocity at 11:54 UTC (11:24 UTC) under different aerosol We attempt to explain the origins of the charge distribution conditions. It is evident that both updraft and downdraft for by examining the polarity and amount of charge carried by the polluted case are greater than those for the continental different hydrometeor species (namely by ice, graupel, snow one at higher levels, resulting from more frozen latent heat, and hail particles). The negative charge region in the upper and as a consequence, the total charge density is significantly levels (12–15 km) for the P case resulted from collisions of greater above 12 km. graupel particles with smaller ice crystals and snow particles According to the non-inductive charging curve of Saun- (Fig. 14d), with the 30 dBZ echo tops reaching 13 km. The ders and Peck (1998), graupel charged negatively within simulated vertical distribution of net charge in the C case regions of relatively weak updrafts (< 5 m s−1 ) and lower was caused by ice and snow particles charged positively at liquid water content (LWC), forming a negative charge re- 8–12 km and graupel particles charged negatively at 4–7 km, gion at 4–8 km in the P case (Fig. 14a and d). With higher respectively (Fig. 15b and d). The collisions between grau- LWC in the polluted case, graupel, ice and hail were charged pel and hail particles could partially explain the intense pos- positively, forming a strong positive charge center at 9 km https://doi.org/10.5194/acp-21-14141-2021 Atmos. Chem. Phys., 21, 14141–14158, 2021
14152                                                   M. Sun et al.: Aerosol effects on electrification and lightning discharges

Figure 11. Temporal variation in the domain-averaged mean-mass radius for the different hydrometeors. (a) Cloud water, (b) rainwater,
(c) graupel, (d) ice. The red lines represent the P case, and the blue lines represent the C case.

Figure 12. Temporal variation in the vertical profiles of peak latent heating (K h−1 , shaded) of (a) C case, and (b) P case. The 0, −10, −20,
−30 and −40 ◦ C isotherms are shown by the dashed gray lines in (a)–(b).

(< −20 ◦ C), as shown in Fig. 14a. The simulations show                     The appearance of more ice-phase particles in the upper
that the non-inductive charging mechanism plays a main role              level, increasing the ice crystal number and mean-mass ra-
at the mature stage, the rate of which is 1 order of magni-              dius of graupel particles, led to greater charge densities and
tude larger than inductive charging (Fig. 16). As described              as a consequence to stronger electric field intensities. Light-
in Sect. 4.2, more ice particles and graupel with larger radii           ning discharge in WRF-ELEC occurs if the electric field
appeared at this stage in the P case, evidenced by the larger            magnitude exceeds a prescribed, fixed threshold, which fur-
simulated radar reflectivity (Fig. 14c), and the ensuing col-            ther supports the important role of aerosols in enhancing
lision rates led to significantly stronger non-inductive charg-          storm electrification. Mansell et al. (2013) found that greater
ing at 6–10 km (Fig. 16b). In consequence, it is obvious in              CCN concentration led to increased lightning activity up to
Figs. 14a and 15a that the charge density for the P case is              a point, by affecting microphysical and electrical character-
much higher than for the C case, indicating that aerosols play           istics, with a large sensitivity to ice multiplication. In agree-
an important role in affecting the accumulated charge density            ment with Mansell et al. (2013), this study shows that higher
through microphysical and further electrical processes.                  CCN concentration in the polluted case results in a relatively
                                                                         strong upper charge region, together with increased charge

Atmos. Chem. Phys., 21, 14141–14158, 2021                                                  https://doi.org/10.5194/acp-21-14141-2021
M. Sun et al.: Aerosol effects on electrification and lightning discharges 14153
Figure 13. Temporal variation in the vertical profiles of peak positive (negative) charge density (nC m−3 , shaded) of (a) C case, and (b) P case.
The 0, −10, −20, −30 and −40 ◦ C isotherms are shown by the dashed gray lines in (a)–(b).
density and electric field intensity, finally enhancing light- cles. These bring about higher charge density, together with
ning activity, as shown in Fig. 8b. a larger upper charge region caused by more ice-phase par-
ticles lifted to higher levels, leading to electric field magni-
tudes which exceed the breakdown threshold value, eventu-
4 Conclusions and discussion ally culminating in enhanced lightning activity. During the
early stages of the thunderstorm, the latent heat release at a
To elucidate the effects of aerosols on lightning activity, higher altitude is noticeably greater in the P case, mainly due
a two-moment bulk microphysics scheme (Mansell et al., to the release of frozen latent heat from cloud droplet freez-
2010; Mansell and Ziegler, 2013) and bulk lightning model ing.
(BLM, Fierro et al., 2013) were coupled in the WRF Model Observation and simulation studies have found that ele-
to simulate a multicell thunderstorm that occurred on 11 Au- vated aerosol loading enhances the electrical activity (e.g.,
gust 2017 in the metropolitan Beijing area. The simulated Koren et al., 2010; Wang et al., 2011). Some previous studies
distribution and spatio-temporal development of radar reflec- have suggested that the mass mixing ratio of ice and graupel
tivity under polluted conditions are in overall agreement with increases with enhanced CCN concentration, eventually re-
observations. sulting in stronger lightning activity (e.g., Wang et al., 2011;
Sensitivity experiments show that the intensity and du- Zhao et al., 2015), while a decrease in the graupel mixing ra-
ration of lightning activity are evidently different between tio has been found by Tan et al. (2017). It should also be
moderate (continental) and high (polluted) aerosol concen- noted that when aerosol concentrations are too large, this
trations, resulting from microphysical processes. Elevated leads to the inhibition of convection, resulting in less light-
aerosol concentrations lead to increasing cloud droplet con- ning, as discovered by Altaratz et al. (2010) in the Amazon
tents and a smaller droplet size. Smaller droplets suppress basin, as well as by Hu et al. (2019) in the Houston region,
collection and coalescence processes and lead to less rain- and simulated by Mansell and Ziegler (2013). In this study,
water under polluted conditions. These cloud droplets which we found the lightning activity was enhanced under polluted
could not accrete by raindrops will be transported to higher conditions, resulting from an increasing ice crystal number
levels and be converted into ice crystals. Increased latent and radius of graupel particles. More ice-phase particles ex-
heat release leads to strong updrafts, and in turn more cloud isted at upper levels under polluted conditions, forming a rel-
droplets could be lifted up. As a result, the ice crystal con- atively strong charge region, which is also indicated by Zhao
tents are much greater in the P case. Although the graupel et al. (2015).
contents are lower under polluted conditions resulting from The impacts of aerosols on lightning were investigated act-
less raindrop freezing, the radius of graupel is much larger ing as CCN; however, aerosols also tend to affect electrifi-
in the P case due to a much lower number concentration. cation and lightning discharge by acting as ice nuclei (IN)
Consequently, elevated aerosol loading enhances the devel- through microphysical processes (Tao et al., 2012; Fan et al.,
opment of ice-phase microphysical processes, evidenced by 2017). More sensitive experiments are still needed to discuss
more ice crystals and the larger radius of graupel participat- the influences of aerosols, acting as IN, on lightning due to
ing in charge-separation and electrification processes. Non- microphysical and thermodynamic processes.
inductive charging increases due to more frequent and ef-
fective collisions between graupel and other ice-phase parti-
https://doi.org/10.5194/acp-21-14141-2021 Atmos. Chem. Phys., 21, 14141–14158, 202114154 M. Sun et al.: Aerosol effects on electrification and lightning discharges Figure 14. Vertical cross sections (south to north) at the location shown in Fig. 4f of simulated variables at the mature stage of the thunder- storm (11:54 UTC) in the P case. (a) Total net space charge (nC m−3 , shaded). The 0, −10, −20, −30 and −40 ◦ C isotherms are shown by dashed gray lines in (a)–(d). (b) The +0.1 nC m−3 space charge density contours for cloud ice (orange), snow (blue), graupel (purple) and hail (black). The cloud outline (reflectivity echoes ≥ 5 dBZ) is denoted by the gray-shaded contour. (c) Radar reflectivity (unit dBZ), with black lines for vertical velocities (solid line: 2, 5, 10 m s−1 ; dashed line: −2 m s−1 ). (d) As in (b) but for a −0.1 nC m−3 charge density. Figure 15. As in Fig. 14 but for the vertical cross sections at the location shown in Fig. 4c of simulated variables at the mature stage of the thunderstorm (11:24 UTC) in the C case. Atmos. Chem. Phys., 21, 14141–14158, 2021 https://doi.org/10.5194/acp-21-14141-2021
M. Sun et al.: Aerosol effects on electrification and lightning discharges                                                               14155

Figure 16. Vertical cross sections (south to north) at the locations shown in Fig. 4c and f of non-inductive (pC m−3 s−1 , shaded) and inductive
(solid lines: 0.1, 0.5, 1 pC m−3 s−1 ; dashed lines: −0.1, −0.5, −1, −5, −10 pC m−3 s−1 ) charging rates at the mature stage of the (a) C case
(11:24 UTC, Fig. 4c) and (b) P case (11:54 UTC, Fig. 4f). The 0, −10, −20, −30 and −40 ◦ C isotherms are shown by dashed gray lines.

Data availability. To request the data given in this study, please        41875007, and 41761144074 (NSFC-ISF) and 2640/17 (ISF-
contact Dongxia Liu at the Institute of Atmospheric Physics, Chi-         NSFC).
nese Academy of Sciences, via email (liudx@mail.iap.ac.cn).

                                                                          Review statement. This paper was edited by Franziska Glassmeier
Author contributions. MS and XQ designed the research ideas for           and reviewed by four anonymous referees.
this study. MS and DL carried the study out and prepared the paper.
EM provided analysis ideas for the microphysics and electrification.
YY and AF edited the paper. Other co-authors participated in sci-
ence discussions and article modification.                                References

                                                                          Altaratz, O., Koren, I., Yair, Y., and Price, C.: Lightning response to
Competing interests. The authors declare that they have no conflict         smoke from Amazonian fires, Geophys. Res. Lett., 37, L07801,
of interest.                                                                https://doi.org/10.1029/2010GL042679, 2010.
                                                                          Altaratz, O., Kucienska, B., Kostinski, A., Raga, G. B., and
                                                                            Koren, I.: Global association of aerosol with flash den-
Disclaimer. Publisher’s note: Copernicus Publications remains               sity of intense lightning, Environ. Res. Lett., 12, 114037,
neutral with regard to jurisdictional claims in published maps and          https://doi.org/10.1088/1748-9326/aa922b, 2017.
institutional affiliations.                                               Bougeault, P. and Lacarrere, P.: Parameterization of orography-
                                                                            induced turbulence in a mesobeta–scale model, Mon.
                                                                            Weather Rev., 117, 1872–1890, https://doi.org/10.1175/1520-
Acknowledgements. This research was jointly supported by the Na-            0493(1989)1172.0.CO;2, 1989.
tional Natural Science Foundation of China (grant nos. 41630425,          Brooks, I. M., Saunders, C. P. R., Mitzeva, R. P., and Peck,
41875007) and the National Natural Science Foundation of China              S. L.: The effect on thunderstorm charging of the rate
in collaboration with the Israel Science Foundation (grant no.              of rime accretion by graupel, Atmos. Res., 43, 277–295,
41761144074 NSFC-ISF and 2640/17 ISF-NSFC). The authors are                 https://doi.org/10.1016/S0169-8095(96)00043-9, 1997.
thankful for the effort of all the people who participated in coordi-     Chaudhuri, S. and Middey, A.: Effect of meteorological parameters
nated observations of dynamic–microphysical–electrical processes            and environmental pollution on thunderstorm and lightning ac-
in severe thunderstorms and lightning hazards. Thanks go to the             tivity over an urban metropolis of India, Urban Clim., 3, 67–75,
data support from the Ministry of Ecology and Environment of the            https://doi.org/10.1016/j.uclim.2013.03.003, 2013.
People’s Republic of China. Thanks go to Jinyuan Xin (State Key           Chen, F. and Dudhia, J.: Coupling an advanced land surface–
Laboratory of Atmospheric Boundary Layer Physics and Atmo-                  hydrology model with the Penn State–NCAR MM5 mod-
spheric Chemistry (LAPC), Institute of Atmospheric Physics, Chi-            eling system. Part I: Model implementation and sensitivity,
nese Academy of Sciences) for the aerosol data analysis. Finally,           Mon. Weather Rev., 129, 569–585, https://doi.org/10.1175/1520-
we wish to thank the editor and four anonymous reviewers for their          0493(2001)1292.0.CO;2, 2001.
most helpful comments and suggestions.                                    Chen, Z., Qie, X., Yair, Y., Liu, D., Xiao, X., Wang, D., and Yuan,
                                                                            S.: Electrical evolution of a rapidly developing MCS during
                                                                            its vigorous vertical growth phase, Atmos. Res., 246, 105201,
                                                                            https://doi.org/10.1016/j.atmosres.2020.105201, 2020.
Financial support. This research has been supported by the Na-
                                                                          Dendy Jr., J. E.: Two multigrid methods for three-dimensional prob-
tional Natural Science Foundation of China (grant nos. 41630425,
                                                                            lems with discontinuous and anisotropic coefficients, SIAM J.

https://doi.org/10.5194/acp-21-14141-2021                                                 Atmos. Chem. Phys., 21, 14141–14158, 2021
14156 M. Sun et al.: Aerosol effects on electrification and lightning discharges
Sci. Stat. Comp., 8, 673–685, https://doi.org/10.1137/0908059, jor urban areas of South Korea, Atmos. Res., 92, 80–87,
1987. https://doi.org/10.1016/j.atmosres.2008.09.004, 2009.
Dudhia, J.: Numerical study of convection ob- Khain, A., Rosenfeld, D., and Pokrovsky, A.: Aerosol impact on the
served during the winter monsoon experiment us- dynamics and microphysics of deep convective clouds, Q. J. Roy.
ing a mesoscale two-dimensional model, J. Atmos. Meteor. Soc., 131, 2639–2663, https://doi.org/10.1256/qj.04.62,
Sci., 46, 3077–3107, https://doi.org/10.1175/1520- 2005.
0469(1989)0462.0.CO;2, 1989. Khain, A., Cohen, N., Lynn, B., and Pokrovsky, A.: Possible aerosol
Dwyer, J. R.: A fundamental limit on electric fields in air, Geophys. effects on lightning activity and structure of hurricanes, J. Atmos.
Res. Lett., 30, 2055, https://doi.org/10.1029/2003GL017781, Sci., 65, 3652–3667, https://doi.org/10.1175/2008JAS2678.1,
2003. 2008.
Fan, J., Zhang, R., Li, G., and Tao, W., K.: Effects of aerosols Khain, A., Lynn, B., and Dudhia, J.: Aerosol Effects on Intensity of
and relative humidity on cumulus clouds, J. Geophys. Res., 112, Landfalling Hurricanes as Seen from Simulations with the WRF
D14204, https://doi.org/10.1029/2006jd008136, 2007. Model with Spectral Bin Microphysics, J. Atmos. Sci., 67, 365–
Fan, J., Leung, L. R., Rosenfeld, D., and DeMott, P. J.: Ef- 384, https://doi.org/10.1175/2009JAS3210.1, 2010.
fects of cloud condensation nuclei and ice nucleating parti- Koren, I., Dagan, G., and Altaratz, O.: From aerosol-limited to in-
cles on precipitation processes and supercooled liquid in mixed- vigoration of warm convective clouds, Science, 344, 1143–1146,
phase orographic clouds, Atmos. Chem. Phys., 17, 1017–1035, https://doi.org/10.1126/science.1252595, 2014.
https://doi.org/10.5194/acp-17-1017-2017, 2017. Kumjian, M. R., Ryzhkov, A. V., Melnikov, V. M., and Schuur, T.
Fan, J., Rosenfeld, D., Zhang, Y., Giangrande, S., Li, Z., J.: Rapid-scan super-resolution observations of a cyclic super-
Machado, L., Martin, S., Yang, Y., Wang, J., Artaxo, P., cell with a dual-polarization WSR-88D, Mon. Weather Rev., 138,
Barbosa, H., Braga, R., Comstock, J., Feng, Z., Gao, W., 3762–3786, https://doi.org/10.1175/2010MWR3322.1, 2010.
Gomes, H., Mei, F., Pöhlker, C., Pöhlker, M., Pöschl, U., and Li, X., Zhang, Q., and Xue, H.: The role of initial cloud con-
Souza, R.: Substantial convection and precipitation enhance- densation nuclei concentration in hail using the WRF NSSL
ments by ultrafine aerosol particles, Science, 359, 411–418, 2-moment microphysics scheme, Adv. Atmos. Sci., 34, 1106–
https://doi.org/10.1126/science.aan8461, 2018. 1120, https://doi.org/10.1007/s00376-017-6237-9, 2017.
Fierro, A. O., Mansell, E. R., MacGorman, D. R., and Ziegler, Li, Z. Q., Wang, Y., Guo, J. P., Zhao, C. F., Cribb, M. C.,
C. L.: The implementation of an explicit charging and dis- Dong, X. Q., Fan, J. W., Gong, D. Y., Huang, J. P., Jiang,
charge lightning scheme within the WRF-ARW model: Bench- M. J., Jiang, Y. Q., Lee, S. S., Li, H., Li, J. M., Liu, J. J.,
mark simulations of a continental squall line, a tropical cy- Qian, Y., Rosenfeld, D., Shan, S. Y., Sun, Y. L., Wang, H.
clone, and a winter storm, Mon. Weather Rev., 141, 2390–2415, J., Xin, J. Y., Yan, X., Yang, X., Yang, X. Q., Zhang, F.,
https://doi.org/10.1175/MWR-D-12-00278.1, 2013. and Zheng, Y. T.: East Asian study of tropospheric aerosols
Guo, J., Deng, M., Lee, S.S., Wang, F., Li, Z., Zhai, P., Liu, H., and their impact on regional clouds, precipitation, and cli-
Lv, W., Yao, W., and Li, X.: Delaying precipitation and light- mate (EAST-AIR(CPC)), J. Geophys. Res.-Atmos., 124, 13026–
ning by air pollution over the Pearl River Delta. Part I: Ob- 13054, https://doi.org/10.1029/2019jd030758, 2019.
servational analyses, J. Geophys. Res.-Atmos., 121, 6472–6488, Liu, D., Sun, M., Su, D., Xu, W., Yu, H., and Chen, Y.: A five-
https://doi.org/10.1002/2015JD023257, 2016. year climatological lightning characteristics of linear mesoscale
Gustafsson, N., Janjić, T., Schraff, C., Leuenberger, D., Weiss- convective systems over North China, Atmos. Res., 256, 105580,
mann, M., Reich, H., et al.: Survey of data assimilation meth- https://doi.org/10.1016/j.atmosres.2021.105580, 2021.
ods for convective-scale numerical weather prediction at op- Liu, Z., Gao, W., Yu, Y., Hu, B., Xin, J., Sun, Y., Wang, L., Wang,
erational centres, Q. J. Roy. Meteor. Soc., 144, 1218–1256, G., Bi, X., Zhang, G., Xu, H., Cong, Z., He, J., Xu, J., and Wang,
https://doi.org/10.1002/qj.3179, 2018. Y.: Characteristics of PM2.5 mass concentrations and chemical
Hobbs, P. V. and Rangno, A. L.: Ice parti- species in urban and background areas of China: emerging results
cle concentrations in clouds, J. Atmos. Sci., from the CARE-China network, Atmos. Chem. Phys., 18, 8849–
42, 2523–2549, https://doi.org/10.1175/1520- 8871, https://doi.org/10.5194/acp-18-8849-2018, 2018.
0469(1985)0422.0.CO;2, 1985. Lynn, B. H., Khain, A., Rosenfeld, D., and Woodley, W. L.: Effects
Hu, J. X., Rosenfeld, D., Ryzhkov, A., Zrnic, D., Williams, of aerosols on precipitation from orographic clouds, J. Geophys.
E., Zhang, P. F., Snyder, J. C., Zhang, R. Y., and Weitz, Res., 112, D10225, https://doi.org/10.1029/2006JD007537,
R.: Polarimetric radar convective cell tracking reveals large 2007.
sensitivity of cloud precipitation and electrification proper- Lynn, B. H., Kelman, G., and Ellrod, G.: An evaluation of
ties to CCN, J. Geophys. Res.-Atmos., 124, 12194–12205, the efficacy of using observed lightning to improve con-
https://doi.org/10.1029/2019jd030857, 2019. vective lightning forecasts, Weather Forecast., 30, 405–423,
Jiang, M., Feng, J., Li, Z., Sun, R., Hou, Y.-T., Zhu, Y., Wan, B., https://doi.org/10.1175/WAF-D-13-00028.1, 2015.
Guo, J., and Cribb, M.: Potential influences of neglecting aerosol Lynn, B. H., Yair, Y., Shpund, J., Levi, Y., Qie, X., and Khain, A.:
effects on the NCEP GFS precipitation forecast, Atmos. Chem. Using factor separation to elucidate the respective contributions
Phys., 17, 13967–13982, https://doi.org/10.5194/acp-17-13967- of desert dust and urban pollution to the 4 January 2020 Tel Aviv
2017, 2017. lightning and flash flood disaster, J. Geophys. Res.-Atmos., 125,
Kar, S. K., Liou, Y. A., and Ha, K. J.: Aerosol effects e2020JD033520, https://doi.org/10.1029/2020JD033520, 2020.
on the enhancement of cloud-to-ground lightning over ma- Mansell, E. R. and Ziegler, C. L.: Aerosol effects on simu-
lated storm electrification and precipitation in a two-moment
Atmos. Chem. Phys., 21, 14141–14158, 2021 https://doi.org/10.5194/acp-21-14141-2021You can also read