ANNOTATIONS: A COVID-19 CASE-STUDY - EXPLOITING GENERATIVE SELF-SUPERVISED LEARNING FOR THE ASSESSMENT OF BIOLOGICAL IMAGES WITH LACK OF - arXiv
←
→
Page content transcription
If your browser does not render page correctly, please read the page content below
E XPLOITING GENERATIVE SELF - SUPERVISED LEARNING FOR
                                                THE ASSESSMENT OF BIOLOGICAL IMAGES WITH LACK OF
                                                      ANNOTATIONS : A COVID-19 CASE - STUDY

                                                Alessio Mascolini1,§,‡ , Dario Cardamone2,3,§ , Francesco Ponzio1,* , Santa Di Cataldo1,† , and Elisa Ficarra4,†
arXiv:2107.07761v2 [eess.IV] 26 Jul 2021

                                                             1
                                                              Politecnico di Torino, Dept. of Control and Computer Engineering, Torino, Italy
                                                                      2
                                                                        Università degli Studi di Torino, Dept. of Physics, Torino, Italy
                                                      3
                                                        Monoclonal Antibody Discovery (MAD) Lab, Fondazione Toscana Life Sciences, Siena, Italy
                                                      4
                                                        Università di Modena and Reggio Emilia, Dept. of Engineering "Enzo Ferrari", Modena, Italy
                                                                              §
                                                                                These authors contributed equally to this work
                                                                              †
                                                                                These authors contributed equally to this work
                                                        ‡
                                                          Research supported with Cloud TPUs from Google’s TensorFlow Research Cloud (TFRC)
                                                                                            *
                                                                                              Corresponding author

                                                                                                 July 27, 2021

                                                                                                A BSTRACT
                                                    Computer-aided analysis of biological images typically requires extensive training on large-scale
                                                    annotated datasets, which is not viable in many situations. In this paper we present GAN-DL, a
                                                    Discriminator Learner based on the StyleGAN2 architecture, which we employ for self-supervised
                                                    image representation learning in the case of fluorescent biological images. We show that Wasserstein
                                                    Generative Adversarial Networks combined with linear Support Vector Machines enable high-
                                                    throughput compound screening based on raw images. We demonstrate this by classifying active
                                                    and inactive compounds tested for the inhibition of SARS-CoV-2 infection in VERO and HRCE
                                                    cell lines. In contrast to previous methods, our deep learning based approach does not require any
                                                    annotation besides the one that is normally collected during the sample preparation process. We
                                                    test our technique on the RxRx19a Sars-CoV-2 image collection. The dataset consists of fluorescent
                                                    images that were generated to assess the ability of regulatory-approved or in late-stage clinical trials
                                                    compound to modulate the in vitro infection from SARS-CoV-2 in both VERO and HRCE cell
                                                    lines. We show that our technique can be exploited not only for classification tasks, but also to
                                                    effectively derive a dose response curve for the tested treatments, in a self-supervised manner. Lastly,
                                                    we demonstrate its generalization capabilities by successfully addressing a zero-shot learning task,
                                                    consisting in the categorization of four different cell types of the RxRx1 fluorescent images collection.

                                           Introduction
                                           A good feature representation is a key aspect for any visual recognition task. Thanks to their inherent capability to
                                           discover hidden data structures, as well as to extract powerful features representation, Convolutional Neural Network
                                           (CNNs) have become the fundamental building blocks in most computer vision applications. Nevertheless, much of
                                           their recent success lies in the existence of large labeled datasets: CNNs are data-hungry supervised algorithms, and
                                           thus supposed to be fed with a large amount of high quality annotated training samples.1
                                           However, associating labels to a massive number of images to effectively train a CNN may be extremely problematic in
                                           a number of real-world applications. Significant examples are the medical and computational biology domains, where
                                           image annotation is an especially cumbersome and time-consuming task that requires solid domain expertise and, more
                                           often than not, necessitates consensus strategies to aggregate annotations from several experts to solve class variability
                                           problems.2–4 Moreover, biological systems are affected by multiple sources of variability that make the definition of a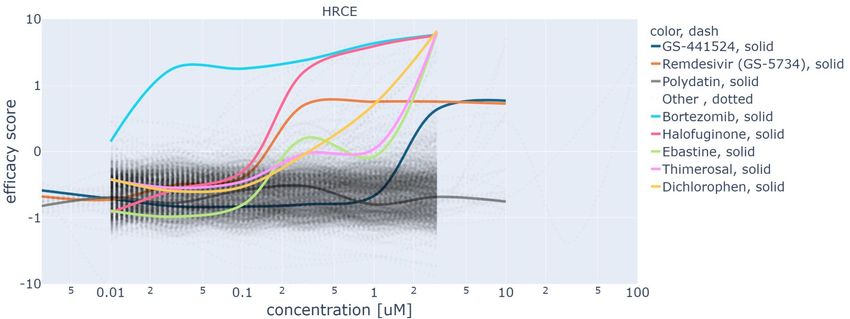
supervised task impractical, as they require to discover new effects that were not observed during the generation of the
training set. On the other hand, a considerable amount of literature focused on machine learning systems, especially
CNNs, able to adapt to new conditions without needing a large amount of high-cost data annotations. This effort
includes advances on transfer learning, domain adaptation, semi-supervised learning and self-supervised representation
learning.1
Among the context shifting techniques, the self-supervised representation learning (SSRL) paradigm has recently
received an increasing attention in the research community. Yann LeCun, invited speaker at AAAI 2020 conference,5
has defined the SSRL as “the ability of a machine to predict any parts of its input from any observed part”. In other
words, SSRL can be realized by contextualizing a supervised learning task in a peculiar form (known as pretext task) to
predict only a subset of the information using the rest to drive the decision process. Although the pretext task guides the
learning through a supervised loss function, the performance of the model on the pretext is irrelevant, as the actual
objective of SSRL is to learn an intermediate representation capable of solving a variety of practical downstream tasks.
Popular SSRL pretext tasks are rotation, jigsaw, instance discrimination and autoencoder-based methods (colorization,
denoising, inpainting).1, 3
Nevertheless, current literature has primarily exploited SSRL on general category object classification tasks (e.g.
ImageNet classification).1, 3 Surprisingly, there has been very little attention on how to extend SSRL methodologies to
other domains like computational biology or medicine, which paradoxically are among the ones that are most affected
by the lack of labeled training data.3 In this sense, for contexts distant from the standard natural image benchmarks,
finding a pretext task capable of learning a reliable and robust data representation is of particular concern. A recent
longitudinal investigation by Wallace et al.3 shows how traditional SSRL feature embedding fails in several biological
downstream tasks. The authors suggest that the absence of canonical orientation, coupled with the textural nature of the
problems, prevents SSRL popular methods from learning a pertinent representation space. They conclude that finding
an optimal SSRL feature embedding for fine-grained, textural and biological domains is still an open question.
Motivated by the findings of Wallace et colleagues ,3 in this study we propose GAN Discriminator Learner (GAN-DL),
a SSRL framework based on the discriminator of a state-of-the-art Generative Adversarial Network (GAN), namely
the StyleGAN2 model.6 The training of the StyleGAN2 backbone is based on the competition of a generator and of
a discriminator, that does not require any task-specific annotation. We specifically seek a SSRL-based featurization
methodology capable of learning a reusable and application-independent image representation that is exploitable
in complex biological domains which embody the textural as well the fine-grained patterns that typically lead the
traditional SSRL techniques to failure.1
To characterize our framework, we focus on a particularly complex biological case-study, that is COVID-19 drug
discovery, exploiting two recently released fluorescence microscopy datasets: (i) the RxRx19a, a morphological imaging
dataset that is specific of COVID-19;7 (ii) the RxRx1, a non-COVID related collection of fluorescent microscopy
images8 (a more detailed description will follow).
Figure 1 gathers some representative images taken from RxRx19a (a) and RxRx1 (b) datasets: the image content largely
diverges from those of typical SSRL benchmarks (e.g. the ImageNet). Thus, such datasets perfectly embody those
features (absence of canonical orientation, fine-grained content, textural nature) that make difficult, or even not solvable,
the classical SSRL pretext tasks as described in the work by Wallace and colleagues.3
Besides the imaging data, for the RxRx19a benchmark, a transfer learning-based image embedding is also online
accessible.7, 9 Such embedding is taken as baseline comparison to prove the goodness of our approach, and referred to
as baseline in the rest of the manuscript.
Our main contributions are the followings:

      i. We propose GAN-DL, a fully SSRL-based approach to characterize complex biological case studies. Up to
         our knowledge, our work is the first to employ SSRL in challenging, real-world biological applications.
      ii. GAN-DL leverages the features of the discriminator of a StyleGAN2 model6 to learn the RxRx19a data
          distribution without needing any specific image labelling (see Figure 2(a)). Our procedure has its own
          foundation in a pretext task which does not require any modification of the original data: the adversarial game
          between the GAN’s generator G and discriminator D (G tries to fool D, which in turn tries to identify real
          data from the fake ones created by G). We show that GAN-DL, leveraging the pretext of creating diverse and
          realistic images, is fully independent from those morphological and geometrical aspects which hampered the
          adoption of canonical SSRL techniques in medical and biological domains.3
          For the sake of clarity, it must be specified that we are not the first to exploit feature extraction based on
          GAN’s discriminator. Such procedure was firstly introduced by Radford et al. in 2017.10 After this pioneering
          study, discriminator-based feature extractors have been also exploited in other specific applications.11, 12 More

                                                             2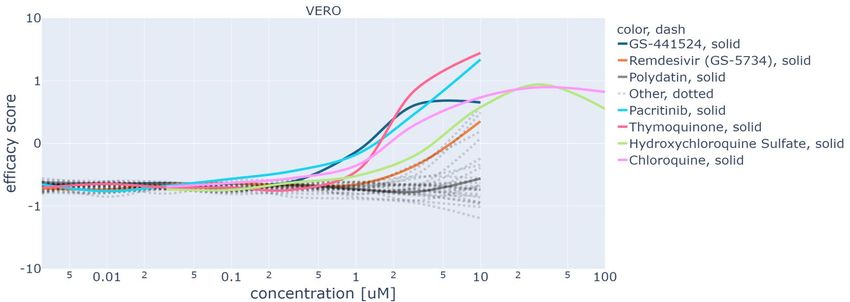
(a)

                                                          (b)
                     Figure 1: Representative examples of RxRx19a (a) and RxRx1 datasets (b).

         recently, Mao et al13 showed that the effectiveness and robustness of discriminator features strongly depends
         on avoiding mode collapse in the network. This motivated our choice of using StyleGAN26 as backbone:
         the Wasserstein family of GANs, among which StyleGAN2, are known to be particularly resistant to this
         phenomenon.12, 14
         Up to our knowledge, we are instead the first to exploit GAN’s discriminator features in an extremely
         challenging biological context, coupled with high resolution microscopy images. In such context, we propose
         and fully investigate an embedding capable not only of proficiently managing downstream classification tasks,
         but also of separating multiple unrelated features at once along different axis of the latent space.
     iii. GAN-DL significantly deviates from the baseline featurization method proposed by Cuccarese et al.15 and
          released together with the RxRx19a benchmark. As a matter of fact, the authors proposed a classic transfer-
          learning approach featuring a deep network trained from scratch on the RxRx1,8 a very large dataset that
          is similar in terms of imaging technology and content to their final application, the RxRx19a,7 but with a
          much higher annotated information content. The necessity of a pre-training phase leveraging about 300GB of
          annotated microscopy images puts serious limitations to the applicability of such method in other contexts
          affected by scarcity of labelled data. Conversely, as above-mentioned, GAN-DL does not need any labelling.
     iv. To assess GAN-DL’s ability to solve different downstream tasks, we evaluate our method on the classification
         of active and inactive compounds against SARS-CoV2 in two different cell lines (see Figure 2(b)). We show
         that GAN-DL: (i) outperforms the classical transfer learning approach consisting of a CNN pre-trained on
         ImageNet; (ii) is comparable to the baseline method in terms of accuracy, even though it was not purposely
         trained for the downstream tasks; (iii) is able to model disease-associated profiles from raw microscopy images,
         without the use of any purposely labelled data during the training.
      v. Finally, to assess the generalization capability of our method, we exploit the GAN-DL embedding learnt on
         RxRx19a in a zero-shot learning task consisting in categorizing the four different cell types of the RxRx1
         benchmark:8 human liver cancer cells (HEPG2), human umbilical vein endothelial cells (HUVEC), retinal
         pigment epithelium cells (RPE) and human bone osteosarcoma epithelial cells (U2OS).

The remaining part of the paper proceeds as follows: Results section reports our experimental results; Discussion
section outlines and discusses our findings; finally Methods section provides the description of our GAN-DL’s
implementation and the details about the proposed biological applications.

Experimental Results

Our experiments specifically seek an answer to two main research questions: (i) is it possible to learn an accurate and
reliable image featurization, able to encode and describe biological relevant information, leveraging a self-supervised

                                                           3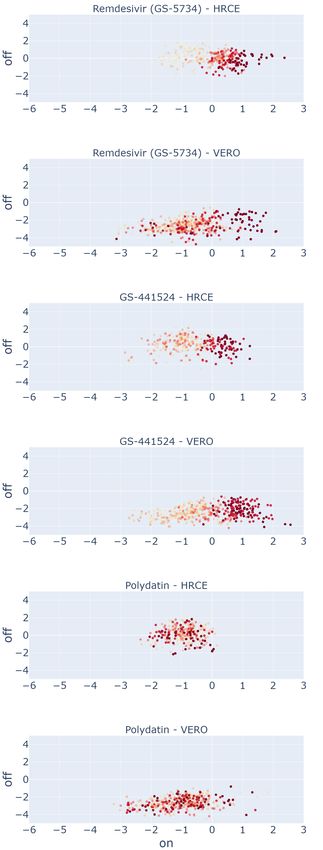
Backbone StyleGAN2                                                       Downstream        Controls classification
                                     Training set
                                                                                      tasks
                                                                 GAN-DL features

                                                                                                    Dose-response modelling

                                                       Discriminator
                                 Generated sample
      Input noise

                    Generator                                                                        Cell lines classification

      (a)                                                                          (b)          ⋮
Figure 2: Overview of GAN-DL self-supervised representation learning framework, whose pretext task consists in the
adversarial game between the generator and the discriminator of the backbone StyleGAN2 (a). The discriminator’s
features are exploited to several downstream tasks (b): (i) Controls classification - classification of active and inactive
compounds against SARS-CoV2 in two different cell models; (ii) Dose-response modelling - disease-associated
profiling from raw microscopy images; (iii) Cell lines classification - zero-shot learning classification task consisting in
categorizing four different cell types.

pretext task?; (ii) up to which extent the learned biological information can be reused in a different context? To answer
such questions, we have put into effect the properties of GAN-DL featurization in the following experiments.

Visualizing GAN-DL’s representation learning capability

To characterize the representation capability of the proposed SSRL featurization methodology, we evaluate GAN-DL on
the RxRx19a dataset, which gathers experimental data in the form of cellular imagery to investigate potential therapeutic
treatments for COVID-19. Specifically, RxRx19a evaluates a library of 1,670 approved and referenced compounds in
an unbiased, image-based screening study involving two different cell lines: the primary human renal cortical epithelial
cells (HRCE) and the African green monkey kidney epithelial cells (VERO). Both the cell lines have been infected
in-vitro with wild-type SARS-CoV2, and incubated 96 hours before fixation, staining and image acquisition.16
Two suitable control groups have been designed to assess compounds specificity. The first one, referred to as positive
control group (C + ) in the rest of the manuscript, consists of uninfected mock-treated cells, namely samples treated
with culture medium or a solvent without any active compound nor any infection. The second control group, hereafter
referred to as negative control group (C − ), is made up of cells infected in vitro by wild-type SARS-CoV-2 virus and
not treated with any compounds.
The remaining part of RxRx19a consists in the actual drugs screening, where the infected cells are treated with
compounds at different concentration. It is reasonable to assume that effective compounds will be able to inhibit the
infection and maintain a cell viability comparable to the positive controls.
In the RxRx19a compound screening setting, only the positive and negative control images can be univocally associated
with either live or dead labels. The remaining part of the samples, which is the vast majority of the dataset, is, in this
regards, unlabelled. The large amount of unlabelled data, coupled with the textural and fine-grained aspect of the images,
makes RxRx19a a very challenging case-study and a perfect candidate to assess our proposed SSRL methodology.
As Figure 2 suggests, GAN-DL embedding consists of a high-dimensional feature vector (512 features, see Materials
and Methods for details). Hence, to assess and interpret its inherent capability of learning a genuine featurization, we
need to define a projection space able to allow some degrees of visualization of the data structure. Hence, we promote
the explainability of the projection procedure defining:

      1. the effectiveness-space E2 , a two-dimensional space that represents the treatment effectiveness of the tested
         compounds on the On-perturbation and Off-perturbation axes. The On-perturbation axis of E2 must catch the
         variability between C + and C − deriving from the expected different cell viability due to the viral infection.
         Ultimately, the C + and C − control groups should be well-separated on such direction. Accordingly, the

                                                                       4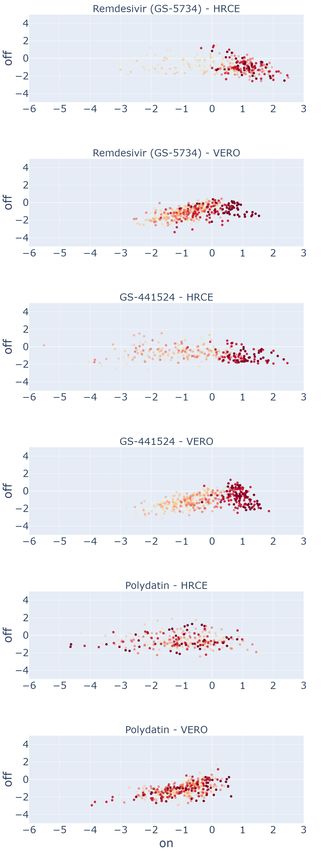
remaining samples of the RxRx19a dataset should cluster towards C + and C − depending on the effectiveness
         of the given compound: samples characterized by alive cells, namely effective compounds, should be grouped
         around C + ; samples characterized by dead cells, i.e. ineffective compounds, around C − . The scalar projection
         of the features of a given sample on the On-perturbation axis defines the efficacy score which testifies whether
         or not the given compound is effective against in-vitro SARS-CoV-2. More details on how to construct E 2 and
         compute the efficacy score will follow later in this section. By contrast, the Off-perturbation axis of E2 gathers
         the remaining variability of the data, not attributable to the effectiveness of the compounds.
      2. the cell lines-space C2 , a two-dimensional space whose On-perturbation axis captures morphological and
         functional data properties capable of grouping the samples into two clusters stemming from the two different
         cell lines used in the screening: HCRE and VERO cells. Similarly to the previous case, the Off-perturbation
         axis of C2 embodies those variability not ascribable to the two different cellular models considered. More
         details on how to construct C2 will follow later in this section.

Concerning E2 , a similar concept of On/Off-perturbation axes was firstly reported in the work by Cuccarese at
al.,15 respectively corresponding to the direction connecting the barycenters of the clusters of control conditions
(On-perturbation), and its orthogonal (Off-perturbation) in the embedding space. This can be intuitively described as a
projection that explicitly divides the variation of the data along a direction of interest (On-perturbation) from all the
remaining variations, that are grouped in the orthogonal hyperplane (Off-perturbation). Here we expand and automatize
this definition by exploiting a data-driven solution. More specifically, we leverage a linear Support Vector Machine
(SVM) trained to classify: (i) C + versus C − ; (ii) HRCE versus VERO cells. In both the cases, the Off-perturbation
axis is defined as the separation hyperplane fitted by the SVM, while the On-perturbation one is its normal. Thus,
leveraging the On/Off perturbation directions, we can define the aforementioned two-dimensional reference spaces E2
and C2 , related to first and second classification task, respectively. The scalar projection of the features embedding
on such spaces produces two components, exploited on one hand to visually interpret the data structure through point
cloud scatter plots, on the other hand to derive dose-response curves for the tested compounds, as shown later in this
section. Lastly, for a better readability of the plots, we have scaled the On-perturbation axis of both C2 and E2 in a
[−1, 1] range (min-max feature scaling). Accordingly, the Off-perturbation axis has been zero-centred.
The plots gathered in the first row of Figure 3 compare our GAN-DL’s embedding (a) with the baseline embedding15 (b)
in the E2 projection space, where we expect a degree of separation between C − and C + . The analysis is performed
considering the positive and negative controls grouped by cell type. Hence, different colors identify C − and C + for the
two distinct cell lines: blue and orange for the positive controls of HRCE and VERO cell lines, respectively, green and
red for the corresponding negative controls. As it can be gathered from the degree of separation between C − and C + on
the E2 projection space, both the embeddings behave coherently in separating mock-treated samples from those where
the virus was active. A quantitative comparison in terms of degree of separation between C − and C + is presented in
the following subsection.
The second row of Figure 3 shows GAN-DL featurization (c) and the baseline featurization (d) projected onto the C2
space, where we expect a certain degree of separation between distinct cell types, irrespective of whether C − or C + are
considered. Same as in the previous experiment, results are reported separately for the two cell lines. Here HRCE are
represented with blue (C + ) and green (C − ) colors, while VERO with orange (C + ) and red (C − ), respectively. Even
in this case, the plots demonstrate that GAN-DL is able to caught the inherent variability of the two cell lines, in a
comparable way to the transfer-learning baseline.

Assessing the linear separability of the controls

Leveraging the information content of our featurization, we quantitatively assess the accuracy on two downstream tasks:
(i) the categorization of C − versus C + and (ii) the classification of HRCE and VERO cells.
For both the classification tasks, we compare a soft margin linear SVM built on top of our GAN-DL embedding with
two other equivalent SVMs, respectively built (i) on top of the baseline featurization, and (ii) on top of the embedding
of a DenseNet CNN model, pre-trained on ImageNet and fine-tuned respectively on the controls classification, and on
the cell lines categorization of RxRx19a dataset. Note that for both the classification tasks, only images belonging to
the control have been exploited to fine-tune the ImageNet-based embeddings, as they are the only samples associated to
labels. We specifically select a DenseNet for the sake of a fair comparison, as it is also the backbone architecture of the
baseline methodology.15
The first two lines of Table 1 report the classification accuracy values of the two classification tasks (for the first one,
C − versus C + , the two cellular lines are merged into the same dataset). From the reported values we can observe
that GAN-DL provides informative features for both C − versus C + categorization (91.4% accuracy) and cell lines

                                                             5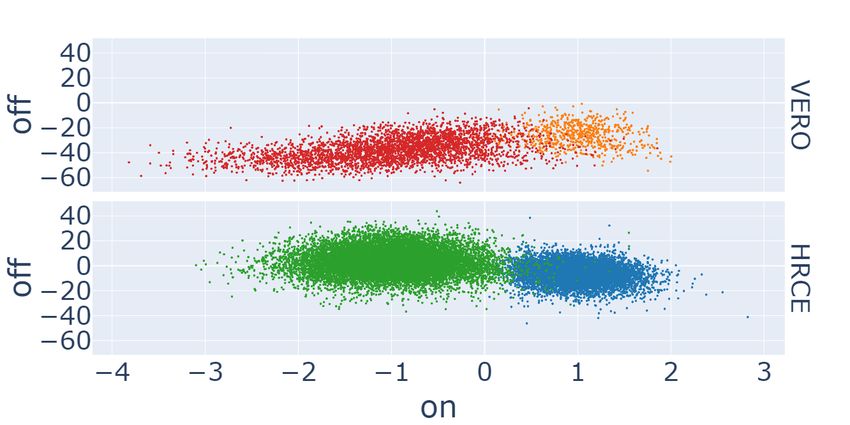
(a) GAN-DL’s embedding, E2 space                               (b) Baseline embedding, E2 space

            (c) GAN-DL’s embedding, C2 space                               (d) Baseline embedding, C2 space

Figure 3: Scatter plots of GAN-DL’s (left column) and baseline (right column) embeddings of the RxRx19a dataset
projected onto the E2 (a-b) and C2 (c-d) axes.

                              Table 1: Classification accuracy on the downstream tasks.
                                             GAN-DL      baseline [14]   ImageNet pre-trained CNN
                         C + vs C −           91.4 %       95.81 %                65.31%
                      HRCE vs VERO           100.0 %       100.0 %                85.52%
                    C+ vs C- (HRCE only)     92.44 %       99.28 %               84.09 %
                    C+ vs C- (VERO only)     99.93 %        100 %                84.53 %

recognition (100% accuracy). The baseline, that leverages the RxRx18 dataset as transfer learning source domain,
outperforms GAN-DL of just 5% in term of C − versus C + classification accuracy, and is equivalently 100% accurate
in the other task. This is a remarkable result for GAN-DL, given that no pre-training on a similar annotated context
was performed. Lastly, GAN-DL outperforms by a large margin (respectively, by 26% and 14% for the two tasks) the
traditional transfer learning solution based on ImageNet pre-training and following dataset-specific fine-tuning.
The last two lines of Table 1 report again the accuracy of the C − versus C + categorization task, this time separated by
the cellular models HRCE and VERO. For all the considered embeddings, we can observe that the accuracy is higher
when the cell lines are separated. Nonetheless, this variation is quite contained for our solution, suggesting that the
learnt representation is reasonably general irrespective of the cellular model. More specifically, GAN-DL shows an
accuracy of 92.44% and 99.93% for respectively HRCE and VERO, against the 91.4% obtained with the two lines
considered together. The baseline, on the other hand, shows an accuracy of 99.28% and 100% for respectively HRCE
and VERO, against the 95.81% for the two merged cell lines. We can again observe that the ImageNet pre-trained
solution reported a much higher accuracy difference: 84.09% and 84.53% against 65.31%.

Automatically deriving dose-response curves from image data

As discussed in the previous subsection, GAN-DL can successfully address controls categorization and cellular typing
tasks. In this section, we show how GAN-DL’s representation can explicitly describe salient and biologically relevant
data attributes, related to the efficacy of the different compounds tested in the RxRx19a screening initiative. For this

                                                           6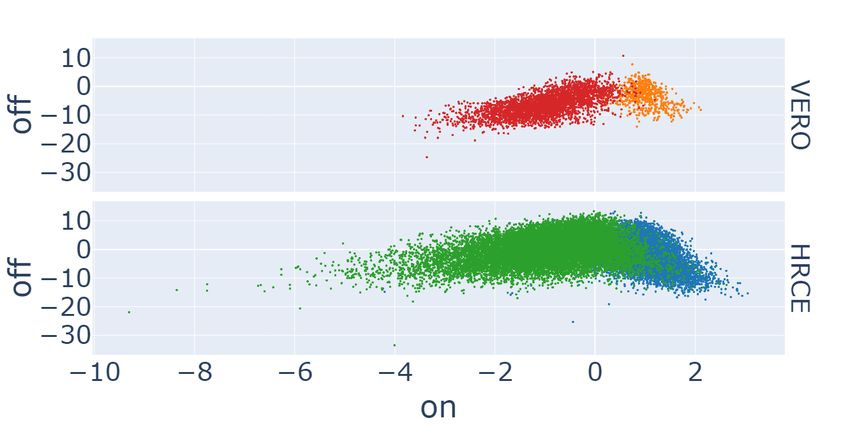
purpose, we automatically derive the dose-responce of all the 1,672 screened compouds solely from raw image data and
exploiting the GAN-DL’s featurization.
As the figures of merit we propose: (i) the embedding distributions, in the form of a scatter plot at varying concentrations,
of Remdesivir and GS-441524, two compounds proved to be effective on SARS-CoV-2 in vitro in both the cell lines,
and of Polydatin, an inert compound that is known to be ineffective15, 17 (see Figure 4). These compounds are shown as
representative examples for both our embedding (a) and the baseline embedding (b); (ii) the dose-response curves of a
number of other compounds, obtained by reporting the corresponding mean efficacy score at each concentration (see
Figure 5).
From Figure 4, we can draw a number of considerations. For the effective compounds Remdesivir and GS-441524,
it is possible to see that progressively higher drug concentrations (corresponding to progressively darker red points
in the scatter plots) tend to cluster towards positive values of the On-perturbation axis in the E2 space, closer to the
region associated to the C + group: the higher the concentration, the higher the On-perturbation value. This is generally
true for both the GAN-DL and the baseline embedding (see sections (a) and (b) of the figure, respectively), meaning
that GAN-DL is equally able to represent the concentration-dependent ability of an active compound to preserve cell
viability and inhibit SARS-CoV-2 infection.
Differently from the effective compounds, the inert ones should reasonably behave the same in terms of SARS-CoV-2
inactivation, independently of their concentration. When looking at the plot of Polydatin (a compound with no known
effect on the virus in vitro), the values cluster towards the left side of the on perturbation axis where C − controls are
located and do not show any specific color-pattern at increasing values of dose concentration. This demonstrates that,
same as for the baseline, with GAN-DL embedding the ineffective compounds do not show any specific dose-dependent
behaviour. Accordingly, very few values of the inert compounds are located in the positive On-perturbation space
(slightly greater then zero), suggesting no inactivation effect for SARS-CoV-2 infection in vitro.
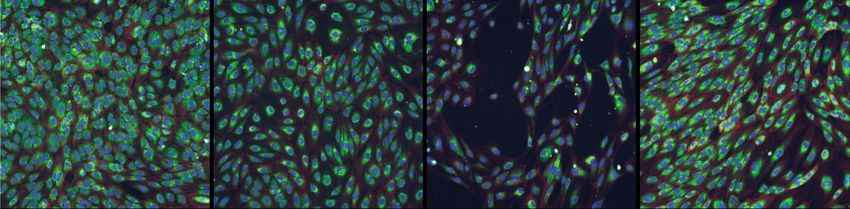
While Figure 4 shows representative examples of compounds whose effectiveness in both cell lines is a-priori known,15, 17
Figure 5 reports the dose-response curves obtained with GAN-DL for all the screening compounds, of either known or
unknown effectiveness. For both HRCE (a) and VERO (b), this figure shows on the x-axis the concentration values
and on the y-axis the efficacy score of the different compounds, as previously defined at the beginning of this section.
To obtain the efficacy score axis, we normalize the On-perturbation values using the controls, so that the mean of the
negative controls is -1 and the mean of the positive controls is 1. By doing so, we obtain that the 0 value represents the
efficacy threshold, i.e. the value above which a compound is considered effective against SARS-CoV-2 infection in
vitro. This normalization is performed on each cell line independently, as in the work by Cuccarese et al.15
The curves of the three representative compounds shown in Figure 4 are also shown in Figure 5, with solid colored
lines to highlight them: GS-441524 (blue, solid), Remdesivir (orange, solid) and Polydatin (grey, solid). As it can be
gathered from the figure, from a certain concentration value the curves of GS-441524 and Remdesivir are above the
efficacy threshold of zero. As the two cellular model behave differently upon SARS-CoV-2 infection, the concentration
level above which a compound is effective is specific for the considered cell line. This is an expected typical trend
for an effective compound. On the contrary, the efficacy score curves of Polydatin are always below the value of zero,
regardless the tested concentration. This confirms the expected ineffectiveness of the compound. Besides GS-441524,
Remdesivir and Polydatin, Figure 5 shows solid colored lines also for the five compounds that obtained the highest
efficacy scores in our screening. Bortezomib, Halofuginone, Ebastine, Thimerosal, Dichlorophen tested the most
effective in HRCE, while Pacritinib, Thymoquinone, Hydroxychloroquine Sulfate, Chloroquine in VERO cells. For the
sake of readability, all the remaining curves, associated with all the other tested compounds, are reported dashed grey
and without a corresponding label.
In general, we can identify three different behaviors: i) under-threshold curves showing no specific correlation between
concentration and efficacy score, same as Polydatin; ii) almost-monotonically increasing dose response curves, featuring
a positive correlation between concentration and efficacy: this is the most expected behavior for an effective compound,
where a treatment requires a minimum dose to be efficacious; iii) dose-response curves that are above the efficacy
threshold, but start decreasing after achieving a maximum efficacy score at a certain concentration value (see for
instance Hydroxychloroquine Sulfate, green solid line for the VERO cells). This is the case of a few compounds that
were tested at high concentration values (100 uM). Hence, the drop of efficacy score can be reasonably explained by a
loss of viability of the cell line related to a toxic effect of the compound at that high concentration.
Zero-shot learning
In the previous subsections, we demonstrated that the proposed GAN-DL is able to characterize the two distinct cell lines
included in RxRx19a dataset and to encode the dose-dependent information, even though it was not specifically trained
for those tasks. Here, we try to assess the generalization capabilities of the model in a zero-shot learning experiment,
7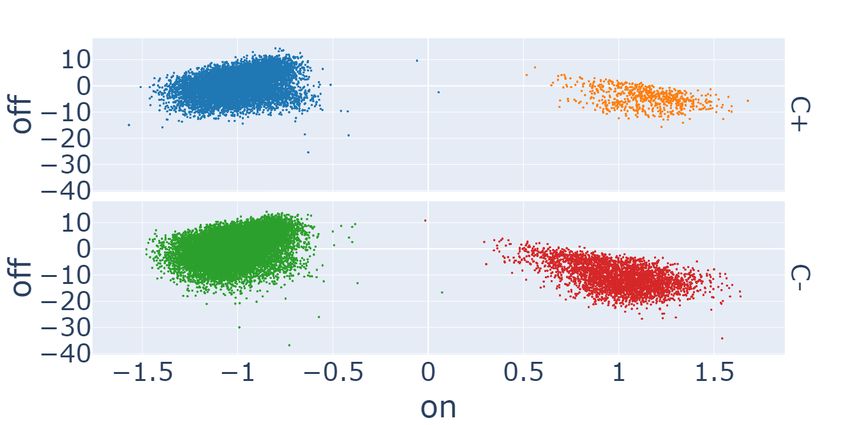
(a) GAN-DL embeddings                                       (b) Baseline embeddings

Figure 4: Drug effectiveness as a function of concentration, obtained using our GAN-DL (a) and the baseline embedding
(b).

                                                         8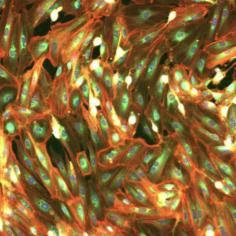
(a)

                                               (b)
Figure 5: Dose response curves for HRCE (a) and VERO (b) cell lines obtained leveraging our GAN-DL’s embedding.

that consists in a classification problem where at test time a learner observes samples from classes (i.e. cell lines) that
were not observed during training. For this purpose, we exploit the RxRx1 image collection, a non-SARS-CoV2 related
dataset consisting in 125,510 fluorescent microscopy images featuring human liver cancer cells (HEPG2), human
umbilical vein endothelial cells (HUVEC), retinal pigment epithelium cells (RPE) and human bone osteosarcoma
epithelial cells (U2OS) exposed to different perturbations8 (i.e. 1,108 different siRNAs to knockdown 1,108 different
genes). For the sake of channels compatibility, to perform a zero-shot inference on the RxRx1 dataset we removed the
channel corresponding to the MitoTracker, a dye that stains mitochondria, that is not present in the five-staining protocol
of RxRx19a. Same as in the previous experiments, we exploit a soft margin linear SVM built on top of our GAN-DL
embedding to categorize the four different cell lines included in the RxRx1 benchmark. We show the corresponding
results in the form of a confusion matrix in Figure 6(a). From this matrix we can see that, despite the fact that the
RxRx1 cell lines are totally new for GAN-DL (i.e. the backbone StyleGAN2 was not trained to generate the RxRx1
cellular images but the ones of RxRx19a), they can be linearly separated in the feature space with a mean accuracy of
92.68%. This is not much lower than the accuracy that was obtained on the RxRx19a dataset (see Table 1).
For comparison, we show the results obtained by a DenseNet classifier (the same architecture of our previous experiment),
pre-trained on ImageNet and fine-tuned on the RxRx1 dataset. In spite of the fine-tuning, as shown in the confusion
matrix of Figure 6(b), the DenseNet classifier obtained an accuracy of 83.19%, about 10% lower than GAN-DL.

Methods
Dataset

The data used in this work are part of the RxRx datasets collections, that are available online.16 More specifically, in
our experiments we exploit:
      1. The RxRx19a, which, as briefly mentioned in Results section, gathers several experiments aimed at investi-
         gating therapeutic potential treatments for COVID-19 from a library of FDA-approved and EMA-approved
         drugs or compounds in late-stage clinical trials.7 After 24 hours post-seeding, the cells have been infected with

                                                            9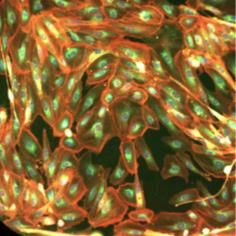
(a) GAN-DL                                                 (b) ImageNet pre-trained CNN
              Figure 6: Confusion matrix of the zero shot cell classification task on the RxRx1 dataset.

         SARS-CoV-2 and then incubated for 96 hours before fixation, staining and imaging. Images were produced
         using five channels to highlight the cell membrane and different cellular compartments, leveraging a specific
         fluorescent staining protocol, as described in the work by Cuccarese and colleagues.7 The compounds were
         screened by treating cells in six half-log doses with six replicates per dose for each compound approximately
         two hours after cell seeding. Further details about the assays protocol can be found at the official dataset
         website.16 The resulting dataset is made up of 305,520 fluorescent microscopy images of size equal to
         1024 × 1024 × 5. To assess the specificity of the tested compounds, two suitable control groups have been
         designed. The first one consists in conditioned media preparations generated from uninfected cells (Mock),
         the second one is made up of cells infected in vitro by active SARS-CoV-2 virus and not treated with any
         compounds.
      2. The RxRx1, a dataset consisting of 296 GB of 16-bit fluorescent microscopy images, created under controlled
         conditions to provide the appropriate data for discerning biological variation in the common context of
         changing experimental conditions. The RxRx1 has been specifically created to push innovative machine
         learning and deep learning pipeline on large biological datasets, aimed at drug discovery and development.8

GAN-DL’s backbone: the StyleGAN2 model

The recent literature about GANs is focused on methodologies to improve their training and counteract the well
known difficulties and limitations of this phase.18 More specifically, Wasserstein Generative Adversarial Networks
(W-GANs)14 have been introduced to prevent two common problems of training GANs. First, mode collapse is a
form of GAN failure in which the network learns to generate only a subset of the data, eventually a single image. The
discriminator get trapped into a local minimum and the generator easily presents the same examples over and over to
convince the discriminator. This results in a model that is heavily over-fitted on this particular subset. Second, lack
of convergence due to either the generator or the discriminator, which are improving at a faster pace than the other
network. This prevents the mutual improvement that is necessary for convergence.
W-GANs have proved to be an efficient solution to overcome both those limitation at once, by replacing the classical
discriminator model with a critic that scores the realness of a given image by means of the so-called Wasserstein
distance.14 For our GAN-DL we employed the Nvidia’s StyleGAN2 architecture,6 that is an instance of W-GAN
with recurrent connections in both the generator and the discriminator. Figure 7 shows a high level diagram of this
architecture (a), as well as a breakdown of the generator block and residual connections (b-c). We refer the reader to the
paper of Karras et al6 for technical details.
The original StyleGAN2 model has been scaled down to allow training on more reasonable hardware and time-frames.
To reduce the number of parameters, we simplified the fully connected mapping network to be 3 layers deep instead of
the original 8. The latent space we employ corresponds to the style vector, the sizing of which is 512 in accordance
with the original paper, while the latent space of the other embeddings shown for comparison is of size 1024 (more
details in Counterpart embeddings subsection).

Experimental setup

The StyleGAN2 backbone was trained on the RxRx19a dataset using Adam optimizer with a learning rate of 10−4 ,
with the same loss as the one described in the StyleGAN2 paper.6 No hyperparameter optimization was performed.
Conversely, we employed two regularization terms:

                                                           10
(a) High-level (b) Generator Block (c) Residual Connections (d) Residual Connections
overview (Generator) (Discriminator)
Figure 7: Overview of the StyleGAN2 architecture
• Generator: Jacobian Regularization (also known as PPL regularization),6 Exponential Moving Average of the
weights19
• Discriminator: Lipschitz L1 penalty,20 R1 regularization18
For training we employed one TPU v3-8 node with 16GiB of RAM per core. TPUs are AI accelerator ASICs
(Application Specific Integrated Circuits) which have the ability to train neural networks significantly faster than GPUs
by executing a larger amount of computations in parallel.
The original StyleGAN2 took 9 days on 8 Tesla V100 GPUs to train on the FFHQ dataset, while our slimmed and
repurposed version required 24 hours on a TPU v3-8 node or 48 hours on a single Tesla V100 GPU to obtain the results
shown in this paper. Most of the difference in training time can be attributed to the vastly different dataset used as well
as the different training objective.
Counterpart embeddings
In our experiments, GAN-DL embedding is compared against three different counterparts:
• The RxRx19a embedding, released together with the imaging data by Cuccarese et al15 and referred to as
baseline in this manuscript (see Figure 3, Figure 4 and Table 1). It consists of 1024-dimensional vectors
(one vector per image) obtained using a DenseNet CNN architecture as the backbone, pre-trained on a source
labelled dataset with similar imaging characteristics (RxRx1 dataset). The proprietary model is not publicly
released by the authors.
• The embedding of a DenseNet CNN pre-trained on a source dataset with completely different imaging
characteristics and contents (ImageNet) and fine-tuned on a labelled portion of the target RxRx19a dataset, i.e.
the controls (see Table 1). For a fair comparison, the backbone of this methodology is a DenseNet, same as for
the baseline solution.
• The embedding of a DenseNet CNN pre-trained on a source dataset with completely different imaging
characteristics and contents (ImageNet) and fine-tuned on the RxRx1 dataset (see Figure 6).
Note that pre-training a neural network with ImageNet data involves interpreting images in terms of RGB channels,
while fluorescent cellular images such as the RxRx19a and RxRx1 datasets are usually represented in 5/6 channels. To
account for this difference, we introduce a trainable convolutional layer with a kernel size of 1 at the beginning of the
RGB pre-trained networks, so that the fluorescent images are converted to 3 channels.
Conclusions
In contexts where dataset annotation is costly, like medical and computational biology domains, the current standard,
for the application of deep learning models on image data, involves the use of a ImageNet-pretrained CNN model,
and optionally fine-tuned on the limited quantity of labelled samples that are available for the given application.
Nevertheless, we found such transfer learning-based strategy totally unsatisfactory for our real word application (see
Table 1), where the inherent complexity of the required biological tasks and the experimental set-up of a large scale
drug screening initiative claims for a more powerful representation learning technique. If, in general, SSRL seems a
promising solution for those scenarios suffering a paucity of labelled data, the recent work by Wallace et al.3 has shown
11how traditional SSRL featurization methodologies fail in several biological downstream tasks. This is mainly imputed
on the difficulty in defining a pretext task which can be exploited by traditional contrastive SSRL.
On top of these considerations, in this paper we propose GAN-DL, a fully SSRL method leveraging the representation
learning acquired by the discriminator of a StyleGAN2 model.6 Our GAN-DL does not require any task-specific label
to obtain the image embedding, as the StyleGAN2 backbone is trained on a generative task based on the competition of
a generator and of a discriminator, that is completely independent on the downstream task. By doing so, we address the
problem of lack of annotated data, that is instead necessary for conventional CNN-based transfer learning methods. We
demonstrated the goodness of our featurization methodology in two downstream supervised tasks: the classification of
different cellular models (HRCE versus VERO cells) and the categorization of positive versus negative control groups
in the RxRx19a benchmark.7 For this purpose, we trained a simple linear SVM on top of the self-supervised GAN-DL
embedding, which does not require a large number of annotated data. Furthermore, we compared our solution with
a baseline state-of-the-art DenseNet121 model, pre-trained on the RxRx1 dataset8 (the corresponding embedding is
released together with the imaging data by Cuccarese et al.15 ).
On the one hand, the baseline embedding is generally more accurate than GAN-DL in the downstream classification
tasks, even though by a small margin. On the other hand, the baseline is pre-trained on a very large annotated dataset
(RxRx1 dataset, consisting of 296 GB of fluorescent microscopy images), while training GAN-DL does not require
any task-specific image annotations. This is indeed a major advantage for the re-usability of our method in different
contexts where annotated data from a similar domain are few or even not available at all, which is a frequent challenge
of many biological applications.
We speculate that our GAN-DL embedding, leveraging as pre-text task the generation of plausible and high resolution
images through the adversarial game between the generator and the discriminator, proficiently learns an unbiased and
disentangled image featurization able to describe the fine-grained patterns that are typical of biological applications.
This leads to an improved capability of separating multiple unrelated features along different axis of the latent space,
which should be ultimately helpful to address any downstream tasks requiring knowledge of the salient attributes of the
data.21 To demonstrate our claim, we put this capability of GAN-DL into effect in a number of different applications:
(i) the classification of active and inactive compounds against SARS-CoV-2 infection in two different cell lines; (ii)
the generation of dose-response curves for the large scale molecule screening of RxRx19a, without the need of any
training on purposely labelled data; (iii) the zero-shot learning of four different cell lines included in the RxRx1 dataset.
The satisfactory results in all the presented scenarios demonstrate the goodness and generalization capability of our
approach and legitimize the future exploitation of generative SSRL even in other biological applications.
References
1
Xiao Liu, Fanjin Zhang, Zhenyu Hou, Zhaoyu Wang, Li Mian, Jing Zhang, and Jie Tang. Self-supervised learning:
Generative or contrastive. arXiv preprint arXiv:2006.08218, 1(2), 2020.
2
Martina Melinscak and S Lončarić. Retinal oct image segmentation: How well do algorithms generalize or how
transferable are the data? 10 2020.
3
Bram Wallace and Bharath Hariharan. Extending and analyzing self-supervised learning across domains. In European
Conference on Computer Vision, pages 717–734. Springer, 2020.
4
Francesco Ponzio, Enrico Macii, Elisa Ficarra, and Santa Di Cataldo. W2WNet: a two-module probabilistic
convolutional neural network with embedded data cleansing functionality. arXiv, 2021.
5
Aaai 2020 conference. https://aaai.org/Conferences/AAAI-20/. Accessed: 2021-04-29.
6
Tero Karras, Samuli Laine, Miika Aittala, Janne Hellsten, Jaakko Lehtinen, and Timo Aila. Analyzing and improving
the image quality of stylegan. In Proceedings of the IEEE/CVF Conference on Computer Vision and Pattern
Recognition, pages 8110–8119, 2020.
7
Rxrx19 dataset. https://www.rxrx.ai/rxrx19. Accessed: 2021-04-28.
8
Rxrx1 dataset. https://www.rxrx.ai/rxrx1. Accessed: 2021-04-28.
9
Rxrx2 dataset. https://www.rxrx.ai/rxrx2. Accessed: 2021-04-28.
10
Alec Radford, Luke Metz, and Soumith Chintala. Unsupervised representation learning with deep convolutional
generative adversarial networks. arXiv, 2016.
11
Daoyu Lin, Kun Fu, Yang Wang, Guangluan Xu, and Xian Sun. Marta gans: Unsupervised representation learning
for remote sensing image classification. IEEE Geoscience and Remote Sensing Letters, 14(11):2092–2096, 2017.
1212
Mingyang Zhang, Maoguo Gong, Yishun Mao, Jun Li, and Yue Wu. Unsupervised feature extraction in hyperspectral
images based on wasserstein generative adversarial network. IEEE Transactions on Geoscience and Remote Sensing,
57(5):2669–2688, 2018.
13
Xin Mao, Zhaoyu Su, Pin Siang Tan, Jun Kang Chow, and Yu-Hsing Wang. Is discriminator a good feature extractor?
arXiv, 2020.
14
Martin Arjovsky, Soumith Chintala, and Léon Bottou. Wasserstein gan. arXiv, 2017.
15
Michael F. Cuccarese, Berton A. Earnshaw, Katie Heiser, Ben Fogelson, Chadwick T. Davis, Peter F. McLean,
Hannah B. Gordon, Kathleen-Rose Skelly, Fiona L. Weathersby, Vlad Rodic, Ian K. Quigley, Elissa D. Pastuzyn,
Brandon M. Mendivil, Nathan H. Lazar, Carl A. Brooks, Joseph Carpenter, Pamela Jacobson, Seth W. Glazier, Jes Ford,
James D. Jensen, Nicholas D. Campbell, Michael A. Statnick, Adeline S. Low, Kirk R. Thomas, Anne E. Carpenter,
Sharath S. Hegde, Ronald W. Alfa, Mason L. Victors, Imran S. Haque, Yolanda T. Chong, and Christopher C. Gibson.
Functional immune mapping with deep-learning enabled phenomics applied to immunomodulatory and covid-19
drug discovery. bioRxiv, 2020.
16
Katie Heiser, Peter F. McLean, Chadwick T. Davis, Ben Fogelson, Hannah B. Gordon, Pamela Jacobson, Brett
Hurst, Ben Miller, Ronald W. Alfa, Berton A. Earnshaw, Mason L. Victors, Yolanda T. Chong, Imran S. Haque,
Adeline S. Low, and Christopher C. Gibson. Identification of potential treatments for covid-19 through artificial
intelligence-enabled phenomic analysis of human cells infected with sars-cov-2. bioRxiv, 2020.
17
Meehyun Ko, Sangeun Jeon, Wang-Shick Ryu, and Seungtaek Kim. Comparative analysis of antiviral efficacy of
fda-approved drugs against sars-cov-2 in human lung cells. Journal of medical virology, 2020.
18
Lars Mescheder, Andreas Geiger, and Sebastian Nowozin. Which training methods for gans do actually converge?
arXiv, 2018.
19
Tero Karras, Timo Aila, Samuli Laine, and Jaakko Lehtinen. Progressive growing of gans for improved quality,
stability, and variation. arXiv, 2018.
20
Henning Petzka, Asja Fischer, and Denis Lukovnicov. On the regularization of wasserstein gans. arXiv, 2018.
21
Xi Chen, Yan Duan, Rein Houthooft, John Schulman, Ilya Sutskever, and Pieter Abbeel. Infogan: Interpretable
representation learning by information maximizing generative adversarial nets. arXiv preprint arXiv:1606.03657,
2016.
13You can also read