Development of aerosol optical properties for improving the MESSy photolysis module in the GEM-MACH v2.4 air quality model and application for ...
←
→
Page content transcription
If your browser does not render page correctly, please read the page content below
Geosci. Model Dev., 15, 219–249, 2022
https://doi.org/10.5194/gmd-15-219-2022
© Author(s) 2022. This work is distributed under
the Creative Commons Attribution 4.0 License.

Development of aerosol optical properties for improving the MESSy
photolysis module in the GEM-MACH v2.4 air quality model and
application for calculating photolysis rates in a biomass
burning plume
Mahtab Majdzadeh, Craig A. Stroud, Christopher Sioris, Paul A. Makar, Ayodeji Akingunola, Chris McLinden,
Xiaoyi Zhao, Michael D. Moran, Ihab Abboud, and Jack Chen
Air Quality Research Division, Environment and Climate Change Canada, Toronto, ON, M3H5T, Canada

Correspondence: Craig A. Stroud (craig.stroud@ec.gc.ca)

Received: 26 May 2021 – Discussion started: 8 July 2021
Revised: 30 September 2021 – Accepted: 26 November 2021 – Published: 12 January 2022

Abstract. The photolysis module in Environment and Cli-          mance with the implementation of the new photolysis mod-
mate Change Canada’s online chemical transport model             ule and with adopting the online interactive aerosol concen-
GEM-MACH (GEM: Global Environmental Multi-scale –                trations in GEM-MACH. Incorporating these changes to the
MACH: Modelling Air quality and Chemistry) was improved          model resulted in an increase in the correlation coefficient
to make use of the online size and composition-resolved          from 0.17 to 0.37 between the GEM-MACH model AOD 1-
representation of atmospheric aerosols and relative humid-       month hourly output and AERONET (Aerosol Robotic Net-
ity in GEM-MACH, to account for aerosol attenuation of ra-       work) measurements across all the North American sites.
diation in the photolysis calculation. We coupled both the       Comparisons of the updated model AOD with AERONET
GEM-MACH aerosol module and the MESSy-JVAL (Mod-                 measurements for selected Canadian urban and industrial
ular Earth Submodel System) photolysis module, through           sites, specifically, showed better correlation coefficients for
the use of the online aerosol modeled data and a new Mie         urban AERONET sites and for stations located further south
lookup table for the model-generated extinction efficiency,      in the domain for both simulation periods (June and Jan-
absorption and scattering cross sections of each aerosol type.   uary 2018). The predicted monthly averaged AOD using the
The new algorithm applies a lensing correction factor to the     improved photolysis module followed the spatial patterns
black carbon absorption efficiency (core-shell parameteri-       of MERRA-2 reanalysis (Modern-Era Retrospective analysis
zation) and calculates the scattering and absorption optical     for Research and Applications – version 2), with an overall
depth and asymmetry factor of black carbon, sea salt, dust       underprediction of AOD over the common domain for both
and other internally mixed components.                           seasons. Our study also suggests that the domain-wide im-
   We carried out a series of simulations with the improved      pacts of direct and indirect effect aerosol feedbacks on the
version of MESSy-JVAL and wildfire emission inputs from          photolysis rates from meteorological changes are consider-
the Canadian Forest Fire Emissions Prediction System (CF-        ably greater (3 to 4 times) than the direct aerosol optical ef-
FEPS) for 2 months, compared the model aerosol optical           fect on the photolysis rate calculations.
depth (AOD) output to the previous version of MESSy-
JVAL, satellite data, ground-based measurements and re-
analysis products, and evaluated the effects of AOD calcu-
lations and the interactive aerosol feedback on the perfor-
mance of the GEM-MACH model. The comparison of the
improved version of MESSy-JVAL with the previous ver-
sion showed significant improvements in the model perfor-

Published by Copernicus Publications on behalf of the European Geosciences Union.
220                                  M. Majdzadeh et al.: Development of aerosol optical properties in GEM-MACH v2.4

1   Introduction                                                   carbon may be enhanced (absorption enhancement) by 50 %
                                                                   to 60 % through a lensing effect (Liu et al., 2017). Since
Atmospheric aerosols are very small solid, aqueous or              absorption, and therefore the radiative forcing in the atmo-
mixed-state particles suspended in the atmosphere, typically       sphere, is influenced by different assumptions of the mixing
ranging from 10−3 to 10 µm in size, which affect Earth’s ra-       state of particles, the representation of aerosol size and the
diative balance (Bond and Bergstrom, 2006). Photolysis or          mixing state of black carbon is essential to have a realistic
photo-dissociation reactions are those for which molecules         estimation of radiative forcing in atmospheric models (Bond
break down by absorbing sunlight. Aerosol particles scatter        et al., 2006). Bond et al. (2006), calculated the absorption
and absorb solar radiation, and can thus change the actinic        amplification (ratio of absorption by core-shell black car-
fluxes, or the flux of spherically integrated spectral radiance    bon to pure black carbon with the same carbon mass) for a
of the Sun, and hence the rate coefficients of photolysis re-      wide range of core-shell thickness, using an implementation
actions, also known as J values (Jacobson, 2005). The lat-         of the Bohren and Huffman (1983) Mie scattering algorithm
ter are the rates of the molecular dissociation of the gaseous     in MATLAB (Mätzler, 2002) at 550 nm. They identified five
species by sunlight and depend on the attenuation of the ra-       distinct geometric regimes for different black carbon (core)
diation stream as a function of the particle size, composition     and shell sizes, and calculated the best fit for the absorption
and morphology (arrangement of the components within the           amplification for each individual regime (Bond et al., 2006,
particle), on gases’ effective size (molecular cross section)      Table 2).
and on the fraction of molecules broken apart per incoming            To date, the estimates of AOD in atmospheric models have
photon (quantum yield). One way of quantifying the effects         been based on one or a combination of different mixing states
of aerosols on radiative transfer processes, including photol-     of aerosols. The variation in the resulting aerosol optical
ysis, is through the use of the aerosol optical depth (hereafter   properties from the atmospheric models is associated with
AOD). AOD is a dimensionless quantity, a measure of the ex-        the assumptions regarding the methods used in AOD calcula-
tinction of the solar light by aerosols in the atmosphere, and     tions, aerosol mixing states, density, refractive index and hy-
it provides a measure of the amount of aerosols in a vertical      groscopic growth, with the most important factor being the
column from the surface to the top of the atmosphere.              choice of the mixing states of aerosols (Curci et al., 2015).
   Aerosol mixing state within a population of aerosol par-        The latter accounts for 30 % to 35 % of the uncertainty in es-
ticles is defined as the distribution of chemical species in       timation of AOD and single scattering albedo (Curci et al.,
each aerosol particle (Riemer et al., 2019) and can also be re-    2015). Other studies, e.g., Barnaba et al. (2010), found dif-
ferred to as the particle morphology in the aerosol population     ferent spatial patterns in AOD vs. surface particulate matter,
(Stevens and Dastoor, 2019). When all the species are homo-        highlighting the sensitivity of calculated AOD to aerosol ver-
geneously mixed within an aerosol particle, the population         tical profile rather than the aerosol surface concentrations.
is known to be “internally mixed”, whereas an “externally             The radiative transfer module in chemical transport mod-
mixed” population of particles consists of each particle be-       els contains parameterizations for extinction efficiency (the
ing of only one chemical species. Internal mixtures can also       sum of scattering and absorption efficiencies), single scat-
be described as homogeneous populations of homogeneous             tering albedo (the ratio of scattering efficiency to total ex-
particles and external mixtures as heterogeneous populations       tinction efficiency) and asymmetry factor (the angular direc-
of homogeneous particles (Bond and Bergstrom, 2006). In            tion of the scattered radiation by particles or gases) for each
reality, completely internally and externally mixed aerosol        particle type and calculates scattering and absorption coeffi-
populations are rare in the atmosphere, and aerosol particles      cients (a measure of photon scattering and absorption by par-
are complex mixtures of different chemical species (Bond et        ticles) to predict the radiative state of the atmosphere. AOD
al., 2006; Riemer et al., 2019; Healy et al., 2014).               is calculated by integrating the extinction of the solar beam
   Black carbon (a widely used term for light-absorbing car-       due to aerosols over the vertical column. These optical ef-
bon) from fossil fuel and biomass burning is known to have         fects of aerosols may also influence the shorter wavelengths
a large positive radiative forcing in the atmosphere due to its    associated with atmospheric gas photolysis, influencing at-
highly absorptive properties and strong extinction (Jacobson,      mospheric reactivity. These processes may be harmonized
2000; Bond and Bergstrom, 2006). Black carbon is generally         in an online chemical transport model, such as Environment
modeled using different assumptions on its mixing state: ex-       and Climate Change Canada’s (ECCC) online-coupled mete-
ternally mixed, where black carbon and other aerosols are in       orology and chemical transport model, GEM-MACH (GEM:
separate particles, volume-averaged internally mixed, where        Global Environmental Multi-scale – MACH: Modelling Air
each particle contains a mixture of black carbon and other         quality and Chemistry). Chemical transport models such as
aerosols, and a core-shell structure, in which each particle       GEM-MACH have been used in past works, investigating
consists of a black carbon core surrounded by a mixture of         AOD and evaluating different aerosol light attenuation meth-
other aerosols through condensation and coagulation or ag-         ods and mixing states of black carbon.
ing processes (Jacobson, 2001). When black carbon is coated           Gan et al. (2015) performed a long-term simulation of
with other aerosols, the light-absorbing properties of black       aerosol concentration and optical depth for 16 years (1995

Geosci. Model Dev., 15, 219–249, 2022                                                https://doi.org/10.5194/gmd-15-219-2022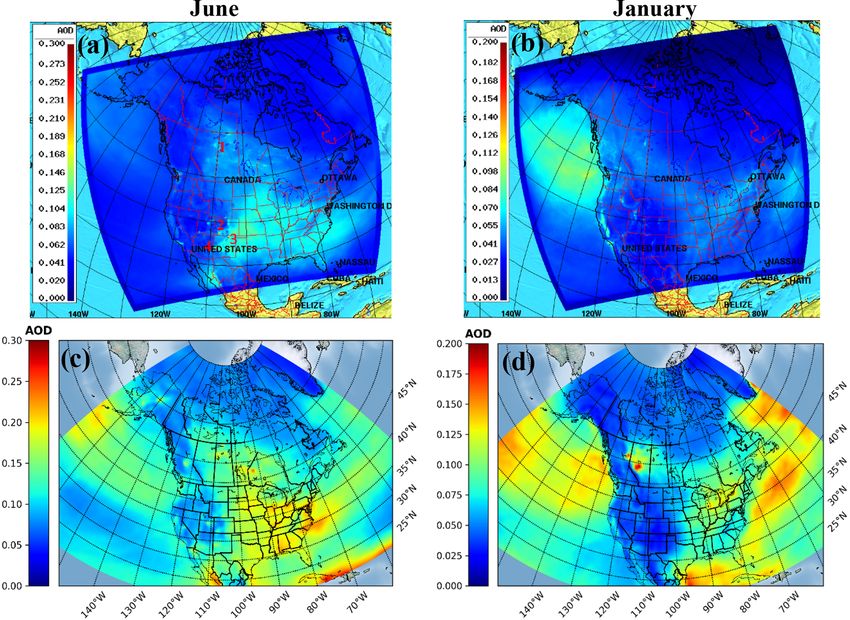
M. Majdzadeh et al.: Development of aerosol optical properties in GEM-MACH v2.4                                                                               221

Table 1. Aerosol optical calculations in GEM and MACH.

                           Aerosol size     Aerosol          Ozone column             Aerosol mixing state              Lensing effect   Surface albedo
                                            chemistry
 Base J -value lookup      Climatology      Climatology      Constant climatology     Homogeneous mixture for           No               290–400 nm (0.05)
 table in MACH                                               (Peterson, 1976)         aerosols                                           400–450 nm (0.06)
                                                                                                                                         450–500 nm (0.08)
                                                                                                                                         500–550 nm (0.1)
                                                                                                                                         550–600 nm (0.11)
                                                                                                                                         600–640 nm (0.12)
                                                                                                                                         640–660 nm (0.135)
                                                                                                                                         660–700 nm (0.15)
                                                                                                                                         (Peterson, 1976)
 Base MESSy-JVAL in        Climatology      Climatology      Online                   Homogeneous mixture for           No               Online
 MACH                      (Chen et al.,    (Chen et al.,                             aerosols
                           2020)            2020)
 Revised MESSy-JVAL        Online           Online           Online                   Externally mixed and internally   Yes              Online
 in MACH                   (this work)      (this work)                               mixed aerosols and core-shell     (this work)
                                                                                      black carbon (this work)
 Base radiative transfer   Climatology      Climatology      Online                   Homogeneous mixture for           No               Online
 in GEM                                                                               aerosols
 Revised radiative         Online           Online           Online                   Homogeneous mixture for           No               Online
 transfer in GEM           (Makar et al.,   (Makar et al.,                            aerosols
                           2015a, b)        2015a, b)

to 2010), using the coupled Weather Research and Forecast-                          evaluated using data from the North American IMPROVE
ing – Community Multi-scale Air Quality (WRF v3.4 and                               (Interagency Monitoring of Protected Visual Environments)
CMAQ v5.0.2) models over the continental US (CONUS).                                monitoring network between 2000 and 2010; the global
For model evaluation, they used 16 years (1995 to 2010) of                          AERONET (Aerosol Robotic Network) data were used for
observation data and 14 years of AOD data (1997 to 2010)                            AOD evaluation. Aerosol optical properties were generated
from several measurement networks including SURFRAD                                 using a GEOS-Chem default optical lookup table. They ex-
(Surface Radiation Budget Network), ARM (Atmospheric                                amined the impact of secondary inorganic aerosol and or-
Radiation Measurement), CASTNET (Clean Air Status and                               ganic aerosol size and hygroscopicity, excluding sites dom-
Trend Network) and IMPROVE (Interagency Monitoring of                               inated by dust, and those with a high degree of internal
Protection Visual Environments) observations (Gan et al.,                           subgrid-scale elevation variability, in order to focus on the
2014a, 2015). The aerosol light attenuation method in their                         composition and/or size issues. The revised hygroscopicity
model was based on Mie and core-shell scattering (Gan et                            assumptions resulted in an increase of 19 % in global mean
al., 2014b), and the model used online aerosol feedback on                          simulated AOD with the revised aerosol optical properties.
radiation and photolysis (sulfate, nitrate, ammonium, dust                          Despite improvements to simulated AOD on a global scale,
and organic aerosols) (Gan et al., 2015). Although their sim-                       those values were still underestimated at most North Amer-
ulations showed the overall observed trends of AOD from                             ican sites (Latimer et al., 2019), with a correlation relation
SURFRAD, the magnitude of simulated AOD was under-                                  (R) of 0.78 and root mean square error (RMSE) of 0.1 for
estimated compared to the observations. For instance, the                           measured vs. revised simulated AOD at all AERONET sites
1997–2010 annual mean AOD time series over the eastern                              in 2006.
US showed the model AOD values ranging from a mini-                                    Alvarado et al. (2016) used measurements of aerosol scat-
mum of ∼ 0.06 to a maximum of ∼ 0.09, while SURFRAD                                 tering and absorption gathered during the 2008 Arctic Re-
observations had a minimum of ∼ 0.125 and maximum of                                search of the Composition of the Troposphere from Air-
∼ 0.175.                                                                            craft and Satellites (ARCTAS) campaign to evaluate the
   Latimer et al. (2019) performed a 10-year simulation                             aerosol optical properties from global numerical models.
of aerosol mass scattering efficiency and AOD using the                             The NASA ARCTAS campaign (Jacob et al., 2010) was
GEOS-Chem (Goddard Earth Observing System for chem-                                 conducted over Alaska in April 2008 (ARCTAS-A) and
istry of the NASA Global Modeling and Assimilation Of-                              over western Canada during June–July 2008 (ARCTAS-B).
fice, version 11-02, http://geos-chem.org, last access: 1 De-                       ARCTAS-CARB (sponsored by the California Air Resources
cember 2021) chemical transport model. Their simulations                            Board; CARB), was conducted over California, 1 week prior
of aerosol mass scattering efficiency, from an aerosol spe-                         to ARCTAS-B. These evaluations examined the effects of
ciation including sulfate, ammonium, nitrate, primary and                           different mixing states of black carbon (volume averaged,
secondary organic carbon, mineral dust and sea salt, were                           core shell and externally mixed, as well as the Maxwell–

https://doi.org/10.5194/gmd-15-219-2022                                                                       Geosci. Model Dev., 15, 219–249, 2022
222                                  M. Majdzadeh et al.: Development of aerosol optical properties in GEM-MACH v2.4

Garnet mixing rule, in which black carbon is assumed to be         phase and heterogeneous chemistry, wet and dry deposition,
present in randomly distributed inclusions) on aerosol scat-       aerosol–cloud processes and aerosol microphysics (Gong et
tering and absorption properties, for wavelengths between          al., 2003a, b; Moran et al., 2010; Makar et al., 2015a, b).
250 and 700 nm, using an offline approach of the Aerosol           The model’s aerosol distribution is based on 12 particle size
Simulation Program (ASP v2.1, Alvarado et al., 2015). ASP          bins. The aerosol species in GEM-MACH consist of eight
is a single-box aerosol model, with modules to calculate           components within each size bin: ammonium, sulfate, ni-
aerosol thermodynamics, gas-to-aerosol mass transfer (con-         trate, sea salt, crustal material, black carbon, primary organic
densation/evaporation), coagulation of aerosols and aerosol        aerosol (POA) and secondary organic aerosol (SOA). The
optical properties (Alvarado et al., 2016). Using the in-          aerosol and microphysical parameterizations include parti-
struments of the NASA Langley Aerosol Research Group               cle nucleation, condensation and coagulation (Gong et al.,
(LARGE; Anderson et al., 1998), they showed that the use           2003a, b), gas and particle dry deposition (Zhang et al., 2001;
of a core-shell mixing state for black carbon, especially for      Makar et al., 2018), cloud processing and in-cloud aqueous-
fresh biomass burning episodes, led to the overestimation of       phase chemistry (Gong et al., 2006), direct and indirect feed-
aerosol absorption by 29 % to 35 %, with insignificant de-         back options (Makar et al., 2015a, b; Gong et al., 2015) and
pendence on the wavelength, while an external mixture as-          equilibrium inorganic gas–aerosol partitioning (Makar et al.,
sumption led to the underestimation of aerosol absorption,         2003). The model can be used with either one-way coupling
with a strong dependence on wavelength. Their collected ob-        (meteorology drives the chemistry) or with two-way cou-
servations suggested using an externally mixed black carbon        pling (which enables the model-generated aerosols’ impact
for the fresh smoke observations and an internally mixed           on radiative transfer – aerosol direct effect, and on radia-
core-shell approach for the aged Arctic haze and the anthro-       tive transfer via cloud formation – aerosol indirect effect;
pogenic pollution. Their implementation of a variable mixing       Makar et al., 2015 a, b). However, the default configuration
state resulted in an average overestimation of aerosol absorp-     of GEM-MACH’s photolysis calculations makes use of an
tion of 10 % at 470 nm, 17 % at 532 nm and 23 % at 660 nm.         a priori lookup table as a function of solar zenith angle and
   The mixing state of aerosols has a key impact on radia-         height. Here, we update this module, examine the effects of
tive transfer, with black carbon’s ability to absorb significant   photolysis on the aerosol feedbacks and show their relative
amounts of incoming short wavelength light and re-emit this        importance to model performance.
energy as longer wavelengths, resulting in its identification         Table 1 represents the different options for aerosol optical
as a short-term climate forcer (IPCC, 2018). However, the          calculations in the current version of GEM-MACH. The orig-
mixing state of black carbon, and the impact of that mix-          inal, precalculated, clear-sky J -value lookup table in GEM-
ing state on the radiative properties of atmospheric aerosols,     MACH is a function of solar zenith angle and height. The
varies in the literature. Tombette et al. (2008) suggested that    photolysis rates are calculated using the input data of Peter-
the mixing state of black carbon presents an insignificant ef-     son (1976) and the radiative transfer model of Dave (1972),
fect on aerosol optical thickness (AOT) calculations (RMSE         with cross sections and quantum yields taken from DeMore
difference
M. Majdzadeh et al.: Development of aerosol optical properties in GEM-MACH v2.4                                              223

a homogeneous aerosol mixture Mie scattering (Bohren and          Mie scattering code within the VECTOR model (McLinden
Huffman, 1983) code for meteorological radiative transfer         et al., 2002). Using the hygroscopic growth factor of each
calculations, and the model-generated aerosols in the feed-       aerosol type, we calculated the dry size parameter (Sect. 2.2,
back mode (Makar et al., 2015a, b) are used for radiative         Eq. 1) of the initial lookup table, which was then interpolated
transfer calculations.                                            into GEM-MACH dry size parameter. The final lookup table
   The new photolysis module in GEM-MACH (MESSy-                  which was implemented into GEM-MACH is a function of
JVAL) is based on JVAL14-MESSy of Sander et al. (2014).           GEM-MACH dry size parameters and wavelengths. The cal-
The photolysis module JVAL was adapted by Sander et al.           culated aerosol composition and size in GEM-MACH was
as a module inside the Modular Earth Submodel System              used as input for photolysis rate calculations, and a hybrid
(MESSy) interface of Jöckel et al. (2005). The original for-      aerosol mixing state was assumed for size bins containing
mulation of photolysis rates calculations was developed by        different concentrations of black carbon to calculate the op-
Landgraf and Crutzen (1998) and has been since adopted in         tical properties of four aerosol categories: black carbon, sea
several atmospheric models (Sander et al., 2014). The actinic     salt, dust and other internally mixed components.
flux calculations include the effects of aerosols and clouds         Currently, there is a size-resolved (sectional) representa-
on photolysis rates. The optical data for cloud scattering and    tion of atmospheric aerosol particles in GEM-MACH, which
absorption are adopted from Slingo (1989) (Sander et al.,         may be used for determining the impact of aerosol feedbacks
2011). The previous offline application of MESSy-JVAL in          on radiation and photolysis. When GEM-MACH’s aerosol
GEM-MACH (Chen et al., 2020) made use of a climatology            feedbacks are enabled, the aerosol direct effect makes use
of aerosol concentration (a constant aerosol vertical profile     of a Mie scattering approach and the assumption of a binary
above land and a different vertical profile over water). Cloud    mixture between dry aerosols and water for the complex re-
radiative properties and cloud fraction were calculated on-       fractive index (Makar et al., 2015a). For photolysis calcu-
line at runtime (Chen et al., 2020). The focus of this study is   lations as carried out here, we made use of GEM-MACH’s
to improve the representation of aerosol optical properties in    calculated aerosol composition and size as input for photol-
MESSy-JVAL and to determine their impact on model per-            ysis rate calculations. The new algorithm uses the eight dry
formance.                                                         chemical components of GEM-MACH aerosol (sulfate, ni-
   In the following sections, we describe the methods we          trate, ammonium, primary organic matter, secondary organic
used to improve the representation of aerosol optical prop-       matter, black carbon, dust and sea salt) and reads in the data
erties in MESSy-JVAL, followed by the evaluations of the          from the updated lookup table (see Sect. 2.2, 2.3, following)
improved photolysis module and the limitations of the model       to calculate the scattering and absorption optical depth and
in photolysis rate calculations. Section 2 provides a descrip-    asymmetry factor of black carbon, sea salt, dust and other
tion of the model configuration, simulation setup and the ob-     internally mixed components. We used the black carbon par-
servations used to evaluate the model output, calculations of     ticle size in GEM-MACH as an indicator of the mixing state
the new lookup table for aerosol optical properties and a de-     of the internally mixed particles. For each GEM-MACH size
scription of the revised photolysis rate calculations in GEM-     bin, the mass fraction of black carbon to the total mass of all
MACH. The comparison of the updated MESSy-JVAL with               the other particles in that bin was calculated. Since the ex-
the base offline version is presented in Sect. 3, followed by     ternally mixed black carbon particles are most common near
the results of different evaluations of the improved photolysis   combustion sources, if a GEM-MACH particle size bin con-
module: comparisons with observations, evaluations of the         tains a black carbon mass fraction that is near or larger than
impacts of AOD calculations and model-generated aerosols          that of a typical combustion emission particle (the black car-
on the photolysis rates calculations and a case study of pho-     bon mass fraction of more than 40 %; Stevens and Dastoor,
tolysis calculations under high pollutant flux emissions con-     2019), the particle bin was considered to be mostly black car-
ditions. The summary and conclusions of this study are pre-       bon, no absorption amplification factor was applied to black
sented in Sect. 4.                                                carbon photolysis rate calculations, and an external particle
                                                                  mixing state for that size bin was assumed (i.e., black car-
                                                                  bon as a separate particle and a volume-averaged homoge-
2     Methods                                                     neously mixture of ammonium sulfate, ammonium nitrate,
                                                                  primary and secondary organics). If the black carbon mass
2.1    Overview                                                   fraction for a particle size bin was less than 40 %, we as-
                                                                  sumed that black carbon is coated with other internal particle
In order to improve the photolysis module and calculate           components, and a core-shell configuration was used for that
aerosol feedbacks more accurately, we developed a new Mie         size bin; the black carbon forms a core and other internal
lookup table for aerosol optical properties which was ac-         particle components (primary and secondary organic matter,
cessed within the improved version of MESSy-JVAL. An              ammonium sulfate and ammonium nitrate) form a shell. In
initial lookup table was calculated using the refractive in-      this case, the black carbon is mixed with other condensed or
dices of seven representative aerosol components and the          coagulated components, the bin is more aged, and we apply

https://doi.org/10.5194/gmd-15-219-2022                                               Geosci. Model Dev., 15, 219–249, 2022
224 M. Majdzadeh et al.: Development of aerosol optical properties in GEM-MACH v2.4
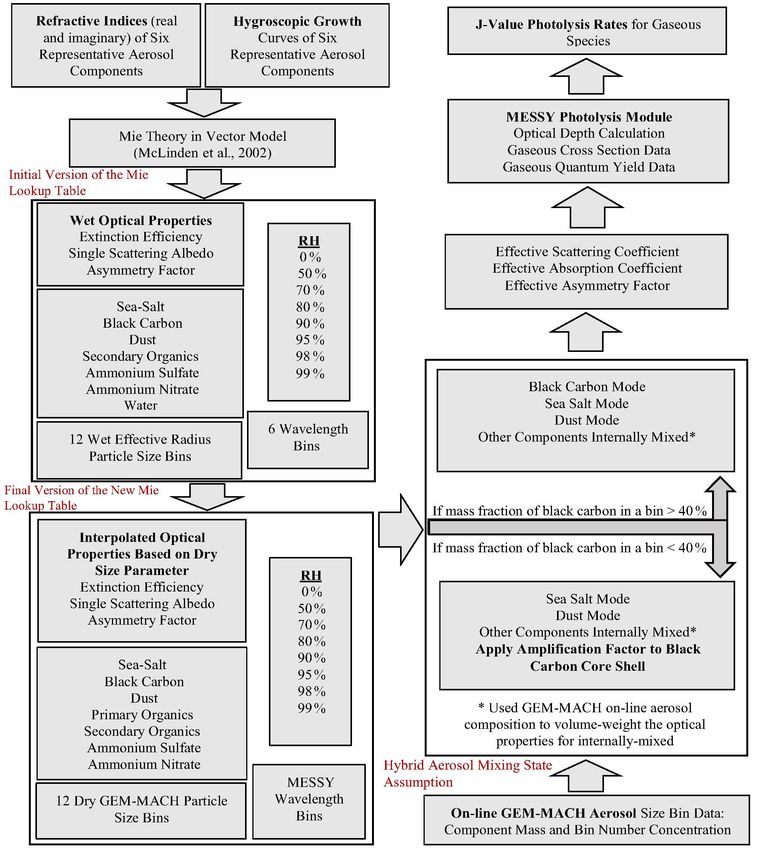
Figure 1. Steps and methods in calculating the new Mie lookup table for photolysis rates in GEM-MACH. RH represents the relative
humidity and λ is the wavelength.
a lensing correction factor to the black carbon absorption ef- 2.2 Developing a new aerosol optical properties lookup
ficiency recommended by Bond et al. (2006). It should be table for MESSy
noted that sea salt and dust were not included in the assump-
tions of the internally mixed particles, and in both cases men-
tioned above, those aerosols were considered as separate par- In order to update the aerosol effects in the MESSy photol-
ticles. These underlying assumptions were used for the calcu- ysis module in GEM-MACH, we calculated a new lookup
lations of the aerosol optical properties for four independent table using the Mie scattering code within the VECTOR
aerosol groups: sea salt, dust, black carbon and the internally model (McLinden et al., 2002) for extinction efficiency, sin-
mixed particles (see Fig. 1). We describe our methodology in gle scattering albedo and asymmetry factor for seven aerosol
more detail in the following sections. types, which within the lookup table are treated as pure-
composition particles of sea salt, black carbon, dust, ammo-
Geosci. Model Dev., 15, 219–249, 2022 https://doi.org/10.5194/gmd-15-219-2022
M. Majdzadeh et al.: Development of aerosol optical properties in GEM-MACH v2.4                                                       225

Table 2. Density and the refractive index of each aerosol type.

              Aerosol                     Density    Real part of the refractive index   Imaginary part of the refractive index
                                        (kg m−3 )       at 550 nm (at RH = 0 %)                      at 550 nm (at RH = 0 %)
              Ammonium sulfate       1.77 × 10+3                   1.53                                                  10−7
              Ammonium nitrate        1.7 × 10+3                   1.56                                                  10−9
              Dust                   2.56 × 10+3                   1.56                                              6 × 10⁻³
              Black carbon            1.8 × 10+3                   1.75                                                   0.44
              Sea salt               2.17 × 10+3                   1.49                                                 0.006
              Water                   1.0 × 10+3                   1.33                                       1.00023 × 10⁻⁸
              Organics                1.4 × 10+3                   1.53                                           1.96 × 10⁻⁹

nium sulfate, ammonium nitrate, organic carbon and pure                   Table 3. Hygroscopic growth factors (HGFs) for black carbon
water. The initial version of the new lookup table was cal-               (based on Lei et al., 2014).
culated for single components, each with its own water up-
take properties derived from the literature. One dimension                                         RH (%)      HGF
of the table is the wet particle radius range for a loga-                                          99         1.066
rithmically expanding set of cut sizes of the aerosol distri-                                      98         1.062
bution of GEM-MACH (0–10, 10–20, 20–40, 40–80, 80–                                                 95          1.05
160, 160–320, 320–640, 640–1280, 1280–2560, 2560–5120,                                             90          1.03
5120–10 240 and 10 240–20 480 nm), five wavelengths (200,                                          80          1.02
300, 400, 600, 1000 nm) and seven different relative hu-                                           70          1.01
midity levels (0 %, 50 %, 70 %, 80 %, 90 %, 95 %, 98 %,                                            50             1
99 %) for all aerosols except dust, which was assumed to                                           0              1
have no water uptake. The effective wet particle radii were
calculated based on a power-law distribution (Hansen and
Travis, 1974) of each particle range. The relative humid-
ity determines the water fraction for all other aerosol types.
                                                                          salt is based on Shettle and Fenn (1979), which relies on
The selection of wider spacing at lower relative humid-
                                                                          Dorsey (1940).
ity and longer wavelength was due to the growing depen-
                                                                             For dust, no water uptake, and thus no dependency on the
dency of optical properties to increasing relative humidity
                                                                          relative humidity, has been assumed. The complex refrac-
and decreasing wavelengths. We assumed a flat distribution
                                                                          tive index of dust is assumed to be independent of particle
of aerosol radii within each bin size. The complex refractive
                                                                          size and is obtained from the VECTOR model’s library of
indices of the water-soluble inorganic aerosols, namely am-
                                                                          refractive indices with the real part of the dust refractive in-
monium sulfate, ammonium nitrate and sea salt, were cal-
                                                                          dex varying between 1.55 and 1.57 and the imaginary com-
culated using the FORTRAN software developed by An-
                                                                          ponent increasing monotonically from 0.004i at 1000 nm to
drew Lacis (https://www.giss.nasa.gov/staff/mmishchenko/
                                                                          0.025i at 200 nm. For organic carbon, the complex refrac-
ftpcode/lacis/lacis_refrac.rhwmri.f, last access: 1 Decem-
                                                                          tive index is wavelength dependent for all relative humidities
ber 2021), which has been used in many recent studies
                                                                          and was extracted from Fast-JX, the photolysis mechanism
(Jeong, 2020; Bozzo et al., 2020; Escribano et al., 2014;
                                                                          used in GEOS-Chem. Fast-JX v7.0 calculates aerosol extinc-
Schuster et al., 2009). In this model, all aerosols are treated as
                                                                          tion efficiencies at five wavelengths: 200, 300, 400, 600 and
homogeneous mixtures. Parametric formulas are derived for
                                                                          999 nm. The file jv_spec_mie.dat (http://rain.ucis.dal.ca/ctm/
the changes in the real part of the refractive index, specific
                                                                          CHEM_INPUTS/FAST_JX/v2020-02/jv_spec_mie.dat, last
density, size and water activity as functions of mass frac-
                                                                          access: 1 December 2021) in Fast-JX v7.0 contains the quan-
tion. These formulas are used to interpolate spectrally be-
                                                                          tum yields and aerosol cross sections for photolysis. Real and
tween the refractive indices of dry ammonium sulfate, sea
                                                                          imaginary parts of the refractive index of organic carbon at
salt and ammonium nitrate and those of water. For ammo-
                                                                          98 % were obtained by linear interpolation between the in-
nium sulfate, the complex refractive index is from Toon et
                                                                          dices at RHs of 95 % and 99 %. For black carbon, the depen-
al. (1976). The water activity for this aerosol type is based
                                                                          dence on relative humidity was based on hygroscopic growth
on Tang and Munkelwitz (1994). For ammonium nitrate, the
                                                                          factors (HGFs; the ratio of the wet particle radius to the dry
real and imaginary parts of the refractive index are from Tang
                                                                          particle radius) obtained from Lei et al. (2014) (Table 3). The
et al. (1981) and Gosse et al. (1997), and the water uptake
                                                                          RH-dependent refractive index (nRH ) is a HGF3 -weighted
is from Tang (1996). The complex refractive index of sea
                                                                          mean of refractive indices of pure black carbon (nBC ) and

https://doi.org/10.5194/gmd-15-219-2022                                                         Geosci. Model Dev., 15, 219–249, 2022
226                                     M. Majdzadeh et al.: Development of aerosol optical properties in GEM-MACH v2.4

Figure 2. (a) Initial and (b) interpolated Qext (extinction efficiency) vs. dry α (size parameter) for ammonium sulfate.

pure water (nwater ):                                                    growth factor of each aerosol type (Laskina et al., 2015; Lei
      h                    i                                           et al., 2018; Zamora and Jacobson, 2013, and SOA is based
nRH = HGF3RH − 1 nwater + nBC /HGF3RH ,                         (1)      on GEOS-Chem optical lookup table, jv_spec_mie.dat) at
                                                                         each relative humidity and the wet radius of each particle
with water having a spectrally constant refractive index of              type to calculate the dry aerosol radius size.
1.333 (with no imaginary component over the relevant wave-                  Using the dry radius size and the wavelengths in the initial
length range) and pure black carbon having a spectrally con-             lookup table (200, 300, 400, 600, 1000 nm), the initial size
stant refractive index of 1.75–0.44i (Kou, 1996). The opti-              parameter was calculated using
cal properties of the primary organics were calculated using                    2π ri
the optical properties of secondary organics and pure water              αi =         ,                                             (2)
                                                                                 λi
droplets and the hygroscopic growth factor of primary organ-
ics. The refractive index of each aerosol type can be found in           where αi is the initial size parameter, ri is the dry radius of
Table 2. In order to employ the new lookup table in GEM-                 the particle, and λi is the wavelength in the initial lookup
MACH, we developed a stand-alone FORTRAN code to in-                     table. Using the same formula, the size parameter for the fi-
terpolate the optical properties of aerosols into GEM-MACH               nal lookup table was calculated based on GEM-MACH av-
wavelengths and size bins. The output of this offline program            erage dry particle size bins (7.5, 15, 30, 60, 120, 240, 480,
was used as the new lookup table for the improved version of             960, 1920, 3840, 7680 and 15 360 nm) and wavelengths (205,
the photolysis code discussed in this study. Here, we provide            287, 302, 309, 320, 370 and 580 nm). The final lookup table
a brief description of the methods we used in our calcula-               components as a function of particle size were calculated by
tions.                                                                   linear interpolation of GEM-MACH size parameter from the
   Since the initial version of the new lookup table was cal-            size parameter values in the initial version of the new lookup
culated based on wet particle sizes, we used the hygroscopic             table (see Fig. 1). The initial and interpolated extinction ef-

Geosci. Model Dev., 15, 219–249, 2022                                                        https://doi.org/10.5194/gmd-15-219-2022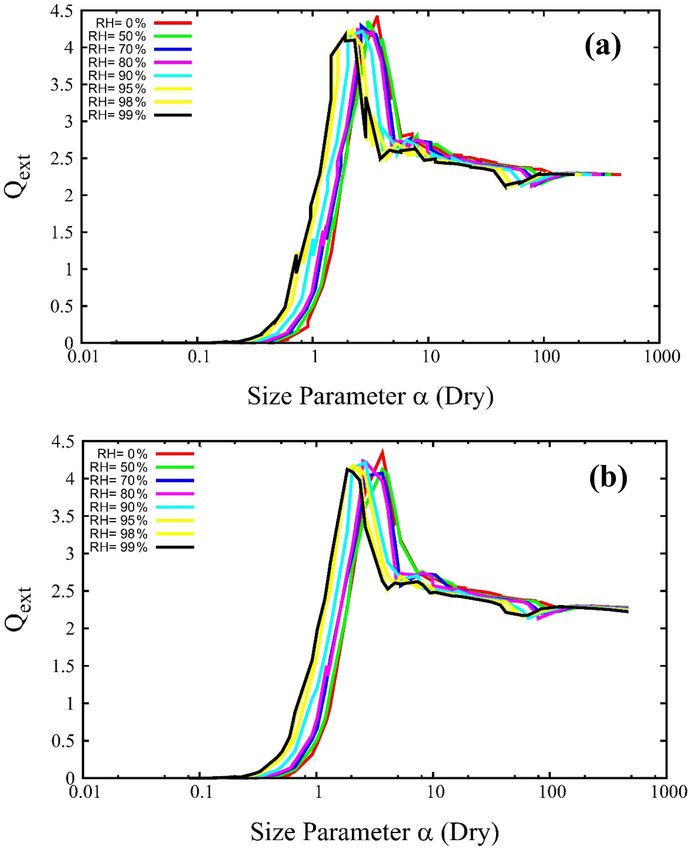
M. Majdzadeh et al.: Development of aerosol optical properties in GEM-MACH v2.4                                                   227

ficiency of ammonium sulfate vs. dry aerosol size parameter        using the volume-weighted hygroscopic growth factor of the
is illustrated in Fig. 2. The final interpolated lookup table of   components in the core-shell particle and the total wet radius
extinction efficiency, single scattering albedo and asymme-        of the core (black carbon) and shell (secondary organics, am-
try factor was used to calculate the absorption and scatter-       monium sulfate and ammonium nitrate) in that particle. This
ing cross section and asymmetry factor of seven pure aerosol       information was used to calculate the size parameter of the
types (sea salt, black carbon, dust, ammonium sulfate, am-         black carbon core (αBC ) and the total particle size parameter
monium nitrate, primary organic carbon and secondary or-           (αtotal ). The absorption amplification factor for the case of
ganic carbon) in GEM-MACH. The data in the lookup table            black carbon core shell was calculated using the core-shell
are sorted by increasing size parameter values (based on the       parameterization by Bond et al. (2006) with the observation-
dry aerosol sizes) for each aerosol type and relative humid-       ally constrained maximum threshold of 1.93 (Bond et al.,
ity; i.e., the optical properties in the lookup table depend on    2006). As described below, these parameters are used to pro-
the water uptake for the given relative humidity.                  vide an amplification factor based on previous core-shell Mie
                                                                   scattering calculations carried out by Bond et al. (2006).
2.3   Updating the photolysis module in the                           Sea salt, dust and black carbon (when its mass fraction
      GEM-MACH inline chemical transport model                     was >40 %) aerosols were assumed to be externally mixed
                                                                   at all times – their effective scattering coefficient (scac ), ab-
After calculating the new lookup table, we modified the            sorption coefficient (absc ) and asymmetry factors (asymc ) of
MESSy-JVAL code to use the new lookup table, along                 each of these aerosols were calculated using the elements
with the calculated aerosol composition and size by GEM-           of the lookup table and GEM-MACH’s predicted concentra-
MACH, as input for photolysis rate calculations. The new up-       tions for these aerosol species:
dated code uses the eight dry chemical components of GEM-
MACH aerosol feedback (sulfate, nitrate, ammonium, black
carbon, primary organic matter, secondary organic matter,                   X12
dust and sea salt) and the data in the updated lookup table to     scac =     i=1
                                                                                    Qexti × ssai × Ni × π × ri2                   (4)
calculate scattering and absorption optical depth and asym-                 X12
                                                                   absc =     Q
                                                                           i=1 exti
                                                                                          × (1 − ssai ) × Ni × π × ri2            (5)
metry factor of black carbon, sea salt, dust and other inter-              X12
nally mixed components. The volume concentration of each           asymc =      ag        × mfi ,                                 (6)
                                                                             i=1 i
aerosol type (m3 of each aerosol per m3 of air) was calcu-
lated using the GEM-MACH predicted mass concentration
(µg kg−1 ) and the density (kg m−3 ) of each aerosol type (see     where subscript c denotes each aerosol category, for each size
Table 2). The number concentration of each aerosol (number         bin (i) in GEM-MACH (i = 1 to 12), Qext is the extinction
of aerosols per 1 m3 of air) was calculated by dividing the        efficiency of each aerosol type, Ni is the number concentra-
volume concentration of the aerosol by the volume of each          tion of each aerosol type (cm−3 ), ri is the radius of bin i
size bin. We used the predicted mass concentration of nitrate      (cm), ssai is single scattering albedo of each aerosol type, ag
in GEM-MACH and the molecular weight of ammonium ni-               is the asymmetry factor, and mfi is the fraction of the mass
trate to calculate the mass concentration of ammonium ni-          concentration of each aerosol type to the total mass concen-
trate. Finally, to conserve the mass of ammonium, and since        tration of all particles (the asymmetry factor was weighted
ammonium sulfate, ammonium bisulfate and letovicite have           by mass fraction for pure particles). In the case where the
very similar refraction indices, the remaining mass of am-         mass fraction of black carbon for a particle size bin was less
monium and the mass concentration of sulfate were used to          than 40 %, the effective scattering and absorption coefficient
calculate the mass concentration of ammonium sulfate.              of black carbon was calculated using
   In order to implement the core-shell parameterization
where the mass fraction of black carbon is less than 40 %
in a particle bin in GEM-MACH, we calculated the number                      X12
                                                                                                               2
of particles with a black carbon core (NBC ) and the mass con-     scaBC =      i=1
                                                                                      Qexti × ssai × Ni × π × rBC                 (7)
                                                                             X12
centration of black carbon (MBC ) for those specific size bins.    absBC =                                            2
                                                                                      Qexti × (1 − ssai ) × Ni × π × rBC × amp,   (8)
                                                                                i=1
Using the two values, the dry black carbon core size was cal-
culated as follows:
        s
                   MBC                                             where rBC is the radius of black carbon core particle and amp
rBC = 3                         ,                           (3)    is the absorption amplification factor by Bond et al. (2006),
          NBC × ρBC × 43 × π
                                                                   based on the black carbon core and shell size parameters.
where rBC is the dry radius of the black carbon core of a par-     For the fourth aerosol category in each GEM-MACH size bin
ticle and ρBC is the density of black carbon (void-free black      (volume-averaged internally mixed particles), we calculated
carbon core density of 1.8 g cm−3 ; McMeeking et al., 2010).       the volume fraction (vf) of each component (ammonium sul-
The total wet radius of a core-shell particle was calculated       fate, ammonium nitrate, primary and secondary organics) to

https://doi.org/10.5194/gmd-15-219-2022                                                    Geosci. Model Dev., 15, 219–249, 2022
228                                  M. Majdzadeh et al.: Development of aerosol optical properties in GEM-MACH v2.4

the total volume of the internally mixed particles:

vi(IM) = vi(AS) + vi(AN) + vi(OC) + vi(PC)                 (9)
        vi(AS)          vi(AN)          vi(OC)
vfAS =         , vfAN =        , vfOC =        ,
        vi(IM)          vi(IM)          vi(IM)
             vi(PC)
     vfPC =         ,                                     (10)
             vi(IM)
where vi is the volume concentration of each aerosol in the
internally mixed particles, IM stands for the internally mixed
particles, AS is ammonium sulfate, AN is ammonium nitrate,
OC is secondary organic matter, and PC is primary organic
matter. Equations (11) to (13) were used to calculate the ef-
fective scattering and absorption coefficients and asymmetry
factor of internally mixed particles:
        X12 X4
scac =      i=1
                       Q
                   j =1 exti,j
                               × ssai,j × vfi,j × Ni

     × π × ri2                                          (11)
       X12 X4                                                     Figure 3. GEM-MACH model North American domain, with
absc =    i=1
                   Q
               j =1 exti,j
                           × (1 − ssai,j ) × vfi,j × Ni           10 km × 10 km horizontal grid resolution.
    × π × ri2                                             (12)
        X12 X4
asymc =             ag × vfi,j × mfi ,                    (13)    through the entire column at each grid point and for each
            i=1 j =1 i,j
                                                                  wavelength (λ) gives the total modeled AOD at that wave-
where the indices (j = 1, 2, 3, 4) correspond to each aerosol     length. This information was used to calculate J values for
type inside the internally mixed particles (ammonium sul-         photolysis reactions depending on the attenuation of the ra-
fate, ammonium nitrate, secondary organic carbon, primary         diation stream by particles.
organic carbon). Note that the calculations using Eqs. (4) to
(8) and (11) to (13) were done for each horizontal grid point,    2.4   Simulation setup and emissions
vertical level, wavelength and relative humidity.
   We performed a linear interpolation of the relative humid-     For this study, we used GEM-MACH v2.4, with 12-bin av-
ity in the lookup table for all the aerosol types, with the ex-   erage size distribution of particles, and online aerosol feed-
ception of dust aerosol (which had no water uptake), to cal-      backs between weather and air quality (Makar et al., 2015a,
culate the scattering and absorption coefficients at each given   b). The model domain covers most of continental Canada and
relative humidity in GEM-MACH. Scattering and absorption          the United States with a horizontal grid spacing of 10 km, 80
optical depth for each model layer and aerosol category were      hybrid vertical levels with a model top at 0.1 hPa, 15 min op-
calculated by the following formula:                              erator splitting time step and a 1 h output time step (Fig. 3).
                                                                  The meteorological initial and boundary conditions for our
τsca = scac × dz                                          (14)    10 km horizontal resolution simulations were from the oper-
τabs = absc × dz,                                         (15)    ational Regional Deterministic Prediction System, ECCC’s
                                                                  operational numerical weather predictions system (RDPS,
where τsca and τabs are the scattering and absorption optical     Caron and Anselmo, 2014). The chemical boundary condi-
depth of each aerosol category and dz is the vertical level       tions are 3-month mean climatology from the global chemi-
thickness. The total scattering and absorption optical depth      cal transport model MOZART-4 (Model for Ozone and Re-
at each vertical level for each aerosol category (black carbon,   lated chemical Tracers, version 4; Emmons et al., 2010).
sea salt, dust and internally mixed particles) was calculated        The Canadian anthropogenic emissions used in our simu-
using                                                             lations were obtained from the Canadian Air Pollutant Emis-
                                                                  sions Inventory (ECCC, 2021a), including the 2015 Cana-
τabs = absc × dz                                          (16)    dian area and point source emissions and 2013 Canadian
                X4
Total (τabs ) =      τ                                    (17)    transportation (on-road and off-road) emissions. A projected
                 c=1 absc
                X4        τscac                                   2017 US anthropogenic emissions inventory was obtained
Total (asym) =     c=1 Total (τsca )
                                     asymc .              (18)    from the US Environmental Protection Agency (EPA) 2011
                                                                  air emissions modeling version 6.3 platform (EPA, 2021a;
In the above summations, c represents each aerosol category.      Eyth et al., 2013) and the 2008 Mexican inventory was ob-
Integrating the total scattering and absorption optical depth     tained from the EPA’s 2011 air emissions modeling version

Geosci. Model Dev., 15, 219–249, 2022                                               https://doi.org/10.5194/gmd-15-219-2022
M. Majdzadeh et al.: Development of aerosol optical properties in GEM-MACH v2.4 229
6.2 platform (EPA, 2021b). The SMOKE (Sparse Matrix Op- Goddard Aerosol Assimilation System (GAAS) along with
erator Kerner Emissions; SMOKE, 2021) was used to pre- standard meteorological parameters (Buchard et al., 2015,
pare hourly gridded emissions files for GEM-MACH from 2016, 2017). Quality-controlled AOD at 550 nm is assimi-
these three national annual inventories. The North American lated every 3 h by MERRA-2 into GEOS-5/GOCART mod-
wildfire emissions for the 2018 fire season were produced by eling system (Randles et al., 2017). The MERRA-2 reanaly-
the Canadian Forest Fire Emissions Prediction System (CF- sis products use several satellite and ground-based measure-
FEPS) developed by the Canadian Forest Service (CFS) of ment data, including MODIS Aqua and Terra, MISR and
Natural Resources Canada. The CFFEPS model consists of AERONET measurements. The monthly MERRA-2 aerosol
a fire-growth model, a fire emissions model and a thermo- optical depth analysis v5.12.4 data in this study (GMAO,
dynamic model to calculate fuel consumption, fire energy, 2015) were obtained from the Goddard Earth Sciences Data
the height of a smoke plume and emissions (Anderson et al., and Information Services Centre (GIOVANNI, 2020) plat-
2011; Chen et al., 2019). CFFEPS uses the Canadian Forest form, with a spatial resolution of 0.625◦ × 0.5◦ longitude by
Fire Danger Rating System (CFFDRS), including the Cana- latitude.
dian Fire Weather Index (FWI) system (Van Wagner, 1987) For ground-based measurements, we used quality as-
to provide input data on fuel moisture, and the Canadian For- sured AERONET Sun photometer measurements of AOD at
est Fire Behaviour Prediction (FBP) system (Forestry Canada 500 nm for North American sites (Fig. 4). The Sun triplet
Fire Danger Group, 1992) for predictions of surface, crown measurements are performed every 15 min for older model 4
and total fuel consumption. Smoke emissions input data for instruments and every 3 min for newer model 5 and CE318-
CFFEPS are collected by the Canadian Wildland Fire Infor- T instruments (Giles et al., 2019). The AERONET data used
mation System (CWFIS, 2020; Lee et al., 2002). The model in this study are cloud screened according to the AERONET
has been integrated into the ECCC FireWork air quality fore- V3 algorithm described in Giles et al. (2019). We used the
cast system (Pavlovic et al., 2016) and has been operational Ångström exponents provided by the Sun photometer within
since May 2019. The version of CFFEPS used in this work AERONET data to evaluate the model AOD at 580 nm. The
is described elsewhere (Makar et al., 2021). Ångström exponent (AE) represents the wavelength (λ) de-
pendency of AOD, provides basic information about the size
2.5 Observations distribution of aerosols and is calculated by the following for-
mula:
Measurement data from MAIAC (Multi-Angle Implemen- d ln (AOD)
tation of Atmospheric Correction; Lyapustin et al., 2018), AE = − . (19)
d ln (λ)
VIIRS (Visible Infrared Imaging Radiometer Suite; Hillger
et al., 2013), the MERRA-2 reanalysis (Modern-Era Retro- To calculate AOD at 580 nm, we used a variation of the above
spective analysis for Research and Applications – version 2, formula:
GMAO, 2015) and AERONET ground-based measurements −AE
were used in this study to evaluate the modifications in the AOD1 λ1
= , (20)
photolysis module in GEM-MACH. AOD2 λ2
MAIAC is an advanced algorithm which produces global where AOD1 and AOD2 are the aerosol optical depth at 500
AOD from MODIS (Moderate Resolution Imaging Spectro- and 580 nm, and λ1 and λ2 are 500 and 580 nm wavelengths,
radiometer) Terra and Aqua satellite data. NASA’s Terra and respectively. We used (440–675 nm) Ångström exponent to
Aqua satellites are in polar orbits. The MODIS instruments obtain the observed AOD at 580 nm, which was used to com-
have a global coverage of 1–2 d in 36 spectral bands between pare with GEM-MACH output AOD calculated as described
0.405 and 14.385 µm. For the purpose of this study, we used in Sect. 2.3.
MAIAC gridded daily average AOD data at 550 nm, with
1 km spatial resolution (Lyapustin and Wang, 2018). VIIRS 2.6 Simulation plan
is one of the Earth-observing instruments aboard the Suomi
National Polar-Orbiting Partnership (Suomi NPP) satellite. We performed two simulations for June 2018 with the previ-
Level 2 VIIRS AOD data at 550 nm with a spatial resolution ous and improved versions of MESSy-JVAL and compared
of 6 km at nadir were used in this study (Kondragunta, et the results with AERONET measurements, to investigate the
al., 2012). The MERRA-2 atmospheric reanalysis assimila- effects of the modifications of the photolysis module. In ad-
tion system produced by NASA’s Global Modeling and As- dition, we carried out an additional set of six simulations
similation Office (GMAO) is the second and updated ver- with the improved version of MESSy-JVAL for the months
sion of the original MERRA atmospheric reanalysis (Rie- of January 2018 and June 2018. These simulations included
necker et al., 2011; Gelaro et al., 2017). MERRA-2 includes different configurations for AOD calculations and interactive
aerosol reanalysis using GEOS-5 coupled with the Goddard weather feedback in the GEM-MACH model and were used
Chemistry, Aerosol, Radiation and Transport model (GO- to evaluate the effects of AOD calculations and the online
CART; Chin et al., 2002; Colarco et al., 2010). It uses the aerosol feedback on the photolysis rates over the entire North
https://doi.org/10.5194/gmd-15-219-2022 Geosci. Model Dev., 15, 219–249, 2022230 M. Majdzadeh et al.: Development of aerosol optical properties in GEM-MACH v2.4
Figure 4. North American AERONET sites. AOD data from these stations are used in this study.
American domain and over specific industrial and urban ar- 3 Results and discussion
eas. A list of all the simulations is given in Table 4. The spa-
tial and temporal resolutions are the same (as described in 3.1 Comparison of base and improved MESSy-JVAL
Sect. 2.4) for all the simulations.
Note that in the “no-feedback” simulations, aerosol optical In this section, the results of two simulations with the GEM-
(and cloud condensation nucleation) properties come from MACH model for the month of June 2018 are compared
default climatological properties used in the GEM weather to AERONET Sun photometer measurements of AOD at
forecast model (Makar et al., 2015a, b). That is, our “no- 500 nm at four North American sites (shown in Fig. 4):
feedback” simulation is not a “no-aerosol” simulation – simulation Sb with the previous version on MESSy-JVAL
rather, the “no-feedback” simulation makes use of spatially (base) and simulation S1 with the improved photolysis mod-
invariant, “typical” optical properties of our weather fore- ule (see Table 4). The simulated GEM-MACH AOD out-
cast model. Having “no AOD” in this case means that model put was compared with AERONET Sun photometer mea-
aerosol AOD had not been calculated since it is not used in surements of AOD at 580 nm for all North American sites
the feedback code. Further, the aerosol feedback on meteo- in Fig. 4. As mentioned in Sect. 2.5, we used (at 440–
rology code developed in a previous study for the GEM ra- 675 nm) the Ångström exponent to obtain the AERONET
diative transfer scheme (Makar et al., 2015a, b). In the feed- AOD at 580 nm. The statistical analysis of the output from
back mode, GEM-MACH uses a separate Mie calculation for the two GEM-MACH simulations (base and improved) and
generating a lookup table online, using the particle mass size AERONET AOD at 580 nm for June 2018 at four Canadian
distribution predicted internally by MACH at each time step sites – Egbert, Fort McKay, Saturna Island and Toronto –
but with a single typical complex refractive index. In con- are shown in Fig. 5. As shown in these plots, the normal-
trast, our photolysis rate calculations and the AODs we cal- ized mean bias (NMB), which represents the mean paired
culate in the current work are decoupled from this feedback differences between the model and measurements normal-
portion of the model. Our next step in this work is to further ized by the mean measurements, ranges within ±13 % for
modify the GEM radiation code to include the particle chem- the improved version and 0 %–150 % for the base version.
ical composition online and our hybrid particle mixing state The NMB calculations from the improved version show an
assumptions as an alternative to the existing AOD calculation overprediction of AOD in Saturna Island and an underpredic-
within the feedback portion of the code. tion of AOD in Toronto, Fort McKay and Egbert, whereas the
base version shows a significant overprediction of AOD for
all four sites. The root mean square error (RMSE) is signif-
icantly smaller in the improved version, with less variability
Geosci. Model Dev., 15, 219–249, 2022 https://doi.org/10.5194/gmd-15-219-2022M. Majdzadeh et al.: Development of aerosol optical properties in GEM-MACH v2.4 231
Table 4. List of simulations performed in this study.
Simulation Date Improved Aerosol AOD
name MESSy-JVAL feedback calculations
Sb June 2018 No Yes No
S1 June 2018 Yes Yes Yes
S2 June 2018 Yes Yes No
S3 June 2018 Yes No Yes
S4 June 2018 Yes No No
W1 January 2018 Yes Yes Yes
W2 January 2018 Yes Yes No
around the mean as shown in the standard deviation (σ ) plots.
The correlation coefficient plots show better results with the
improved version of MESSy-JVAL for all four sites. We cal-
culated a correlation relation of R = 0.17 for the base run
and R = 0.37 for the improved version for all North Ameri-
can AERONET sites.
The base MESSY module uses a climatology for aerosol
number density with one fixed vertical profile for grid cells
over land and another fixed vertical profile over water (see
Table 1). The uniformity of the fixed profiles does not ac-
count for the real atmospheric variability resulting in the
larger differences between model and observed aerosol op-
tical depths for the base MESSY version.
3.2 Evaluation of the improved MESSY-JVAL
In this section, we evaluate the GEM-MACH output with
the improved photolysis module against the observations and
assess the effects of (1) AOD calculations (vs. an assumed
aerosol optical depth of zero) and (2) interactive aerosol feed-
back with the GEM model, on the resulting calculated pho-
tolysis rates (see Table 4).
3.2.1 Comparison with observations
As described in Sect. 2.6, we performed six simulations
for the months of January and June 2018, using the GEM-
MACH model with the updated lookup table and photoly-
sis module. We compared the simulated GEM-MACH AOD
with AERONET Sun photometer measurements of AOD at
580 nm (converted from AOD at 500 nm using the 440–
675 nm Ångström exponent) for the entire simulation period
(January and June 2018) and for all North American sites in
Fig. 4. Figure 5. Statistical scores of GEM-MACH AOD with the previous
Figure 6 illustrates the time series of AERONET and (base) and the improved version of MESSy-JVAL vs. AERONET
AOD at 580 nm in June 2018 at four Canadian AERONET sites: Eg-
GEM-MACH hourly AOD output at 580 nm for the Fort
bert (44.23◦ N, −79.78◦ W), Fort McKay (57.18◦ N, −111.64◦ W),
McKay and Toronto AERONET sites. The output from sim- Saturna Island (48.78◦ N, −123.13◦ W) and Toronto (43.79◦ N,
ulations S1 (with AOD calculations and online aerosol feed- −79.47◦ W).
backs, June 2018) and W1 (with AOD calculations and on-
line aerosol feedbacks, January 2018) were used to plot these
time series.
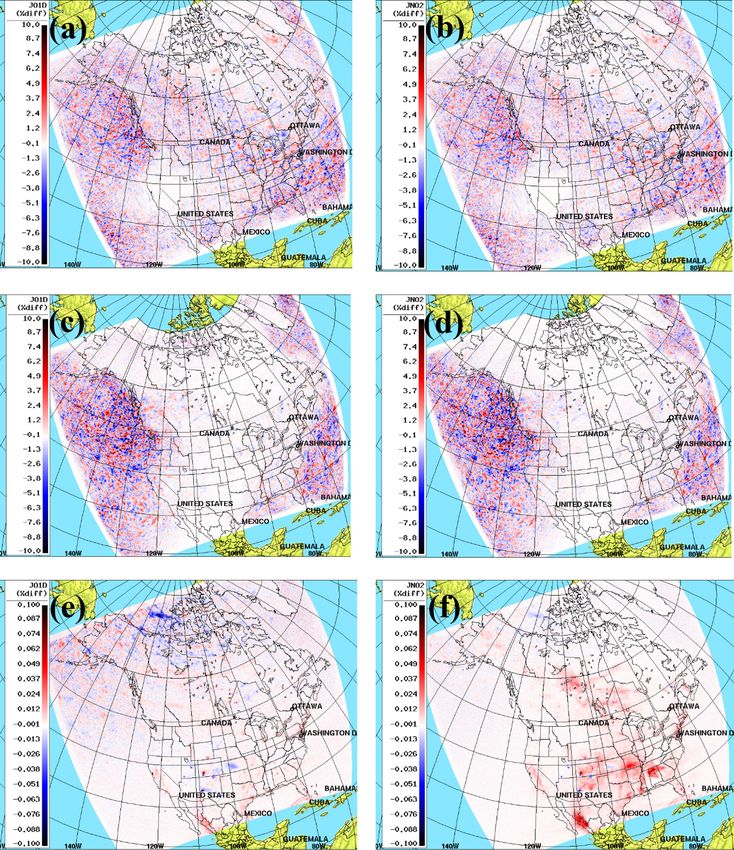
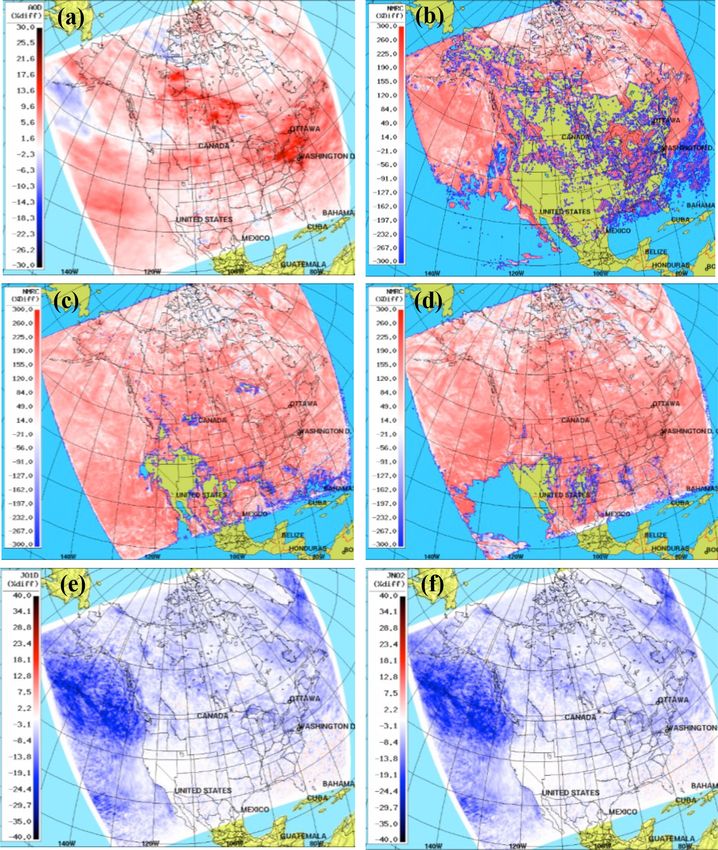
https://doi.org/10.5194/gmd-15-219-2022 Geosci. Model Dev., 15, 219–249, 2022232 M. Majdzadeh et al.: Development of aerosol optical properties in GEM-MACH v2.4 Figure 6. Time series of hourly AERONET and GEM-MACH AOD at 580 nm at the Fort McKay (57.18◦ N, −111.64◦ W) and Toronto (43.79◦ N, −79.47◦ W) AERONET stations. (a, b) June 2018, (c, d) January 2018. The zero simulated values of AOD (black dots on the x axis) represent no calculation of molecular dissociation by sunlight in the model during nighttime hours. As shown in this figure, the sample size for Toronto is (NMB) ranges within ±13 % in summer and ±32 % in win- larger than that for Fort McKay for both seasons. During the ter. The NMB calculations show an overprediction of AOD sampling period in the summer of 2018, there was an instru- in Saturna Island for both seasons and Fort McKay in winter, ment malfunction at Fort McKay from 19 June to 20 August whereas there is an underprediction of AOD in Toronto and , which led to it having a smaller number of data points at Egbert for both seasons. The root mean square error (RMSE) this site compared to Toronto. As shown in these time se- plots show a better fit of the model AOD to measurements in ries, the maximum value of the modeled AOD was underes- winter season. The standard deviation (σ ) plots show more timated compared to AERONET data for both sites and both variability around the mean in AERONET measurements for simulation periods. For example, the maximum AERONET both seasons compared to model values. AODs for the month of June in Fort McKay and Toronto were Figure 9 shows the monthly averaged daytime AOD at ∼ 0.27 and ∼ 0.42, respectively, whereas the GEM-MACH 580 nm from GEM-MACH simulations and MERRA-2 re- AODs (simulations S1 and W1) were ∼ 0.19 and ∼ 0.29 for analysis. The total monthly averaged aerosol Ångström pa- those sites. rameter (470–870 nm) and Eq. (20) were used to calcu- Scatter plots of AERONET AOD vs. GEM-MACH AOD late MERRA-2 AOD at 580 nm (with different scales in (from simulations S1 and W1) at 580 nm for all North Amer- summer and winter plots). As shown in the summer plots, ican sites, Fort McKay and Toronto AERONET stations are GEM-MACH captured four major forest fire events during shown in Fig. 7. The total number of measurements is N = the month of June 2018: the Lac La Loche forest fire in 9759 for summer and N = 4077 for winter for all AERONET Saskatchewan (25 June 2018), La Plata County’s 416 fire sites. As shown in the top row of Fig. 7, the correlation coef- in Colorado (1 June 2018), Ute Park fire in New Mexico ficient (R) between the model and measurements is 0.37 for (1 June 2018) and Gila National Forest fire in New Mex- summer and 0.49 for winter. There is a higher correlation for ico (May–July 2018). Higher values of AOD over the Pa- Toronto compared to Fort McKay for both seasons. cific Ocean over the month of January 2018 can be seen The statistical scores of GEM-MACH vs. AERONET on both GEM-MACH and MERRA-2 plots. As shown in AOD at 580 nm for January and June 2018 at four Canadian Fig. 9d, there is an AOD hotspot over central Alberta in Jan- AERONET sites – Egbert, Fort McKay, Saturna Island and uary which was not captured by GEM-MACH (Fig. 9b). The Toronto – are shown in Fig. 8. It should be noted that the location of the hotspot in central Alberta in the winter sea- number of coincident data points is considerably smaller in son in the MERRA-2 product is coincident with the location winter. As shown in these plots, the normalized mean bias of coal-fired power plants and oil refinery emissions of SO2 . Geosci. Model Dev., 15, 219–249, 2022 https://doi.org/10.5194/gmd-15-219-2022
You can also read