Effects of oligomerization and decomposition on the nanoparticle growth: a model study - Recent
←
→
Page content transcription
If your browser does not render page correctly, please read the page content below
Research article
Atmos. Chem. Phys., 22, 155–171, 2022
https://doi.org/10.5194/acp-22-155-2022
© Author(s) 2022. This work is distributed under
the Creative Commons Attribution 4.0 License.

                   Effects of oligomerization and decomposition
                    on the nanoparticle growth: a model study
              Arto Heitto1 , Kari Lehtinen1,2 , Tuukka Petäjä3 , Felipe Lopez-Hilfiker4,a , Joel A. Thornton4 ,
                                        Markku Kulmala3 , and Taina Yli-Juuti1
                   1 Department   of Applied Physics, University of Eastern Finland, 70211 Kuopio, Finland
                                   2 Finnish Meteorological Institute, 70211 Kuopio, Finland
       3 Institute for Atmospheric and Earth System Research/Physics, University of Helsinki, 00014 Helsinki, Finland
                   4 Department of Atmospheric Sciences, University of Washington, 98195 Seattle, WA, USA
                                     a present address: Tofwerk AG, 3600 Thun, Switzerland

                                      Correspondence: Arto Heitto (arto.heitto@uef.fi)

                                      Received: 5 July 2021 – Discussion started: 14 July 2021
                        Revised: 22 October 2021 – Accepted: 23 November 2021 – Published: 5 January 2022

       Abstract. The rate at which freshly formed secondary aerosol particles grow is an important factor in deter-
       mining their climate impacts. The growth rate of atmospheric nanoparticles may be affected by particle-phase
       oligomerization and decomposition of condensing organic molecules. We used the Model for Oligomerization
       and Decomposition in Nanoparticle Growth (MODNAG) to investigate the potential atmospheric significance
       of these effects. This was done by conducting multiple simulations with varying reaction-related parameters
       (volatilities of the involved compounds and reaction rates) using both artificial and ambient measured gas-phase
       concentrations of organic vapors to define the condensing vapors. While our study does not aim at providing
       information on any specific reaction, our results indicate that particle-phase reactions have significant potential
       to affect the nanoparticle growth. In simulations in which one-third of a volatility basis set bin was allowed to go
       through particle-phase reactions, the maximum increase in growth rates was 71 % and the decrease 26 % com-
       pared to the base case in which no particle-phase reactions were assumed to take place. These results highlight
       the importance of investigating and increasing our understanding of particle-phase reactions.

1   Introduction                                                   cles such as soot particles are quite often non-hygroscopic,
                                                                   which hinders their activation as CCN (e.g., Zhang et al.,
                                                                   2008). However, atmospheric aging typically enhances their
Aerosols are ubiquitous in the atmosphere, and they affect         solubility and alters their morphology towards being CCN
our climate in multiple ways. Directly they can affect the ra-     active (Tritscher et al., 2011; Lambe et al., 2015). On the
diative forcing by reflecting, refracting and absorbing sun-       other hand, the secondary aerosols that are formed in the at-
light and indirectly by acting as cloud condensation nuclei        mosphere via gas-to-particle conversion (e.g., Kulmala et al.,
(CCN) and forming clouds (Boucher et al., 2013). The effect        2014) need to undergo substantial growth until they reach
of aerosol–cloud interactions in the Earth’s radiative balance     sizes relevant for CCN activation (Kerminen et al., 2012).
is one of the biggest uncertainties we have in recent climate      Regardless, it is estimated that approximately half of the par-
models and studies (IPCC, chap. 7, Boucher et al., 2013).          ticles acting as CCN are formed in the atmosphere by nucle-
   For an aerosol particle to act as CCN, it needs to be large     ation from atmospheric gases (Merikanto et al., 2009; Para-
enough in size, at least some tens of nanometers in diame-         monov et al., 2015).
ter (Pierce and Adams, 2007; Reddington et al., 2017). This           Organic molecules play an important role in the early state
can be, on one hand, a limiting factor for climate impacts of      of the growth of atmospheric particles (Wehner et al., 2005;
small primary aerosols as Aitken-mode-sized primary parti-

Published by Copernicus Publications on behalf of the European Geosciences Union.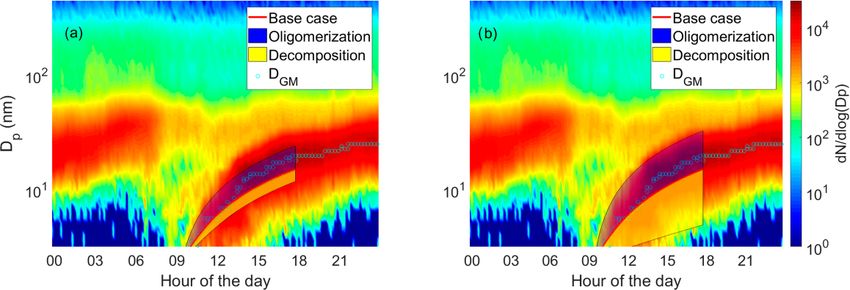
156                                 A. Heitto et al.: Effects of oligomerization and decomposition on the nanoparticle growth

Kerminen et al., 2012; Kulmala et al., 2013; Shrivastava et         tified gas-phase concentrations with a series of assumptions
al., 2017; Mohr et al., 2019; Yli-Juuti et al., 2020). Gas-phase    about particle-phase reaction properties. These simulations
oxidation of volatile organic compounds produces a variety          are subsequently used to determine the range of properties
of molecules, some of which condense on particles and form          to which particle growth is sensitive. In Case 2, simulations
secondary organic aerosol (SOA) (Hallquist et al., 2009).           constrained by atmospheric observations are performed in or-
How much a compound contributes to the particle growth is           der to estimate the extent to which particle-phase reactions
to a large extent controlled by their gas-phase concentration       can impact particle growth. This will allow us to investigate
and volatility. In recent studies, nanoparticle growth simu-        the sensitivities of predicted growth for reactions and the re-
lated based on the observed organic vapor concentrations and        lated properties but will not infer what kind of reactions take
estimated saturation vapor concentrations have been found in        place in the atmospheric nanoparticles.
fairly good agreement with observed particle growth in an at-
mospheric environment (Mohr et al., 2019) and in laboratory
(Stolzenburg et al., 2018), although uncertainties are asso-
ciated with both the measured gas-phase concentrations and
the estimated saturation concentrations.                            2     Methods
   In addition to gas-phase reactions, particle-phase reactions
can increase or reduce the volatility. One pathway for more         2.1    Model description
volatile compounds to affect the growth is by oligomeriza-
tion in the particle phase (Tolocka et al., 2004; Hall and          The Model for Oligomerization and Decomposition in
Johnston, 2012). Studies have reported that oligomers are in        NAnoparticle Growth (MODNAG) was developed based on
abundance in SOA and that they may contribute up to 50 %            MABNAG (Yli-Juuti et al., 2013) and is used in this study.
of organic mass in them (Gao et al., 2004; Denkenberger et          MODNAG is a single-particle growth model that simulates
al., 2007; Hall and Johnston, 2011; Kourtchev et al., 2016).        the time evolution of particle size and composition based
In oligomerization two or more smaller molecules combine            on ambient gas-phase concentrations of condensing com-
with each other forming larger oligomer molecules which             pounds, temperature and relative humidity (RH). In this
are likely less volatile, i.e., less likely to evaporate. In con-   study, the system consists of multiple organic compounds,
trast, if a molecule decomposes inside a particle, it breaks        water, sulfuric acid and ammonia.
down forming new smaller molecules. These molecules tend               The organics are divided into four groups (I–IV): three
to have higher volatility than the original molecule and thus       groups (I–III) that condense from the gas phase and one
may evaporate back to the gas phase, hindering the particle         group (IV) that includes oligomerization and decomposition
growth even if the original molecule would have preferred           products that are formed in the particle phase during the
to stay in the particle phase. Recent studies have reported a       simulation. The three condensing groups (I–III) all include
wide range of different oligomerization and decomposition           seven organic compounds which are defined by their satura-
rates in multiple reactions. For example, several studies have      tion concentration (C ∗ ) using volatility basis set (VBS; Don-
been conducted optimizing a model to measurements using             ahue et al., 2011), in which the volatility bins range from
oligomerization and decomposition reactions as fitting pa-          C ∗ = 10−4 µg m−3 to C ∗ = 102 µg m−3 . The bin with C ∗
rameters. The fitted reaction rates for oligomerization have        of 10−4 µg m−3 is defined as extremely low-volatile organic
ranged between 10−26 and 2.8 × 10⁻¹⁴ cm3 molec.−1 s−1               compounds (ELVOCs), bins from 10−3 to 10−1 µg m−3 as
(Kolesar et al., 2015; Roldin et al., 2014; Vesterinen et al.,      low-volatile organic compounds (LVOC) and bins from 100
2007) and for decomposition between 10−5 and 10−2 s−1               to 102 µg m−3 as semi-volatile organic compounds (SVOCs)
(Kolesar et al., 2015; Roldin et al., 2014; D’Ambro et al.,         based on Donahue et al. (2013). The three condensing groups
2018; Trump and Donahue, 2014). However, as the identi-             (I–III) differ in terms of what kind of reactions they can go
ties of the organic compounds participating in atmospheric          through in the particle phase. Organic group I is called non-
nanoparticle growth are largely unknown or uncertain, there         reactant group, and these compounds will not go through any
is a lack of knowledge on the particle-phase reactivity and         reactions in the particle phase. The compounds in organic
reaction rates of the molecules in the condensed phase.             group II, called oligomerization group, can combine with
   In this study we use an atmospheric process model to study       each other in the particle phase, forming new compounds,
how the particle-phase oligomerization and decomposition            dimers. The compounds in organic group III, called decom-
influence the growth of atmospheric nanoparticles. Particu-         position group, can fragment into two smaller compounds
larly, our aim is to explore how much particle-phase reac-          in the particle phase. The products of the reactions from
tions can affect nanoparticle growth and further to compare         the oligomerization and decomposition groups form organic
these effects with the uncertainties in the ambient and satu-       group IV in the model.
ration vapor concentrations of the gas-phase products. To do           The change in the mass of compound j in a particle (mj )
this, we carried out two sets of simulations. In Case 1, sim-       is calculated based on the mass flux between gas and particle
ulations are performed based on artificially created but jus-       phase and the oligomerization and decomposition reactions

Atmos. Chem. Phys., 22, 155–171, 2022                                                 https://doi.org/10.5194/acp-22-155-2022
A. Heitto et al.: Effects of oligomerization and decomposition on the nanoparticle growth                                        157

they go through using the following equation:                        of compound j due to oligomerization reactions with other
                                                                     compounds i (Lolig,j 6 = 0 only for organic group II) and is
dmj
                                                                     calculated as
    = 2π dp + dj Dp + Dj βm,j Cj − Ceq,j
 dt
                                           Mj                       Lolig,j = kolig Nj Ni Vp ,                                   (6)
    + Polig,j − Lolig,j + Pdec,j − Ldec,j      ,              (1)
                                            NA
                                                                     where kolig is the oligomerization rate coefficient, Vp the
where Mj (kg mol−1 ) is the molar mass, dj molecular di-
                                                                     volume of the particle, and Nj and Ni the particle-phase
ameter (m), Dj diffusion coefficient (m2 s−1 ), Cj gas-phase
                                                                     molecular concentrations of compounds j and i, respectively.
mass concentration, and Ceq,j equilibrium mass concentra-
                                                                     Ldec,j describes the loss rate of compound j due to decom-
tion of compound j (note that both are here converted to units
                                                                     position to smaller molecules (Ldec,j 6 = 0 only for organic
of kg m−3 ); dp is the diameter (m), Dp the diffusion coeffi-
                                                                     group III) and is calculated as
cient of the particle (m2 s−1 ) and NA Avogadro’s constant
(mol−1 ). Polig,j and Lolig,j are the production and loss rates
                                                                     Ldec,j = kdec Nj Vp ,                                        (7)
by oligomerization, and Pdec,j and Ldec,j are the production
and loss rates by decomposition.
   The first part on the right in Eq. (1) describes the transition   where kdec is the decomposition rate coefficient of com-
regime mass flux of condensation to or evaporation from a            pound j . Polig,j and Pdec,j describe the production of com-
particle and is based on the difference in the gas-phase and         pound j by oligomerization and decomposition, respectively
equilibrium concentrations of the compound. βi is the tran-          (6 = 0 only for organic group IV), and they are calculated as
sition regime correction factor defined as follows (Fuchs and
Sutugin, 1970):                                                      Polig,j = kolig Nf Ny Vp ,                                   (8)
                                                                     Pdec,j = kdec Ni Vp ,                                        (9)
                           1 + Knj
βj =                                            ,           (2)
                  4
       1+       3αm,j   + 0.377 Knj + 3α4m,j Kn2j                    where f , y, and i indexes describe the two oligomerizing
                                                                     compounds from group II and the fragmenting compound in
where αm,j is mass accommodation coefficient, and Knj is             group III, respectively.
the Knudsen number. In our model, for the Knudsen number                Equation (1) is used for both organics and sulfuric acid.
we use the following (Lehtinen and Kulmala, 2003):                   Water is assumed to be constantly in equilibrium between gas
                                                                     and particle phases, and the amount of ammonia (by mole) is
          2λj
Knj =           ,                                             (3)    assumed to equal the amount of sulfuric acid in the parti-
        dp + dj                                                      cle phase. In this study, an ideal solution assumption without
                                                                     acid-base chemistry is applied as the focus is on the organ-
where λj is the free mean path of the condensing compound
                                                                     ics, although we acknowledge that acidity can enhance the
j . The mean free path is defined as follows (Lehtinen and
                                                                     oligomerization (Tolocka et al., 2004).
Kulmala, 2003):
                                                                        The particle is assumed to be liquid-like and have no
      3 Dp + Dj
                                                                    particle-phase diffusional limitations. The viscosity of the
λj = p              ,                                   (4)          particle has been suggested to possibly have an effect on the
         cp + cj
                                                                     particle growth (Virtanen et al., 2010); however, the effect
where cp and cj are the mean thermal speed of the particle           may not be significant at the atmospheric boundary layer’s
and condensing compound, respectively. The equilibrium va-           relative humidities at least in warm environments (Renbaum-
por concentration of j is calculated as                              Wolff et al., 2013; Yli-Juuti et al., 2017; Li et al., 2019), and
                                                                     here such an effect was neglected to focus on oligomeriza-
                                                                     tion and decomposition. For example, viscosity of 109 Pa s,

                        4σ νj
Ceq,j = γj χj Cj∗ exp           ,                      (5)           corresponding to upper limit estimates of α-pinene SOA par-
                        RT dp
                                                                     ticles at atmospherically relevant RH (Renbaum-Wolf et al.,
where γj is the activity coefficient, χj the mole fraction, Cj∗      2013; Zhang et al., 2015; Yli-Juuti et al., 2017), would in-
the saturation concentration, νj the molar volume of com-            dicate a characteristic time of bulk diffusion of less than an
pound j , σ the surface tension of the particle, R the gas con-      hour for 10 nm particles and over a day for 100 nm parti-
stant and T the temperature. In this study we assume an ideal        cles (Shiraiwa et al., 2011). Considering that the growth of
solution, and therefore the activity coefficient γj is equal to      nanoparticles takes place over hours, with such high viscos-
1.                                                                   ity, particle-phase diffusion limitations could become impor-
   The second part on the right-hand side of Eq. (1) describes       tant in the size range between 10 and 100 nm. The lower the
the production and loss of compound j from oligomerization           viscosity is, the larger the size is in which particle-phase dif-
and decomposition reactions. Lolig,j describes the loss rate         fusivity becomes important (Shiraiwa et al., 2011).

https://doi.org/10.5194/acp-22-155-2022                                                  Atmos. Chem. Phys., 22, 155–171, 2022
158 A. Heitto et al.: Effects of oligomerization and decomposition on the nanoparticle growth
2.2 Simulation setup In the simulations with a reversible reaction, oligomeriza-
tion of compounds was done similarly to that in irreversible
In MODNAG it is possible to include multiple oligomeriza- oligomerization simulations described above, with the excep-
tion and decomposition reactions in the same simulation. In tion that the formed oligomers could decompose back to their
recent studies it has been shown that oligomerization is of- initial group II bins after oligomerization. Ranges for kolig
ten reversible (Trump and Donahue, 2014). In our simula- and kdec were similar to the irreversible reactions.
tions we have mostly assumed irreversible reactions but con- The total gas-phase concentration of compounds in differ-
ducted simulations with reversible oligomerization for a few ent VBS bins was divided evenly between groups I, II and III,
example cases to explore potential influences on this process. which means that one-third of a bin was reacting in a given
Also, for simplicity we have assumed that only one reac- simulation. We chose this in order to investigate effects of
tion happens at a time and that it happens only between two particle-phase reactions in a more moderate case compared
compounds, although in reality the reaction chains are ob- to assuming that all or a majority of the compounds of any
served to be longer and include multiple reactions and com- volatility would undergo reactions. An assumption for this
pounds (Tolocka et al., 2004; Kolesar et al., 2015; Heaton et was required since relevant particle-phase reactions of organ-
al., 2007). In all simulations the initial particle diameter was ics are not well known. We tested the sensitivity of results to
2 nm, and it consisted solely of sulfuric acid. this assumption by performing additional simulations with
Our analysis included “oligomerization simulations” and the assumption that all molecules of a bin can react (see Re-
“decomposition simulations”. In the oligomerization simu- sults, Sect. 3.2).
lations one pair of compounds in organic group II was al- In this study the aim was to get an overview of how much
lowed to react and form a dimer (compound in group IV). oligomerization and decomposition can affect the growth
Other compounds in group II and all compounds in group III of atmospheric nanoparticles. For this, the above sensitiv-
were assumed to be non-reactant similar to group I com- ity runs were performed for two scenarios being represen-
pounds. We run such simulations for reactions between all tative of environments where the nanoparticle are growing.
possible compound pairs in organic group II. For each pair In Case 1, an artificial gas-phase composition was given as
of reacting compounds, several simulations were run by as- an input to the model. The vapor concentrations were se-
suming the product to have a saturation concentration be- lected in a way that vapor concentrations and the resulting
tween C ∗ = 10−6 and 101 µg m−3 ; however, the volatility of particle growth rates were of a similar magnitude as those
the product was restricted to be always at least 1 order of observed in the boreal forest atmosphere (Mohr et al., 2019).
magnitude lower than the volatility of the less volatile react- Additionally, the less volatile organic compounds were set
ing compounds. For each combination of the pair of reacting to have lower concentrations compared to the more volatile
compounds and C ∗ of the product, the analysis included sim- compounds following atmospheric observations but in a sim-
ulations in which oligomerization rate coefficient kolig ranged plified way (Mohr et al., 2019). Properties of the seven model
from 10−21 to 10−12 cm3 s−1 . We chose these limits based compounds (VBS bins) in all condensing groups (I–III) are
on sensitivity tests, which showed that with higher or lower illustrated in Table 1. For group IV compounds, which are
oligomerization rate coefficients there were not any signifi- the oligomerization and decomposition products (280 com-
cant changes in the results compared to these upper and lower pounds), the properties were defined based on the reacted
limits, respectively. compounds and volatility of the product. The gas-phase dif-
In the decomposition simulations the initial compound fusivity of group IV compounds is assumed to be similar
from organic group III fragments formed two smaller prod- with condensing components in a similar volatility bin. For
uct compounds (compounds in group IV). These two product oligomerization product compounds the molar mass of the
compounds could be identical or have different properties. compound was the sum of molar masses of reacting com-
Other compounds in group III and all compounds in group pounds, and for decomposing product compounds the molar
I and group II were assumed to be non-reactant. For each masses were calculated by dividing the molar mass of the
decomposing compound from organic group III, simulations decomposing compound relative to the log C ∗ of the product
were run with volatilities of the product compounds rang- compounds.
ing from C ∗ = 10−3 to 102 µg m−3 . The volatility of each In Case 2, simulations were run with gas composition
product compound was limited to be always at least 1 order more directly restricted by atmospheric observations. Vapor
of magnitude higher than the initial compound’s volatility. concentrations and molecular composition measured with a
For each combination of the initial compound and the pair chemical ionization mass spectrometer at Hyytiälä measure-
of product compounds, simulations were run with a decom- ment station (Mohr et al., 2019) in spring 2014 during a
position rate coefficient kdec ranging from 10−5 to 1 s−1 . We new particle formation (NPF) event were grouped in a VBS
chose these limits based on sensitivity tests, which showed based on their C ∗ estimated with the parameterization by Li
that with higher or lower decomposition rate coefficients et al. (2016) and temperature dependence of C ∗ estimated
there were not any significant changes in the results com- based on the method by Epstein et al. (2010). This VBS rep-
pared to these upper and lower limits, respectively. resentation of the gas concentrations of the organics was used
Atmos. Chem. Phys., 22, 155–171, 2022 https://doi.org/10.5194/acp-22-155-2022A. Heitto et al.: Effects of oligomerization and decomposition on the nanoparticle growth 159
Table 1. The properties of organic model compounds in groups I, II and III, for Case 1, in which the properties are artificial, mimicking
atmospheric conditions. C ∗ is saturation concentration, M molar mass, D gas-phase diffusion coefficient and C gas-phase concentration. C ∗
is expressed both in units of micrograms per cubic meter (µg m−3 ) and molecules per cubic centimeter (molec. cm−3 ).
Compound C ∗ (µg m−3 )/(molec. cm−3 ) M (kg mol−1 ) D (m2 s−1 ) C (molec. cm−3 )
Bin 1 102 /3.17 × 1011 0.190 5 × 10⁻⁶ 1.67 × 10⁷
Bin 2 101 /2.74 × 1010 0.220 5 × 10⁻⁶ 1.67 × 10⁷
Bin 3 100 /2.51 × 109 0.240 5 × 10⁻⁶ 1.67 × 10⁷
bin 4 10−1 /2.32 × 108 0.260 5 × 10⁻⁶ 3.33 × 10⁶
Bin 5 10−2 /2.01 × 107 0.300 4 × 10⁻⁶ 3.33 × 10⁶
Bin 6 10−3 /1.82 × 106 0.330 4 × 10⁻⁶ 3.33 × 10⁶
Bin 7 10−4 /41.63 × 105 0.370 4 × 10⁻⁶ 3.33 × 10⁶
as an input for the model. The measured gas-phase concen-
trations were assigned evenly for organic groups I, II and
III, but since only one oligomerization or decomposition re-
action was allowed in a simulation, most of the concentra-
tion was not reacting except for the one-third of a bin as-
signed to reacting compounds of organic group II or III to
investigate oligomerization or decomposition, respectively.
The observational data used here are presented in Mohr et
al. (2019), in which particle growth was simulated based on
the observed gas-phase concentrations without considering
the particle-phase oligomerization or decomposition of or-
ganic compounds. In these simulations, we used averages
over the detected NPF event for ambient conditions, and
properties (Mj and Dj ) of model compounds (VBS bins)
were calculated as gas-phase mass-concentration-weighted
averages of organic compounds grouped to each model com-
pound. The properties of model compounds in these Case 2
simulations are listed in Table 2. The properties for group IV Figure 1. Diameter of the growing particle as a function of time
compounds were defined similarly to Case 1. in simulations based on artificial gas-phase concentrations (Case 1
simulations). The red line shows the base case simulation in which
no particle-phase reactions were allowed. The blue area shows the
3 Results and discussion contribution of oligomerization to the growth, i.e., the envelope of
the simulations in which oligomerization was allowed. The yellow
3.1 Simulations based on artificially generated area shows the contribution of decomposition to the growth, i.e., the
gas-phase concentrations envelope of the simulations in which decomposition was allowed.
The particle growth in simulations with artificially generated
gas-phase concentrations (Case 1) are presented in Fig. 1. In tion reactions decrease the molar fractions of the condensing
general, our results show that oligomerization increases and compounds in the particle phase, therefore decreasing their
decomposition decreases the particle growth rate. At max- equilibrium vapor concentration and enhancing their con-
imum, the growth rate was increased 139 % by oligomer- densation. However, due to small differences in volatilities
ization and decreased 20 % by decomposition. In some sim- between the reacting monomers and the product dimer and
ulations the growth rate is decreased also by oligomeriza- zero gas-phase concentration of the product compound, the
tion. These are simulations in which two low-volatile or ex- evaporation rate of the product compound exceeds the en-
tremely low-volatile (C ∗ < 10−2 µg m−3 ) model compounds hancement of condensation due to oligomerization.
are forming a dimer, and the product is only 1 order of magni- The effects of different parameters on the growth with
tude less volatile than the initial compounds. For the sake of oligomerization can be seen in Fig. 2, in which simulations
completeness these simulations were included in our simula- with different oligomerization rate coefficient (Fig. 2a, b),
tion set even though they may be unlikely in real atmospheric saturation concentrations of oligomerization product (Cp∗ ;
conditions, based on the dependence of C ∗ on molecular Fig. 2c, d) and saturation concentration of one of the
composition (Li et al., 2016). Also in this case, oligomeriza- oligomerizing compounds (CO,2 ∗ ; Fig. 2e, f) are presented.
https://doi.org/10.5194/acp-22-155-2022 Atmos. Chem. Phys., 22, 155–171, 2022160 A. Heitto et al.: Effects of oligomerization and decomposition on the nanoparticle growth
Table 2. The properties of model compounds in groups I, II and III, for Case 2. Concentrations are from measurements of Mohr et al. (2019).
∗ ) are calculated using parametrization by Li et al. (2016) and converted to the ambient temperature
Saturation concentrations at 300 K (C300
in the model based on temperature dependence by Epstein et al. (2010). M is molar mass, D gas-phase diffusion coefficient and C gas-phase
concentration.
Compound ∗ (µg m−3 )/(molec. cm−3 )
C300 M (kg mol−1 ) D (m2 s−1 ) C (molec. cm−3 )
Bin 1 102 /3.04 × 1011 0.198 5.51 × 10⁻⁶ 7.10 × 10⁶
Bin 2 101 /2.77 × 1010 0.217 5.20 × 10⁻⁶ 5.90 × 10⁶
Bin 3 100 /2.51 × 109 0.240 5.06 × 10⁻⁶ 3.97 × 10⁶
Bin 4 10−1 /2.35 × 108 0.256 5.00 × 10⁻⁶ 2.85 × 10⁶
Bin 5 10−2 /2.08 × 107 0.290 4.56 × 10⁻⁶ 1.83 × 10⁶
Bin 6 10−3 /1.86 × 106 0.323 4.26 × 10⁻⁶ 1.41 × 10⁶
Bin 7 10−4 /1.60 × 105 0.376 3.99 × 10⁻⁶ 2.61 × 10⁶
Each panel shows the base case simulation with no reactions oligomerization is highly dependent on particle-phase con-
(dashed red line) and the simulation with the fastest growth, centrations, which are very low in the small particles due to
in which compounds from bins 2 (CO,1 ∗ = 101 µg m−3 ) and an increase in equilibrium vapor concentrations caused by
∗ = 100 µg m−3 ) form a compound with lower satura-
3 (CO,2 the surface curvature (Kelvin effect). A similar effect can
tion concentration by 2 orders of magnitude than in bin 7 be seen also in part of our simulations, as indicated by the
(Cp∗ = 10−6 µg m−3 ) with an oligomerization rate coefficient small difference in GR between various simulations and the
kolig of 10−12 cm3 s−1 (dashed black line). Growth rate (GR) base case simulation particularly for the size below 5 nm
is the changing rate of the particle diameter, and it was cal- (Fig. 2). However, when kolig and differences in volatilities
culated based on differences in simulated diameter between of oligomerizing and product compounds are large enough,
each time step. The growth rate increases with increasing oligomerization enhances the growth of even the sub-5 nm
kolig rates and with the decreasing volatility of the oligomer- particles based on our simulations. If kolig is high, even
ization product. Generally, the growth rate also increases the small equilibrium particle-phase concentration of the
with the increasing volatility of oligomerizing compounds. SVOCs, which is decreased further for small particles due
However, with very high volatilities (C ∗ > 100 µg m−3 ) the to surface curvature, may lead to significant oligomer pro-
tendency of these compounds to evaporate can hinder the duction, and if the product has a low enough volatility, the
oligomerization reactions. increase in equilibrium vapor concentration due to the sur-
In Fig. 2e–f the case when CO,2 ∗ is 10 µg m−3 , i.e., when face curvature will not drive it to evaporate quickly even from
both reacting compounds have the same volatility, is diverg- the smallest particles, and, thus, particle growth is enhanced.
ing from the general trend of how the volatility of reacting When interpreting our simulation results for the small parti-
compounds affects the growth. The reason for this is that cle sizes, it should be noted that the initial assumption of a
since we have assumed only one-third of a bin to be com- particle containing only sulfuric acid may affect the results
pounds that can go through reaction in the particle-phase, the at the beginning of the simulation. As the initial particle con-
total gas-phase concentration of reacting compounds is lower tains no organics, some organics will condense in the parti-
(one-third of one bin) than in the case of compounds of dif- cle fast during the first-time steps (due to the solution effect
ferent bins reacting with each other (one-third of each bin). in Ceq ) causing artificially high GR for the beginning of the
As a comparison, a simulation in which CO,1 ∗ and C ∗ are simulation. For this reason, in Fig. 2b, d and f we present the
O,2
GR only after the diameter reaches 3 nm. At this point the
both 10 µg m−3 and in which two-thirds of this bin is allowed
mass of the particle is about twice the initial mass.
to react is also presented in Fig. 2e–f (dotted cyan line). This
Figure 3 shows effects of different parameters on the parti-
simulation follows the similar trend as simulations in which
cle growth in simulations in which decomposition is allowed.
two compounds with different C ∗ are reacting and shows
∗ is 1 µg m−3 Simulations with different decomposition rate coefficients
similar growth as the simulation in which CO,1
(Fig. 3a, b), saturation concentrations of decomposing com-
∗
and CO,2 is 10 µg m . −3
pounds (CD∗ ; Fig. 3c, d) and saturation concentrations of one
All parameters discussed above, oligomerization rate co- product compound (Cp,2 ∗ ; Fig. 3e, f) are shown. Each panel
efficient and volatility of oligomerizing and product com- shows the base case simulation (no reactions, dashed red
pounds, have a clear effect on particle growth. However, their line) and the simulation with the slowest growth, in which the
effect is dependent on each other, which will be discussed be- compound from bin 7 (CD∗ = 10−6 µg m−3 ) decomposes into
low. two product compounds in bin 1 (Cp,1 ∗ and C ∗ both equal
p,2
Wang et al. (2010) concluded that oligomerization
to 102 µg m−3 ) with a decomposition rate coefficient kdec of
is nearly inhibited for small particles (< 4 nm) because
Atmos. Chem. Phys., 22, 155–171, 2022 https://doi.org/10.5194/acp-22-155-2022A. Heitto et al.: Effects of oligomerization and decomposition on the nanoparticle growth 161
Figure 2. Diameter of the particle (Dp ) as a function of time and growth rate (GR) of the particle as a function of diameter in simulations
in which two model compounds oligomerize forming a new oligomerization product, (a, b) for simulations with different oligomerization
rate coefficients, (c, d) for simulations with different saturation concentrations of oligomerization product compounds (Cp∗ ) and (e, f) for
simulations with different saturation concentrations of one of the oligomerizing compounds (CO,2 ∗ ). Except for the parameter that was
varied, values were as follows: kolig = 10−12 cm3 s−1 , Cp∗ = 10−6 µg m−3 , CO,2
∗ = 100 µg m−3 and the saturation concentration of the
other reacting compound CO,1 ∗ = 101 µg m−3 . These parameter values correspond to the simulation with the fastest growth among the
Case 1 simulations, which is present in every panel as a dashed black line. The base case simulation in each panel describes simulation
without oligomerization reactions. Panels (e)–(f) also present simulation, in which both oligomerizing compounds are from same volatility
bin (C ∗ = 101 µg m−3 ), and two-thirds of compounds in that volatility bin can go through oligomerization reaction. In other simulations
one-third of a bin can go through a reaction.
1 s−1 (dashed black line). Our results show that all varied pa- be seen only after kolig > 10−18 cm3 s−1 . Even for simula-
rameters affect the growth of the particle. For kdec the effect tions in which the most volatile compounds in our setup
is quite straightforward; with increasing kdec , the growth rate (bin 1 and 2) oligomerize, growth does not increase much
is decreased. The growth rate slows down with a decreasing with these low kolig rates since the rate of production of the
C ∗ of decomposing compounds due to a larger contribution less volatile oligomers is low due to the small equilibrium
of lower-volatility compounds to the particle growth and with particle-phase concentrations of the reacting compounds and
an increasing C ∗ of the product as a consequence of the prod- the low reaction rate coefficient. With larger kolig rates, how-
uct evaporating faster for the higher C ∗ compounds. ever, these higher-volatility molecules will oligomerize sig-
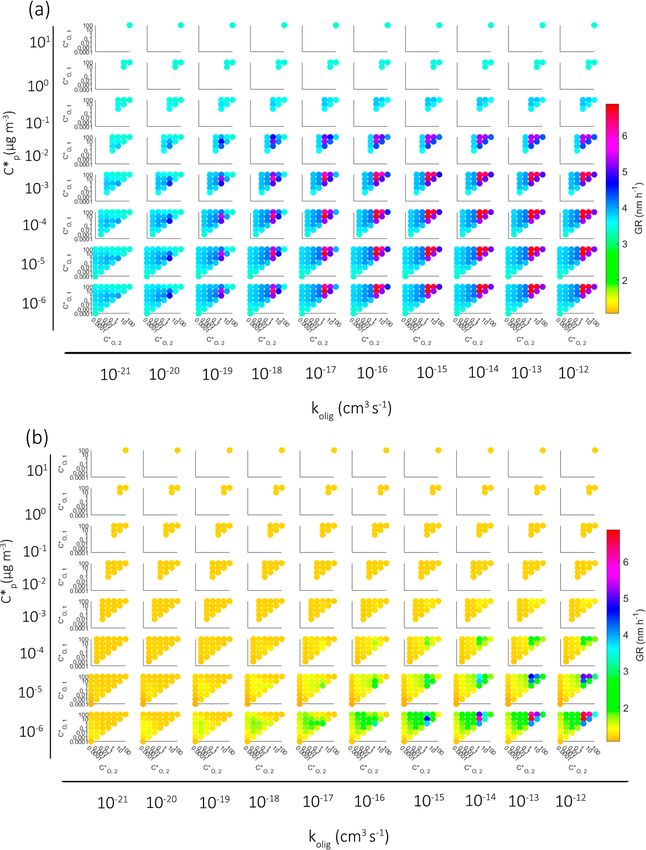
In Fig. 4 we present the growth rate of the particle in all nificantly despite their small equilibrium particle-phase con-
different simulations with oligomerization for particles un- centrations. Without oligomerization reactions these com-
der 5 nm in diameter (Fig. 4a) and over 5 nm in diameter pounds would almost not at all contribute to the growth, so
(Fig. 4b). Each colored dot represents one simulation, and with their oligomerization the growth is enhanced greatly.
the color describes the growth rate. Growth rates are calcu- The gas-phase concentrations of three higher-volatility com-
lated by fitting a straight line in diameter as a function of pounds are higher than those of lower-volatility compounds,
time, i.e., assuming linear growth. This is important to notice which enhances the growth rates even further in simulations
especially with particles under 5 nm in diameter because in in which oligomerization takes place between high volatile
that size range the growth is not usually linear (see Figs. 2 compounds.
and 3). From left to right the subplots show simulations with Similar to Fig. 4 for oligomerization reactions, in Fig. 5
increasing kolig and from top to bottom decreasing satura- we present the growth rate of the particle in all different sim-
tion concentration of the product compound formed in the ulations with decomposition for particles over 5 nm. We have
oligomerization reaction. In each subplot on the y and x axes excluded the results for particles under 5 nm in diameter be-
are the saturation concentrations of the oligomerizing com- cause for particles under 5 nm decomposition causes little ef-
pounds. fect on growth. Again, each colored dot represents one simu-
For small values of kolig (< 10−18 cm3 s−1 ) the increase lation, and the color describes the average growth rate during
in growth rate due to oligomerization is small, especially the simulation. The subplots are arranged so that from left to
for under 5 nm particles, at which any notable increase can right we have simulations with increasing kdec and from top
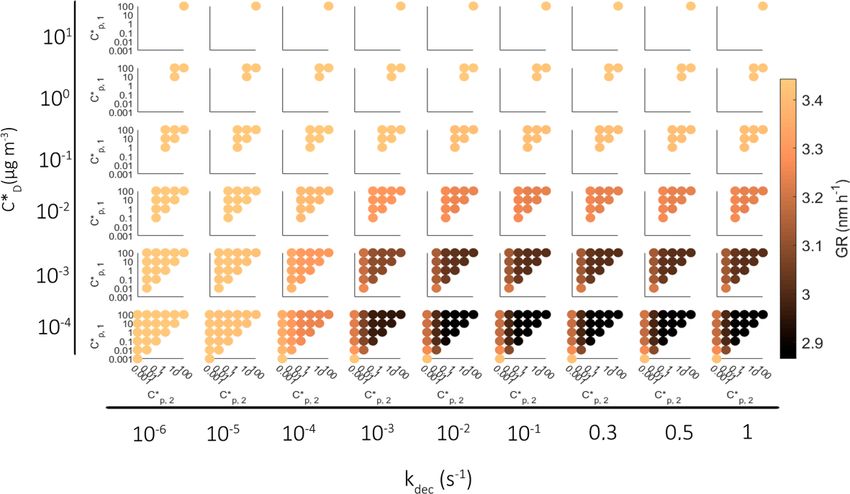
https://doi.org/10.5194/acp-22-155-2022 Atmos. Chem. Phys., 22, 155–171, 2022162 A. Heitto et al.: Effects of oligomerization and decomposition on the nanoparticle growth
Figure 3. The diameter of the particle (Dp ) as a function of time and growth rate (GR) of the particle as a function of diameter in simulations,
in which one model compound is allowed to decompose into two smaller compounds, (a, b) for simulations with different decomposition rate
coefficients, (c, d) for simulations with different saturation concentrations of decomposing compounds (CD ∗ ) and (e, f) for simulations with
∗
different saturation concentrations of one of the decomposed product compounds (Cp,2 ). Except for the parameter that was varied, values
were as follows: kdec = 1 s−1 , CD∗ = 10−4 µg m−3 , C ∗ = 102 µg m−3 and the saturation concentration of the other product compound
p,2
∗ = 102 µg m−3 . These parameter values correspond to the simulation with the slowest growth among the Case 1 simulations which is
Cp,1
present in every panel as a dashed black line. The base case simulation in each panel describes simulation without decomposition reaction.
to bottom decreasing saturation concentration of the decom- phase reactions. However, via oligomerization even higher-
posing compound. In each subplot the y and x axes are the volatility compounds can contribute to the growth (Berke-
saturation concentration of the end products of decomposi- meier et al., 2020). To demonstrate this effect, we conducted
tion reaction. a few additional simulations, in which we increased the
A clear result here is that the decomposition decreases volatility (to 104 µg m−3 ) and gas-phase concentration (up
the GR across the board. In more detail, with a small kdec to five-fold) of our highest volatility bin (originally C ∗ =
(< 10−4 s−1 ) the decomposition does not affect the growth 102 µg m−3 ) and allowed this compound to react with it-
since the rate of reactions is slow compared to the conden- self forming less volatile oligomers. These simulations are
sation mass flux, and therefore only a relatively small frac- presented in Fig. 6 along with reference simulations in
tion of molecules react. The decomposition starts to have an which C ∗ of the reacting compound was 102 µg m−3 . The
impact if kdec is at least 10−4 s−1 , and the impact is depen- results suggest that even compounds with C ∗ of 104 µg m−3
dent on the volatilities of the decomposing compound and the could affect the particle growth via oligomerization if their
product compounds. If the decomposing compound is one of gas-phase concentration and oligomerization rate are high
the most volatile compounds in our setup, i.e., from the three enough. For simulations presented in Fig. 6a–b, kolig was set
most volatile bins with C ∗ > 10−1 µg m−3 , the effect of de- to 10−12 cm3 s−1 , i.e., fastest oligomerization rate constant
composition on GR is very small because of their low con- in our simulations. These simulations show that with similar
tribution to particle mass. Instead, if the decomposing com- gas-phase concentrations, setting the C ∗ of the most volatile
ponent is from the least volatile bin (C ∗ = 10−4 µg m−3 ), the compound to 104 µg m−3 instead of 102 µg m−3 decreases
effect on GR is large even if the C ∗ of the product compounds growth rate. However, already the doubling of gas-phase
would be as low as 10−2 µg m−3 . Note that the color scale in concentrations for the compounds with C ∗ of 104 µg m−3
Fig. 4 extends in a much wider GR range than in Fig. 5 since results in a faster growth due to the oligomerization com-
the simulated effect of decomposition to the particle growth pared to the initial case with the highest volatility bin of
is much smaller than that of oligomerization. C ∗ of 102 µg m−3 . The assumption of higher-volatility com-
In the main body of our study, we have concentrated on pounds having higher gas-phase concentrations compared to
compounds that may contribute to the particle growth of an less volatile compounds is reasonable based on atmospheric
atmospheric particle even without going through particle- observations (Hunter et al., 2017). Figure 6c–d demonstrates
Atmos. Chem. Phys., 22, 155–171, 2022 https://doi.org/10.5194/acp-22-155-2022A. Heitto et al.: Effects of oligomerization and decomposition on the nanoparticle growth 163 Figure 4. Growth rate of the particle in simulations with oligomerization for (a) particles over 5 nm in diameter and (b) particles under 5 nm in diameter. Each dot describes one simulation, and the color shows the corresponding growth rate. The growth rates are calculated assuming a linear growth curve. In the smaller figures the axes describe saturation concentrations of oligomerizing model compounds (µg m−3 ). The wider horizontal axis describes the oligomerization rate coefficient in the simulation and the vertical axis the saturation concentration of the forming oligomerization product. the sensitivity of the contribution of the compounds with assumed to be irreversible. In Fig. 7 we present a few cases C ∗ of 104 µg m−3 on kolig for the emphasized case with 2- for which we tested the effect of reversible reactions. fold concentration compared to the initial highest volatil- In panels (a), (c), (e) and (g) (Reaction 1 in Fig. 7) com- ity bin of 102 µg m−3 . Unlike with the 102 µg m−3 com- pounds from the two most volatile bins (1 and 2, C ∗ = 102 pounds, the enhancement of growth by the oligomerization and 101 µg m−3 , respectively) form an ELVOC (bin 7, C ∗ = of 104 µg m−3 compounds differs between the three highest 10−4 µg m−3 ), and in panels (b), (d), (f) and (h) (Reaction 2) tested kolig values (10−12 –10−14 cm3 s−1 ) and is insignificant compounds from bin 2 and 5 (C ∗ = 101 and 10−2 µg m−3 ) for kolig < 10−14 cm3 s−1 . form a similar ELVOC as in the left-hand side reactions In most of our simulations and in all the results presented (bin 7, C ∗ = 10−4 µg m−3 ). In both cases the oligomeriza- this far, the oligomerization and decomposition reactions are tion product can decompose into the initial compounds. In https://doi.org/10.5194/acp-22-155-2022 Atmos. Chem. Phys., 22, 155–171, 2022
164                                  A. Heitto et al.: Effects of oligomerization and decomposition on the nanoparticle growth

Figure 5. Growth rate of the particle in simulations with a decomposition reaction for particles over 5 nm in diameter. Each dot describes
one simulation, and the color shows the growth rate. Growth rates are calculated assuming linear growth curve. In smaller figures the axes
describe saturation concentrations of compounds formed by decomposition. The wider horizontal axis describes the decomposition rate
coefficient in the simulation and the vertical axis the saturation concentration of decomposing model components.

Figure 6. Diameter of a particle (Dp ) as a function of time (a, c) and growth rate (GR) of the particle as a function of diameter (b, d)
in simulations in which we have altered the volatility and concentration of the highest volatility bin along with reference simulations.
Panels (a) and (b) show the effect of gas-phase concentration and (c) and (d) the effect of the oligomerization rate coefficient. In each
simulation, the highest volatility compound (C ∗ either 102 or 104 µg m−3 ) reacts with itself forming a lower-volatility compound. In (a)
and (b) kolig = 10−12 cm3 s−1 (similar to Fig. 2c–f). The base case simulation in each panel describes the simulation without oligomerization
reactions.

Reaction A the effect of oligomerization is large since with-            seen only with small values of oligomerization rate coeffi-
out it the reacting compounds would contribute to the growth             cients (kolig < 10−17 cm3 s−1 ), while in Reaction A the ef-
very little. In Reaction B the effect of oligomerization is              fect of different decomposition rate coefficients can be seen
smaller, for especially the low-volatile reacting compound               already with larger values of oligomerization rate coefficients
would condense to the particle phase even without oligomer-              (kolig > 10−12 cm3 s−1 ). In Reaction B the reversibility of
ization. It is worth noting that the difference in gas-phase             the reaction has less effect on the growth because a lower-
concentrations between higher- and lower-volatility bins also            volatility reacting compound tends to stay in the particle
contributes to the extent that the oligomerization enhances              phase and thus helps drive the oligomerization reaction.
the growth rate. In Reaction B the effect of reversibility is

Atmos. Chem. Phys., 22, 155–171, 2022                                                        https://doi.org/10.5194/acp-22-155-2022
A. Heitto et al.: Effects of oligomerization and decomposition on the nanoparticle growth                                              165

Figure 7. Diameter of the particle as a function of time with reversible oligomerization reactions with different oligomerization and decom-
position reaction rates. In each subplot simulations with the same oligomerization reaction rate and with different decomposition reaction
rates are presented. The oligomerization reaction rates decrease when ascending with subplots. On the left column of panels (a, c, e, g)
the simulations have a reaction in which two SVOCs from the two highest volatility bins (C ∗ = 102 and 101 µg m−3 ) form an ELVOC
(C ∗ = 10−4 µg m−3 ), and on the right column of panels (b, d, f, h) the simulations have a reaction in which a SVOC and LVOC (C ∗ = 101
and 10−2 µg m−3 ) form an ELVOC (C ∗ = 10−4 µg m−3 ).

3.2   Simulations based on measured gas-phase                           Juuti et al., 2011). A particle growth model constrained by
      concentrations                                                    observed gas-phase concentration of organics captures the
                                                                        observed growth rate fairly well without the need to assume
Here we explore the thermodynamic parameters in the model               particle-phase reactions (Mohr et al., 2019). However, due
and contrast the results to observations in an aerosol forma-           to uncertainties in gas-phase concentrations and properties
tion event observed at the Station for Measuring Ecosystem–             of organics, the possibility of particle-phase reactions cannot
Atmosphere Relations (SMEAR-II; Hari and Kulmala, 2005)                 be completely overruled. Ehn et al. (2007) compared ambient
in Hyytiälä, Finland. Nanoparticle growth after nucleation              particle size distributions and those measured after heating to
has been extensively studied at Hyytiälä, and nanoparticle              280 ◦ C in a thermodenuder for new particle formation events.
GR is relatively well characterized there. At this location,            They found that the growth rate of the non-volatile fraction of
GR values ranging from below 1 nm h−1 to several tens of                particles, observed as the size distribution behind a thermod-
nanometers per hour have been observed (Dal Maso et al.,                enuder, was one fourth of the GR measured with a normal
2005; Yli-Juuti et al., 2011), average GR for 3–25 nm par-              differential mobility particle sizer (DMPS). Based on a long-
ticles being 2.5 nm h−1 (Nieminen et al., 2014). While sub-             term volatility measurements, Häkkinen et al. (2012) found
20 nm particle composition measurements are missing, sea-               out that soot is not able to explain the residual in the particu-
sonal variation in GR with a maximum in summer indi-                    late phase and speculated that oligomerization contributes to
cates the importance of organic vapors with biogenic origin             the non-volatile cores of nanoparticles growing in the boreal
(Dal Maso et al., 2005; Yli-Juuti et al., 2011). The impor-             environment.
tance of organics is supported, e.g., by the positive correla-             An evolution of aerosol number size distribution in
tion found between GR of 7–20 nm particles and monoter-                 Hyytiälä on 23 April 2014 and the geometric mean diame-
pene concentration (Yli-Juuti et al., 2011). Further, sulfuric          ter of the nucleation mode are presented in Fig. 8. The ge-
acid condensation can explain only a small fraction of par-             ometric mean diameters of the nucleation mode were deter-
ticle growth even down to the sub-3 nm size range (Niemi-               mined by fitting a multi-log-normal distribution function to
nen et al., 2014; Yli-Juuti et al., 2016), and the composition          the measured particle size distribution (Hussein et al., 2005).
observations of 20 nm particles indicate that organics would            The observed growth rate was 1.7 nm h−1 . In the subsequent
cover more than half of particle mass growth (Pennington                simulations we explored the capability of the model and pa-
et al., 2013). On the other hand, GR of particles has been              rameter selection to explain the observed aerosol growth in
observed to increase with particle size, and GR of sub-3 nm             the boreal environment.
particles does not exhibit similar seasonal variation as GR                Growth of the particle in simulations with measured gas-
of larger particles, which together suggests that there may             phase concentrations (Case 2) can be seen in Fig. 8a. The
be different factors affecting growth at different sizes (Yli-

https://doi.org/10.5194/acp-22-155-2022                                                     Atmos. Chem. Phys., 22, 155–171, 2022
166 A. Heitto et al.: Effects of oligomerization and decomposition on the nanoparticle growth
Figure 8. Observed particle size distribution, geometric mean diameters of nucleation mode (DGM ) and the model results on diameter of
the particle as a function of time in simulations based on measured gas-phase concentrations. The base case simulation with no reactions is
shown with the red line. The blue area shows the possible contribution of oligomerization to the growth, i.e., the envelope of the simulations
in which oligomerization was allowed. The yellow area shows the possible contribution of decomposition to the growth, i.e., the envelope
of the simulations in which decomposition was allowed. The measured particle size distribution is shown in the background. (a) Model
simulations in which one-third of the VBS bin was allowed to react. (b) Model simulations in which the whole VBS bin was allowed to react.
blue area envelopes simulation results with a oligomeriza- parameterization the growth was overestimated even without
tion reaction, and the yellow area envelopes simulation re- any particle-phase reactions. Overall, the C ∗ values of or-
sults with a decomposition reaction. In the figure, the starting ganics can vary over several orders of magnitude between
point of the simulations is set so that the base case simula- different calculation methods (Mohr et al., 2019). Therefore,
tion matches with the third fitted geometric mean diameter. the reaction that would produce the best fit between observed
Without oligomerization the growth in the model is slower and simulated GR may vary from oligomerization to decom-
than the observed growth (GR in the base case simulation position between the different C ∗ parameterizations.
1.54 nm h−1 , observed GR 1.7 nm h−1 ). When oligomeriza- In the results presented so far, in each simulation one-third
tion is allowed in the model, it is possible to reach similar of a VBS bin was allowed to react. To see how this assump-
GR as observed. However, this can be achieved with multi- tion affects model results, we made additional simulations in
ple combinations of parameters, and therefore it would be which we allowed all molecules of a bin to react. The growth
challenging to try to estimate what kind of reactions take of the particle in these simulations is presented in Fig. 8b.
place in the growing particles by optimizing the model re- The possible contribution of oligomerization or decomposi-
spect to the observed growth. For example, fitting growth tion reaction is remarkable. If only one-third of a bin was
rate can be achieved with simulations in which compounds allowed to react, the growth rate of the particle was at maxi-
from bin 3 and bin 7 form an ELVOC (C ∗ = 10−6 µg m−3 ) mum increased 71 % by oligomerization and decreased 26 %
with an oligomerization rate coefficient of 10−21 cm3 s−1 and by decomposition, but if the whole bin reacted, the maximum
also with simulations in which two compounds from bin 1 increase was 138 % and decrease 80 %.
form an LVOC (C ∗ = 10−2 µg m−3 ) with an oligomerization
rate coefficient of 10−13 cm3 s−1 . A similar problem has also
been noted by Roldin et al. (2014) when analyzing particle 4 Conclusions
evaporation in laboratory and by Trump and Donahue (2014)
when comparing their model to the SOA formation measure- A wide range of model simulations were conducted to study
ments by Presto and Donahue (2006). the effect of particle-phase oligomerization and decomposi-
Uncertainties in saturation concentrations of organic com- tion on the nanoparticle growth. Based on our model results,
pounds are another issue that makes it difficult to approxi- these reactions have potential to affect particle growth. How-
mate which of the assumed oligomerization reactions would ever, the extent of the effect was strongly dependent on the
fit best with the observed growth. In this study, we used the assumed properties of the organics (volatilities of the ini-
parametrization of Li et al. (2016) to calculate the C ∗ values tial and product compounds, reaction rate coefficients, and
based on molecular formula. Multiple other parametrizations fraction of molecules that are reactive), and the sensitivity
have also been proposed (e.g., Donahue et al., 2011; Stolzen- of particle growth on one property depended on the other
burg et al., 2018; Mohr et al., 2019), and these lead to some- properties. In the simulations constrained by observed gas-
what different simulated growth rates (Mohr et al., 2019). It phase concentrations, the agreement between simulated and
should be noted that while the observational data used here observed particle growth rate changed considerably when the
were part of the analysis in Mohr et al. (2019), a different C ∗ assumptions of the organic properties were varied. However,
parametrization was used there as the base case, and with that simulated and observed growth rate can be brought to a good
agreement with multiple combinations of assumptions of the
Atmos. Chem. Phys., 22, 155–171, 2022 https://doi.org/10.5194/acp-22-155-2022A. Heitto et al.: Effects of oligomerization and decomposition on the nanoparticle growth 167
properties which would make it challenging to try to estimate growth and scavenging is of crucial importance when con-
which combination describes the condensing organic proper- sidering survival probability, especially at the smallest sizes
ties best. as the coagulation sink decreases rapidly with growing parti-
When considering the agreement between observation- cle size. On the other hand, due to the nano-Köhler effect the
constrained growth model simulations and observations of growth rate is also typically enhancing as a function of size
particle growth, uncertainties in gas-phase concentration (Kulmala et al., 2004). However, although a particle’s abil-
measurements and in the estimation of the saturation vapor ity to act as CCN is strongly dependent on size, that is not
pressure of organics need to be considered. For example, the the only affecting factor as it depends also on particle hygro-
C ∗ values vary over several orders of magnitude between scopicity (Köhler, 1936; Giordano et al., 2015). Oligomer-
different parametrizations (Mohr et al., 2019), and there are ization decreases particle hygroscopicity (Xu et al., 2014),
discrepancies in C ∗ of organics based on different measure- which raises a question of how these two effects – increase in
ment techniques (Bilde et al., 2015). Mohr et al. (2019) es- growth rate and decrease in hygroscopicity – compare to each
timated the uncertainty for gas-phase concentrations of or- other considering cloud formation. This is an interesting and
ganics, which were same as those used in our study, to be important topic of study for the future. In our simulations the
53 % and considered an uncertainty of 2 orders of magni- molar fraction of oligomers was at maximum 18 % for sim-
tude for saturation concentrations. In their model simulations ulations in which one-third of a bin was allowed to react and
these uncertainty limits lead to 46 % and 64 % increase and 27 % in simulations in which the whole bin was allowed to
41 % and 27 % decrease in growth rates for uncertainties in react. Further modeling studies are needed to simulate the pa-
gas-phase concentrations and saturation vapor pressures, re- rameter space in different environments and explore the com-
spectively. Compared to the 71 % increase by oligomeriza- peting processes in nanoparticle growth towards CCN sizes.
tion and 26 % decrease by decomposition calculated in our These models require comprehensive aerosol- and gas-phase
study, if one-third of a bin is allowed to react, these effects measurements to provide data to evaluate the performance of
are similar in magnitude, but if the whole bin is allowed to the models in different atmospheric environments.
react, the effects by oligomerization and decomposition are
greater.
Within uncertainties, it is possible to explain the detected Code availability. The code for MODNAG are available at
atmospheric nanoparticle growth based on the observed gas- https://doi.org/10.5281/zenodo.5592258 (Heitto, 2021).
phase concentrations even without particle-phase oligomer-
ization and decomposition, as shown by Mohr et al. (2019)
and our base case simulation. Nevertheless, oligomers are Data availability. The data used in the study are published in
found in abundance in SOA, and although some of it is Mohr et al. (2019, https://doi.org/10.1038/s41467-019-12473-2).
oligomers condensed straight from the gas phase, it is pre-
sumable that also particle-phase oligomerization and decom-
Author contributions. AH and TYJ designed the study, AH de-
position occur, as has been shown by multiple studies (e.g.,
veloped the code and conducted the simulations, FLH, JAT, TP and
Zhao et al., 2005, 2006; Krizner et al., 2009; Wang et al., MK planned and performed the measurements, AH, KL and TYJ
2010). Hence, it remains open to what extent particle-phase analyzed the results, and AH and TYJ prepared the manuscript with
reactions take place in nanoparticles and how much particle contribution from all co-authors.
growth rate is affected by them. Our results suggest that in-
cluding these processes in models that describe atmospheric
particle dynamics may be required, however, as the simu- Competing interests. The contact author has declared that nei-
lated growth is sensitive to the assumptions of reactions and ther they nor their co-authors have any competing interests.
reaction rates, as well as investigations to determine the ex-
act properties that are needed for this development to lead
to a more accurate model representation of the nanoparticle Disclaimer. Publisher’s note: Copernicus Publications remains
growth. neutral with regard to jurisdictional claims in published maps and
It is evident that oligomerization, if taking place in par- institutional affiliations.
ticle phase, increases particle growth rate, making it easier
for them to reach a large enough size to act as CCN. For in-
stance, the survival probabilities of particles from 3 to 20 nm Acknowledgements. This work was supported by the Academy
calculated by applying the method by Lehtinen et al. (2007) of Finland Center of Excellence Programme (grant no. 307331),
the Academy of Finland Flagship funding (grants no. 337550 and
for the measured size distribution evolution of the NPF event
337549), the Academy of Finland (projects no. 1325656, 299544,
presented in Fig. 8 were 15 %, 25 % and 44 %, respectively, 316114 and 325647), “Quantifying carbon sink, CarbonSink+ and
when using the GR from the slowest-growing, the base case their interaction with air quality” INAR project funded by the
and the fastest-growing simulations among the ones in which Jane and Aatos Erkko Foundation, and European Research Council
one-third of a bin could react. The competition between
https://doi.org/10.5194/acp-22-155-2022 Atmos. Chem. Phys., 22, 155–171, 2022You can also read