Intravital quantification reveals dynamic calcium concentration changes across B cell differentiation stages
←
→
Page content transcription
If your browser does not render page correctly, please read the page content below

RESEARCH ARTICLE

                                    Intravital quantification reveals dynamic
                                    calcium concentration changes across B
                                    cell differentiation stages
                                    Carolin Ulbricht1,2, Ruth Leben3, Asylkhan Rakhymzhan3, Frank Kirchhoff4,
                                    Lars Nitschke5, Helena Radbruch6, Raluca A Niesner3,7†, Anja E Hauser1,2†*
                                    1
                                     Charité – Universitätsmedizin Berlin, corporate member of Freie Universität Berlin
                                    and Humboldt-Universität zu Berlin, Department of Rheumatology and Clinical
                                    Immunology, Charitéplatz 1, Berlin, Germany; 2Immune Dynamics, Deutsches
                                    Rheuma-Forschungszentrum Berlin, ein Institut der Leibniz-Gemeinschaft, Berlin,
                                    Germany; 3Biophysical Analytics, Deutsches Rheuma-Forschungszentrum, ein Institut
                                    der Leibniz-Gemeinschaft, Berlin, Germany; 4Universität des Saarlandes,
                                    Saarbrücken, Germany; 5Friedrich-Alexander-Universität Erlangen-Nürnberg,
                                    Erlangen, Germany; 6Charité – Universitätsmedizin Berlin, corporate member of
                                    Freie Universität Berlin and Humboldt-Universität zu Berlin, Department of
                                    Neuropathology, Charitéplatz 1, Berlin, Germany; 7Veterinary Medicine, Freie
                                    Universität Berlin, Berlin, Germany

                                    Abstract Calcium is a universal second messenger present in all eukaryotic cells. The
                                    mobilization and storage of Ca2+ ions drives a number of signaling-related processes, stress–
                                    responses, or metabolic changes, all of which are relevant for the development of immune cells and
                                    their adaption to pathogens. Here, we introduce the Förster resonance energy transfer (FRET)-
                                    reporter mouse YellowCaB expressing the genetically encoded calcium indicator TN-XXL in B
                                    lymphocytes. Calcium-induced conformation change of TN-XXL results in FRET-donor quenching
*For correspondence:
                                    measurable by two-photon fluorescence lifetime imaging. For the first time, using our novel
hauser@drfz.de
                                    numerical analysis, we extract absolute cytoplasmic calcium concentrations in activated B cells
†
 These authors contributed          during affinity maturation in vivo. We show that calcium in activated B cells is highly dynamic and
equally to this work
                                    that activation introduces a persistent calcium heterogeneity to the lineage. A characterization of
Competing interest: See             absolute calcium concentrations present at any time within the cytosol is therefore of great value
page 21                             for the understanding of long-lived beneficial immune responses and detrimental autoimmunity.
Funding: See page 21
Received: 14 February 2020
Accepted: 19 March 2021
Published: 22 March 2021            Introduction
                                    During generation of humoral immunity to pathogens, calcium-mobilizing events in lymphocytes can
Reviewing editor: Michael L
Dustin, University of Oxford,
                                    communicate such diverse outcomes as migration, survival, stress responses, or proliferation. An ele-
United Kingdom                      vation of cytoplasmic calcium from external space is mostly mediated through ligand binding to sur-
                                    face receptors (Baba et al., 2014). Especially in the germinal center (GC), where B cells fine-tune
   Copyright Ulbricht et al. This
                                    their B cell receptor (BCR) in order to become positively selected by T cells, ligand density in the
article is distributed under the
                                    form of native antigen (AG), stimuli for toll-like receptors (TLR), or chemokine receptors, is high.
terms of the Creative Commons
Attribution License, which          Selected B cells that leave the GCs fuel the pool of memory B cells and long-lived plasma
permits unrestricted use and        cells (LLPCs). These cells produce high-affinity antibodies granting up to lifelong protection against
redistribution provided that the    threats such as infectious diseases, but also can account for the persistence of an autoimmune phe-
original author and source are      notype, when selection within the GC is impaired (Berek et al., 1991; da Silva et al., 1998;
credited.                           Hiepe et al., 2011; Victora and Nussenzweig, 2012). B cell activation by AG uptake through the

Ulbricht et al. eLife 2021;10:e56020. DOI: https://doi.org/10.7554/eLife.56020                                                     1 of 26
Research article                                                                                       Immunology and Inflammation

                                    BCR promotes calcium influx into B cells (Tolar et al., 2009). Calcium mobilization eventually
                                    switches on effector proteins and transcription factors like nuclear factor kappa B, nuclear factor of
                                    activated T cells, or myelocytomatosis oncogene cellular homolog, thereby inducing differentiation
                                    events and remodeling of metabolic requirements (Crabtree and Olson, 2002; Jellusova, 2018;
                                    Luo et al., 2018; Saijo et al., 2002; Su et al., 2002). Dependent on the amount of AG taken up and
                                    the quality of major histocompatibility complex II (MHCII)-mediated presentation to T follicular
                                    helper cells, B cells receive additional, costimulatory signals (Gitlin et al., 2015). Interestingly, recent
                                    studies propose that costimulatory signals have to occur within a limited period of time after initial
                                    BCR activation and that the limit is set by a calcium threshold, eventually leading to mitochondrial
                                    dysfunction (Akkaya et al., 2018). Thus, quantification of changes in absolute cytoplasmic calcium
                                    concentration tolerated by GC B cells would help to understand how B cell selection in the GC is
                                    accomplished.
                                        In contrast to qualitative description, absolute calcium measurements in B cells have not yet been
                                    performed in vivo, partly because of the lack of internal concentration standards. Two-fluorophore
                                    genetically encoded calcium indicators (GECI) relying on Förster resonance energy transfer (FRET)
                                    can take on a calcium-saturated (quenched) and calcium-unsaturated (unquenched) condition, over-
                                    coming this issue. However, intravital application of quantitative FRET has been hampered by light
                                    distortion effects in deeper tissue. The differential scattering and photobleaching properties of the
                                    two fluorophores would lead to a false bias towards a higher quenching state. We here introduce a
                                    single-cell fluorescence lifetime imaging (FLIM) approach for absolute calcium quantification in living
                                    organisms that is tissue depth-independent. Both time-domain and frequency-domain FLIM technol-
                                    ogies have been employed in the past 30 years to sense changes in pH, ionic strength, pO2, metab-
                                    olism, and many other cellular parameters within living cells. Due to the impact of these parameters
                                    on the chemical structure, the fluorescence lifetime of the analyzed fluorophores can change
                                    (Elson et al., 2004; Lakowicz et al., 1992; Le Marois and Suhling, 2017). Particularly, the versatility
                                    of FLIM to quantify FRET quenching has been demonstrated and applied in various biological con-
                                    texts (Chen et al., 2003; Levitt et al., 2020; Mossakowski et al., 2015). The enhanced cyan fluores-
                                    cent protein (eCFP)/citrine-FRET pair-GECI TN-XXL is able to measure fluctuations in cytoplasmic
                                    calcium concentration through the calcium binding property of the muscle protein troponin C (TnC)
                                    (Mank et al., 2006). Calcium binding to the fluorophore-linker TnC quenches eCFP fluorescence
                                    through energy transfer to citrine (FRET), linking decreasing eCFP fluorescence lifetime to increasing
                                    calcium concentration. Whereas eCFP fluorescence lifetime changes with refractive index
                                    (Strickler and Berg, 1962) and may change upon large shifts in pH value, ionic strength, oxygen-
                                    ation, or temperature, these parameters hardly vary in the cytosol of living cells. Thus, we expect
                                    only changes in cytosolic calcium concentration to have an impact on the fluorescence lifetime of
                                    eCFP as donor in the TN-XXL construct. In addition, phasor analysis of FLIM data elegantly con-
                                    denses multicomponent fluorescent decay curves into single vector-based information (the phasor)
                                    (Digman et al., 2008). For calcium concentration analysis in microscopic images, we first took advan-
                                    tage of the previously published titration curve of TN-XXL by Geiger et al., which we also confirmed
                                    in our experimental setup (Geiger et al., 2012). We further adapted the phasor-based calibration
                                    strategy to quantify calcium levels in vivo proposed by Celli and colleagues to the TN-XXL construct
                                    expressed in B lymphocytes (Celli et al., 2010). With this method, we are able to describe short-
                                    and long-term changes in absolute calcium concentrations within B cells during affinity maturation
                                    and differentiation into antibody-producing plasma cells.
                                        We here describe the calcium reporter mouse strain ‘YellowCaB’ (termed after energy transfer to
                                    the yellow fluorescent protein citrine in case of calcium present in the cytosol of B cells). These mice
                                    express cytosolic TN-XXL in all CD19-positive cells. Intravital FLIM of adoptively transferred Yellow-
                                    CaB cells shows that calcium concentrations are highly dynamic in B cells involved in the GC reac-
                                    tion. We describe different patterns of calcium fluctuation regarding amplitude and baseline within
                                    non-activated and AG experienced cells and plasma blasts. We observe the emergence of Ca2+-high
                                    differentiated B cells and plasma blast populations, which might point to cells undergoing metabolic
                                    stress.

Ulbricht et al. eLife 2021;10:e56020. DOI: https://doi.org/10.7554/eLife.56020                                                           2 of 26
Research article                                                                                              Immunology and Inflammation

                                     Results
                                     YellowCaB: a system for FRET-based calcium analysis in B cells
                                     Mice expressing a loxP-flanked STOP sequence followed by the TN-XXL-construct inserted into the
                                     ROSA26 locus were crossed with the CD19-Cre strain (Rickert et al., 1997). The offspring had exclu-
                                     sive expression of the GECI TN-XXL in CD19+ B lymphocytes, as confirmed by visualization of eCFP
                                     and citrine fluorescence by confocal microscopy after magnetic B cell isolation (Figure 1a, b). These
                                     YellowCaB cells were excited with a 405 nm laser that is capable of exciting eCFP but not citrine.
                                     The detection of yellow emission thus can be attributed to baseline FRET representing steady-state
                                     calcium levels. Expression of TN-XXL in YellowCaB mice was further confirmed by flow cytometry
                                     after excitation with the 488 nm laser and detection in a CD19+GFP+(green fluorescent protein) gate
                                     that would also detect citrine fluorescence. Citrine was found to be present in a substantial part of
                                     CD19+ B lymphocytes and was not detectable in the CD19- population (Figure 1c). Cd19cre/+ mice
                                     heterozygous for TN-XXL and Cd19cre/+ mice homozygous for TN-XXL did not differ in the

Figure 1. The genetically encoded calcium indicator (GECI) TN-XXL is functionally expressed in CD19+ B cells of YellowCaB mice. (a) Schematic
representation of the genetically encoded calcium indicator TN-XXL with the calcium-sensitive domain troponin C (TnC) fused to donor fluorophore
eCFP and acceptor fluorophore citrine. Binding of Ca2+ ions within (up to) four loops of TnC leads to quenching of eCFP and Förster resonance energy
transfer (FRET) to citrine. (b) Confocal image of freshly isolated CD19+ B cells. Overlapping blue and yellow-green fluorescence of eCFP and citrine,
respectively, can be detected after Cre-loxP-mediated expression of the TN-XXL vector in YellowCaB mice. (c) Flow cytometric analysis of TN-XXL
expression in lymphocytes from YellowCaB mice. (d) Flow cytometric measurement of calcium flux after addition of ionomycin and
phosphate buffered saline control. (e) Continuous perfusion imaging chamber for live cell imaging. (f) Confocal measurement of mean fluorescence
intensity and FRET signal change after addition of ionomycin to continuously perfused YellowCaB cells. Data representative for at least 100 cells out of
three independent experiments. (g) Frequency histogram of > 100 YellowCaB single cells, FRET analyzed after ionomycin stimulation. Threshold chosen
for positive FRET signal change = 20% over baseline intensity.
The online version of this article includes the following figure supplement(s) for figure 1:
Figure supplement 1. Genotyping of YellowCaB mice and cell numbers.

Ulbricht et al. eLife 2021;10:e56020. DOI: https://doi.org/10.7554/eLife.56020                                                                   3 of 26
Research article                                                                                    Immunology and Inflammation

                                    proportion of cells within the CD19+GFP+ population, nor did male and female mice (Figure 1—fig-
                                    ure supplement 1). In addition, no differences in total cell numbers and B cell numbers between
                                    Cd19cre/+Tn-xxl+/-, Cd19cre/+ Tn-xxl+/+, and wild-type mice were detected (Figure 1—figure supple-
                                    ment 1). We next set out to test if we could induce a FRET signal change under calcium-saturating
                                    conditions in the cytoplasm. The ionophore ionomycin is commonly used as positive control in in
                                    vitro experiments measuring calcium concentrations as it uncouples the increase of calcium concen-
                                    tration from the physiological entry sites of Ca2+ ions by forming holes in the cell membrane. When
                                    stimulated with ionomycin, a steep increase of the FRET level over baseline was recorded by flow
                                    cytometry in the GFP-channel after excitation with the 405 nm laser. Calcium-dependence of the sig-
                                    nal increase was further independently confirmed by staining with the calcium sensitive dye X-Rhod-
                                    1, that shows a red fluorescence signal increase after calcium binding (Figure 1d; Li et al., 2003).
                                        In preparation of our intravital imaging experiments, we first tested if the YellowCaB system is
                                    stable enough for time-resolved microscopic measurements and sensitive enough for subtle cyto-
                                    plasmic calcium concentration changes as they occur after store-operated calcium entry (SOCE). In
                                    SOCE, stimulation of the BCR with AG leads to drainage of intracellular calcium stores in the endo-
                                    plasmic reticulum (ER), which triggers calcium influx from the extracellular space into the cytosol
                                    through specialized channels (Baba et al., 2014). We established a customizable perfusion flow
                                    chamber system to monitor and manipulate YellowCaB cells over the duration of minutes to hours
                                    (Figure 1e). Division of the fluorescence intensity of electron acceptor citrine by that of donor eCFP
                                    yields the FRET ratio (R), which is then put into relationship to baseline FRET levels. As expected, we
                                    detected a decrease of the eCFP signal, concurrent with an increased citrine fluorescence after the
                                    addition of 4 mg/ml ionomycin to continuous flow of 6 mM Krebs–Ringer solution. Overall, this
                                    resulted in a maximal elevation of DR/R of 50–55% over baseline (Figure 1f). Analysis of >100 cells
                                    showed that approximately in three quarters of the cells we were able to detect FRET in response to
                                    ionomycin treatment, and that the majority of these cells showed 35–40% FRET signal change.
                                    According to the two populations visible in the histogram, we defined a change of 20% DR/R as a
                                    relevant threshold for the positive evaluation of responsiveness (Figure 1g). In conclusion, we
                                    achieved the functional and well-tolerated expression of TN-XXL exclusively in murine CD19+ B cells
                                    for measurement of changes of cytoplasmic calcium concentrations.

                                    Repeated BCR stimulation results in fluctuating cytoplasmic calcium
                                    concentrations
                                    SOCE in B cells can be provoked experimentally by stimulation of the BCR with multivalent AG, for
                                    example, anti-Ig heavy chain F(ab)2 fragments. To test the functional performance of the GECI TN-
                                    XXL in YellowCaB cells, we stimulated isolated YellowCaB cells with 10 mg/ml anti-IgM F(ab)2 frag-
                                    ments to activate the BCR. In an open culture imaging chamber, we induced an elevated FRET signal
                                    with a peak height of >30% that lasted over 3 min (Figure 2a). The signal declines after this time
                                    span, probably due to BCR internalization or the activity of ion pumps. We tested antibody concen-
                                    trations at 2, 4, 10, and 20 mg/ml. An antibody concentration of 2 mg/ml was not enough to provoke
                                    calcium flux (data not shown), whereas at 4 mg/ml anti-IgM-F(ab)2 we observed 20% an elevated DR/
                                    R over baseline (Figure 2b). At 20 mg/ml anti-IgM-F(ab)2, we detected no further FRET increase (Fig-
                                    ure 2—figure supplement 1a, b). Thus, we conclude a concentration dependency of the GECI TN-
                                    XXL and saturating conditions at 10 mg/ml BCR heavy chain stimulation. Interestingly, the reaction is
                                    not completely cut off after the FRET signal has declined, but a residual FRET signal of about 7%
                                    compared to baseline values was measured for approximately 3.5 additional minutes (Figure 2a).
                                    Thus, B cells seem to be able to store extra calcium within the cytoplasm for some time. We there-
                                    fore wondered if it is possible to stimulate YellowCaB cells more than once. For this purpose, we
                                    connected our imaging culture chamber to a peristaltic pump and took advantage of the fact that
                                    under continuous perfusion with Ringer solution the flow will dilute the antibody out of the chamber.
                                    This way, it is possible to stimulate B cells several times rapidly and subsequently, before BCRs are
                                    internalized, indicated by multiple peaks in DR/R (Figure 2b). In addition, stimulation of the BCR
                                    light chain using an anti-kappa antibody led to calcium increase within YellowCaB cells (Figure 2—
                                    figure supplement 1a). Of note, the resulting FRET peak is shaped differently, and concentra-
                                    tions > 150 mg/ml antibody were needed in order to generate a response.
                                       Since T cell engagement and the binding of microbial targets to innate receptors like TLRs have
                                    also been described to raise cytoplasmic calcium in B cells (Ojaniemi et al., 2003; Pone et al.,

Ulbricht et al. eLife 2021;10:e56020. DOI: https://doi.org/10.7554/eLife.56020                                                      4 of 26
Research article Immunology and Inflammation
p=0.0086
a e ns
3:18min anti IgM F(ab)2 0.6
0.6 Ionomycin
mean DR/R
0.4 0.4
0.2
DR/R
0.0 0.2
-0.2 1 2 3 4 5:24 8:42 10 11 12 13 14 15
-0.4 time [min] 0.0
1st LPS 2nd
pump on
pump on
pump on
1st 2nd IgM-F(ab)2 IgM-F(ab)2
b 0.6 anti-IgM-(F(ab)2 anti-IgM-(F(ab)2 Ionomycin
p=0.0003
0.4 0.4
ns
DR/R
0.2
mean DR/R
0.0
0.2
-0.2 1 2 3 4 5 6 7 8 9 10 11 12 13 14 15
-0.4 time [min]
0.0
auc = 26
0.6 anti-CD40 anti-IgM-F(ab)2 auc = 12 1st IgM-F(ab)2 2nd
c auc = 3,4 Ionomycin
CpG CpG
0.4
DR/R
0.2
0.0
-0.2 1 2 3 4 5 6 7 8 9 10
time [min]
-0.4
anti-IgM-F(ab)2
d 0.6
pump on
pump on
pump on
CpG
CpG
0.4
DR/R
0.2
0.0
-0.2 1 2 3 4 5 6 7 9 10
-0.4
time [min]
Figure 2. B cell receptor (BCR) stimulation specifically leads to calcium mobilization in YellowCaB cells in vitro. (a) Confocal measurement of Förster
resonance energy transfer (FRET) duration (DR/R > 0) in non-perfused primary polyclonal YellowCaB cells after addition of 10 mg/ml anti-IgM-F(ab)2
(black) and ionomycin control (gray). Data representative for at least 35 single cells in four independent experiments. (b) Confocal measurement of
FRET signal change after repeated addition of anti-IgM-F(ab)2 to perfused primary polyclonal YellowCaB cells. Data representative for at least 50 cells
out of five independent experiments. (c) Confocal measurement of FRET signal change after addition of anti-IgM-F(ab)2 to perfused primary polyclonal
YellowCaB cells following stimulation with anti-CD40 antibody and ionomycin as positive control. Examples of transient cytoplasmic (blue), intermediate
(gray), and sustained calcium mobilization shown, area under the curve compared. Data representative for 26 cells out of two independent experiments.
(d) Resulting FRET curve out for n = 7 primary polyclonal YellowCaB cells perfused with toll-like receptor (TLR)9 stimulator cytosine phosphate guanine
(CpG) in Ringer solution and subsequent addition of anti-IgM-F(ab)2. (e) Mean FRET signal change over time after addition of TLR4 or TLR9 stimulation
in combination with BCR crosslinking by anti-IgM-F(ab)2 in perfused polyclonal YellowCaB cells. n = 12 (top) and n = 8 (bottom), one-way ANOVA. Error
bars: SD/mean.
The online version of this article includes the following figure supplement(s) for figure 2:
Figure supplement 1. Confocal measurement and plot of TN-XXL DR/R over time.
2015; Ren et al., 2014), we investigated the response of YellowCaB cells after incubation with anti-
CD40 antibodies, as well as the TLR4 and TLR9 stimuli lipopolysaccharide (LPS) and cytosine-phos-
phate-guanine-rich regions of bacterial DNA (CpG), respectively. Within the same cells, we detected
no reaction to anti-CD40 treatment alone, but observed three types of shapes in post-CD40 BCR-
stimulated calcium responses, which differed from anti-CD40-untreated cells (Figure 2a). These cal-
cium flux patterns were either sustained, transient, or of an intermediate shape (Figure 2c). Sus-
tained calcium flux even saturated the sensor at a level comparable to that achieved by ionomycin
treatment. Cells that showed only intermediate flux maintained their ability to respond to ionomycin
treatment at high FRET levels, as demonstrated by the DR/R reaching 0.4 again after stimulation
(Figure 2c). Furthermore, integrated TLR and BCR stimulation affected the appearance of the cal-
cium signal. The addition of TLR9 stimulus CpG alone had no effect on YellowCaB FRET levels; how-
ever, the subsequent FRET peak in response to anti-Ig-F(ab)2 was delayed (Figure 2d, e).
Ulbricht et al. eLife 2021;10:e56020. DOI: https://doi.org/10.7554/eLife.56020 5 of 26
Research article                                                                                     Immunology and Inflammation

                                        TLR4 stimulation via LPS could elevate calcium concentration of B cells, but only to a minor extent
                                    (Figure 2e). When TLR4 stimulation by LPS was performed before BCR stimulation, decreased FRET
                                    levels in response to anti-IgM-F(ab)2 were observed. We conclude that, in order to become fully acti-
                                    vated, B cells are able to collect and integrate multiple BCR-induced calcium signals and that signal-
                                    ing patterns are further shaped by innate signals or T cell help. BCR inhibition abolishes a FRET
                                    signal change in response to anti-IgM-F(ab)2 (Figure 2—figure supplement 1b). Of note, we
                                    excluded the possibility that measured signal changes were related to chemokine stimulation. In
                                    vitro, we detected no FRET peak after applying CXCL12, probably because of lacking GECI sensitiv-
                                    ity to small cytoplasmic changes (Figure 2—figure supplement 1c, d). Thus, the YellowCaB system
                                    is well suited for the detection of BCR-induced cytosolic calcium concentration changes.

                                    Fluctuating calcium levels are observed as a result of sequential cell
                                    contacts in vivo
                                    We next set out to investigate if the ability of B cells to collect calcium signals sequentially is also
                                    shared by GC B cells. For two-photon intravital imaging, nitrophenyl (NP)-specific B1-8hi B cells from
                                    YellowCaB mice were magnetically isolated and transferred into wild-type hosts, which were subse-
                                    quently immunized with NP-chicken gamma globulin (CGG) into the right foot pad (Shih et al.,
                                    2002a). Mice were imaged at day 8 p.i. when GCs had been fully established. Activated TN-XXL+
                                    YellowCaB cells had migrated into the GC, as confirmed by positive PNA- and anti-FP-immunofluo-
                                    rescence histology (Figure 3a). At this time point, mice were surgically prepared for imaging as
                                    described before (Ulbricht et al., 2017). Briefly, the right popliteal lymph node was exposed, mois-
                                    turized, and flattened under a cover slip sealed against liquid drainage by an insulating compound.
                                    The temperature of the lymph node was adjusted to 37˚C and monitored during the measurement.
                                    Our experiments revealed that the movement of single YellowCaB cells is traceable in vivo. Calcium
                                    fluctuations can be made visible by intensity changes in an extra channel that depicts the FRET sig-
                                    nal, as calculated from relative quenching of TN-XXL. Color coding of intensity changes in the FRET
                                    channel showed time-dependent fluctuations of the signal and, in some particular cases, a sustained
                                    increase after prolonged contacts between two YellowCaB cells (Figure 3b, Video 1). Interestingly,
                                    FRET intensity seemed to be mostly fluctuating around low levels in moving cells, whereas sustained
                                    increase required cell arrest, as reported previously (Negulescu et al., 1996; Shulman et al., 2014),
                                    (Figure 3—figure supplement 1). The observed calcium fluctuations might therefore coincide with
                                    cell-to-cell contacts between follicular dendritic cells (FDCs) and B cells, resulting in AG-dependent
                                    BCR stimulation. To test for this, we first measured the colocalization between signals within the
                                    FDC channel and the citrine channel. The intensity of colocalization Icoloc of all cells was plotted as a
                                    function of frequency and biexponentially fitted (Figure 3c). We set the threshold for a strong and
                                    sustained colocalization of FDCs and B cells to an intensity of 150 AU within the colocalization chan-
                                    nel. At this value, the decay of the biexponential fit was below 10%. We thus decided to term all
                                    cells with a colocalization intensity = 0 (naturally the most abundant ones) not colocalized, cells with
                                    a colocalization intensity between 1 and 150 transiently colocalized to FDCs (‘scanning’ or shortly
                                    touching the FDCs), and all cells above this intensity threshold strongly or stably colocalized. We
                                    compared the relative FRET intensity changes DR/R of two tracked cells (Figure 3b, cells 1 and 2),
                                    where baseline R is the lowest FRET intensity measured, and its contacts to FDCs. We detected sev-
                                    eral transient B-cell–FDC contacts in cell 1 that were followed by a gradual increase of DR/R, indicat-
                                    ing an increase of cytoplasmic calcium concentration (Figure 3d). Cell 2 kept strong FDC contact
                                    over the whole imaging time and maintained elevated, mostly stable values. These experiments con-
                                    firmed that GC B cells are able to collect calcium as a consequence of repeated contact events,
                                    which are mediated by B cell-to-FDC contacts in vivo.

                                    Calibration of the TN-XXL construct for in vivo quantification of
                                    cytosolic calcium in B lymphocytes using the phasor approach to FRET–
                                    FLIM
                                    The comparison of calcium responses in different B cell subsets of multiple GCs requires normaliza-
                                    tion of TN-XXL FRET. Since this is hardly achievable in tissue due to its inherent heterogeneity, we
                                    aimed for the determination of absolute cytosolic concentration values in YellowCaB cells by calibra-
                                    tion of TN-XXL FRET intensities. However, ratiometric calibration would require equal conditions for

Ulbricht et al. eLife 2021;10:e56020. DOI: https://doi.org/10.7554/eLife.56020                                                        6 of 26
Research article                                                                                                 Immunology and Inflammation

Figure 3. YellowCaB cells form productive germinal centers in vivo and show active B cell receptor signaling after cell-to-cell contacts. (a) Histological
analysis of host mouse lymph nodes after adoptive transfer of YellowCaB cells. TN-XXL (green)-positive cells cluster in IgD (blue)-negative regions; a
germinal center phenotype is confirmed by PNA staining (red). Scale bar 50 mm. (b) Stills of ratiometric intravital imaging of adoptively transferred
YellowCaB cells. 3D surface rendering and single-cell tracking (track line in yellow) with relative color coding ranging from blue = low DR/R to
red = high DR/R (c) Histogram showing segmented objects binned due to colocalization intensity within bin width of 20 AU and biexponential fit of
data. Total number of objects = 6869. A curve decay of
Research article Immunology and Inflammation
obstacles of multicomponent exponential analysis
and yields model-free, readily comparable pixel-
or cell-based plots that assign a position within a
semicircle to each data point, dependent on the
mixture of lifetime components present
(Leben et al., 2018).
Typically, data correction based on reference
dyes is needed for reliable phasor analysis
(Ranjit et al., 2018). We verified the reliability of
our TCSPC setup to acquire high-quality fluores-
cence decays in an image to be evaluated using
the phasor approach by measuring the instru-
Video 1. Detail of intravital ratiometric imaging (day 8
p.i.) within germinal center. YellowCaB cells had been ment response function given by the second har-
adoptively transferred, and FDCs were in vivo-labeled monic generation signal (SHG) of potassium-
with anti-CD21/35 antibody (white). 3D surface dihydro-phosphate crystals (laser excitation wave-
rendering and single-cell tracking (track line in yellow) length 940 nm) and the fluorescence decays of
with color coding ranging from blue = low DR/R to eGFP, expressed in HEK cells (laser excitation
red = high DR/R. 103 frames, 7 frames per second (fps),
wavelength 900 nm). As shown with the phasor
scale bar 50 mm.
plots of the raw data (Figure 4a), both the SHG
https://elifesciences.org/articles/56020#video1
signal and the eGFP fluorescence are located in
expected positions on the semicircle
(Murakoshi et al., 2008; Rinnenthal et al.,
2013). Therefore, no further correction of the
data is necessary in our system.
As the TN-XXL construct is exclusively expressed in the cytosol of B lymphocytes from YellowCaB
mice, the following equilibrium holds true for Ca2+ (free cytosolic calcium), TNXXL (the calcium-free
FRET construct, i.e., the unfolded tertiary structure of TnC), and Ca2+TNXXL (the FRET construct sat-
urated by calcium, i.e., the completely folded tertiary structure of TnC):
Ca2þ þ TNXXL ! Ca2þ TNXXL (1)
characterized by the dissociation constant Kd:
½Ca2þ TNXXL
Kd ¼ (2)
½Ca2þ ½TNXXL
As measured in lysate of YellowCaB B cells expressing TN-XXL, the fluorescence lifetime t of the
donor eCFP of the FRET Ca-sensitive construct TN-XXL depends on the free calcium concentration
[Ca2+] following a sigmoidal function (Eq. 3).
t free t FRET
t ¼ t FRET þ ðlog10 ½Ca2þ log10 Kd ÞHill slope
(3)
1 þ 10
with tfree the fluorescence lifetime eCFP at 0 nM free calcium, and tFRET the fluorescence lifetime of
completely FRET-quenched eCFP in the TN XXL-construct at 39 mM free calcium. By fitting the fluo-
rescence lifetime of eCFP in TN-XXL excited at 850 nm and detected at 460 ± 30 nm acquired in
time domain using our TCSPC system at various free calcium concentrations, we determined
Kd = 475 ± 46 nM and Hill slope = 1.43 ± 0.17 (Figure 4b). Thus, we can calculate the free calcium
concentration as
t t FRET
2þ log10 tfree t FRET 1
log10 Ca ¼ log10 Kd (4)
Hill slope
Similar to the calculation in time domain, for the phase domain we can express each phasor vec-
!
tor p based on the formalism proposed by Celli and colleagues (Celli et al., 2010) as
! !
! ½Ca2þ TNXXL"FRET p FRET þ ½TNXXL"free p free
p¼ (5)
½Ca2þ TNXXL"FRET þ ½TNXXL"free
Ulbricht et al. eLife 2021;10:e56020. DOI: https://doi.org/10.7554/eLife.56020 8 of 26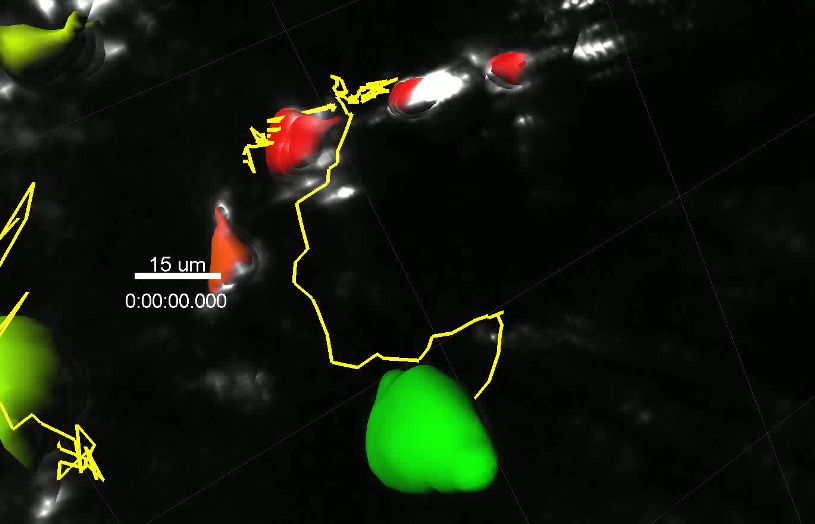
Research article Immunology and Inflammation
a 3 ns
2 ns 3 ns
2 ns
1 ns
1 ns 4 ns
4 ns τ [ns] τ [ns]
5 ns 5+ 5 ns 5+
4 4
3 3
10 ns 2 10 ns 2
1 20 ns 1
20 ns
0 0
0 ns 0 ns
b 160 0 nM free Ca2+
c [TNXXL]
140 2500
fluorescence lifetime [ps]
120
602 nM free Ca2+ 2250
fluorescence [counts]
100 39 µM free Ca2+ 2000
80 1750 [Ca2+ TNXXL]
60
1500 pfree plysate
1250
1000
pFRET
40
750
500
0 2000 4000 6000 8000 10000 12000 -10 -9 -8 -7 -6 -5 -4
time [ps] lg[Ca2+]
d 1000
e
fluorescence / counts
100
pln1
pfree
pln2 pln3
10
pFRET
0 2000 4000 6000 8000 10000 12000
time / ps
f
100 µm 130 µm 160 µm
g
Figure 4. Calibration of the TN-XXL construct using fluorescence lifetime imaging of its Förster resonance energy transfer donor. (a) Left panel: phasor
plot of second harmonic generation signal of potassium dihydrogen phosphate crystals and lifetime image (inset, scale in picoseconds) corresponding
to the instrument response function (t = 80 ± 10 ps). lexc = 940 nm, ldetection = 466±20 nm. Right panel: phasor plot of GFP fluorescence expressed in
HEK cells and fluorescence lifetime image (inset, the same scale as in the left panel), corresponding to mono-exponential decay GFP fluorescence
(t = 2500 ± 100 ps). lexc = 900 nm, ldetection = 525±25 nm. (b) Left panel: fluorescence decays of CFP in TN-XXL construct from lysates of B lymphocytes
at 0 nM, 602 nM, and 39 mM free calcium. Right panel: titration curve of TN-XXL resulting from the time-domain evaluation of decay curves as shown in
the left panel (three independent experiments). lexc = 850 nm, ldetection = 466±20 nm. (c) Phasor plot of representative data shown in (b) – time-
Figure 4 continued on next page
Ulbricht et al. eLife 2021;10:e56020. DOI: https://doi.org/10.7554/eLife.56020 9 of 26
Research article                                                                                                             Immunology and Inflammation

Figure 4 continued
resolved fluorescence images 422  422 pixels (200  200 mm2); time-bin = 55 ps; time window = 12.4 ns. Blue phasor cloud (with central phase vector
!                                                                                              !
p   free)   corresponds to 0 nM free calcium, gray cloud (with central phase vector p              lysate)   to 602 nM free calcium, and red cloud (with central phase vector
!
p FRET) to 39 mM free calcium. The dotted line connects the centers of the blue and red clouds, respectively, whereas the gray cloud is located on this
line. The dotted line corresponds to the calibration segment as it results from measurements of TN-XXL in cell lysates. (d) Left panel: representative
fluorescence decays of eCFP in two B lymphocytes (indicated by red and blue arrowheads in the inset image, right panel) expressing TN-XXL in the
medullary cords of a popliteal lymph node of a YellowCaB mouse (right panel) and corresponding mono-exponential fitting curves (red fitting curve:
t = 703 ± 56 ps; blue fitting curve: t = 1937 ± 49 ps). We measured t = 2303 ± 53 ps in splenocytes expressing only CFP. (e) Phasor plot showing time-
                                                                                                                                               !
resolved CFP fluorescence data from three lymph nodes, in three YellowCaB mice (light gray – with central phase vector p                           ln3,   gray – with central phase
              !                                                       !
vector p p ln1, and dark gray – with central phase vector p ln2) – time-resolved fluorescence images 505  505 pixels (512  512 mm2); time-bin = 55 ps;
time window = 12.4 ns. Additionally, the calibration segment (dotted line) and the phasor clouds measured in lysates of B lymphocytes expressing TN-
XXL at 0 nM and 39 mM free calcium from (c) are displayed. (f) Phasor plots of the CFP fluorescence (time-resolved fluorescence images 505  505
pixels / 512  512 mm2) acquired at three different depths (100, 130, and 160 mm from the organ capsule surface) in the popliteal lymph node of a
YellowCaB mouse. The red line in each phasor plot represents the calibration segment also displayed in (c) and (e). (g) Phasor plot of signal acquired in
the lymph node of a non-fluorescent mouse. lexc = 850 nm, ldetection = 466±20 nm.
The online version of this article includes the following figure supplement(s) for figure 4:
Figure supplement 1. Phasor plot showing time-resolved CFP fluorescence data of B lymphocytes from YellowCaB mice in culture (gray cloud – with
                           !
central phase vector p         Bcells)   – time-resolved fluorescence images 471  471 pixels (250  250 mm2); time-bin = 55 ps; time window = 12.4 ns.

                                                 with efree and eFRET the relative brightness (Chen et al., 1999; Müller et al., 2000) of eCFP in TNXXL
                                                 at 0 nM and saturated (39 mM) free calcium, given by the following equations:

                                                                                              "free ¼ dCFP  hfree ¼ dCFP  kF  t free                                         (6)

                                                                                           "FRET ¼ dCFP  hFRET ¼ dCFP  kF  t FRET                                            (7)

                                                 with dCFP the effective two-photon absorption cross section of eCFP (independent of the pathways
                                                 of relaxation from the excited state), and kF the fluorescence rate of eCFP in vacuum, that is, no
                                                 quenching due to surrounding molecules.
                                                    The phase vectors can be written also as complex numbers as given by the following equations:
                                                                                                             !
                                                                                                              p ¼ Re þ i  Im                                                   (8)

                                                                                                       !
                                                                                                       p free ¼ Refree þ i  Imfree                                             (9)

                                                                                                   !
                                                                                                   p FRET ¼ ReFRET þ i  ImFRET                                                (10)

                                                    We determined the averages and median real and imaginary values of the phasor distributions
                                                 obtained by performing FRET–FLIM in lysates of YellowCaB B cells at 0 nM and 39 mM free calcium
                                                 to be Refree = 0.4035 (average), 0.40326 (median); Imfree = 0.45801 (average), 0.45779 (median) and
                                                 ReFRET = 0.82377 (average), 0.82203 (median); ImFRET = 0.3225 (average), 0.32093 (median), respec-
                                                 tively, indicating that both distributions are symmetric, corresponding to normal distributions
                                                 (Figure 4c).
                                                    From Eqs. (5–10) combined with Eq. (2), the free cytosolic calcium concentration is given by
                                                                                                              qffiffiffiffiffiffiffiffiffiffiffiffiffiffiffiffiffiffiffiffiffiffiffiffiffiffiffiffiffiffiffiffiffiffiffiffiffiffiffiffiffiffiffiffiffiffiffiffiffiffiffiffiffiffiffiffiffiffi
                                                                                                                                        2                             2
                                                                                      !    !
                                                                   2þ        "free p p free        t free         Re Refree þ Im Imfree
                                                                   Ca    ¼ Kd               ! ¼ Kd          qffiffiffiffiffiffiffiffiffiffiffiffiffiffiffiffiffiffiffiffiffiffiffiffiffiffiffiffiffiffiffiffiffiffiffiffiffiffiffiffiffiffiffiffiffiffiffiffiffiffiffiffiffiffiffiffiffiffiffiffiffiffiffi (11)
                                                                              "FRET ! p FRET p      t FRET
                                                                                                               ðReFRET ReÞ2 þðImFRET ImÞ2

                                                    Thus, the free calcium concentration depends only on the Kd, tfree, tFRET as determined from the
                                                 calibration curve measured in lysate and the phase vectors, describing the extreme states of eCFP in
                                                 the TN-XXL construct.
                                                    Since variations in refractive index, ion strength, pH value, or temperature in the cytosol of the B
                                                 lymphocytes may additionally influence the fluorescence lifetime of eCFP, as well as the phase

Ulbricht et al. eLife 2021;10:e56020. DOI: https://doi.org/10.7554/eLife.56020                                                                                             10 of 26
Research article Immunology and Inflammation
! !
vectors p free and p FRET (Jameson et al., 1984; Scott et al., 1970), we verified whether the FRET tra-
jectory of the-TN-XXL construct changes in the cytosol of B lymphocytes in cell culture (Figure 4—
figure supplement 1) and under in vivo conditions, in lymph nodes (Figure 4d, e). We found that in
all our measurements the phasor cloud lays on the trajectory determined in lysate solutions
(Figure 4e). Measurements performed at different depths in lymph nodes led to the same result:
there is no change in the slope of the trajectory at different tissue depths (Figure 4f).
To assess the impact of autofluorescence on the interpretation of the fluorescence signal in the
phasor plot and, thus, on the cytosolic calcium levels, we also performed FLIM in B cell follicles of
lymph nodes of non-fluorescent wild-type mice. While the acquired signal was extremely low, the
phasor cloud in these measurements was located around position (0,0) in the plot, indicating that it
mainly originates from detector noise (Figure 4g).
We compared the results of cytosolic free calcium concentration determined using the time-
domain and the phase-domain approach and found deviations of max. 5% between the evaluation
pathways using Eqs. (4) and (11) due to numerical uncertainty. We determined the calcium dynamic
range of TN-XXL measured by phasor-analyzed FRET–FLIM to span between 100 nM and 4 mM free
calcium, with the linear range of the titration curve in the range between 265 and 857 nM free
calcium.
Comparative FLIM–FRET reveals heterogeneity of absolute calcium
concentrations in B cells in vivo
Adoptively transferring AG-specific YellowCaB cells and non-AG-specific (polyclonal) YellowCaB cells
(stained ex vivo) allowed us to divide GC B cells into five different populations based on their loca-
tion in the imaging volume and their fluorescent appearance (Figure 5a, b). At day 8 p.i., polyclonal
YellowCaB cells, identified by their red labeling, mostly lined up at the follicular mantle around the
GC, with some of them having already entered into activated B cell follicles. AG-specific, citrine-pos-
itive B1-8hi:YellowCaB cells were found clustered in the GC, close to FDCs, outside of GC bound-
aries, or as bigger, ellipsoid cells in the extrafollicular medullary cords (MC), probably comprising
plasma blasts (Figure 5b, left). Color-coded 2D- and 3D FLIM analysis of these populations con-
firmed that calcium concentrations were fluctuating within all of those B cell populations, and that
most B cells were maintaining relatively high mean eCFP fluorescence lifetimes and therefore low
calcium concentrations on average, with only few exceptions (Figure 5b, middle and right, Video 2).
Bulk analysis of cells revealed additional calcium-intermediate and calcium-high cell subsets pres-
ent among AG-specific cells and plasma blasts (Figure 5c, Video 3). Especially for plasma blasts this
was somehow unexpected, given that these are thought to downregulate their surface BCR during
differentiation.
Comparison of AG-specific cells inside GCs with those outside GCs and non-AG-specific cells
inside GCs as well with those outside GCs showed that the distribution of calcium concentrations of
these B cells was dependent on BCR specificity and rather independent from their location within
the imaging volume, despite higher fluctuation seen among AG-specific populations (Figure 5—fig-
ure supplement 1). These maxima were reached as transient fluctuation peaks, that is, periods
shorter than 1 min, in which these concentrations seem to be tolerated. Calcium values exceeding
the dynamic range of TN-XXL (>857 nM) were recorded for all measured subsets, but most cells >857
nM were found among intrafollicular AG-specific B cells and extrafollicular AG-specific B cells
(Figure 5d). The heterogeneity in temporal calcium concentrations therefore is smallest among non-
AG-specific B cells, increases with activation in AG-specific GC B cells, and is most prominent among
MC-plasma blasts. The high cytoplasmic calcium levels observed in MC-plasma blasts were unlikely
to be the result of chemokine-induced signaling since only a minor calcium increase was detected
after CXCL12 stimulation in vitro (Figure 2—figure supplement 1d). Thus, a progressive heteroge-
neity of calcium signals within B cells can be seen alongside the process of activation and
differentiation.
Functional relevance of increased calcium concentration among
extrafollicular YellowCaB cells
We next wondered if high cytoplasmic calcium levels within certain B cell subsets could be the result
of AG-mediated signals. We therefore intravenously (i.v.) injected NP-bovine serum albumine (BSA)
Ulbricht et al. eLife 2021;10:e56020. DOI: https://doi.org/10.7554/eLife.56020 11 of 26Research article Immunology and Inflammation
a polyclonal/non-AG-spec.
YellowCaBs, stained
FDC-label
AG-spec. AG d7 d8
d0
YellowCaBs
absolute cytoplasmic Ca2+
b MC MC MC c
MC 1500
MC MC MC
Ca2+ conc. [nM]
GC GC GC
1000
500
G
GCC GC
C
MC MC MC
MC
MC
0
phasor projection
)
c.
c.
C
pe
(M
pe
-s
-s
c.
G
G
pe
AG-spec. YellowCaBs d8p.i.
A
3000ps
tau unquenched tau quenched
A
100nM Ca2+
n-
FDCs
-s
0ps
(2300ps) (700ps) 800nM Ca2+
non-AG-spec. YellowCaBs d1p.i.
no
G
A
MC MC
non-AG-spec. AG-spec. AG-spec. (MC)
d 3000 3000 3000
2500 2500 2500
Ca2+ conc. [nM]
2000 2000 2000
1500 1500 1500
1000 1000 1000
500 500 500
0 0 0
10 20 30 40 10 20 30 40 10 20 30 40
min
Figure 5. Determination of absolute calcium concentration by intravital fluorescence lifetime imaging of germinal center (GC) B cell populations.
(a) Cell transfer and immunization strategy for intravital imaging of antigen (AG)-specific and polyclonal YellowCaB cells. (b) Left: maximum intensity
projection of a z-stack, intravitally imaged GC, and medullary cords (MCs). B cells were distinguished as polyclonal, non-AG-specific YellowCaB cells
(red), AG-specific YellowCaB cells, and AG-specific cells inside the MC. Middle: color-coded fluorescence lifetime image with lifetimes of unquenched
eCFP depicted in blue and lifetimes of quenched eCFP in red. Right: 3D-rendered, color-coded z-stack showing absolute calcium concentrations in GC
and MC. Yellow arrows point to cells containing high cytoplasmic calcium. (c) Bulk analysis of absolute calcium concentrations in segmented single-cell
objects from B cell subsets at any given time point measured. The dynamic range of the genetically encoded calcium indicator (GECI) TN-XXL is
indicated by blue dashed lines. (d) Time-resolved analysis of calcium concentrations in tracked segmented objects corresponding to B cell subsets in
(c). 2 frames per minute. Non-AG-specific YellowCaB cells (left, n = 92 tracks); AG-specific YellowCaB cells (middle, n = 169 tracks); and extrafollicular
AG-specific YellowCaB cells in MC (right, n = 69 tracks). The dynamic range of the GECI TN-XXL is indicated by blue dashed lines.
The online version of this article includes the following figure supplement(s) for figure 5:
Figure supplement 1. Mean calcium concentration and SD in non-antigen (AG)-specific and AG-specific YellowCaB cells distinguished by localization.
(66 kDa) into mice that had been adoptively transferred with B1-8hi (AG-specific) YellowCaB cells
and recorded absolute calcium concentrations within the GC by intravital FLIM. Antigens up to 70
kDa have been reported to be transported into the follicles via conduits in less than 5 min
(Roozendaal et al., 2009). Accordingly, AG-specific GC YellowCaB cells significantly upregulated
cytoplasmic calcium after AG injection within minutes (Figure 6a, top panel, Figure 6—figure sup-
plement 1). To test if this concentration increase could be explained via BCR-dependent
AG recognition, we pre-injected the inhibitor of Bruton’s tyrosine kinase (BTK) ibrutinib
(Hendriks et al., 2014), which blocks BCR downstream activation, in a control group. BTK inhibition
could abrogate the increase in mean cytoplasmic calcium after additional injection of NP-BSA
(Figure 6a, bottom panel) and even seemed to downregulate baseline signals (Figure 6—figure
supplement 1). In addition, we found that also in 48 hr LPS/ interleukin 4 (IL-4)-cultured B1-8-plasma
Ulbricht et al. eLife 2021;10:e56020. DOI: https://doi.org/10.7554/eLife.56020 12 of 26Research article Immunology and Inflammation
blasts, an increase in calcium was detectable after
addition of NP-BSA (Figure 6—figure supple-
ment 2), suggesting that stimulation via AG
remains possible in at least a proportion of these
differentiated B cells.
These results led us to investigate the possible
sources of AG abundance outside of GCs and
their effect on calcium in B cells. Earlier studies
proposed that one possible AG source in lymph
nodes are subcapsular sinus macrophages
(SCSM) (Junt et al., 2007; Moran et al., 2018;
von Andrian and Mempel, 2003). We tested if
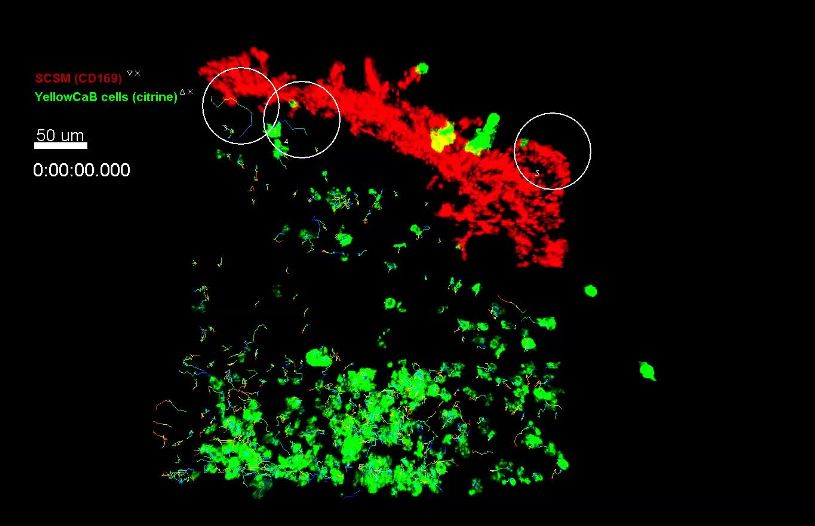
Video 2. Side-by-side depiction of fluorescence, SCSM contacts could be the cause of elevated
fluorescence lifetime imaging, and cell-based phasor calcium levels in extrafollicular B cells. We intravi-
data of intravitally imaged germinal center (day 8 p.i.), tally imaged wild-type host mice that have been
single z-plane. Left: fluorescence data with adoptively transferred with B1-8hi:YellowCaB cells
antigen (AG)-specific YellowCaB cells (green) and
and received an injection of efluor660-labeled
stained non-AG-specific YellowCaB cells transferred 1
anti-CD169 antibody together with the usual FDC
day prior to imaging (red; autofluorescence of capsule
also visible in the same channel). 4 fps, scale bar 50
labeling 1 day prior to analysis. We concentrated
mm. Middle: false color-coded presentation of on the area beneath the capsule, identified by
fluorescence lifetime t (0–3000 ps, see range scale in second harmonic generation signals of collagen
Figure 5b). 4 fps, scale bar 50 mm. Right: raw cell- fibers in this area. Thresholds of colocalization
based phasor plot with cells segmented according to between CD169+ macrophages and TN-XXL+ Yel-
fluorescence and spatial distribution, subsets indicated. lowCaB cells are described in Figure 6—figure
4 fps. supplement 3. Together, these methods led to a
https://elifesciences.org/articles/56020#video2 3D visualization of the SCS with CD169 stained
macrophages, lined up in close proximity
(Figure 6b). AG-specific YellowCaB cells were
detected clustering in GCs nearby. Extrafollicular
YellowCaB cells crowding the SCS space were found to have multiple contact sites to SCSM. Some
B cells were observed to migrate along the SCS, possibly scanning for antigenic signals (Video 4).
Bulk analysis of YellowCaB cells and their colocalization with SCSM showed that the calcium concen-
tration in YellowCaB cells with direct contact to SCSM reaches values that are more than doubled
compared to values in cells that were not in contact, and that calcium concentration is positively cor-
Video 3. Detail of Video 2 within medullary cords
and side-by-side depiction of fluorescence and Video 4. 3D projection of intravital imaging of
fluorescence lifetime imaging data, single z-plane. Left: germinal center and subcapsular sinus. YellowCaB cells
fluorescence data with antigen-specific YellowCaB cells (green, with track lines) and subcapsular sinus
(green) and autofluorescence of capsule (red). 4 fps, macrophages (red), stained by CD169 in vivo labeling.
scale bar 50 mm. Right: false color-coded presentation White circles highlight antigen-specific B cells
of fluorescence lifetime t (0–3000 ps, see range scale in migrating along subcapsular space. 4 fps, scale bar 50
Figure 5b). 4 fps. mm.
https://elifesciences.org/articles/56020#video3 https://elifesciences.org/articles/56020#video4
Ulbricht et al. eLife 2021;10:e56020. DOI: https://doi.org/10.7554/eLife.56020 13 of 26Research article Immunology and Inflammation
a b c
pResearch article Immunology and Inflammation
However, calcium mobilization within GC B cells was mostly investigated via ex vivo analysis of
sorted cells after adoptive transfer and immunization, or BCR activation was measured using a non-
reversible BCR signaling reporter like Nur77, altogether neglecting calcium flux (Khalil et al., 2012;
Mueller et al., 2015). These data suggested that BCR signaling in the GC is reduced. However, no
statement was made about the dynamics and timely coordination of (even small) calcium pulses and
the relation to their microenvironment. In fact, a recent study confirmed that BCR signals play a cen-
tral role in positive selection and display a fragile interdependence with costimulatory events
(Luo et al., 2018).
BCR-regulating surface proteins like CD22 or sialic acid-binding immunoglobulin-type lectins
have been related to development of autoimmunity and point out BCR-mediated calcium flux as an
important component, not only during B cell development but also in their differentiation to effector
cells (Hoffmann et al., 2007; Jellusova et al., 2010; Müller and Nitschke, 2014; Nitschke and Tsu-
bata, 2004; O’Keefe et al., 1999). Apart from regulating gene transcription, cytosolic calcium mobi-
lized has been shown to be essential for F-actin remodulation and B cell spreading on
antigen presenting cells (Maus et al., 2013). Furthermore, cytosolic calcium concentration is closely
linked to metabolic reprogramming of activated B cells and their cell fate (Boothby and Rickert,
2017; Caro-Maldonado et al., 2014). It has been shown that SOCE is acting directly on the mito-
chondrial capability to import cytosolic calcium (Shanmughapriya et al., 2016). In mitochondria, cal-
cium is regulating ATP production through increase of glycolysis and fatty acid oxidation, processes
for which activated and GC B cells have high demands, although there is controversy as to which of
the two metabolic pathways predominates in GC B cells (Griffiths and Rutter, 2009;
Jellusova et al., 2017; Maus et al., 2017; Weisel et al., 2020).
For flexible analysis of calcium mobilization in cells of the CD19+ lineage, we developed a novel
transgenic reporter system and image processing approach, enabling quantification of cytosolic cal-
cium concentrations. The FRET-based GECI TN-XXL can be used stably in moving, proliferating, and
differentiating lymphocytes, and the reversibility of the sensor makes it suitable for longitudinal intra-
vital measurements. Switching from ratiometric acquisition of FRET-donor and FRET-acceptor fluo-
rescence intensities to measuring FRET-donor fluorescence lifetime enabled quantification of
calcium concentrations in absolute numbers.
A first advantage of FRET–FLIM in tissue is that different photobleaching or scattering properties
of the fluorophores can be neglected. We further decided to perform all analyses based on the pha-
sor approach that circumvents the problem of multiexponential fluorescence decays we encounter
measuring a two-fluorophore FRET-based GECI in tissue. For titration of TN-XXL, we used lysate of
YellowCaB plasma blasts. Besides TN-XXL affinity, also eCFP fluorescence lifetime itself may be influ-
enced by large shifts in pH value, ionic strength, oxygenation, or temperature. We ensured that
these parameters were similar in lysates and cells, except for the temperature, which was at
room temperature for calibration. Temperature was reported to only slightly change the fluores-
cence lifetime of a CFP variant (cerulean) (Laine et al., 2012). However, for accuracy purposes and
in order to exclude such artifacts when determining cytosolic calcium levels in B lymphocytes within
lymph nodes of YellowCaB mice, we adapted the phasor-based calibration strategy proposed by
Celli et al., 2010 for the use of Calcium Green in skin samples to our data. In this way, we were able
to reliably determine absolute values of cytosolic calcium concentrations in B cells within lymph
nodes.
In our set-up, we have shown that TN-XXL in B cells has suitable sensitivity and fast reversibility.
This key factor made it possible to observe repeated and partially sustained calcium elevation in the
cytoplasm, showing that B cells are able to collect sequential signals, possibly up to a certain thresh-
old, which determines their fate.
In support of that, B cellular calcium concentration must not constitutively exceed a certain value
in order to prevent mitochondrial depolarization (Akkaya et al., 2018; Bouchon et al., 2000;
Niiro and Clark, 2002). Gradual calcium elevation could be a mechanistic link for that. For example,
calcium levels of >1 mM over the duration of >1 hr have been reported to be damaging to other cell
types, such as neurons (Radbruch et al., 2015; Siffrin et al., 2015). Accordingly, stimulation of AG
receptors via large doses of soluble AG can lead to tolerogenic apoptosis in GC B cells, which could
be explained by uninhibited calcium influx (Nossal et al., 1993; Pulendran et al., 1995). Since apo-
ptosis is the default fate for B cells in the GC reaction (Mayer et al., 2017), CD40 and TLR signaling
might contribute to limiting cytoplasmic calcium concentrations, and thus promote survival of B cell
Ulbricht et al. eLife 2021;10:e56020. DOI: https://doi.org/10.7554/eLife.56020 15 of 26Research article Immunology and Inflammation
clones with appropriate BCR affinity (Akkaya et al., 2018; Eckl-Dorna and Batista, 2009;
Pone et al., 2015; Pone et al., 2012; Pone et al., 2010; Ruprecht and Lanzavecchia, 2006). For
CD40 signaling in immature B cells, this has been confirmed (Nguyen et al., 2011). Our data does
show that TLR signaling can attenuate calcium flux in stimulated B cells, while CD40 can either atten-
uate or augment the calcium response (Figure 2). Whether the different outcomes of CD40 stimula-
tion are dependent on the affinity of the BCR and its efficiency in presenting AG (Schwickert et al.,
2011; Shulman et al., 2013) will be subject of further studies.
Measuring absolute calcium concentration in GC B cells after administration of soluble AG in
vivo, we could detect an increase of B cell calcium that is attenuated by BCR inhibitor ibrutinib,
showing that BCR-mediated calcium increase is substantially contributing to calcium heterogeneity
in the GC. However, the interpretation of the data should not neglect other causes of calcium eleva-
tion, given the multifaceted role of this second messenger. Therefore, it is likely that apart from BCR
signaling, also other events, like binding of non-AG ligands and stress-related calcium release from
internal stores, contribute to an overall cytosolic calcium increase, which needs to be regulated in
order to prevent a damaging calcium overload. Causes for stress-related cytosolic calcium elevations
in cells can be hypoxia, a condition reported to be present within GCs (Jellusova et al., 2017); nutri-
ent deprivation, which mostly will affect highly proliferative cells like GC B cells; or ER-calcium
release as a result of the unfolded protein response that is indispensable in plasma cells (Dı́az-
Bulnes et al., 2020; Høyer-Hansen and Jäättelä, 2007; Lam and Bhattacharya, 2018). The com-
plex interaction of factors makes an exact characterization of the absolute calcium concentration in
various B cell subsets crucial in order to obtain information about their regulation and containment.
This characterization should preferably be done intravitally since any manipulation of cells can result
in enormous non-physiological variations of cytosolic calcium levels.
For the first time, we determined absolute values of B cell cytoplasmic calcium concentrations
during the GC reaction within living mice. It appears that BCR AG specificity and state of differentia-
tion are closely related to distinct degrees of heterogeneity of calcium concentrations. Notably, het-
erogeneity was also evident in extrafollicular B cells in the SCS region, as well as in plasma blasts.
The latter actually reach the highest calcium concentrations within the B cell compartment of the
lymph node. We also observed an increase of cytoplasmic calcium in plasma blasts after stimulation
with specific AG in vitro. These data are in line with a report of residual BCR signaling occurring in
antibody-secreting cells (Pinto et al., 2013), which challenges the finding that B cells completely
downregulate their surface BCR during differentiation to plasma cells (Manz et al., 1998). Our
experiments were done in short-lived plasma blasts, not LLPC, for which the situation could be dif-
ferent. Therefore, an investigation of possible BCR signaling in LLPC is of high interest. Stimulation
with the chemokine CXCL12, which has previously been shown to induce migration of antibody-
secreting cells (Fooksman et al., 2010; Hauser et al., 2002), resulted only in a minor increase of
cytoplasmic calcium in plasma blasts in our hands.
In B cells that have exited the GC, ongoing calcium flux might reflect reactivation. We confirmed
that B cells in contact to SCSM had significantly higher cytosolic calcium concentrations. These are
possibly attributed to BCR signaling since the SCS has been proposed as a site of reactivation of
memory B cells via AG (Moran et al., 2018).
The YellowCaB system provides a tool for measuring calcium as ubiquitous, universal cellular mes-
senger, integrating signals from various pathways, including chemokine receptor signaling and intrin-
sic calcium release or BCR-triggered activation. Importantly, changes in mitochondrial membrane
potential and/or the integrity of the ER also lead to varying calcium concentrations within the cyto-
plasm since both act as major intracellular calcium buffering organelles (Kass and Orrenius, 1999) A
close connection between mitochondrial calcium homeostasis, altered
reactive oxygen speciesproduction, and the expression of plasma cell master transcription factor
BLIMP1, as well as changes in metabolism, has been reported previously (Jang et al., 2015;
Shanmugapriya et al., 2019). We have recently applied phasor-FLIM of endogenous NAD(P)H fluo-
rescence for mapping of metabolic enzyme activities in cell cultures (Leben et al., 2019). The combi-
nation of this technique with FLIM-based intravital calcium analysis will help to further dissect
immunometabolic processes in B cells, as well as in short-lived plasma cells and LLPCs in vivo.
Ulbricht et al. eLife 2021;10:e56020. DOI: https://doi.org/10.7554/eLife.56020 16 of 26You can also read