What can we learn from amino acids about oceanic organic matter cycling and degradation?
←
→
Page content transcription
If your browser does not render page correctly, please read the page content below
Research article
Biogeosciences, 19, 807–830, 2022
https://doi.org/10.5194/bg-19-807-2022
© Author(s) 2022. This work is distributed under
the Creative Commons Attribution 4.0 License.

What can we learn from amino acids about oceanic
organic matter cycling and degradation?
Birgit Gaye1 , Niko Lahajnar1 , Natalie Harms1 , Sophie Anna Luise Paul2,3 , Tim Rixen1,4 , and Kay-Christian Emeis1
1 Institute
          for Geology, Universität Hamburg, 20146 Hamburg, Germany
2 Department  of Physics and Earth Sciences, Jacobs University Bremen, 28759 Bremen, Germany
3 GEOMAR, Helmholtz-Zentrum für Ozeanforschung, 24148 Kiel, Germany
4 Leibniz Centre for Tropical Marine Research (ZMT), 28359 Bremen, Germany

Correspondence: Birgit Gaye (birgit.gaye@uni-hamburg.de)

Received: 26 August 2021 – Discussion started: 31 August 2021
Revised: 5 January 2022 – Accepted: 8 January 2022 – Published: 10 February 2022

Abstract. Amino acids (AAs) mainly bound in proteins are            SPM is more similar to DOM than to any of the other organic
major constituents of living biomass and non-living organic         matter pools. This implies that there is equilibration between
material in the oceanic particulate and dissolved organic mat-      finely dispersed SPM and DOM in the deep sea, which may
ter pool. Uptake and cycling by heterotrophic organisms lead        be driven by microbial activity combined with annealing and
to characteristic changes in AA composition so that AA-             fragmentation of gels. As these processes strongly depend
based biogeochemical indicators are often used to elucidate         on physico-chemical conditions in the deep ocean, changes
processes of organic matter cycling and degradation. We an-         in quality and degradability of DOM may strongly affect the
alyzed particulate AA in a large sample set collected in var-       relatively large pool of suspended and dissolved AA in the
ious oceanic regions covering sinking and suspended parti-          ocean that amounts to 15 Pg amino acid carbon (AAC) and
cles in the water column, sediment samples, and dissolved           89 ± 29 Pg AAC, respectively.
AA from water column and pore water samples. The aim of
this study was to test and improve the use of AA-derived bio-
geochemical indicators as proxies for organic matter sources
and degradation and to better understand particle dynamics          1   Introduction
and interaction between the dissolved and particulate organic
matter pools. A principal component analysis (PCA) of all           Amino acids (AAs) are ubiquitous in living organisms and
data delineates diverging AA compositions of sinking and            comprise a major share of characterized organic matter in the
suspended particles with increasing water depth. A new sink-        particulate and dissolved pool in the ocean (Lee, 1988; Wake-
ing particle and sediment degradation indicator (SDI) allows        ham et al., 1984; Zhang et al., 2016; Davis et al., 2009; Lee
a fine-tuned classification of sinking particles and sediments      et al., 2004). AAs contribute more than 80 % of total organic
with respect to the intensity of degradation, which is associ-      carbon in fresh autochthonous plankton while allochthonous
ated with changes of stable isotopic ratios of nitrogen (δ 15 N).   organic matter from continental runoff and atmospheric de-
This new indicator is furthermore sensitive to sedimentary re-      position has lower AA contents (Degens and Ittekkot, 1983,
dox conditions and can be used to detect past anoxic early di-      1985). Most of the primary productivity occurs in the sun-
agenesis. A second indicator emerges from the AA spectra of         lit surface layer of the ocean, and most of the allochthonous
suspended particulate matter (SPM) in the epipelagic and that       material is also transported into surface waters. Thus, or-
of the meso- and bathypelagic ocean and is a residence time         ganic matter concentrations including their major biogenic
indicator (RTI). The characteristic changes in AA patterns          constituents generally have a surface maximum and decrease
from shallow to deep SPM are recapitulated in the AA spec-          with depth (Peters et al., 2018; Gaye et al., 2013b; Wake-
tra of the dissolved organic matter (DOM) pool, so that deep        ham and Lee, 1993). The main mechanism behind this depth-
                                                                    dependent distribution is that most of the organic matter is

Published by Copernicus Publications on behalf of the European Geosciences Union.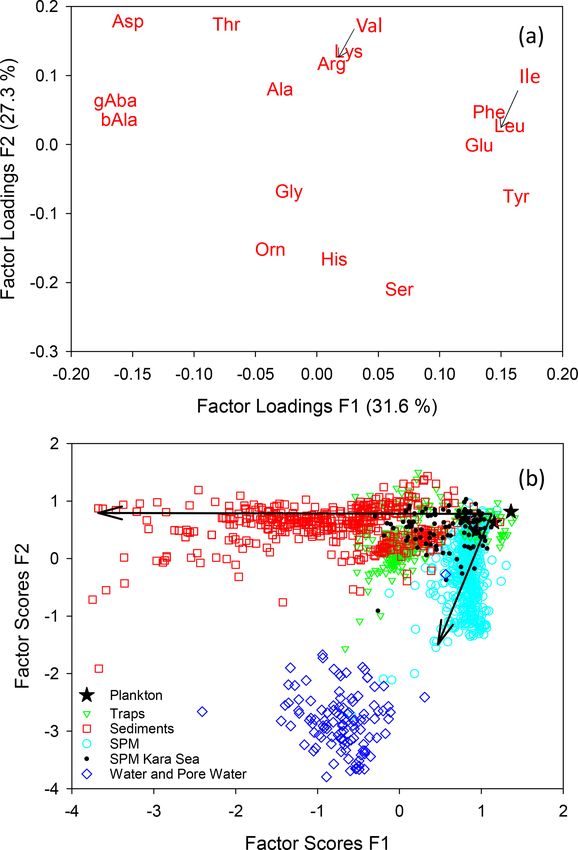
808                                                           B. Gaye et al.: Oceanic organic matter cycling and degradation

recycled in surface waters while only a small proportion of         Emeis, 1992), they are often considered “labile” constituents
surface particles leave the surface waters by gravitational set-    of bulk organic matter. This is supposedly due to their prefer-
tling in the form of macroaggregates or fecal pellets. Parti-       ential uptake as a nitrogen (N) source for further synthesis of
cles containing organic matter, shells, frustules of organisms,     AA or as a source of essential AA for heterotrophs (Ittekkot
and mineral matter sink at speeds of 200 m d−1 on average           and Arain, 1986; Ittekkot et al., 1986). This has been ques-
and constitute the export from the surface mixed layer or eu-       tioned, as a large proportion of the oceanic organic N pool is
photic zone into the deep ocean, where part of it can ulti-         comprised of AAs that are not bioavailable (Aluwihare et al.,
mately reach the sediments (Alldredge and Silver, 1988; All-        2005). In addition to the quantification of AA decay, degra-
dredge, 1998; Pilskaln and Honjo, 1987; Fowler and Knauer,          dation state of organic matter (proteins) can be assessed by
1986; Karl et al., 1988; Rixen et al., 2019b). Sinking parti-       characteristic changes in AA monomer composition, which,
cles are caught by moored or floating sediment traps while          furthermore, has the potential to elucidate sources of organic
suspended matter (SPM) is sampled by filtration or ultrafil-        matter and degradation processes (Ittekkot et al., 1984a, b;
tration of water from water samplers or by pump systems             Dauwe and Middelburg, 1998; Dauwe et al., 1999; Jenner-
(Yamaguchi and McCarthy, 2018). SPM is too small to sink            jahn and Ittekkot, 1997).
and therefore – like dissolved organic matter (DOM) – pre-             Ratios of individual amino acids such as the reactivity in-
dominantly enters deep water by subduction of surface wa-           dex (RI) (Jennerjahn and Ittekkot, 1997) or the degradation
ters (Resplandy et al., 2019; Boyd et al., 2019) and is trans-      index (DI) normalizing AA data to the results of a princi-
ported passively following the route of ocean water along the       pal component analysis (PCA) (Dauwe et al., 1999; Dauwe
ocean conveyer belt (Silver et al., 1998; McCave, 1984). It         and Middelburg, 1998) have often been used to scale or-
has thus been surmised that the long residence time of SPM          ganic matter degradation (Niggemann et al., 2018; Unger
in the water column should result in a more degraded state          et al., 2005; Ingalls et al., 2004, 2006; Pantoja et al., 2004;
compared with organic matter of sinking particles (McCave,          Möbius et al., 2010). These biogeochemical indicators of or-
1984; Degens and Ittekkot, 1984). Studies of pigments, AAs,         ganic matter quality were essentially developed for marine
and fatty acids, however, do not find such a systematic differ-     sinking particles and sediments. Although based on marine
ence between the two types of particles and even indicate that      sediments only (Dauwe et al., 1999), the DI was applied
SPM can be less degraded than sinking particles (Abram-             for example to SPM samples from the brackish environment
son et al., 2011; Rontani et al., 2011; Wakeham and Canuel,         (Unger et al., 2005) or even to trace dissolved AA degrada-
1988). In two studies of AA composition in the Benguela             tion (Davis and Benner, 2005; Guo et al., 2018). Other work
upwelling system and in the Arabian Sea, it was shown that          used individual and adapted indices to differentiate the states
the degradation pathways of SPM and sinking particles dif-          of degradation in SPM or DOM samples and samples from
fer as their AA compositions diverge with depth (Gaye et al.,       lakes, groundwater, and rivers (Abramson et al., 2011; Gaye
2013b; Nagel et al., 2009). These studies suggested that there      et al., 2007; Goutx et al., 2007; Kaiser and Benner, 2009;
is only little interaction between suspended and sinking par-       Menzel et al., 2013; Peter et al. 2012; Sheridan et al., 2002).
ticle pools below the euphotic zone. Due to its long residence         Understanding and quantifying AA degradation is re-
time in the ocean, SPM appears to interact with DOM (Gaye           quired to estimate the diagenetic imprint on δ 15 N ratios of
et al., 2013b) and therefore carries different AA signatures        particulate matter. This is important as δ 15 N ratios track ma-
related to genesis and history of organic matter cycling in its     jor shifts between N pools and are commonly used to re-
specific water mass (Nagel et al., 2016). Whereas informa-          construct the N cycle from sedimentary archives (Galbraith
tion on the composition of sediment trap samples has been           et al., 2013). Amino acid nitrogen (AAN) comprises 80 %–
compiled in comprehensive studies (Honjo et al., 2008; Wil-         100 % of N in fresh organic matter and is the precursor of
son et al., 2012; Rixen et al., 2019a, b), similar compilations     most of the N buried in sediments and ultimately stored in
of the profuse literature on suspended matter are still miss-       the form of ammonium, adsorbed to clay minerals (Boyd,
ing.                                                                2001; Waples and Sloan, 1980; Müller, 1977). Considerable
   On the way to the deep sea the flux of sinking particles         AA degradation already occurs in the water column and pro-
is reduced by disaggregation and organic matter degrada-            gresses during organic matter burial in the sediments so that
tion. Suess (1980) empirically derived the first power func-        the impact of diagenetic processes on δ 15 N has to be ac-
tion for organic carbon decay based on sediment trap data.          counted for (Möbius et al., 2010, 2011; Niggemann et al.,
Subsequently, a large number of similar functions were cal-         2018; Carr et al., 2016). Ammonification leads to a diage-
culated for various oceanic areas based on trap experiments         netic increase in δ 15 N values by up to 6.5 ‰ in deep sea sed-
(Rixen et al., 2002, 2019b; Armstrong et al., 2002; Martin          iments while there is little effect during organic matter burial
et al., 1987). Early work on AAs had produced similar de-           in shelf and slope sediments due to the higher sedimentation
cay functions combining data from Atlantic and Pacific trap         rates and sub- to anoxic diagenetic conditions (Tesdal et al.,
experiments (Lee and Cronin, 1982, 1984). As AAs decay              2013; Robinson et al., 2012; Möbius, 2013; Gaye-Haake et
faster than bulk organic carbon (Haake et al., 1993b, 1992,         al., 2005). Such δ 15 N increases were shown to correlate with
1996; Lee et al., 2004; Wakeham and Lee, 1989; Whelan and           AA-derived degradation indicators so that the primary δ 15 N

Biogeosciences, 19, 807–830, 2022                                                       https://doi.org/10.5194/bg-19-807-2022
B. Gaye et al.: Oceanic organic matter cycling and degradation                                                             809

signal from the water column can be reconstructed (Gaye-         2017 and include 218 sediment trap samples, 489 sediment
Haake et al., 2005; Gaye et al., 2009; Möbius et al., 2011).     samples, 608 SPM samples, and 110 water and pore water
   DOM comprising the largest oceanic organic matter pool        samples (Fig. 1a–d). Five additional plankton samples were
is defined by the pore size of the filters it passes through,    taken in the Arabian Sea and from the Namibian upwelling
which is 0.2–0.7 µm (Carlson and Hansell, 2015), and thus        area by plankton tows between 0–100 m and between 100–
includes some picoplankton cells and all viruses (Aristegui      700 m water depths. In the Kara Sea – a shallow shelf sea
et al., 2009). DOM in surface water is partly labile and can     strongly impacted by water and suspended matter discharge
originate from the exudates and lysis of organisms, passive      from the rives Ob and Yenisey – sediment traps, surface sed-
diffusion, or “overflow” out of phytoplankton and bacteria.      iments, and suspended matter were sampled (Gaye et al.,
Grazers can excrete or egest DOM; it can furthermore be          2007; Gaye-Haake et al., 2003; Nagel et al., 2009; Unger et
leached from their fecal pellets or released by sloppy zoo-      al., 2005). In the deep Mediterranean Sea sediment traps and
plankton feeding and is thus primarily released and also         surface sediments were sampled (Möbius et al., 2010). SPM
taken up in the surface ocean (Carlson and Hansell, 2015).       from the Mediterranean Sea was only analyzed for δ 15 N val-
Moreover, terrestrially derived DOM is transported into sur-     ues (Emeis et al., 2010). Sediment trap as well as surface
face waters by rivers and via the atmosphere (Benner et al.,     sediment, SPM, and water samples were taken along cross-
2005). Deep DOM has a different source than simply trans-        shelf transects off Namibia (Nagel et al., 2013, 2016). Sedi-
port of surface DOM by intermediate and deep water forma-        ment trap samples and short sediment cores were taken at two
tion and mixing, as deep DOM is refractory in nature and         stations in the northeastern Atlantic (Lahajnar et al., 2005;
has been heterotrophically altered by cycling and degrada-       Turnewitsch et al., 2015, 2017). In the Arabian Sea sediment
tion processes (Yamaguchi and McCarthy, 2018) discernible        trap, SPM and surface sediment samples were taken in the
from their composition of dissolved AA (Kaiser and Benner,       deep ocean and on the continental slope, including a core
2009; McCarthy et al., 2004). The possible source of deep        within the oxygen minimum zone at water depths of 775 m
DOM may be the release from sinking or suspended parti-          (Gaye et al., 2013a, b; Rixen et al., 2014; Gaye-Haake et al.,
cles associated with microbial degradation on particles and      2005; Suthhof et al., 2000, 2001). In the Indian Ocean Sub-
in the ambiance of particles by processes such as solubiliz-     tropical Gyre sediment trap, SPM and water samples were
ing organic matter by ectohydrolase (Cho and Azam, 1988;         taken (Harms et al., 2019, 2021), and samples from the equa-
Ciais et al., 2014; Aristegui et al., 2009). DOM can also        torial North Pacific and eastern South Pacific are comprised
be released from sediment pore water into overlying waters       of bottom water, pore water, and sediment core samples (Paul
(Lahajnar et al., 2005). Ratios of δ 15 N in ultrafiltered DOM   et al., 2018).
(UDOM) showed no systematic change with depth and sug-              Sea water was filtered through glass fiber filters (Whatman
gested a common microbial source or viral lysis (McCarthy        GF/F) with a nominal pore size of 0.7 µm, and filters were
et al., 2007).                                                   dried at 40 ◦ C in order to obtain SPM samples. At some sta-
   In the following synoptic compilation of AA data, we will     tions water samples were taken by deep freezing an aliquot of
examine the differences in AA spectra of a large data set that   the filtrate for TDAA analyses. In addition, 18 water samples
combines dissolved and particulate AAs from plankton, sus-       taken off Namibia were separated into two size classes by ul-
pended and sinking material, and sediments from different        trafiltration (Brockmeyer and Spitzy, 2013). The size classes
oceanic regions, as well as from riverine to brackish-marine     50 kDa–0.7 µm and 1 kDa–0.7 µm were used for TDAA anal-
conditions. Focusing on processes in the water column, the       yses. Sediment trap samples were wet sieved on board and
data serve to (i) test existing AA-based biogeochemical indi-    comprise the < 1 mm fraction, filtered with polycarbonate
cators of organic matter sources and degradation, (ii) better    Nuclepore filters of 0.45 µm pore size and dried at 40 ◦ C.
understand transformation and degradation processes of or-       Sediment samples from multicores, box grabs, box cores, or
ganic matter in aquatic environments reflected by AA com-        gravity cores were taken by spatula or syringes from cold-
position in sinking and suspended particles and total dis-       stored cores and were freeze-dried before analyses. Surface
solved AAs (TDAAs), (iii) investigate the impact of such         samples represent either the upper 0.5 cm or 1 cm of a sedi-
processes on the δ 15 N values, and (iv) identify open ques-     ment core. Pore water samples were taken by rhizons with a
tions which may be pursued with the help of AA analyses in       mean pore size of 0.15 µm and stored frozen before analyses
the future.                                                      (see methods in Paul et al., 2018).

                                                                 2.2   Analytical methods
2     Materials and methods
                                                                 Total carbon and N were measured with a Carlo Erba nitro-
2.1    Sampling                                                  gen analyzer 1500 (Milan, Italy) or a EURO EA3000 ele-
                                                                 mental analyzer. Particulate organic carbon (POC) was mea-
A total of 1425 samples were taken for AA analyses in dif-       sured after treatment of weighed samples with 1N HCl to
ferent oceanic areas and water depths between 1993 and           remove carbonate. The precision of this method is 0.05 %

https://doi.org/10.5194/bg-19-807-2022                                                    Biogeosciences, 19, 807–830, 2022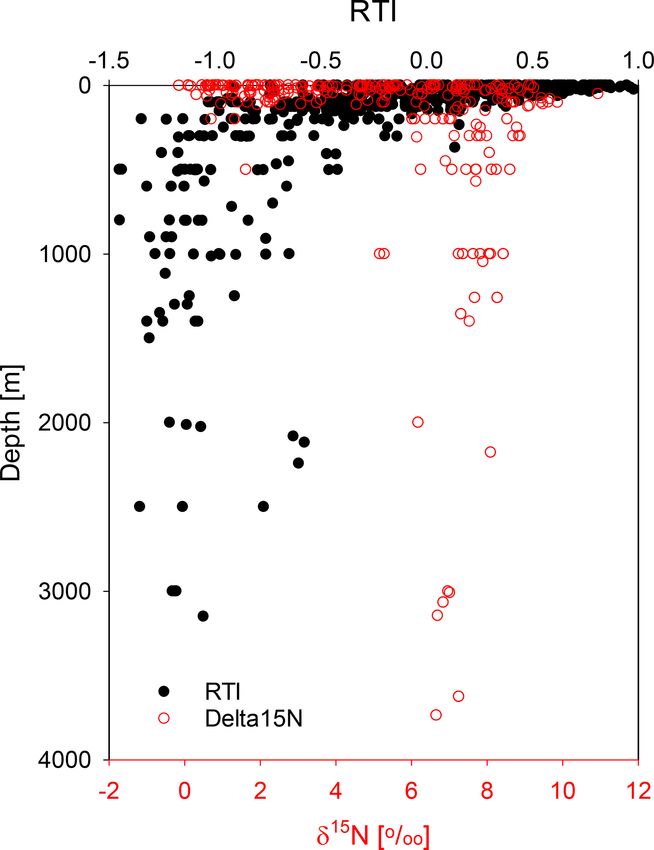
810                                                                       B. Gaye et al.: Oceanic organic matter cycling and degradation

Figure 1. Stations of sediment trap deployments (a), sediment (b), SPM (c), and water and pore water sampling (d).

for carbon and 0.005 % for N. Carbonate carbon was calcu-                          Dissolved organic carbon (DOC) concentrations [mg L−1 ]
lated by subtracting organic carbon from total carbon. Ra-                      were determined of water and pore water samples via a high-
tios of 15 N / 14 N of particulate N were determined using a                    temperature combustion method (POC-VCSH analyzer, Shi-
Thermo Finnigan MAT 252 isotope ratio mass spectrometer                         madzu). Inorganic carbon was removed by 2 M HCl prior
connected with a ConFlo III interface after high-temperature                    to injection into the combustion tube where organic carbon
flash combustion in a Thermo Finnigan Flash EA 1112 at                          is oxidized to CO2 at 680 ◦ C with a platinum catalyst. A
1050 ◦ C. Part of the samples were measured with an Elemen-                     five-point calibration from 0.5 to 5 mg DOC L−1 was used.
tar IsoPrime 100 isotope ratio mass spectrometer after high-                    The error of measurement is less than 2 % (Brockmeyer and
temperature combustion in an Elementar CHNOS Vario iso-                         Spitzy, 2013).
tope elemental analyzer at 950 ◦ C. Pure tank N2 calibrated                        TDAA, particulate AA, and hexosamines (HA) were an-
against the reference standards IAEA-N1 (ammonium sul-                          alyzed with a Biochrom 30 amino acid analyzer. Acid hy-
fate, δ 15 N = +0.4 ‰ versus air N2 ) and IAEAN2 (ammo-                         drolysis with 6 N HCl for 22 h at 110 ◦ C under a pure argon
nium sulfate, δ 15 N = +20.3 ‰) of the International Atomic                     atmosphere was carried out on ca. 3 mL of filtrate of wa-
Energy Agency was used as a working standard. Duplicate                         ter and pore water samples, on 1–2 mg of suspended matter
measurements of samples differ by less than 0.15 ‰. The                         collected on Whatman GF/F filters, on 1–2 mg of sediment
laboratory’s long-term standard deviation for the IAEA-N1                       trap samples, or on 1–50 mg of freeze-dried surface sedi-
standard is 0.09 ‰. N-isotope ratios are reported in per mille                  ments. A particle-free aliquot was evaporated three times to
using the delta notation and the 15 N / 14 N of air N2 as the                   dryness in order to remove the unreacted HCl; the residue
reference standard:                                                             was taken up in an acidic buffer (pH 2.2). After injection and
                    .                                                        subsequent separation with a cation exchange resin, the indi-
δ 15 Nsample = 15 N 14 N                                                        vidual AA monomers were post-column derivatized with o-
                                          sample                                phthaldialdehyde in the presence of 2-mercaptoethanol and
           .            .                                                    detected with a Merck Hitachi L-2480 fluorescence detec-
                15           14
                     N            N                        − 1 × 1000.   (1)    tor. Duplicate analysis of a standard solution according to
                                      reference standard
                                                                                this method results in a relative error of 0.1 %–1.3 % for

Biogeosciences, 19, 807–830, 2022                                                                  https://doi.org/10.5194/bg-19-807-2022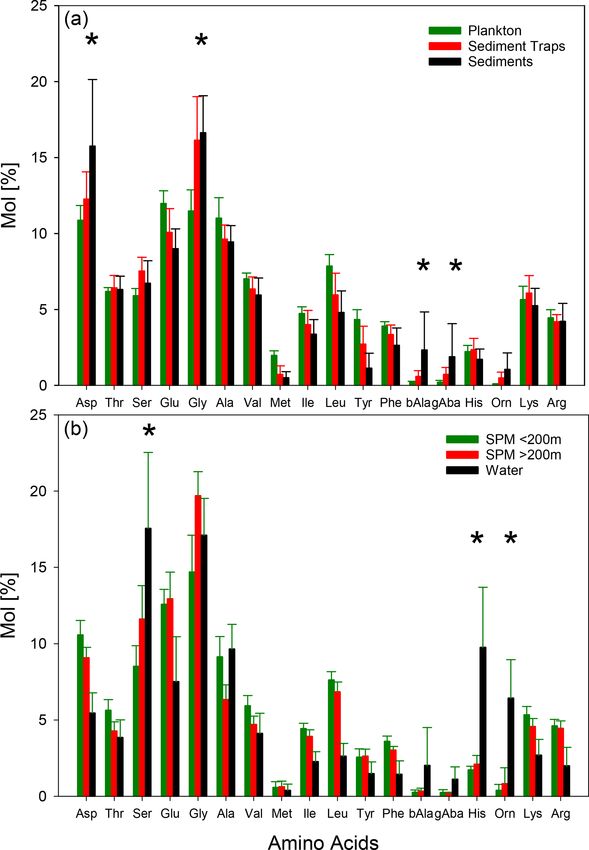
B. Gaye et al.: Oceanic organic matter cycling and degradation                                                                  811

the concentrations of individual AA monomers and 0.2 %–            ter in marine and brackish environments (Unger et al., 2005;
3.0% for individual AA monomers of water or particulate            Gaye et al., 2007) but also as a proxy for degradation state in
matter samples. Due to acid hydrolysis, aspartic acid (ASP)        the sediment column (Möbius et al., 2011). The enrichment
and asparagine (Asn) are both measured as Asp, and glu-            of Asp and Glu in sediments is related to their enrichment
tamic acid (Glu) and glutamine (Gln) are both measured as          in carbonate shells (Ittekkot et al., 1984a) and to adsorption
Glu. The other AAs measured are threonine (Thr), serine            of primarily acidic AAs onto carbonate minerals (King and
(Ser), glycine (Gly), alanine (Ala), valine (Val), methionine      Hare, 1972), whereas basic AAs primarily adsorb onto sil-
(Met), isoleucine (Ile), leucine (Leu), tyrosine (Tyr), pheny-     icate minerals (Hedges and Hare, 1987; Keil et al., 1994;
lalanine (Phe), β-Alanine (β-Ala), γ -aminobutyric acid (γ -       King, 1975).
Aba), histidine (His), ornithine (Orn), lysine (Lys), and argi-       The DI, the integral of 14 protein AAs, assesses the dia-
nine (Arg). The HAs measured together with AAs are glu-            genetic alteration of a sample by comparing it to a set of 28
cosamine (Gluam) and galactosamine (Galam), and their to-          sediment samples of different degradation states and environ-
tal contents were corrected with a factor of 1.4 for loss during   ments. Molar percentages of individual AAs are standardized
hydrolysis (Müller et al., 1986).                                  by the mean and standard deviations of the 28-sample data
                                                                   set. The DI then integrates the result of these standardized
2.3   Amino-acid-derived biogeochemical indicators of              values weighed by the factor coefficients for the first axis of
      organic matter origin and degradation                        the PCA of Dauwe et al. (1999) according to the formula
                                                                          X  vari − AVG.vari
Amino acid concentrations and the contribution of AA car-          DI =                             × fac.coefi ,              (2)
bon (AAC) and AA nitrogen (AAN) as percentages of total                     i       SD.vari
organic carbon (AAC / C) or total N (AAN / N) are used to
                                                                   where vari is the original mole percentage of each AAi ;
determine the degradation state of organic matter in the ma-
                                                                   AVG.vari and SD.vari are the mean and standard deviations,
rine realm as both decrease with increasing organic matter
                                                                   respectively; and fac.coefi is the factor coefficient of the first
degradation (Wakeham and Lee, 1993; Cowie and Hedges,
                                                                   axis of the PCA of Dauwe et al. (1999). The DI thus rep-
1994). AAN / N > 50 % are characteristic of fresh organic
                                                                   resents the cumulative deviation of AA with respect to an
matter in the freshwater and marine realm (Menzel et al.,
                                                                   assumed average molar composition. The DI ranges approx-
2015; Haake et al., 1992, 1993b). AAs contribute > 60 % to
                                                                   imately from −2 to +3, where negative values indicate more
total organic carbon (AAC / C) in fresh plankton and sus-
                                                                   and positive values less degradation than the average.
pended matter in surface waters, whereas AAC / C drop to
                                                                      A specifically designed index for dissolved substances
values < 20 % in sinking particles and suspended matter
                                                                   (DOM-DI) calculated in the same way as the DI was based
from subsurface water (Wakeham and Lee, 1993). AAC / C
                                                                   on a PCA of a set of marine DOM samples and resulted in
values are often below 10 % in freshwater environments and
                                                                   DOM-DI values from 5 in surface waters to −3 in deep wa-
indicate the enhanced input of land plants enriched in car-
                                                                   ters (Kaiser and Benner, 2009). The values to calculate the
bohydrates and lignin rather than enhanced organic matter
                                                                   marine DOM-DI (averages, standard deviations, and factor
degradation (Menzel et al., 2015).
                                                                   coefficients of F1) can be found in Peters et al. (2012).
   Asn, Gln, and Glu are the primary products of N assimi-
                                                                      An indicator of oxic vs. anoxic organic matter degradation
lation, and all other AAs are synthesized from them (Loick-
                                                                   in the water column and in sediments was proposed by Men-
Wilde et al., 2018; Riccardi et al., 1989; Hildebrandt et al.,
                                                                   zel et al. (2015) for lake samples. Based on work by Cowie et
2015). Asp and Glu are enriched in bacteria, vascular plant
                                                                   al. (1995) on marine sediments, the ox / anox indicator is the
tissue, phytoplankton, zooplankton, and fungi, and their high
                                                                   quotient of AAs preserved under oxic diagenetic conditions
relative contents of Asp and Glu therefore indicate fresh
                                                                   to those preserved in anoxic water or sediments and is thus
organic matter (Cowie and Hedges, 1992). The ratios of
                                                                   higher in oxic than in anoxic sediments:
Asp / β-Ala and Glu / γ -Aba are high in fresh organic mat-
ter and drop with organic matter degradation as β-Ala and                      Asp + Glu + β−Ala + γ −Aba + Lys
γ -Aba are degradation products of Asp and Glu, respectively       ox/anox =                                      .              (3)
                                                                                Ser + Met + Ile + Leu + Tyr + Phe
(Lee and Cronin, 1984). β-Ala and γ -Aba also become rel-
atively enriched during organic matter degradation as these        ox / anox ratios < 1.0 indicate anoxic and ratios > 1.5 oxic
non-protein AAs are not taken up by heterotrophic organisms        diagenesis (Menzel et al., 2015).
(Ittekkot et al., 1984b).                                            The stability of AA vs. HA has been discussed since the
   The relative accumulation of the non-protein AAs is also        early research on AA and HA in natural material. Fresh
expressed by the RI, which is the ratio of the very labile         plankton was observed to have AA / HA ratios of 13–25 (De-
aromatic AAs Tyr and Phe and the non-protein AAs β-Ala             gens and Mopper, 1975), which is a mixed signal of phy-
and γ -Aba. The RI is, generally, between 0 (very degraded)        toplankton with an AA / HA ratio of > 80 and zooplankton
and 15 (very fresh) (Jennerjahn and Ittekkot, 1997). It is ap-     with a ratio of ∼ 9 due to chitinaceous skeletons of many
plicable not only in studies of sinking and suspended mat-         zooplankters (Mayzaud and Martin, 1975). Low AA / HA

https://doi.org/10.5194/bg-19-807-2022                                                        Biogeosciences, 19, 807–830, 2022
812 B. Gaye et al.: Oceanic organic matter cycling and degradation
ratios are also observed in cell walls of fungi and bacte- with a plot of the factor scores of samples helps to visual-
ria. As the building blocks of chitin, HAs were assumed to ize the relation of the samples to the variables and thus to
be more resistant to degradation than bulk AAs (Müller et identify the processes behind the results of the PCA.
al., 1986). This is, however, challenged by studies of en-
zyme activities, which were observed to respond to substrate
availability so that the activity of chitobiase and chitinase
is as high as that of glucosidase (Boetius et al., 2000a, b; 3 Results
Boetius and Lochte, 1994; Smith et al., 1992), suggesting
intense degradation also of chitin. Gluam is the main con- 3.1 Organic carbon, nitrogen, and amino acid content
stituent of chitin while Galam is relatively enriched in bac-
terial cell walls (Walla et al., 1984; Kandler, 1979). The The POC (N) content is 35.9 % (5.9 %) in plankton and
Gluam / Galam ratio has, therefore, been used to distinguish 1.65 %–46.4 % (0.21 %–10.14 %) in sediment trap samples.
bacterial material from zooplankton-rich material (Haake et In sediments, POC (N) contents drop to 0.10 %–13.5 %
al., 1993b; Benner and Kaiser, 2003; Niggemann and Schu- (0.02 %–1.72 %). SPM has POC (N) contents of 0.94 %–
bert, 2006). Gluam / Galam ratios > 4 were found in sinking 45.4 % (0.09 %–12.08 %). DOC concentration in water sam-
particles (Haake et al., 1993b; Haake et al., 1992; Lahajnar ples is between 0.5–1.1 mg L−1 , and DOC in pore water sam-
et al., 2007), ratios of < 3 usually indicate relatively high ples is between 3.9–29 mg L−1 .
contribution of microbial OM, and values between 1 and 2 AA concentrations are grouped into SPM and trap sam-
are characteristic of sediments and indicate an enrichment of ples taken at water depths < 200 m (shallow) and > 200 m
microbial biomass (Benner and Kaiser, 2003). (deep) (Fig. 2, Table 1). AA concentrations are highest in
SPM samples and shallow sediment traps (< 200 m wa-
2.4 Statistical analyses ter depth) with values between 40–4307 µmol g−1 (Fig. 2)
and averages of 662–908 µmol g−1 (Table 1). AA concen-
To investigate the differences of AA composition and to rec- trations are lower in traps from water depth > 200 m with
ognize the interaction and pathways of degradation between an average of 164 µmol g−1 . Sediments have the lowest
the different pools, we carried out a PCA of AA monomer AA concentrations of all particulate matter samples with
contributions in Mol %. Met was excluded as it is below de- an average of 50 µmol g−1 (Table 1). TDAA concentra-
tection limit in many samples. The PCA was carried out us- tions are between 0.6–44 µmol L−1 , and AA concentrations
ing the program SPSS Statistics 22. PCAs have often been are lower in water than in pore water samples with av-
used to analyze large databases (Xue et al., 2011) in order erages of 3.2 and 8.8 µmol L−1 , respectively. TDAA con-
to trace organic matter degradation, group and categorize centrations of water samples decrease from the epipelagic
samples, and develop indices such as the DI of Dauwe et (2.5 ± 2.9 µmol L−1 ) to the meso- and bathypelagic ocean
al. (1999) using summary statistics (see Eq. 2). A PCA is an (1.2 ± 0.5 µmol L−1 ) whereas bottom waters have enhanced
orthogonal transformation of a set of variables into a new set TDAA concentrations even higher than those in surface wa-
of uncorrelated variables called principal components. New ters (6.0 ± 3.4 µmol L−1 ).
axes are chosen in order to explain as much as possible of The AAC / C is between 5.4 %–66 % in SPM and trap
the variance within the data set on a few main axes of the samples, and the AAN / N (not shown) is between 3.7 %–
highest correlation. The first component explains most of the 100 %. The overall pattern found for AAC / C (Fig. 2b) is
variance within the data set, consecutively followed by the similar to the pattern of AA concentrations (Fig. 2a), but
remaining components in the order of their decreasing capac- there is more overlap of AAC / C between the different
ity to explain the variance within the data set. The selection groups. Sediments have AAC / C between 2.7 %–50 % and
of the most relevant components can be done by selecting AAN / N between 3 %–78 % (not shown). The contribution
those with eigenvalues (the variances of the principal com- of AAC to DOC (AAC / C) in water samples is between 4 %–
ponents) > 1. Alternatively, the kink method can be applied 40 % and in pore water samples between 0.5 %–9 %.
selecting those components from a plot of eigenvalues (scree AA concentrations of sinking and suspended particles de-
plot), which describe a steep slope of declining variance fol- crease with water depth, and the most significant decrease
lowed by a “kink”, after which the principal components add occurs in the upper ocean (Fig. 3a). The decay constant of
only small amounts to the variance. The factor loadings of the AA of sinking particles is twice as high as the decay con-
variables (in this case the individual amino acids) are their stant of AA of SPM (Fig. 3a, b). Kara Sea samples were
projections on the new axis. The factor score of each data set excluded from these calculations as their AA concentrations
from a sampling location is obtained by multiplying the stan- are low due to the strong dilution by material from rivers
dardized data with the factor loadings (also called factor co- and resuspended sediments in this near-shore environment
efficients). A high (low) factor score shows that a sample has (see Sect. 4.2). It is also notable that AAC / C and AAN / N
high (low) concentrations of the variables with high factor (not shown) significantly decrease between shallow and deep
loadings. A plot of factor loadings of the variables compared traps and from deep traps to sediments while AAC / C of
Biogeosciences, 19, 807–830, 2022 https://doi.org/10.5194/bg-19-807-2022B. Gaye et al.: Oceanic organic matter cycling and degradation 813 Figure 2. Box-and-whisker plots of AA concentrations in nmol g−1 or nmol L−1 (a) and of AAC / C (b) in SPM from water depths < 200 (SPM 200 m (SPM >), in sediment traps at water depth < 200 (Trap 200 m (Trap >), in sediments (Sed), in water samples (Water), and in pore water samples (Pore W). Boxes comprise the upper and lower quartiles, and lines indicate the median. Whiskers delineate the 10th and 90th percentiles. Outliers are marked by dots. Some outliers above the 90th percentile are cut off in the figure for better perceptibility of trends. Figure 3. AA concentrations in nmol g−1 in sediment traps (a) and SPM (b). Red triangles mark samples from the Kara Sea, and black dots are samples from the other trap and SPM locations shown in Fig. 1. The decay functions are calculated from samples excluding Kara Sea samples. https://doi.org/10.5194/bg-19-807-2022 Biogeosciences, 19, 807–830, 2022
814                                                         B. Gaye et al.: Oceanic organic matter cycling and degradation

SPM show little decrease between shallow and deep samples
(Fig. 2b).

3.2   Amino acid composition

While the AA concentrations of sinking particles from traps
show a distinct decrease with water depths, the changes in
AA composition are lesser so that we averaged all AA spec-
tra irrespective of water depths and area of study to compare
them with plankton and sediment samples (Fig. 4a). Domi-
nant AAs in plankton samples are Glu, Gly, Ala, and Asp.
Sinking particles and sediments are also dominated by these
AAs but in the order of Gly, Asp, Glu, and Ala (Fig. 4a).
Mol % Asp, Gly, β-Ala, γ -Aba, and Orn increase from
plankton via sinking particles to sediments while Mol % of
Glu, Ala, Val, Met, Ile, Leu, Tyr, and Phe decrease (Fig. 4a).
These trends are further continued with depths in sediment
cores (not shown).
   AA composition of SPM shows a clear trend with water
depth with enrichments of Mol % Ser, Glu, Gly, Orn, and His
and decreases of almost all other AAs from shallow waters
(< 200 m) to deep waters (> 200m), and decreases are most
pronounced for Asp, Thr, and Lys (Fig. 4b). These trends
are partly resumed by TDAA in water samples with a further
enrichment of Mol % Ser, Orn, and His, while Mol % Glu
and Gly slightly decrease in water samples compared with
deep SPM (Fig. 4b). AA spectra of pore waters (not shown)
are very similar to water samples.
   Biogeochemical indicators reveal the subtle depth-
dependent trends in sediment traps, and therefore the bio-
geochemical indicators were averaged separately for shallow       Figure 4. Average concentrations of individual AA (Mol %) and
and deep sediment trap and SPM samples (Fig. 5, Table 1).         1σ standard deviation (vertical bars) in plankton (green), sediment
The AA / HA ratios in SPM and water samples – with aver-          trap (red), and sediment (black) samples (a) and in SPM from water
ages between 80.2 and 204.6 – are higher than in traps and        depths < 200 (green), > 200 m (red), and TDAA in water samples
sediments (Fig. 5a; Table 1). The AA / HA ratios decrease         (black) (b). Asterisks mark the AAs with increasing Mol % from
from shallow via deep traps to sediments with averages of         plankton via sediment trap samples to sediments (a) and from shal-
25.4, 14.9 and 9.1, respectively. The Gluam / Galam is high-      low SPM via deep SPM to TDAA of water samples.
est in SPM samples and traps and lower in sediments, water,
and pore water (Fig. 5a, b; Table 1). The RI (Fig. 5c; Ta-
ble 1) shows the same pattern as the ratios of Asp / β-Ala           In summary, common biogeochemical indicators of or-
and Glu / γ -Aba (Table 1), with no clear trend between shal-     ganic matter degradation (RI, Asp / β-Ala, Glu / γ -Aba) and
low and deep SPM samples and decreases from shallow to            bacterial OM accumulation (AA / HA, Gluam / Galam) drop
deep traps and further to the sediments. Water samples have       and thus imply increasing degradation between shallow and
similar values as sediment samples with an average RI of 1.8      deep sediment traps and between deep traps and sediments,
and 1.6, respectively, and pore waters have an even lower av-     while these indicators reveal little or no degradation with
erage RI of 0.9. Similar to the RI, the DI is within the same     depth in SPM as the patterns of relative enrichment vs. de-
range in shallow and deep SPM samples, and the mean val-          creases found in SPM and partly also in TDAA of water and
ues are very close (Fig. 5d; Table 1) while the DI decreases      pore water samples differ from the degradation pathway de-
from shallow sediment traps via deep traps to sediments. In       picted by common biogeochemical indicators (Figs. 4, 5; Ta-
contrast to the RI where water samples have the lowest val-       ble 1). The enhanced DI values furthermore imply that wa-
ues, the highest DI values are found in water and pore water      ter and SPM samples are less degraded than deep trap and
samples. The DOM-DI averages of 2.0 ± 0.6 and 2.1 ± 0.7 in        sediment samples and that TDAA in water and pore water
water and, respectively, pore water samples are in fact very      samples are least degraded.
close to the DI averages (Table 1).

Biogeosciences, 19, 807–830, 2022                                                      https://doi.org/10.5194/bg-19-807-2022
B. Gaye et al.: Oceanic organic matter cycling and degradation                                                                      815

Figure 5. Box-and-whisker plot of AA / HA ratios (a) and Gluam / Galam ratios (b), RI (c), and DI (d) in SPM from water depths < 200
(SPM  200 m (SPM >), in sediment traps at water depth < 200 (Trap  200 m (Trap >), in sediments (Sed), in water
samples (Water), and in pore water samples (Pore W). Outliers are marked by dots; some outliers above the 90th percentile are cut off for
better perceptibility of trends. Note logarithmic scales of AA / HA (a) and Gluam / Galam (b).

4     Discussion                                                       non-protein AA (RI and Glu / γ -Aba) decrease along this
                                                                       pathway. Asp / β-Ala ratios also decrease because β-Ala be-
4.1    Changes during organic matter degradation                       comes relatively more enriched than Asp. The DI, origi-
                                                                       nally derived from sediment samples of different degradation
Our summary of AAs data from various locations in the                  states (Dauwe et al., 1999; Dauwe and Middelburg, 1998),
world ocean corroborates earlier findings that degradation of          decreases from positive values in fresh plankton and most
organic matter by zooplankton and microbes imparts char-               sinking particles to negative values in sediments as it inte-
acteristic changes to AA spectra so that the differences in            grates the products of Asp and Gly multiplied with negative
AA composition are much larger between types of organic                factors and the products of Glu, Met, Ile, Leu, Tyr, and Phe
matter and from different water and sediment depths than               multiplied with positive factors (Dauwe et al., 1999).
between different oceanic areas (Lee, 1988). The AA spec-                 In contrast, the AAs in SPM evolve along a different path
tra track the successive degradation of organic matter during          than the sedimentation pathway (Gaye et al., 2013b). The
sedimentation from the plankton source via sinking particles,          increases in Mol % Ser, His, and Orn and the decreases in
their incorporation into sediments, and their further degra-           Mol % Asp from shallow (< 200 m) to deep SPM (> 200 m)
dation after burial. The most characteristic changes along             and even further in TCAA of sea water and pore water are
this sedimentation pathway are the relative enrichments (in            either not depicted or even contrary to the trends depicted by
Mol %) of Gly, Asp, and the non-protein AA β-Ala, γ -Aba,              the common biogeochemical indicators (Fig. 4b). The strik-
and Orn and the relative decrease in AA produced by fresh              ing difference in AA distribution of SPM (Fig. 4) on the one
plankton such as Glu, Ala, Val, Met, Ile, Leu, Tyr, and Phe            hand and sinking particles and sediments on the other hand as
(Fig. 4a). These changes are depicted by the common bio-               well as the different depth-dependent trends (Figs. 4, 5) sug-
geochemical indicators: the ratios of proteinaceous AA vs.             gests that there is little exchange between the two types of

https://doi.org/10.5194/bg-19-807-2022                                                            Biogeosciences, 19, 807–830, 2022
816 B. Gaye et al.: Oceanic organic matter cycling and degradation
Table 1. Mean values and standard deviation (SD) of POC [%]; DOC [mg L−1 ]; amino acid (AA) concentrations [µmol g−1 or µmol L−1 ];
AAC / C%; AAN / N%; ratios of Asp / β-Ala, Glu / γ -Aba, AA / HA, and Gluam / Galam; RI; DI; SDI∗ ; RTI∗ ; and ox / anox ratio summa-
rized in traps at < 200 and > 200 m water depth, sediments, SPM < 200 and > 200 m water depth, water samples, and pore water samples.
Trap < 200 m Trap > 200 m Sediment SPM < 200 m SPM > 200 m Water Pore water
POC; DOC [%; mg L−1 ] Mean 13.6 5.3 1.8 14.9 10.6 0.8 13.0
SD ± 11.4 ± 1.9 ± 2.2 ± 8.3 ± 4.8 ± 0.2 ± 8.3
AA [mmol g−1 ; mmol L−1 ] Mean 631.3 164.1 49.8 907.7 661.9 3.2 8.8
SD ± 602.0 ± 93.8 ± 82.3 ± 637.6 ± 434.7 ± 3.2 ± 7.9
AAC / C [%] Mean 26.5 15.5 10.8 33.9 32.7 10.1 2.8
SD ± 8.6 ± 4.2 ± 5.9 ± 12.6 ± 10.5 ± 6.5 ± 2.6
AAN / N [%] Mean 57.0 38.3 24.2 65.6 61.6
SD ± 14.8 ± 8.8 ± 12.8 ± 18.4 ± 26.4
Asp / β-Ala Mean 71.8 19.2 10.5 57.9 47.3 10.2 2.6
SD ± 63.4 ± 19.5 ± 6.6 ± 64.7 ± 44.9 ± 14.7 ± 2.4
Glu / γ -Aba Mean 45.7 12.9 8.5 103.6 105.3 8.5 8.8
SD ± 38.8 ± 7.2 ± 6.9 ± 122.7 ± 69.6 ± 7.0 ± 10.2
AA / HA Mean 25.4 14.9 9.1 84.6 204.6 80.2 106.8
SD ± 14.7 ± 6.6 ± 4.6 ± 42.7 ± 179.1 ± 65.2 ± 142.7
Gluam / Galam Mean 3.2 3.6 1.2 3.0 2.1 1.6 0.3
SD ± 3.3 ± 1.1 ± 0.3 ± 1.8 ± 1.7 ± 2.4 ± 0.2
RI Mean 15.1 3.9 1.8 18.8 15.7 1.6 0.9
SD ± 16.4 ± 1.5 ± 2.2 ± 10.6 ± 8.3 ± 1.8 ± 0.7
DI Mean 0.9 0.3 −0.5 1.0 1.1 2.1 1.5
SD ± 0.8 ± 0.3 ± 0.8 ± 0.1 ± 0.3 ± 1.1 ± 0.9
SDI Mean 1.1 0.0 −0.9 0.8 0.8 −0.7 −0.8
SD ± 0.2 ± 0.2 ± 1.0 ± 0.2 ± 0.3 ± 0.4 ± 0.3
RTI Mean 0.7 0.1 0.6 0.2 −1.0 −2.8 −2.7
SD ± 0.3 ± 0.3 ± 0.4 ± 0.5 ± 0.4 ± 0.6 ± 0.4
ox / anox Mean 1.2 1.3 2.2 1.1 1.0 0.8 0.7
SD ± 0.3 ± 0.2 ± 1.1 ± 0.1 ± 0.1 ± 0.3 ± 0.3
∗ Definition of these indicators can be found in Sect. 4.2 below.
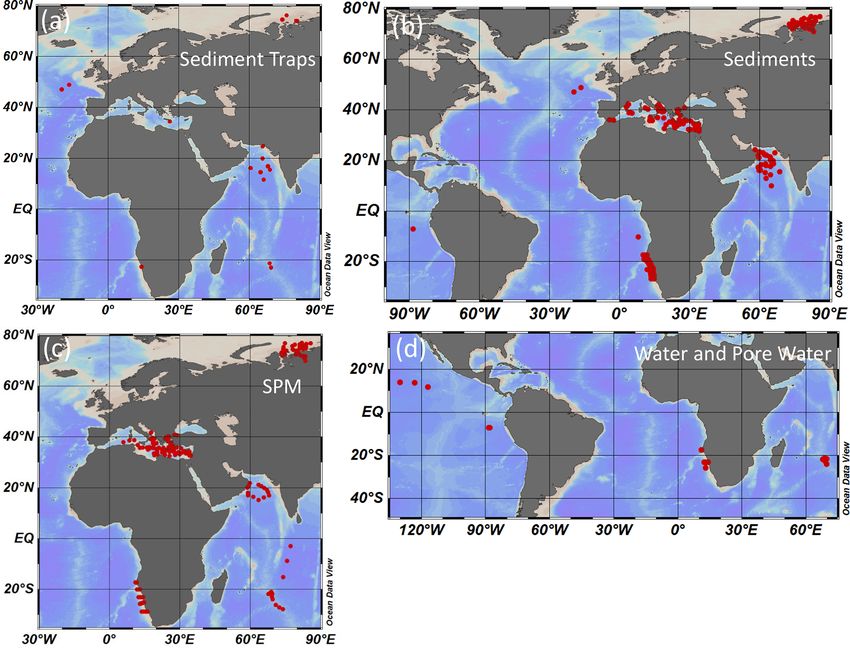
particles in the ocean. Sinking particles build up sediments, loadings. The highest F2 loadings are found for Asp, Thr,
and the degradation pathways evident in the water column – Lys, and Val while Gly, Orn, His, and Ser have the most
namely the accumulation of degradation products and acidic negative F2 loadings. Factor scores of the individual sam-
AA often absorbed to carbonates – continue in the sediments. ples (Fig. 6b) plot in a triangular shape with plankton and
Novel biogeochemical indicators are required for SPM and fresh organic matter from surface waters at the apex with the
possibly also DOM to characterize their AA changes. highest F1 and F2 scores. The diverging sides of the trian-
gle mark sinking particles and sediments decreasing in F1
4.2 Results of a PCA: two new biogeochemical scores on one side and SPM with decreasing F2 scores on
indicators the other side (Fig. 6b). Similar trends were observed in ear-
lier studies based on local data sets (Nagel et al., 2016; Gaye
A PCA of individual AAs (Mol %, Fig. 6a) of all samples et al., 2013b). That samples from greatly different environ-
compiled in this study results in two factors which explain ments reveal the same divergence between sinking particles
59 % of the total variance within the data set. The first fac- and SPM with only little overlap (Fig. 4) suggests a general
tor delineates the well-known changes along the degradation mechanism operating globally. Most of the overlap encom-
pathway from plankton via sinking particles to sediments. passes SPM and sediment trap samples from the Kara Sea all
Phe, Ile, Leu, Glu, and Tyr (enriched in fresh plankton) have sampled at water depths below 100 m. The Kara Sea is char-
the highest F1 loadings while Asp, ß-Ala, and γ -Aba (ac- acterized by sediment resuspension related to strong river-
cumulating during degradation) have the lowest negative F1
Biogeosciences, 19, 807–830, 2022 https://doi.org/10.5194/bg-19-807-2022B. Gaye et al.: Oceanic organic matter cycling and degradation 817
ine input in combination with sea ice dynamics so that many
of the Kara Sea SPM and trap samples are mixed with re-
suspended sediments (Gaye et al., 2007; Unger et al., 2005).
TDAAs analyzed in water and pore water form a cluster with
significantly different AA composition from particulate mat-
ter, but instead recapitulating the enrichments of Mol % Ser,
His, and Orn observed in SPM (Fig. 6b).
The precise separation of the degradation pathway of sink-
ing particles and sediments from SPM and DOM by the PCA
suggests that we can use the first factor (F1) to calculate a
new sinking particle and sediment degradation index (SDI):
X vari − AVG.vari
SDI = i
× Loadings.F1i , (4)
SD.vari
where vari is the original mole percentage of each AAi ;
AVG.vari and STD.vari are the mean and standard devia-
tions, respectively; and Loadings.F1i is the factor loading of
the first axis (F1) of the PCA of the individual amino acidi
shown in Table 2. Most of the F1 loadings resemble those of
the DI of Dauwe et al. (1999) (Table 2), and the SDI and DI
are thus significantly correlated (Table 3).
The second factor (F2) – normalized in the same way with
the averages and standard deviations of the same PCA – can
be used as an indicator of changes in the AA composition of
SPM possibly related to the residence time or renewal time
of the water mass they are transported with (see discussion
in Sect. 4.2.2). With longer residence time in the ocean, the
organic matter in SPM is likely to become more recalcitrant
and the indicator and is therefore named residence time index
(RTI),
Figure 6. Results of a PCA of AAs (Mol %) of all samples of this
X vari − AVG.vari study with factor loadings of amino acids for the first and second
RTI = × Loadings.F2i , (5)
i SD.vari factors (a) and factor scores of samples (b). Small arrows in (a)
point to the positions of Val and Ile. Arrows in (b) indicate progres-
and is calculated in the same way as the SDI, but the factor sive deviation in composition from the plankton source, essentially
loadings of the second axis (F2) of the PCA of the individual with increasing water and sediment depths.
amino acidi (Table 2) are inserted for the term Loadings.F2i .
The SDI allows a separation of trap samples from shallow
water depth from those of greater depths (Fig. S1). All sam-
ples from deep sediment traps have SDI values below 0.5. of sinking particles and sediments with the SDI (Table 3).
Likewise, SPM from > 200 m depths has lower RTI than We assume that correlations with Pearson correlation co-
most of the samples from shallower depths. Deep trap sam- efficients R> 0.50 can be considered “strong correlations”
ples and deep SPM samples form two clearly separated clus- (Cohen, 1988). The SDI correlates moderately to strongly
ters with different SDI and RTI (see Fig. S1 for further de- with the common degradation indicators, and the best pos-
tails). itive correlation is found between SDI and the DI (Table 3).
The strong correlation among the degradation indicators with
4.2.1 The SDI as an indicator of degradation and oxic POC contents indicates that this common and often measured
vs. anoxic diagenetic conditions of sinking variable is a good indicator of relative organic matter qual-
particles and sediments ity in sinking particles and sediments, and all other degrada-
tion indices do not perform better than POC concentrations
In order to test the performance of our new degradation in- (see correlation coefficients in Table 3). The DI and the SDI,
dices, we separated SPM samples from sinking particles and which are to some extent interchangeable, allow a fine tuning
sediments and correlated the common biogeochemical indi- of degradation intensities. The most significant negative cor-
cators and individual AAs (Mol %) of SPM with the RTI of relation of the ox / anox ratio with the SDI is preconditioned,
individual samples while we correlated the same variables as the ox / anox is the quotient of AAs enriched by degrada-
https://doi.org/10.5194/bg-19-807-2022 Biogeosciences, 19, 807–830, 2022818 B. Gaye et al.: Oceanic organic matter cycling and degradation
Table 2. Factor loadings of F1 and F2 for calculating the SDI and RTI, respectively, average [Mol %] and standard deviations (SD) of AAs of
samples used for the PCA shown in Fig.6 in comparison with the factor loadings (named factor coefficients) of the DI published by Dauwe
et al. (1999), and their averages [Mol %] and standard deviations used for the DI based on 28 sediment samples.
Amino acid Loadings F1 Average SD Loadings F2 DI DI average DI SD
SDI [Mol %] RTI [Mol %]
Ser 0.067 8.7 3.6 −0.210 0.015 7.2 1.9
His 0.014 2.4 2.3 −0.166 0.158 1.0 0.8
Orn −0.038 1.2 1.9 −0.152 – – –
Tyr 0.162 1.9 1.1 −0.075 0.178 2.1 1.2
Gly −0.023 16.2 2.8 −0.068 −0.099 17.6 3.8
Glu 0.132 10.5 2.5 −0.001 0.065 10.0 2.3
Leu 0.157 5.9 1.9 0.027 0.169 6.6 1.5
Ile 0.148 3.8 1.0 0.028 0.139 4.5 0.8
β-Ala −0.161 1.3 2.0 0.036 – – –
Phe 0.140 2.9 1.0 0.047 0.134 3.2 1.2
γ -Aba −0.164 1.0 1.6 0.064 – – –
Ala −0.030 9.1 1.5 0.080 −0.043 11.8 0.8
Arg 0.012 4.2 1.1 0.117 −0.115 6.1 2.3
Val 0.020 5.7 1.1 0.132 −0.044 7.6 1.1
Lys 0.026 5.1 1.2 0.135 – – –
Thr −0.074 5.7 1.2 0.174 −0.129 7.1 1.5
Asp −0.154 12.2 4.3 0.179 −0.102 13.4 2.7
tion to those enriched in fresh plankton. It should be noted core SO90-111 KL from within the mid-water oxygen min-
that this negative correlation is even better than the positive imum impinging on the Pakistan margin was used to recon-
correlation of the DI and the SDI. A close look at the SDI struct changes in oxygenation during the last 60 kyr based on
and ox / anox in sediment samples suggests that the SDI can δ 15 N values of total N (Suthhof et al., 2001). The δ 15 N values
be used to distinguish between oxic and anoxic diagenetic fluctuated between enhanced values in warm phases due to
conditions (Fig. 7). The sediment samples deposited in re- denitrification in the mid-water oxygen minimum and lower
gions of bottom water anoxia (surface samples from Namib- values in cold phases when the oxygen minimum zone was
ian shelf at < 200 m depths; a core from the Arabian Sea weaker or absent (Suthhof et al., 2001). The SDI very pre-
slope at 775 m) have lower ox / anox ratios and distinctly cisely tracks these changes (Fig. 7c), and in accordance with
higher SDI values compared with the samples from simi- the threshold discernable in Fig. 7a and b, we propose that
lar depths and oxygenated bottom water (e.g., Mediterranean the divide between oxic and anoxic diagenetic conditions is
Sea, Kara Sea) (Fig. 7a). The SDI performs better than the DI at SDI values between 0 and −0.2, with SDI < −0.2 indicat-
to determine diagenetic conditions as the DI less significantly ing oxic and SDI > 0 indicating anoxic diagenetic conditions
correlates with the ox / anox indicator (Fig. S2). The best fit (Fig. 7a, b). We further propose to use this indicator to re-
between the SDI and the ox / anox in sediment samples is construct redox conditions from sediment cores. The work
an exponential correlation with a correlation coefficient of of Carr et al. (2016) – relying on the DI – suggests that sig-
R = −0.95 while the DI and the ox / anox correlate exponen- nals of changes in redox conditions can be preserved even
tially with an R = −0.79 (Figs. 7a, S2). The SDI better de- down to 200 m core depth.
picts the spectral changes in samples deposited under anoxic
diagenetic conditions such as those from the Namibian shelf 4.2.2 The RTI as an indicator of suspended matter
(Nagel et al., 2016) and the Arabian Sea mid-water oxygen residence time
minimum zone (Suthhof et al., 2001) while the ox / anox ra-
tio better resolves variations in samples of strong oxic degra- Changes in SPM composition between shallow and deep wa-
dation so that the SDI is in fact better suited to determine the ters (Fig. 4b) are depicted by a decrease in the RTI, which
threshold of anoxic vs. oxic diagenesis. Another indication of is due to the relative depletion of Asp, Thr, Lys, and Val
this quality of the SDI is that the anoxic sediments have SDI with the highest positive factor loadings and the enrichment
values in the range of sediment trap samples from the wa- of Ser, His, and Orn with the most negative factor loadings
ter column while the SDI decreases in sediments under oxic (Table 2). Both Ser and Gly (Mol %) are strongly linearly an-
diagenetic conditions (Fig. 7b). Further, the SDI also corre- ticorrelated with the RTI (R = −0.91 and −0.90), showing
lates with other indicators of oxic vs. anoxic conditions. The that they can be used instead of the RTI to characterize SPM
if not all AAs used for the RTI can be measured. The anticor-
Biogeosciences, 19, 807–830, 2022 https://doi.org/10.5194/bg-19-807-2022B. Gaye et al.: Oceanic organic matter cycling and degradation 819
Table 3. Pearson correlation coefficients of the SDI, RI, DI, Asp / β-Ala, and Glu / γ -Aba with selected AA∗ , the RTI, AAC / C, AAN / N,
AA ratios and degradation indices, water depth (Depth), POC and TN contents (%), and AA concentrations (nmol g−1 ) in sediment trap and
sediment samples (columns 2–6). Pearson correlation coefficients of the RTI, RI, DI, Asp / β-Ala and Glu / γ -Aba with selected AA, SDI,
AAC / C, AAN / N, AA ratios and degradation indices, water depth (Depth), POC and TN contents (%), and AA concentrations (nmol g−1 )
in SPM samples (columns 8–12). Italics indicate strong correlation.
1 2 3 4 5 6 7 8 9 10 11 12
Traps, sediments SDI RI DI Asp / β-Ala Glu / γ -Aba SPM RTI RI DI Asp / β-Ala Glu / γ -Aba
Asp −0.68 −0.30 −0.83 −0.25 −0.32 Asp 0.81 0.00 −0.61 0.13 −0.17
Thr 0.12 −0.25 −0.25 0.03 0.07 Thr 0.86 −0.02 −0.57 0.06 −0.16
Ser 0.32 0.03 0.16 0.09 0.16 Ser −0.91 −0.15 0.08 −0.11 −0.01
Gly −0.21 −0.32 −0.45 −0.31 −0.31 Gly −0.90 −0.17 0.12 −0.11 0.04
Ala 0.46 0.07 0.17 0.03 0.11 Ala 0.91 0.09 −0.43 0.11 −0.09
Val 0.67 0.31 0.48 0.29 0.31 Val 0.88 0.07 −0.26 0.08 −0.09
Ile 0.87 0.48 0.76 0.52 0.55 Ile 0.68 0.34 0.26 0.26 0.02
Leu 0.88 0.49 0.76 0.52 0.56 Leu 0.65 0.47 0.28 0.35 0.11
Tyr 0.72 0.39 0.76 0.34 0.32 Tyr −0.14 0.27 0.66 0.02 0.23
Phe 0.89 0.38 0.79 0.40 0.44 Phe 0.78 0.37 0.04 0.29 0.06
β-Ala −0.85 −0.27 −0.44 −0.32 −0.35 β-Ala −0.08 −0.66 −0.19 −0.52 −0.12
γ -Aba −0.79 −0.25 −0.37 −0.28 −0.35 γ -Aba 0.24 −0.53 −0.65 −0.20 −0.40
Lys 0.56 0.14 0.43 0.15 0.15 Lys 0.71 0.05 −0.20 0.03 −0.06
SDI 0.45 0.82 0.46 0.51 SDI 0.07 0.49 0.83 0.23 0.28
RTI 0.04 −0.01 −0.26 0.03 −0.05 RTI 0.10 −0.34 0.12 −0.08
AAC / C% 0.56 0.51 0.53 0.56 0.56 AAC / C% −0.08 0.14 0.22 0.06 0.09
AAN / N% 0.55 0.40 0.49 0.47 0.47 AAN / N% −0.05 0.06 0.03 −0.06 0.08
AA / HA 0.54 0.58 0.54 0.73 0.75 AA / HA −0.57 0.11 0.32 -0.01 0.16
Gluam / Galam 0.36 0.43 0.44 0.40 0.35 Gluam / Galam 0.27 0.43 0.16 0.28 0.08
Asp / β-Ala 0.46 0.93 0.57 0.85 Asp / β-Ala 0.12 0.74 0.10 0.07
Glu / γ -Aba 0.51 0.93 0.56 0.85 Glu / γ -Aba −0.08 0.37 0.24 0.07
RI 0.45 0.49 0.93 0.93 RI 0.10 0.33 0.74 0.37
DI 0.82 0.49 0.51 0.56 DI −0.34 0.33 0.10 0.24
ox / anox −0.91 −0.30 −0.71 −0.31 −0.37 ox / anox 0.67 −0.19 −0.50 −0.10 −0.09
Depth −0.67 −0.28 −0.54 −0.28 −0.37 Depth −0.55 −0.12 0.23 −0.11 0.04
POC 0.57 0.79 0.67 0.77 0.76 POC 0.27 0.30 0.13 0.25 −0.03
N 0.45 0.46 0.50 0.39 0.39 N 0.29 0.30 0.13 0.24 −0.01
AA 0.51 0.84 0.60 0.79 0.76 AA 0.17 0.28 0.15 0.20 0.01
∗ Only AAs with a correlation coefficient R ≥ 0.50 with at least one of the indicators are shown.
relation of the RTI with water depths (R = −0.55; Table 3) is could be explained by a recalcitrant nature making the AAs
due to the RTI decrease in the upper 200 m only. Below this barely accessible to further microbial degradation. Alterna-
depth there is no further trend in the RTI, and values scatter tively, and analogously with observations of DOC, it could
between −0.5 and −1.5 (Fig. 8). be due to low concentrations of SPM, which rather than their
The results of our PCA also show that below 200 m recalcitrance limit prokaryotic growth and thus organic mat-
SPM becomes distinctly decoupled from sinking aggregates ter degradation in the deep ocean (Arrieta et al., 2015). The
(Figs. 6, S1). Both sinking particles and SPM sampled in the age of the water masses in the upper ocean mixed layer is
upper ocean mixed layer and euphotic zone resemble fresh less than 100 years while deeper waters have ages of several
plankton, whereas below the surface mixed layer they fol- 100 years to maxima of 1600 years in the deep Indian and
low different pathways, and the chance that SPM and sink- Pacific oceans (England, 1995; Gebbie and Huybers, 2012).
ing particles interact obviously decreases with water depth, The constantly low RTI below the mixed layer is thus related
which could be due to the scarcity of both types of parti- to the long residence time of deep SPM in the deep ocean. An
cles in the deep ocean (McCave, 1984). Our AA results sup- earlier study using detailed ventilation ages available from
port previous studies on SPM (using thorium isotopes, radio- the Atlantic and Pacific subtropical gyres at stations BATS
carbon, and biomarkers, for example) which found that the and respectively HOT showed that changes in AA compo-
interaction between sinking particles and SPM by aggrega- sition of SPM took place within a few decades (Kaiser and
tion and disaggregation strongly decreases from the euphotic Benner, 2009).
zone to the meso- and bathypelagic zone and that SPM rather Solubilization of particulate matter by exoenzymes and
interacts with DOM due to the long residence time of both the subsequent uptake in the dissolved form (Carlson and
in the deep ocean (Lam and Marchal, 2015). The observed Hansell, 2015; Aristegui et al., 2009) lead to an almost com-
constant AA composition of SPM below 200 m water depth plete turnover of originally diverse surface-derived organic
https://doi.org/10.5194/bg-19-807-2022 Biogeosciences, 19, 807–830, 2022You can also read