Kentucky Statewide TMDL for Bacteria Proposed Draft March 2018
←
→
Page content transcription
If your browser does not render page correctly, please read the page content below
Kentucky Statewide TMDL for Bacteria                                                                Proposed Draft March 2018

                    Figure D.1 Location of the Green Basin and Bacteria-impaired Waterbodies (January 2017)

                                                             D-5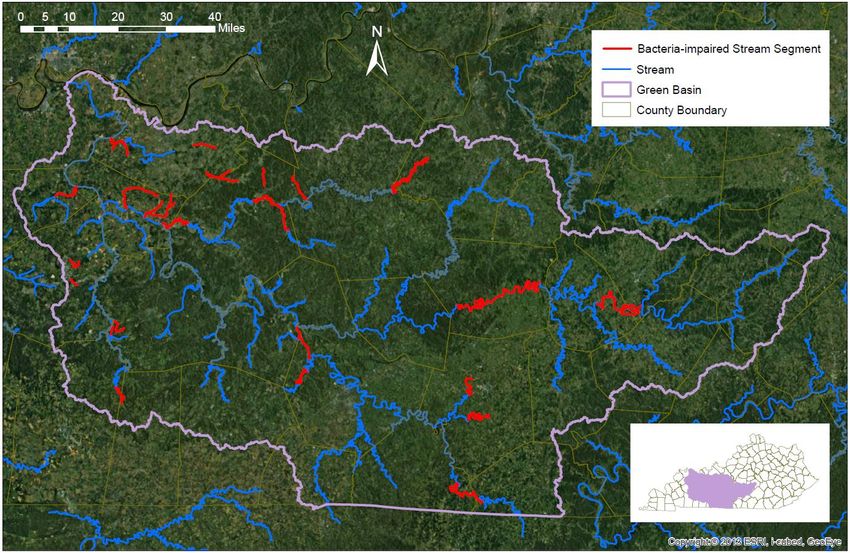
Kentucky Statewide TMDL for Bacteria                                       Proposed Draft March 2018

Section D.1 Barren River 0.0 to 8.4

Waterbody ID: KY517526_01

Receiving Water: Green River

Impaired Use: PCR

Support Status: partial support

Indicator Bacteria: E. coli

HUC 12: 051100020905

Counties: Butler, Warren

The KDOW has collected samples from station PRI 072, located at river mile 0.55, since 1998.
The station typically has been sampled three or more times during the PCR season, although it
was not sampled in 2004, 2009 or 2010. Table D.1-1 summarizes information about this
sampling station; Table D.1-2 provides a summary of the data collected from this station.

                               Table D.1-1 KDOW Sample Site Location
      Station                                                              Stream                 River
       Name               Latitude              Longitude                 Segment                 Mile
      PRI 072            37.1732777            -86.6231944           Barren River 0 to 8.4        0.55

                              Table D.1-2 KDOW Sample Data Summary(1)
                                       Number          Percent      Minimum        Maximum         Average
      Station        Indicator            of          Exceeding     (colonies/     (colonies/    (colonies/
       Name           Bacteria      Observations        WQC2         100 ml)        100 ml)        100 ml)
      PRI 072      fecal coliform         30             16.7            2           3,800           412
      PRI 072           E. coli           35             22.9           10           8,664           468
(1)
    The full data set for samples collected at PRI 072 may be obtained by submitting a request of records
under the Kentucky Open Records Act (KORA) to DEP.KORA@ky.gov or by fax to 502-564-9232. The DEP
KORA point of contact may also be reached at 502-564-3999.
(2)
    400 colonies/100 ml for fecal coliform; 240 colonies/100 ml for E. coli.

The TMDL allocations for Barren River 0.0 to 8.4 are presented in Table D.1-3. There are no
KPDES-permitted discharges of bacteria into this segment of the Barren River. The location of
the segment within the Gasper River and Little Muddy Creek-Barren River watersheds is shown
in Figure D.1-1.

                                                   D-8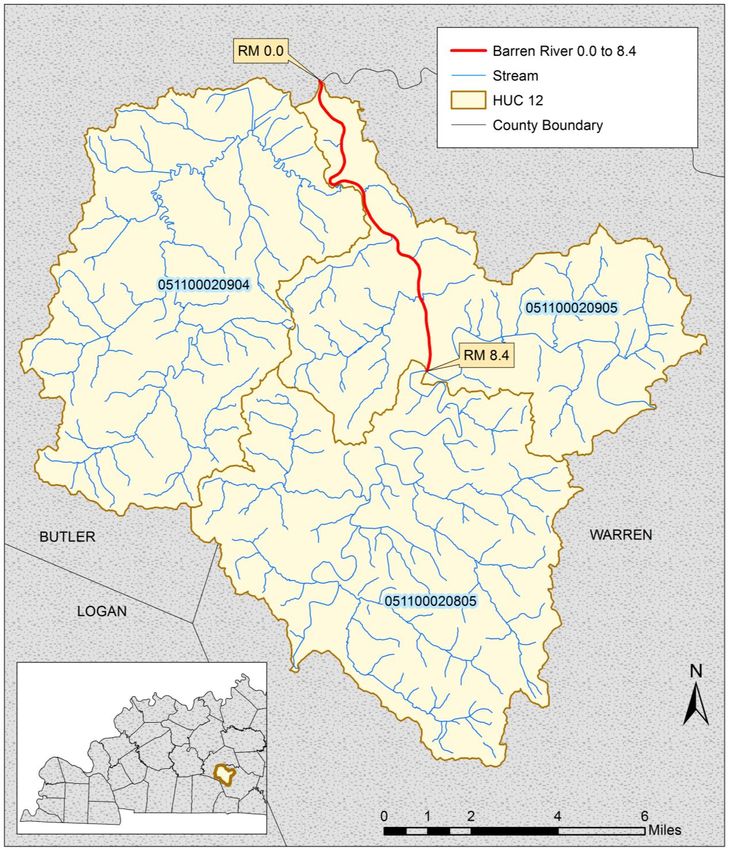
Kentucky Statewide TMDL for Bacteria                                    Proposed Draft March 2018

                     Table D.1-3 Barren River 0.0 to 8.4 TMDL Allocations(1)
                 Allocations for Direct
                                          Allocations for Upstream   Allocations for Tributary
     TMDL(2)     Loads to the Segment                                                            MOS(6)
                                           Loads to the Segment(4)   Loads to the Segment(5)
                          LA(3)
  QS×WQC×CF         ∑(QLA×WQC×CF)          ∑(QUpstream×WQC×CF)        ∑(QTributary×WQC×CF)       Implicit
(1)All loads are colonies/day of either E. coli or fecal coliform. The recreational use bacterial
    WQCs are found in 401 KAR 10:031. CF is the conversion factor (24,465,758.4 s-ml/ft3-day) to
    change the product of bacterial concentration (colonies/100 ml) and flow (ft 3/s) into a load
    (colonies/day). The symbol “∑” indicates that the total allocation is the sum of all the
    individual allowable loads. All flows, denoted by Q with a subscript, are instantaneous flow
    values at any point in time.
(2)Q is the flow (ft3/s) in the segment.
     S
(3)Q is the flow (ft3/s) in the segment due to a LA source.
     LA
(4)Q                                        3
     Upstream is the flow contribution (ft /s) from upstream of the segment. This load includes both
    WLA and LA sources upstream of the impaired segment.
(5)Q                                       3
     Tributary is the flow contribution (ft /s) from a tributary to the segment. This load includes
    both WLA and LA sources on tributaries to the impaired segment.
(6)The following assumptions provide an implicit MOS:

    (a)Upstream and tributary bacterial concentrations are at the maximum allowable limit;
         there is no dilution capacity from these areas.
     (b)There is no bacteria die-off; in reality bacteria concentrations diminish downstream from
         their source. Thus, bacteria loads to the upper portion of a segment will diminish prior to
         reaching the lower portion of the segment.

                                                 D-9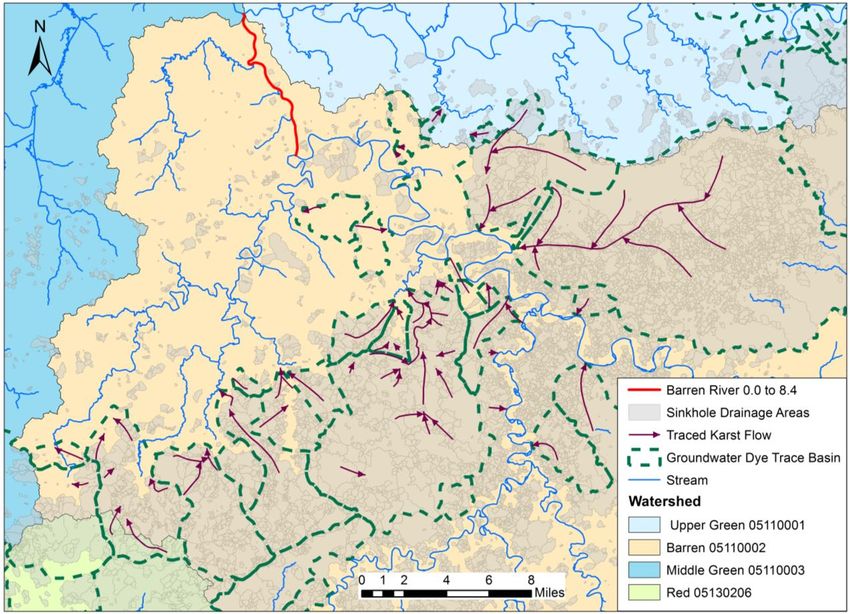
Kentucky Statewide TMDL for Bacteria                                Proposed Draft March 2018

                        Figure D.1-1 Location of Barren River 0.0 to 8.4

This watershed exists in a karst area with sinkholes and springs. The sink features may capture
surface drainage and channel it underground to resurface later at one or more springs. These
discharging springs may occur outside the watershed where the drainage originated. However,
unless karst dye trace studies indicate otherwise, groundwater catchment is presumed to
correspond to the topographic watershed boundaries of surface drainage. Figure D.1-2 shows

                                             D-10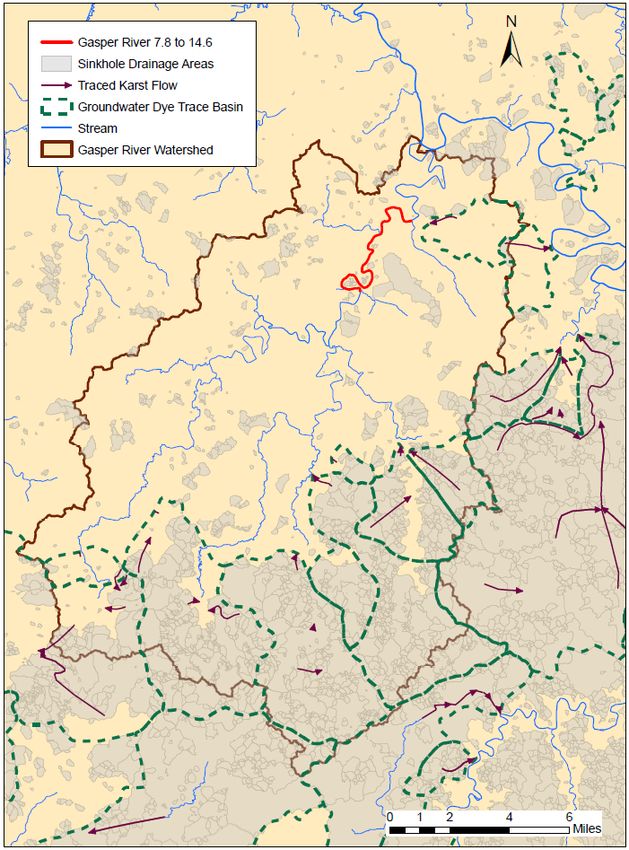
Kentucky Statewide TMDL for Bacteria                                 Proposed Draft March 2018

sinkhole occurrence, trends in traced flow through karst areas, and groundwater basins in the
region of Barren River 0.0 to 8.4. Dye tracing in the region has shown that a small area of the
Beaverdam Creek-Green River watershed (0511000113) in the north contributes karst flow to
Poorhouse Spring, which discharges near milepost 32.6 of the Barren River. In the southwest, a
small portion of the Red River watershed contributes karst flow to the Barren River watershed.
For more detailed information about karst geology, see Section 3.2, Karst.

              Figure D.1-2 Karst Influence in the Region of Barren River 0.0 to 8.4

                                              D-11
Kentucky Statewide TMDL for Bacteria Proposed Draft March 2018
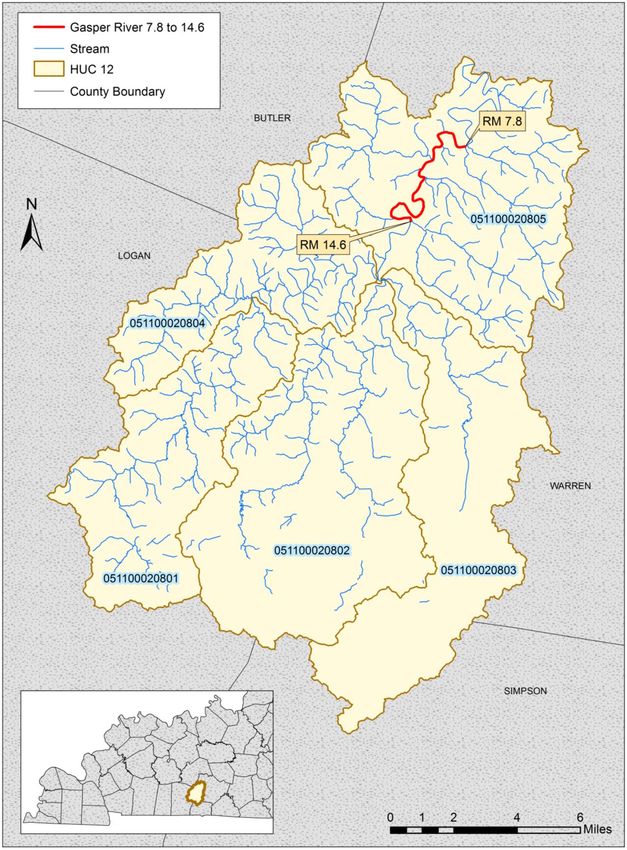
Section D.13 Gasper River 7.8 to 14.6
Waterbody ID: KY492748_01
Receiving Water: Barren River
Impaired Use: PCR
Support Status: partial support
Indicator Bacteria: E. coli
HUC 12: 051100020805
County: Warren
The KDOW has collected samples from station GRN 020, located at river mile 12.05, since 2001.
The station has been sampled four to six times during the PCR season as part of the KDOW five-
year rotating schedule for basin monitoring (see also Section 7.2.1, Kentucky Watershed
Management Framework). Table D.13-1 summarizes information about this sampling station;
Table D.13-2 provides a summary of the data collected from this station.
Table D.13-1 KDOW Sample Site Location
Station Stream River
Name Latitude Longitude Segment Mile
GRN 020 37.022069 -86.607015 Gasper River 7.8 to 14.6 12.05
Table D.13-2 KDOW Sample Data Summary(1)
Number Percent Minimum Maximum Average
Station Indicator of Exceeding (colonies/ (colonies/ (colonies/
Name Bacteria Observations WQC2 100 ml) 100 ml) 100 ml)
GRN 020 fecal coliform 4 0.0 1 336 149
GRN 020 E. coli 15 46.7 56 2,420 854
(1)
The full data set for samples collected from GRN 020 may be obtained by submitting a request of
records under the Kentucky Open Records Act (KORA) to DEP.KORA@ky.gov or by fax to 502-564-9232.
The DEP KORA point of contact may also be reached at 502-564-3999.
(2)
400 colonies/100 ml for fecal coliform; 240 colonies/100 ml for E. coli.
The TMDL allocations for Gasper River 7.8 to 14.6 are presented in Table D.13-3. There are no
KPDES-permitted discharges of bacteria into this segment of the Gasper River.
D-46Kentucky Statewide TMDL for Bacteria Proposed Draft March 2018
Table D.13-3 Gasper River 7.8 to 14.6 TMDL Allocations(1)
Allocations for Direct Allocations for
Allocations for Tributary
TMDL(2) Loads to the Segment Upstream Loads to the MOS(6)
Loads to the Segment(5)
LA(3) Segment(4)
QS×WQC×CF ∑(QLA×WQC×CF) ∑(QUpstream×WQC×CF) ∑(QTributary×WQC×CF) Implicit
(1)All loads are colonies/day of either E. coli or fecal coliform. The recreational use bacterial
WQCs are found in 401 KAR 10:031. CF is the conversion factor (24,465,758.4 s-ml/ft3-day)
to change the product of bacterial concentration (colonies/100 ml) and flow (ft3/s) into a
load (colonies/day). The symbol “∑” indicates that the total allocation is the sum of all the
individual allowable loads. All flows, denoted by Q with a subscript, are instantaneous flow
values at any point in time.
(2)Q is the flow (ft3/s) in the segment.
S
(3)Q is the flow (ft3/s) in the segment due to a LA source.
LA
(4)Q 3
Upstream is the flow contribution (ft /s) from upstream of the segment. This load includes both
WLA and LA sources upstream of the impaired segment.
(5)Q 3
Tributary is the flow contribution (ft /s) from a tributary to the segment. This load includes
both WLA and LA sources on tributaries to the impaired segment.
(6)The following assumptions provide an implicit MOS:
(a)Upstream and tributary bacterial concentrations are at the maximum allowable limit;
there is no dilution capacity from these areas.
(b)There is no bacteria die-off; in reality bacteria concentrations diminish downstream from
their source. Thus, bacteria loads to the upper portion of a segment will diminish prior to
reaching the lower portion of the segment.
The location of the segment within the Gasper River watershed is shown in Figure D.13-1. This
watershed exists in a karst area characterized by many sinkholes, sinking streams, and springs.
The sink features may capture surface drainage and channel it underground to resurface later
at one or more springs. These discharging springs may occur outside the watershed where the
drainage originated. However, unless karst dye trace studies indicate otherwise, groundwater
catchment is presumed to correspond to the topographic watershed boundaries of surface
drainage. Dye trace studies in the area indicate that some dye trace basin boundaries in the
south and east extend beyond the HUC 12 topographic boundaries of the Gasper River
watershed and should be considered additional contributing areas (see Figure D.13-2). For
more detailed information about karst geology, see Section 3.2, Karst.
D-47Kentucky Statewide TMDL for Bacteria Proposed Draft March 2018
Figure D.13-1 Location of Gasper River 7.8 to 14.6
D-48Kentucky Statewide TMDL for Bacteria Proposed Draft March 2018
Figure D.13-2 Karst Influence in the Region of Gasper River RM 7.8 to 14.6
D-49You can also read