Marine cyanobacterium Spirulina maxima as an alternate to the animal cell culture medium supplement
←
→
Page content transcription
If your browser does not render page correctly, please read the page content below
www.nature.com/scientificreports
OPEN Marine cyanobacterium
Spirulina maxima as an alternate
to the animal cell culture medium
supplement
Younsik Jeong1, Woon‑Yong Choi1, Areumi Park1, Yeon‑Ji Lee1, Youngdeuk Lee1,
Gun‑Hoo Park1,2, Su‑Jin Lee1, Won‑Kyu Lee1,3, Yong‑Kyun Ryu1,3 & Do‑Hyung Kang1,3*
Serum is a stable medium supplement for in vitro cell culture. Live cells are used in stem cell research,
drug toxicity and safety testing, disease diagnosis and prevention, and development of antibiotics,
drugs, and vaccines. However, use of serum in culture involves concerns such as an ethical debate
regarding the collection process, lack of standardized ingredients, and high cost. Herein, therefore,
we evaluated the possibility of using edible cyanobacterium (Spirulina maxima), which is a nutrient-
rich, sustainable, and ethically acceptable source, as a novel substitute for fetal bovine serum (FBS).
H460 cells were cultured to the 10th generation by adding a mixture of spirulina animal cell culture
solution (SACCS) and FBS to the culture medium. Cell morphology and viability, cell cycle, apoptosis,
proteomes, and transcriptomes were assessed. We observed that SACCS had better growth-
promoting capabilities than FBS. Cell proliferation was promoted even when FBS was replaced by
50–70% SACCS; there was no significant difference in cell shape or viability. There were only slight
differences in the cell cycle, apoptosis, proteomes, and transcriptomes of the cells grown in presence
of SACCS. Therefore, SACCS has the potential to be an effective, low-cost, and eco-friendly alternative
to FBS in in vitro culture.
In vitro cell culture is widely used in various research fields, especially in the pharmaceutical and biotechnologi-
cal industries. Fetal bovine serum (FBS) is generally used as a cell culture supplement to optimize cell culture
conditions. FBS is a complex composite of high- and low-molecular-weight biomolecules and mainly consists
of vitamins, hormones, minerals, factors (for cell growth, attachment, and spreading), and transport p roteins1,2.
However, the use of FBS involves certain concerns. FBS is collected in aseptic conditions by separating the fetus
from the slaughtered pregnant cow and stabbing large diameter needles into the heart of the unanesthetized
fetus3. Therefore, there is a possibility of FBS contamination by viruses, mycoplasma, and prions and its use may
involve both ethical issues with the collection process and scientific issues with variations in composition between
batches4–7. Additionally, FBS prices have tripled over the past few years owing to increased d emand8. For these
reasons, a major focus of cell culture research has been to identify or develop FBS alternatives. Although there
have been attempts to replace FBS with serum from other animals (goats, pigs, or horses), their application was
limited, as they helped the growth of only some cell lines9–12.
Spirulina (Arthrospira) maxima is a helicoidal, unbranched, and filamentous cyanobacterium belonging to the
Oscillatoriaceae family13. S. maxima is a rich source of proteins (~ 60–70% of its dry weight), phycobiliprotein,
vitamins, essential fatty acids, carotenoids, and m inerals14,15. It also contains antioxidants that can protect cells
from oxidative damage. S. maxima is recognized as an unrestricted food by the Korea Food and Drug Adminis-
tration and a Generally Recognized As Safe substance, indicating its non-toxic nature4. Several pharmaceutical
companies produce Spirulina and its products, which are sold as food supplements in several health food stores
worldwide. Recently, research on the therapeutic effects of S. maxima has attracted great attention. Several clini-
cal studies have suggested various therapeutic effects ranging from radiation protection, increase in intestinal
lactobacillus abundance, alleviation of cholesterol levels and cancer, strengthening of the immune system, and
lowering of nephrotoxicity caused by heavy metals and drugs16–18. In addition, previous in vitro and in vivo
studies have reported the anti-oxidant, anticancer, anti-hyperlipidemic, anti-neurotoxic, and anti-type 1 diabetic
1
Jeju Marine Research Center, Korea Institute of Ocean Science and Technology (KIOST), Jeju, Republic of
Korea. 2School of Pharmacy, Sungkyunkwan University, Seoul, Republic of Korea. 3Department of Ocean Science,
University of Science and Technology (UST), Jeju, Republic of Korea. *email: dohkang@kiost.ac.kr
Scientific Reports | (2021) 11:4906 | https://doi.org/10.1038/s41598-021-84558-2 1
Vol.:(0123456789)
www.nature.com/scientificreports/
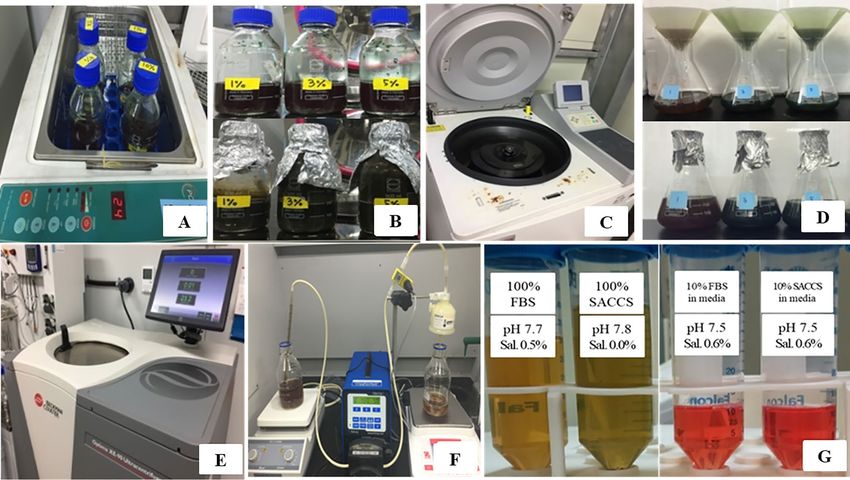
Figure 1. Schematic manufacturing process for spirulina animal cell culture solution (SACCS). (A) Cell
disruption through ultrasonication (B) Extraction and sterilization through high temperature and high-pressure
treatment. (C) Centrifugation. (D) Supernatant recovery using filter paper. (E) Ultracentrifugation. (F) 0.2-μm
sterilization pump filter system. (G) Comparison of characteristics between fetal bovine serum (FBS) and
SACCS [pH and salinity (Sal.)] in each cocktailed media.
effects of S. maxima19–23. However, the complete nutritional, immunological, and physiological functions of
Spirulina remain unknown owing to a lack of diverse and advanced approaches. Hence, there is a need to develop
novel technologies to study the practical applications of marine Spirulina-derived medicines and biomaterials.
As S. maxima contains components such as proteins, minerals, trace elements, and lipids that assist in cell
growth and proliferation, it has a higher protein content than commonly used Spirulina platensis24, it has the
potential to replace FBS as a cell culture supplement. This strain, unlike land crops, contains many nutritional
ingredients that can exert multiple effects on cell lines in a single extract. The current study aimed to investigate
the extraction, physical properties, biocompatibility, and range of use of S. maxima extract for its application
as an FBS alternative.
Results
Characterization and contamination detection of SACCS. Salinity is a key factor that regulates the
growth of organisms and preserves their cellular structure. In addition, cellular growth also requires an optimal
and stable pH. Hence, the salinity and pH of SACCS and FBS were measured and compared. The pH and salinity
of FBS were 7.7 and 0.5%, respectively and those of SACCS were 7.8 and 0%, respectively (Fig. 1G). However,
both pH and salinity were not different when FBS and SACCS were each mixed in MEM medium at a 10% ratio
(Fig. 1G). Contamination with bacteria, fungi, endotoxins, and mycoplasma can have detrimental effects on
the cell culture. To confirm the complete removal of contamination source(s), the contamination levels were
assessed by PCR (Fig. 2), and the absence of fungi, bacteria, and mycoplasma was confirmed (Fig. S1).
Table 1 shows the general components, minerals, and heavy metal content of SACCS and FBS analyzed in
this study. The SACCS contained 13.20% of carbohydrate, 79.20% protein, and 4.40% lipid, compared with FBS
contained 8.08% of carbohydrate, 85.00% of protein, and 1.75% of lipid. Their main biochemical component
was protein, and a similar ratio was has been confirmed. The mineral contents were determined to have a similar
ratio to each other, and only a small amount of heavy metals were detected in the SACCS. It was found to have
not completely similar, but the overall component contents ratio has similar properties.
Efficacy of SACCS as an alternative for FBS in cell culture. Cytotoxicity of SACCS was determined
by testing viability of H460 cells treated with 0.5×, 1×, 2×, and 3× SACCS using a WST assay kit. The viability of
cells grown in medium containing up to 2× SACCS was found to be 100% or more; cytotoxicity was not observed
(Fig. 3A). Two SACCS concentrations (0.5× and 1×) were combined with FBS in various ratios (F5:S5, F3:S7,
and F1:S9) and added as an FBS alternative in the culture medium. The number of cells was counted and pho-
tographed with a microscope at each passage. The results for 10 passages with H460 cells are depicted in Fig. 3.
Scientific Reports | (2021) 11:4906 | https://doi.org/10.1038/s41598-021-84558-2 2
Vol:.(1234567890)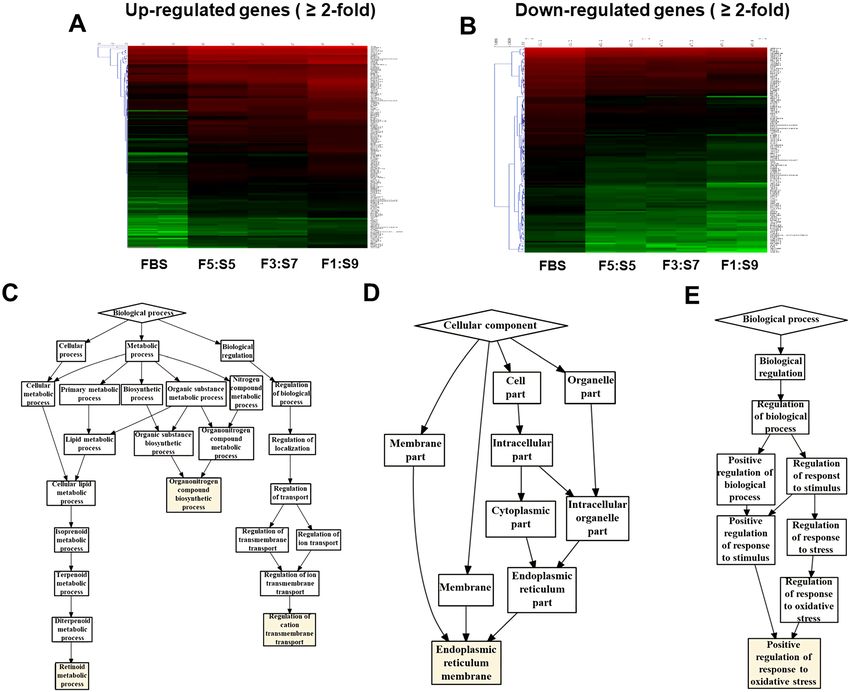
www.nature.com/scientificreports/
Figure 2. Microbial contamination test on SACCS. Polymerase chain reaction (PCR) experiments for the
detection of (A) mycoplasma, (B) fungal, and (C) bacterial contamination in the SACCS samples.
SACCS FBS
Organic and inorganic indices Components Concentration (mg/L) Percentage (%) Concentration (mg/L) Percentage (%)
Carbohydrate 900.00 13.20 3700.00 8.08
Biochemical components Protein 5400.00 79.20 38900.00 85.00
Lipid 300.00 4.40 800.00 1.75
Calcium 17.00 0.25 136.60 0.30
Sodium 85.00 1.25 2164.30 4.73
Magnesium 6.40 0.09 39.10 0.09
Potassium 10.00 0.15 6.10 0.01
Manganese 0.10 0.00 0.00 0.00
Minerals
Iron 7.90 0.12 3.20 0.01
Copper 1.30 0.02 0.40 0.00
Boron 0.40 0.01 0.40 0.00
Phosphorus 89.10 1.31 12.30 0.03
Zinc 1.10 0.02 3.50 0.01
Lead 0.02 0.00 0.00 0.00
Heavy metals Cadmium 0.01 0.00 0.00 0.00
Mercury 0.00 0.00 0.00 0.00
Table1. Summary of biochemical components of SACCS and FBS. SACCS: 1 × SACCS in 99% distilled water.
When 1× SACCS was used, the cell growth rate was confirmed to be 112% in F5:S5, 102% in F3:S7, and 87% in
F1:S9 compared with that in F10:S0 (Fig. 3B). There was no significant change in the shape of the cells. In case of
0.5× SACCS, although fluctuations were noted, the cells in F5:S5-containing medium showed growth rates simi-
lar to those in F10:S0-containing medium during the 10 passages. In contrast, cells in F1:S9 exhibited constant
lower cell numbers compared with the control (p < 0.001). F3:S7 showed approximately 97% efficacy (Fig. 3C).
FBS and SACCS mixture supported cell growth throughout the 10 passages of subculture at all the mixing ratios.
In terms of cell morphology, the cells cultured in F5:S5 were similar to those in F10:S0, but cells in F1:S9 revealed
cytoplasmic vacuolization or blurring of intercellular boundaries.
To detect the biological effects of the supplement on cell proliferation, cells subcultured for 10 generations
were transferred to a 96-well plate and the cell viability was detected for 3 days using WST assay. When 1× SACCS
was used, the cell survival rate was not more than 100% in all the mixing ratios (Fig. 3D). However, when
0.5× SACCS was used, cell viability was confirmed to be 100% or more till 70% SACCS replacement (Fig. 3E).
The normal cell cycle is classified into G1, S, G2, and M phases, where cell growth occurs in the G1 phase,
DNA replication in the S phase, growth and preparation for the cell division in the G 2 phase, and cell division
in the M phase25. We compared and analyzed the cell cycle phases of the cells cultured in SACCS-supplemented
media with that of the control. The cell cycles of H460 cultured for a long time in FBS control and F5:S5 and
F3:S7 media were almost similar. However, the ratio of G0 and G 1 phase was decreased while the ratio of G2 and
M phase was increased in the cells cultured in F1:S9 (Fig. 4A).
To further determine whether an increase in SACCS ratio in the medium induced cell growth inhibition and
apoptosis in H460 cells, cell death was analyzed by staining with annexin V-FITC and PI, followed by flow cytom-
eter. The results showed 4.7% apoptosis induced in the FBS control, but 7.2%, 7.7%, and 7.5% apoptosis induced
in the F5:S5, F3:S7, and F1:S9 groups, respectively. In case of the cells cultured in SACCS culture medium, the
apoptosis rates did not change significantly (Fig. 4B).
Scientific Reports | (2021) 11:4906 | https://doi.org/10.1038/s41598-021-84558-2 3
Vol.:(0123456789)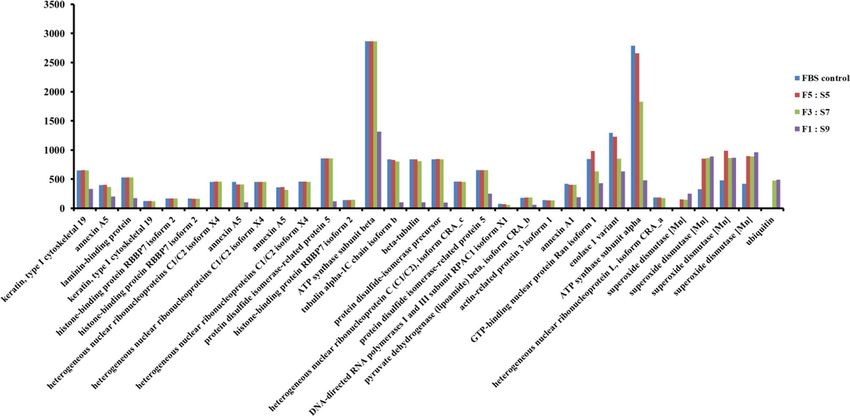
www.nature.com/scientificreports/
Figure 3. Evaluation of FBS substitution efficacy of SACCS. Cytotoxicity test of distilled water (DW), fetal
bovine serum (FBS), 0.5× , 1× , 2 × , and 3 × spirulina animal cell culture solution (SACCS) on human lung
cancer cell line H460 (A). Comparison of the cell morphology, metabolic proliferation activities, and cell
viabilities of the cells in the control medium (FBS) and SACCS-substituted medium [1× SACCS (B, D) and
0.5× SACCS (C, E)]. Data are expressed as mean ± SD of three independent experiments. *p < 0.05; **p < 0.01;
***p < 0.001 compared with the cells cultured in F10:S0. Bar = 100 μm. Figures were made with GraphPad Prism
(ver. 8.1.1, San Diego, USA), https://www.graphpad.com/scientific-software/prism/.
Figure 4. Cell cycle and apoptotic cell death type distribution of the 10-passage adapted H460 cell line in
control medium (FBS) and 0.5× SACCS-substituted medium. Cells were stained with Annexin V-FITC and PI
and analyzed on a BD FACS Accuri C6 flow cytometer. Distribution of (A) percentage of cell cycle phases and
(B) apoptosis in media with different FBS:SACCS ratios.
Scientific Reports | (2021) 11:4906 | https://doi.org/10.1038/s41598-021-84558-2 4
Vol:.(1234567890)
www.nature.com/scientificreports/
Figure 5. Transcript analysis of SACCS-adapted H460 cell line. Heat map of differentially expressed genes with
more than twofold expression—(A) up-regulated genes and (B) down-regulated genes. Statistically significant
(p ≤ 0.001) differentially expressed gene ontology enrichment analysis of cells cultured in (C) F5:S5, (D) F3:S7,
and (E) F1:S9 media. Sample libraries were filtered onto the assembled transcriptome using Bowtie2 (ver. 2.4.2),
http://bowtie-bio.sourceforge.net/bowtie2/index.shtml. Differentially expressed genes (DEGs) with a fold
change of 2 or more (p value < 0.05) were mapped and visualized (A and B) by the CLRNAseq program (ver.
1.00.06, Chunlab, Seoul, Korea), https://www.chunlab.com/ngs/eng/service/rna. Gene ontology was analyzed
using GOrilla for the associated genes (C, D and E), http://cbl-gorilla.cs.technion.ac.il.
Transcriptomic and proteomic analyses. For gene expression profile analysis, we generated more than
45 million mRNA reads per sample. A total of 48.4 (control), 48.1 (F5:S5), 46.8 (F3:S7), and 46.2 (F1:S9) mil-
lion reads were obtained for H460 cells and could be mapped uniquely to the respective reference genomes
(Fig. 5A,B). Compared with the control group, we identified 182, 152, and 272 DEGs in the F5:S5, F3:S7, and
F1:S9 groups, respectively. Furthermore, 100 up-regulated and 82 down-regulated genes were observed in F5:S5,
73 up-regulated and 79 down-regulated genes in F3:S7, and 142 up-regulated and 130 down-regulated genes
in F1:S9. Forty-nine DEGs were identified in all the three experimental groups. In addition, GO enrichment
analysis for each sample in the biological process category revealed that F5:S5 included organonitrogen com-
pound biosynthetic process (GO: 1901566), retinoid metabolic process (GO: 0001523), and regulation of cation
transmembrane transport (GO: 1904062). Among them, most DEGs were those involved in retinoid metabolic
process (Fig. 5C). In the F3:S7 and F1:S9 groups, the endoplasmic reticulum membrane (GO: 0005789) in the
cellular component category (Fig. 5D) and the positive regulation of response to oxidative stress (GO: 1902884)
in the biological process category (Fig. 5E) were found to be significantly enriched GO terms, respectively. Pro-
teomic analysis of SACCS-adapted H460 cell line by 2D-PAGE revealed 76 protein spots showing differential
expression. In the F5:S5 group, eight protein spots showed > twofold increase in expression, whereas in the F3:S7
group, the expression of nine protein spots was increased and that of eight spots was decreased. Finally, in the
F1:S9 group, expression of five proteins was increased and expression of 48 proteins was decreased. We identi-
fied the amino acid sequences of the five increased spots and the 30 decreased protein spots showing a change in
Scientific Reports | (2021) 11:4906 | https://doi.org/10.1038/s41598-021-84558-2 5
Vol.:(0123456789)www.nature.com/scientificreports/
Figure 6. Proteomic analysis of SACCS-adapted H460 cell line. Bar diagrammatic representations of the
differentially expressed proteins (p ≤ 0.05) identified in 2-DE are displayed. Spots were detected and quantified
using PDQuest software (ver. 7.0, Bio-Rad, Hercules, USA), https://www.bio-rad.com/ko-kr/product/pdque
st-2-d-analysis-software?ID=966deb78-2656-437f-b7a4-ab0a9bd45c8d.
expression over two-fold compared with that in the control. The relative expression changes of 30 proteins with
more than two-fold decrease in expression were not significantly different in all proteins except for five proteins
in the F5:S5 and F3:S7 groups, and proteins were reduced or not expressed in only F1:S9 group. Of the five pro-
teins whose expression was more than twice the expression of that in F10:S0, four protein spots were identified
as superoxide dismutase protein and the remaining one was identified as ubiquitin. Hence, as the ratio of SACCS
increased, the expression of antioxidant enzyme superoxide dismutase tended to increase (Fig. 6).
Discussion
In this study, the effects of SACCS as a serum substitute on cell culture were systematically evaluated by studying
cell proliferation, morphology, overall survival rate, cell cycle, apoptosis, and carrying out proteomic and tran-
scriptomic analysis. First, a contamination test was performed to verify the physicochemical properties of SACCS
and the reliability of the cell culture test. Contamination by bacteria, fungi, and mycoplasma adversely affects
cell line growth, cell properties, and cell functions, and may cause changes in the experimental results26,27.
Through the contamination test of SACCS, factors that could affect the cell culture test results were minimized.
In addition, components and physicochemical factors of SACCS were analyzed to compare similarities with FBS.
Osmotic and pH imbalances can cause cell dehydration, ion accumulation, and nutritional imbalance, which
can lead to cell damage. However, SACCS and FBS showed no significant difference in salinity and pH and
showed similar characteristics (Fig. 1G) that facilitate the ideal culture of c ells28. The composition and content
of FBS is not completely known; it is known to be generally composed of proteins, polypeptides, hormones,
metabolites, various nutrients, and inorganic s ubstances29. SACCS was found to be mainly composed of proteins
and minerals, which have a positive effect on cell g rowth30. Accumulation of various heavy metals such as lead,
cadmium, and mercury in the marine microalgal resources has been associated with a decrease in cell viability31,32.
However, SACCS exhibited very low levels of lead, cadmium, and mercury (Table 1). Cell number and viability
were measured to analyze the effect of SACCS on the cell growth in accordance with the FBS reduction. In the
F3:S7 group, there were no significant differences in cell number, cell viability, and morphological appearances
of animal cells. However, in the F1:S9 group, cell growth was significantly decreased from the 9th passage
onwards, and morphological changes were also detected. In the F5:S5 group, cell numbers and viability were
increased significantly compared with that in the control (Fig. 3B,C). In addition, as a result of applying SACCS
to HeLa cell—a cervical cancer cell, and T24 cell—a bladder cancer cell, the number of cells and cell viability
were similar compared to the control group despite a replacement of up to 50–70% (Figs. S2 and S3). Therefore,
the possibility that the efficacy of SACCS was applied not only to H460 but also to various cell lines was con-
firmed. In particular, the number of cells increased up to 20% compared to when only FBS was reduced without
treatment with SACCS (Fig. S4). Therefore, SACCS exhibited a positive effect on cell proliferation. Based on
these results, the cell cycle phases were analyzed in accordance with the decrease in FBS concentration. It is
generally known that the cell cycle is arrested in the G1 phase as the FBS concentration d ecreases33,34. However,
the SACCS-treated group did not show a G1 phase arrest and it was confirmed that the G0/G1 phase was normally
operated35–37. When the concentration of FBS was reduced to 3%, there was no significant difference in the cell
Scientific Reports | (2021) 11:4906 | https://doi.org/10.1038/s41598-021-84558-2 6
Vol:.(1234567890)www.nature.com/scientificreports/
cycle. However, the G2/M phase increased when the concentration of FBS was reduced to 1% (Fig. 4A). Nonethe-
less, the inhibition of the cell cycle at G 2/M phase is not adequate to cause cell growth a rrest35–37. Moreover,
apoptotic cells were almost non-existent, as sub-G1 phase was not identified in any of the experimental groups38.
The cell cycle of F5:S5 group was similar to that of the control group, and S phase cell aggregation suggested that
SACCS could increase the potential of cell proliferation39,40. Cell death is usually classified as necrosis and apop-
tosis. Recently, cell death through autophagy has also been reported41,42. Flow cytometry analysis of cell death
in this study revealed a dramatic effect of decreasing FBS concentration. As a result of addition of SACCS instead
of FBS, apoptosis was not observed in any of the experimental groups. Necrosis increased as the concentration
of FBS decreased, and 47.9% of necrosis occurred at 1% FBS (Fig. 4B). However, it is known that autophagy
occurs more frequently than necrosis during nutrient deficiency caused due to the lack of FBS or other
nutrients43–45. Autophagy is similar to cell death in that it involves pyknosis and karyorrhexis, or to necrosis
characterized by early disruption of the cell membrane, and is commonly known to occur before a poptosis41,43–45.
Therefore, the cell death mechanism was identified with proteomic analysis, and it was confirmed that ubiquitin
was expressed when the FBS concentration was reduced to 3% or less (Fig. 6). Ubiquitin is a regulatory protein
in the ubiquitin–proteasome pathway, and it acts on cyclins, cyclin-dependent kinase inhibitors, transcription
factors, cell surface receptors, antigenic peptides, and o ncoproteins46–48. In addition, it is known to regulate
important functions in damaged cells such as cell cycle, gene expression, signal transduction, cell division, cell
death, immune, and inflammatory r esponses46–48. Proteins targeted by ubiquitin for degradation are first poly-
ubiquitinylated, which are then recognized and degraded by the 26S proteasome complex; ubiquitin consists of
a process that was free and reused, or that was cell degradation via the lysosomal/vacuolar s ystem46–48. Therefore,
ubiquitin accumulation is known to mediate autophagy as one of the mechanisms of cell death, and autophagy
is known to be induced by FBS reduction. In the current study, we verified that cell death occurred due to
autophagy because of decreased FBS. Furthermore, GO enrichment analysis confirmed that genes associated
with the positive regulation of response to oxidative stress (GO: 1902884) in the biological process category was
significantly higher in cells in the F1:S9 group (Fig. 5E). The effect of SACCS on the cells was induced by mini-
mizing the FBS concentration, and it was confirmed that SACCS has a significant effect on the expression related
to antioxidant function. Especially, the results of proteomic analysis confirmed that superoxide dismutase (SOD)
was significantly increased with increasing concentration of SACCS, suggesting suggests that SACCS can induce
cells to adapt to oxidative stress49,50. In addition, the F5:S5 group showed up-regulation of various genes in the
biological process category, and most DEGs were involved in the retinoid metabolic process. Therefore, SACCS
is thought to induce cell proliferation by the retinoid metabolic process mechanism51,52. In particular, it was
confirmed that cell proliferation was enhanced upon treatment with 5% SACCS. The cell differentiation and
antioxidant effects of these SACCS can be supported by various biological activity results using S. maxima.
Several studies have reported that S. maxima affected the prevention of cardiomyoblasts in H9c2 cells, and
protection of hepatic damage in a rat model53,54. Their effectiveness was based on strong antioxidants and various
health care effects were found to be very similar to this s tudy55,56.Therefore, SACCS was thought to have a syn-
ergistic effect on cell growth and proliferation, indicating new possibilities for FBS replacement. Further research
is required to study the enhancement of cell growth using pretreatment methods and evaluation of the natural
products included in SACCS. These are methods proposed to address challenges related to animal-derived FBS.
From an economic perspective, the SACCS can be an economic alternative to other FBS alternatives because it
was used without a complicated production process. In particular, it is expected to have a direct economic
advantage as it reduces the use of FBS, the highest cost in cell experiments. It can also play an important role as
an FBS-substitute by minimizing the environmental and social disadvantage of existing FBS extracted from
animals. Therefore, it is suggested that SACCS can provide the energy source required for cell growth, prolifera-
tion, and immune activity without various growth factors provided by conventional serum-free media sources.
In conclusion, our results demonstrated the possibility of using edible cyanobacterium extract as a substitute for
animal serum (FBS).
Methods
Culture and extraction of S. maxima. Marine Spirulina maxima that has been originally cultivated in
Korea Institute of Ocean Science & Technology (Jeju, Korea) and cultivated in vertical rounded-200 L-photobi-
oreactor containing SOT medium with continuous aeration19,57,58. Cultures were grown at 25 °C under a 12:12-h
light/dark photoperiod. Cells were harvested by centrifugation at 9000 rpm for 20 min (Thermo Fisher Scien-
tific, Massachusetts, USA) and then lyophilized and stored at − 50 °C (Operon, Gimpo, South Korea)57.
Dried S. maxima powder was dissolved in distilled water (DW) at 1% (1×) and 0.5% (0.5×) (w/v), sonicated
(Fig. 1A) and subjected to high temperature and pressure treatment (Fig. 1B) to disrupt the cells. The sample
was centrifuged (Labogene, Daejeon, South Korea) at 9000 rpm for 20 min (Fig. 1C) and filtered through a
1-μm Whatman No. 1 filter paper (Whatman, Maidstone, England) (Fig. 1D). To separate the micro residues,
the supernatant was centrifuged (Beckman Coulter, Brea, USA) at 30,000 rpm for 20 min (Fig. 1E) and filtered
through a 0.2-μm filter to remove bacteria, fungi, and mycoplasma (Fig. 1F). The solutions [1% and 0.5% spirulina
animal cell culture solution (SACCS)] were stored at − 20 °C until use. Under this process, the yields of SACCS
extracted from Spirulina maxima was obtained by approximately 10%.
Physicochemical analysis. Salinity was measured using a portable YK-31SA salt meter (Lutron, Taipei,
Taiwan) and pH was measured using SevenCompact pH/Ion S220 pH meter (Mettler Toledo, Ohio, USA)59. We
compared the pH and salinity of FBS and SACCS as well as 10% of their mixture in MEM.
Scientific Reports | (2021) 11:4906 | https://doi.org/10.1038/s41598-021-84558-2 7
Vol.:(0123456789)www.nature.com/scientificreports/
Microbial contamination assay. The prepared SACCS was tested for contamination using e-Myco poly-
merase chain reaction (PCR) detection kit (iNtRON Biotechnology, Seongnam, South Korea) and DiaPlexC
PCR kit (AGBIO, Seoul, South Korea). PCR (Takara, Kusatsu, Japan) was performed with positive and negative
controls provided in the kits, followed by electrophoresis using 1.5% agarose gel60.
Component analysis. Normal components were analyzed using Korean Food Standards Codex (2015) and
AOAC methods. Crude fat and protein were detected by ether extraction and Kjeldahl methods61, respectively.
For lead and cadmium analysis, the specimen was taken out of the crucible, dried, and carbonized. After heating
at 450–550 °C, the ash was wetted with water, followed by addition of 2–4 mL of hydrochloric acid and drying
in an aqueous solution. Nitric acid (4%) was added to dissolve it by heating. Following filtration, the solution
was adjusted to 20 mL and used as the test solution. Lead and cadmium standard solutions, test solutions, and
blank were injected into ICP-OES (Varian, Palo Alto, USA) and analyzed. The standard solution was prepared
by diluting a 1000 mg/L reference material with 4% nitric acid to prepare a 100 mg/L stock solution, which was
then diluted with 4% nitric acid to prepare standard solutions of different concentrations. For inorganic analysis,
1 g of sample was taken in a container, carbonized, and heated at 550℃ for several hours, until white or off-white
ash was obtained. The ash was sequentially decomposed using hydrochloric acid, diluted ten-fold, filtered, and
quantified using an ICP analyzer (Optima 8300, Perkin Elmer, Waltham, USA)62.
Cells, medium, and culture conditions. The human lung carcinoma cell line H460 was purchased from
Korean cell line bank (Seoul, South Korea) and grown in RPMI 1640 medium (Gibco, Grand Island, USA)
containing 10% FBS at 37 °C in 5% CO2. FBS100%: SACCS0% (F10:S0) solution containing only FBS was used
as the control. FBS and SACCS were added into the medium at various mixing volume ratios (%, v/v): FBS50%:
SACCS50% (F5:S5), FBS30%: SACCS70% (F3:S7), and FBS10%: SACCS90% (F1:S9). Each mixture was added
to the cell culture medium at a 10% ratio.
Cytotoxicity test. H460 cells (3.4 × 10⁴ cells/mL) were seeded in triplicate 96-well plates and treated with
DW, FBS, 0.5×, 1×, 2×, and 3× SACCS, for 72 h. Thereafter, 10 μL WST solution (Daeillab, Seoul, South Korea)
was added and cells were incubated for 3 h at 37 °C. Absorbance was recorded at 450 nm using an ELISA plate
reader (Biotek, Winooski, USA).
Cell proliferation assay. Cells were cultured in triplicate in experimental media with different F:S volume
ratios, with 3 mL medium per 60-mm (ø) dish. After 72 h of growth, cells were counted and subcultured into
new dishes. A total of 10 passages of such 72-h interval subculture, each in experimental media with different F:S
volume ratios, were performed for the cell lines. Cell samples (20 μL) were pipetted onto a Nexcelom disposable
counting chamber (Nexcelom Bioscience, LLC, USA). Total cell number was counted using the automated Cel-
lometer Mini (Nexcelom Bioscience)63. Cellular morphology was analyzed using an inverted light microscope
(Nikon, Tokyo, Japan).
WST assay. For analyzing cell viability, H460 (3.4 × 10⁴ cells/mL) cells cultured in 10th generation in
SACCS-containing media were seeded in 96-well plates. After 24, 48, and 72 h, absorbance was measured at
450 nm using a spectrophotometer with WST reagent64.
Cell cycle analysis. Cell cycles of H460 cells cultured in SACCS and FBS were analyzed using CycleTEST
PLUS DNA Reagent Kit (Becton Dickinson, CA, USA). Cells were cultured for 10 passages in a cell culture
medium mixed with different F:S volume ratios (%, v/v) and seeded onto dishes at 2 × 10⁵ cells/mL and washed
with PBS the following day. Cells were removed by treatment with trypsin–EDTA (Gibco) and centrifuged to
remove the supernatant. Trypsin buffer was added to digest recovered cells. After 10 min, trypsin inhibitor and
RNase buffer were added to degrade RNA and cells were stained with propidium iodide (PI) (selective staining
of nuclear DNA) solution at 4℃ for 10 min. Cells were analyzed identically using a flow cytometer (BD bio-
sciences, San Diego, USA)65.
Apoptosis assay. H460 cells from each of the ten passages were seeded at 2 × 10⁵ cells/mL. The culture solu-
tion was removed after washing twice with PBS, and cells were centrifuged and adjusted to a density of 1 × 10⁶
cells/mL using a binding buffer. Annexin V-FITC and PI (5 µL each) were added to 100 μL of the solution. After
staining at 25℃ for 15 min, 400 μL binding buffer was added and the degree of apoptosis was measured using a
flow cytometer (BD biosciences)66.
Transcriptomic analysis. Total RNA was extracted from cells using the RNeasy Mini kit (Qiagen, USA).
Isolated RNA was stored at − 80 °C until further use. All RNA sequencing and alignment procedures were con-
ducted by ChunLab (Seoul, South Korea). Libraries for Illumina sequencing were prepared using the TruSeq
Stranded mRNA Sample Prep kit (Illumina, USA). RNA sequencing was performed on the Illumina HiSeq 2500
platform using paired-end 100-bp sequencing.
The sequence for the reference genome was retrieved from the NCBI database. Quality-filtered reads were
aligned to the reference genome sequence using Bowtie2. The sequence data were normalized by Relative Log
Expression method. Visualization of mapping results and analysis of differentially expressed genes (DEGs) were
performed using the CLRNASeq program (ChunLab). Gene Ontology (GO) term enrichment was analyzed
using GOrilla. Gorilla is publicly available as a web-based application at: http://cbl-gorilla.cs.technion.ac.il67,68.
Scientific Reports | (2021) 11:4906 | https://doi.org/10.1038/s41598-021-84558-2 8
Vol:.(1234567890)www.nature.com/scientificreports/
Proteomic analysis. The lysis solution constituting 7 M urea, 2 M thiourea, 4% (w/v) 3-[(3-cholamido-
propy) dimethylammoniol]-1-propane-sulfonate (CHAPS), 1% (w/v) dithiothreitol, 2% (v/v) pharmalyte, and
1 mM benzamidine was added to the sample. For protein extraction, vortexing was performed for 1 h, and the
supernatant after centrifugation at 25 °C and 12,000 rpm for 1 h was used for two-dimensional electrophoresis.
Protein concentration was then measured69.
For primary isoelectric focusing (IEF), immobilized pH gradient (IPG) strips were placed in the reswelling
tray with 7 M urea, 2 M thiourea, 2% CHAPS, and 1% dithiothreitol solution at room temperature for 12–16 h.
IEF was performed at 20 °C using a Multipore II system (Amersham Biosciences, Little Chalfont, England).
The conditions were set such that 3 h was required to reach 3500 V from 150 V, followed by 26 h at 3500 V, and
finally to 96 kVh. IPG strips were incubated with equilibration buffer (50 mM Tris–Cl, pH 6.8, 6 M urea, 2%
SDS, 30% glycerol) containing 1% DTT for 10 min before secondary SDS-PAGE, and then incubated for 10 min
with equilibration buffer containing iodoacetamide. Equilibration-completed strips were arrayed on SDS-PAGE
gels (20 × 24 cm, 10–16%) and developed to a final 1.7 kVh at 20 °C using a Hoefer DALT 2D system (Amersham
Biosciences). The gel was visualized after 2D electrophoresis using colloidal Coomassie brilliant blue (CBB)
staining according to a previous method70; glutaraldehyde treatment was omitted for protein identification
by mass spectrometry. Colloidal CBB-stained 2D gels were scanned using a DuoScan T1200 scanner (AGFA,
Mortsel, Belgium).
Quantitative analysis of protein spots from scanned images was performed using PDQuest software (ver-
sion 7.0, Bio-Rad, Hercules, USA). Quantity of each spot was normalized to the intensity of the total valid spots
and protein spots showing more than two-fold significant changes in expression compared to the control were
selected.
Statistical analysis. All results are represented as the mean ± standard deviation. Differences between
groups were assessed by two-way ANOVA with Dunnett’s post-test using GraphPad Prism (ver. 8.1.1, San Diego,
USA). A p value < 0.05 was considered significant.
Received: 22 October 2020; Accepted: 15 February 2021
References
1. Maurer, H. R. Towards chemically-defined, serum-free media for mammalian cell culture. In: Animal Cell Culture a practical
approach. (ed Freshney, R. I.) 13–31 (IRL Press, Oxford, 1986).
2. Klein, R. & Dumble, L. Transmission of Creutzfeldt-Jakob disease by blood transfusion. The Lancet 341, 768 (1993).
3. Jochems, C. E., Van Der Valk, J. B., Stafleu, F. R. & Baumans, V. The use of fetal bovine serum: ethical or scientific problem?. ATLA-
NOTTINGHAM 30, 219–228 (2002).
4. Eloit, M. Risks of virus transmission associated with animal sera or substitutes and methods of control. Dev. Biol. Stand. 99, 9–16
(1999).
5. Shah, G. Why do we still use serum in the production of biopharmaceuticals?. Dev. Biol. Stand. 99, 17–22 (1999).
6. Wessman, S. & Levings, R. Benefits and risks due to animal serum used in cell culture production. Dev. Biol. Stand. 99, 3–8 (1999).
7. Gstraunthaler, G. Alternatives to the use of fetal bovine serum: Serum-free cell culture. ALTEX-Altern. Anim. Exp. 20, 275–281
(2003).
8. Fang, C.-Y., Wu, C.-C., Fang, C.-L., Chen, W.-Y. & Chen, C.-L. Long-term growth comparison studies of FBS and FBS alternatives
in six head and neck cell lines. PLoS ONE 12, e0178960 (2017).
9. Zamansky, G. B., Arundel, C., Nagasawa, H. & Little, J. B. Adaptation of human diploid fibroblasts in vitro to serum from different
sources. J. Cell Sci. 61, 289–297 (1983).
10. Paranjape, S. Goat serum: an alternative to fetal bovine serum in biomedical research (2004).
11. Franke, J., Abs, V., Zizzadoro, C. & Abraham, G. Comparative study of the effects of fetal bovine serum versus horse serum on
growth and differentiation of primary equine bronchial fibroblasts. BMC Vet. Res. 10, 119 (2014).
12. Ziegler, A. et al. Equine dendritic cells generated with horse serum have enhanced functionality in comparison to dendritic cells
generated with fetal bovine serum. BMC Vet. Res. 12, 254 (2016).
13. Ciferri, O. Spirulina, the edible microorganism. Microbiol. Rev. 47, 551–578 (1983).
14. Gershwin, M. E. & Belay, A. Spirulina in Human Nutrition and Health (CRC Press, Boca Raton, 2007).
15. Venkataraman, L. V. Spirulina platensis (Arthrospira): physiology, cell biology and biotechnologym, edited by Avigad Vonshak.
J. Appl. Phycol. 9, 295–296. https://doi.org/10.1023/A:1007911009912 (1997).
16. Belay, A., Ota, Y., Miyakawa, K. & Shimamatsu, H. Current knowledge on potential health benefits of Spirulina. J. Appl. Phycol. 5,
235–241. https://doi.org/10.1007/BF00004024 (1993).
17. Blinkova, L., Gorobets, O. & Baturo, A. Biological activity of Spirulina Zh Mikrobiol Epidemiol Immunobiol. 2001 Mar-Apr;(2):
114–8. Review. In this review information of Spirulina platensis (SP), a blue-green alga (photosynthesizing cyanobacterium) having
diverse biological activity is presented. Due to high content of highly. Zh Mikrobiol. Epidemiol. Immunobiol. 2, 114–118 (2001).
18. Khan, Z., Bhadouria, P. & Bisen, P. Nutritional and therapeutic potential of Spirulina. Curr. Pharm. Biotechnol. 6, 373–379 (2005).
19. Oh, S.-H., Ahn, J., Kang, D.-H. & Lee, H.-Y. The effect of ultrasonificated extracts of Spirulina maxima on the anticancer activity.
Mar. Biotechnol. 13, 205–214 (2011).
20. Gutiérrez-Rebolledo, G. A. et al. Antioxidant effect of Spirulina (Arthrospira) maxima on chronic inflammation induced by
Freund’s complete adjuvant in rats. J. Med. Food 18, 865–871 (2015).
21. Ponce-Canchihuamán, J. C., Pérez-Méndez, O., Hernández-Muñoz, R., Torres-Durán, P. V. & Juárez-Oropeza, M. A. Protective
effects of Spirulina maxima on hyperlipidemia and oxidative-stress induced by lead acetate in the liver and kidney. Lipids Health
Dis. 9, 35 (2010).
22. Lee, J. et al. Spirulina extract enhanced a protective effect in type 1 diabetes by anti-apoptosis and anti-ROS production. Nutrients
9, 1363 (2017).
23. Koh, E.-J. et al. Spirulina maxima extract prevents neurotoxicity via promoting activation of BDNF/CREB signaling pathways in
neuronal cells and mice. Molecules 22, 1363 (2017).
Scientific Reports | (2021) 11:4906 | https://doi.org/10.1038/s41598-021-84558-2 9
Vol.:(0123456789)www.nature.com/scientificreports/
24. De Oliveira, M., Monteiro, M., Robbs, P. & Leite, S. Growth and chemical composition of Spirulina maxima and Spirulina platensis
biomass at different temperatures. Aquacult. Int. 7, 261–275 (1999).
25. Schafer, K. The cell cycle: A review. Vet. Pathol. 35, 461–478 (1998).
26. Drexler, H. G. & Uphoff, C. C. Mycoplasma contamination of cell cultures: Incidence, sources, effects, detection, elimination,
prevention. Cytotechnology 39, 75–90 (2002).
27. Folmsbee, M., Howard, G. & McAlister, M. Nutritional effects of culture media on mycoplasma cell size and removal by filtration.
Biologicals 38, 214–217 (2010).
28. Yi, X., Sun, X. & Zhang, Y. Effects of osmotic pressure on recombinant BHK cell growth and von willebrand factor (vWF) expres-
sion. Process Biochem. 39, 1817–1823 (2004).
29. Van der Valk, J. et al. Optimization of chemically defined cell culture media–replacing fetal bovine serum in mammalian in vitro
methods. Toxicol. In Vitro 24, 1053–1063 (2010).
30. Rao, M. et al. Effects of vitamin/mineral supplementation on the proliferation of esophageal squamous epithelium in Linxian
China. Cancer Epidemiolo. Prevent. Biomark. 3, 277–279 (1994).
31. Fischer, A. B. & Škreb, Y. In vitro toxicology of heavy metals using mammalian cells: an overview of collaborative research data.
Arhiv za Higijenu Rada i Toksikologiju 52, 333–354 (2001).
32. Rosko, J. J. & Rachlin, J. W. The effect of cadium, copper, mercury, zinc and lead on cell division, growth, and chlorophyll a content
of the chlorophyte Chlorella vulgaris. Bull. Torrey Bot. Club 104, 226–233 (1977).
33. Khammanit, R., Chantakru, S., Kitiyanant, Y. & Saikhun, J. Effect of serum starvation and chemical inhibitors on cell cycle syn-
chronization of canine dermal fibroblasts. Theriogenology 70, 27–34 (2008).
34. Rashid, M. U. & Coombs, K. M. Serum-reduced media impacts on cell viability and protein expression in human lung epithelial
cells. J. Cell. Physiol. 234, 7718–7724 (2019).
35. Wang, Z. et al. Methylseleninic acid inhibits microvascular endothelial G1 cell cycle progression and decreases tumor microvessel
density. Int. J. Cancer 122, 15–24 (2008).
36. Kaeck, M. et al. Differential induction of growth arrest inducible genes by selenium compounds. Biochem. Pharmacol. 53, 921–926
(1997).
37. Sinha, R., Said, T. & Medina, D. Organic and inorganic selenium compounds inhibit mouse mammary cell growth in vitro by
different cellular pathways. Cancer Lett. 107, 277–284 (1996).
38. Shu, C.-H., Yang, W., Shih, Y.-L., Kuo, M.-L. & Huang, T.-S. Cell cycle G2/M arrest and activation of cyclin-dependent kinases
associated with low-dose paclitaxel-induced sub-G1 apoptosis. Apoptosis 2, 463–470 (1997).
39. Wang, Y. et al. Embryonic stem cell–specific microRNAs regulate the G1-S transition and promote rapid proliferation. Nat. Genet.
40, 1478 (2008).
40. Krueger, S. A. & Wilson, G. D. Cancer Cell Culture 359–370 (Springer, Berlin, 2011).
41. Marino, G., Niso-Santano, M., Baehrecke, E. H. & Kroemer, G. Self-consumption: the interplay of autophagy and apoptosis. Nat.
Rev. Mol. Cell Biol. 15, 81–94 (2014).
42. He, C. & Klionsky, D. J. Regulation mechanisms and signaling pathways of autophagy. Ann. Rev. Genet. 43, 67–93 (2009).
43. Huang, Y. et al. Serum starvation-induces down-regulation of Bcl-2/Bax confers apoptosis in tongue coating-related cells in vitro.
Mol. Med. Rep. 17, 5057–5064 (2018).
44. Kristensen, A. R. et al. Ordered organelle degradation during starvation-induced autophagy. Mol. Cell. Proteom. 7, 2419–2428
(2008).
45. Sandag, Z. et al. Inhibitory role of TRIP-Br 1/XIAP in necroptosis under nutrient/serum starvation. Mol. Cells 43, 236 (2020).
46. Grumati, P. & Dikic, I. Ubiquitin signaling and autophagy. J. Biol. Chem. 293, 5404–5413 (2018).
47. Ciechanover, A. The ubiquitin–proteasome pathway: On protein death and cell life. EMBO J. 17, 7151–7160 (1998).
48. Kornitzer, D. & Ciechanover, A. Modes of regulation of ubiquitin-mediated protein degradation. J. Cell. Physiol. 182, 1–11 (2000).
49. Chu, W.-L., Lim, Y.-W., Radhakrishnan, A. K. & Lim, P.-E. Protective effect of aqueous extract from Spirulina platensis against
cell death induced by free radicals. BMC Complem. Altern. Med. 10, 53 (2010).
50. Alevriadou, B. R., Shanmughapriya, S., Patel, A., Stathopulos, P. B. & Madesh, M. Mitochondrial Ca2+ transport in the endothelium:
Regulation by ions, redox signalling and mechanical forces. J. R. Soc. Interface 14, 20170672 (2017).
51. Blomhoff, R. & Blomhoff, H. K. Overview of retinoid metabolism and function. J. Neurobiol. 66, 606–630 (2006).
52. Gudas, L. J. Retinoids, retinoid-responsive genes, cell differentiation, and cancer. Cell Growth Differ. 3, 655–662 (1992).
53. Jadaun, P., Yadav, D. & Bisen, P. S. Spirulina platensis prevents high glucose-induced oxidative stress mitochondrial damage medi-
ated apoptosis in cardiomyoblasts. Cytotechnology 70, 523–536 (2018).
54. Jatav, S. K. et al. Spirulina maxima protects liver from Isoniazid and Rifampicin drug toxicity. J. Evid. Based Complem. Altern. Med.
19, 189–194 (2014).
55. Jarouliya, U., Anish, Z. J., Kumar, P., Bisen, P. & Prasad, G. Alleviation of metabolic abnormalities induced by excessive fructose
administration in Wistar rats by Spirulina maxima. Indian J Med. Res. 135, 422 (2012).
56. Kulshreshtha, A., Jarouliya, U., Bhadauriya, P., Prasad, G. & Bisen, P. Spirulina in health care management. Curr. Pharm. Biotechnol.
9, 400–405 (2008).
57. Choi, W. Y., Kang, D. H. & Lee, H. Y. Enhancement of immune activation activities of Spirulina maxima grown in deep-sea water.
Int. J. Mol. Sci. 14, 12205–12221 (2013).
58. Kim, T. et al. Cultivating spirulina maxima: Innovative approaches. Cyanobacteria, 61 (2018).
59. Boström, M., Craig, V. S., Albion, R., Williams, D. R. & Ninham, B. W. Hofmeister effects in pH measurements: role of added salt
and co-ions. J. Phys. Chem. B 107, 2875–2878 (2003).
60. Ashbolt, N. J. Microbial contamination of drinking water and disease outcomes in developing regions. Toxicology 198, 229–238
(2004).
61. Bradstreet, R. B. Kjeldahl method for organic nitrogen. Anal. Chem. 26, 185–187 (1954).
62. Al-Dhabi, N. A. Heavy metal analysis in commercial Spirulina products for human consumption. Saudi J. Biol. Sci. 20, 383–388
(2013).
63. Gordobil, O. et al. Potential use of kraft and organosolv lignins as a natural additive for healthcare products. RSC Adv. 8, 24525–
24533 (2018).
64. Peskin, A. V. & Winterbourn, C. C. A microtiter plate assay for superoxide dismutase using a water-soluble tetrazolium salt (WST-
1). Clin. Chim. Acta 293, 157–166 (2000).
65. Hartwell, L. H. & Kastan, M. B. Cell cycle control and cancer. Science 266, 1821–1828 (1994).
66. Lowe, S. W. & Lin, A. W. Apoptosis in cancer. Carcinogenesis 21, 485–495 (2000).
67. Eden, E., Navon, R., Steinfeld, I., Lipson, D. & Yakhini, Z. GOrilla: a tool for discovery and visualization of enriched GO terms in
ranked gene lists. BMC Bioinform. 10, 1–7 (2009).
68. Eden, E., Lipson, D., Yogev, S. & Yakhini, Z. Discovering motifs in ranked lists of DNA sequences. PLoS Comput. Biol. 3, e39 (2007).
69. Bradford, M. M. A rapid and sensitive method for the quantitation of microgram quantities of protein utilizing the principle of
protein-dye binding. Anal. Biochem. 72, 248–254 (1976).
70. Oakley, B. R., Kirsch, D. R. & Morris, N. R. A simplified ultrasensitive silver stain for detecting proteins in polyacrylamide gels.
Anal. Biochem. 105, 361–363 (1980).
Scientific Reports | (2021) 11:4906 | https://doi.org/10.1038/s41598-021-84558-2 10
Vol:.(1234567890)www.nature.com/scientificreports/
Acknowledgements
This research was supported by the Basic Core Technology Development Program for the Oceans and the Polar
Regions of the National Research Foundation (NRF) funded by the Ministry of Science and ICT (PN68281),
and was partly supported by the research program of KIOST (PE99822).
Author contributions
Y.J., G.-H.P., S.-J.L. and D.-H.K. were involved in planning and designing the study. Y.J. and W.-Y.C. performed
experiments and contributed equally to this work. All authors were involved in the evaluation of the data. Y.J.
and W.-Y.C. drafted the first version of the manuscript and all the authors contributed to the revision of the main
text, prepared figures, and conducted all the assays. D.-H.K. supervised the overall process for the completion
of this study. All authors have reviewed the manuscript.
Competing interests
The authors declare no competing interests.
Additional information
Supplementary Information The online version contains supplementary material available at https://doi.
org/10.1038/s41598-021-84558-2.
Correspondence and requests for materials should be addressed to D.-H.K.
Reprints and permissions information is available at www.nature.com/reprints.
Publisher’s note Springer Nature remains neutral with regard to jurisdictional claims in published maps and
institutional affiliations.
Open Access This article is licensed under a Creative Commons Attribution 4.0 International
License, which permits use, sharing, adaptation, distribution and reproduction in any medium or
format, as long as you give appropriate credit to the original author(s) and the source, provide a link to the
Creative Commons licence, and indicate if changes were made. The images or other third party material in this
article are included in the article’s Creative Commons licence, unless indicated otherwise in a credit line to the
material. If material is not included in the article’s Creative Commons licence and your intended use is not
permitted by statutory regulation or exceeds the permitted use, you will need to obtain permission directly from
the copyright holder. To view a copy of this licence, visit http://creativecommons.org/licenses/by/4.0/.
© The Author(s) 2021
Scientific Reports | (2021) 11:4906 | https://doi.org/10.1038/s41598-021-84558-2 11
Vol.:(0123456789)You can also read