Measurement of black carbon emissions from multiple engine and source types using laser-induced incandescence: sensitivity to laser fluence - Recent
←
→
Page content transcription
If your browser does not render page correctly, please read the page content below
Atmos. Meas. Tech., 15, 241–259, 2022
https://doi.org/10.5194/amt-15-241-2022
© Author(s) 2022. This work is distributed under
the Creative Commons Attribution 4.0 License.

Measurement of black carbon emissions from multiple engine and
source types using laser-induced incandescence:
sensitivity to laser fluence
Ruoyang Yuan1 , Prem Lobo2 , Greg J. Smallwood2 , Mark P. Johnson3 , Matthew C. Parker3 , Daniel Butcher4 , and
Adrian Spencer4
1 Department of Mechanical Engineering, University of Sheffield, Sheffield, S1 3JD, United Kingdom
2 Metrology Research Centre, National Research Council Canada, Ottawa, Ontario, K1A 0R6, Canada
3 Rolls-Royce plc, Derby, DE24 8BJ, United Kingdom
4 Department of Aeronautical and Automotive Engineering, Loughborough University, Loughborough,

LE11 3TU, United Kingdom

Correspondence: Ruoyang Yuan (ruoyang.yuan@sheffield.ac.uk)

Received: 16 July 2021 – Discussion started: 16 August 2021
Revised: 20 November 2021 – Accepted: 22 November 2021 – Published: 19 January 2022

Abstract. A new regulatory standard for non-volatile par-         determine the optimum fluence range as differences were ob-
ticulate matter (nvPM) mass-based emissions from aircraft         served in the laser fluence required between sources and fu-
engines has been adopted by the International Civil Avia-         els. We discuss the measurement merits, variability, and best
tion Organisation. One of the instruments used for the reg-       practices in the real-time quantification of nvPM mass con-
ulatory nvPM mass emissions measurements in aircraft en-          centration using the LII 300 instrument and compare that
gine certification tests is the Artium Technologies LII 300,      with other diagnostic techniques, namely absorption-based
which is based on laser-induced incandescence. The LII 300        methods such as photoacoustic spectroscopy (using a photoa-
response has been shown in some cases to vary with the type       coustic extinctiometer, PAX, and a micro soot sensor, MSS)
of black carbon particle measured. Hence it is important to       and thermal-optical analysis (TOA). Particle size distribu-
identify a suitable black carbon emission source for instru-      tions were also measured using a scanning mobility parti-
ment calibration. In this study, the relationship between the     cle sizer (SMPS). Overall, the LII 300 provides robust and
nvPM emissions produced by different engine sources and           consistent results when compared with the other diagnostic
the response of the LII 300 instrument utilising the auto-        techniques across multiple engine sources and fuels. The re-
compensating laser-induced incandescence (AC-LII) method          sults from this study will inform the development of updated
was investigated. Six different sources were used, including      calibration protocols to ensure repeatable and reproducible
a turboshaft helicopter engine, a diesel generator, an interme-   measurements of nvPM mass emissions from aircraft engines
diate pressure test rig of a single-sector combustor, an aux-     using the LII 300.
iliary power unit gas turbine engine, a medium-sized diesel
engine, and a downsized turbocharged direct-injection gaso-
line engine. Optimum LII 300 laser fluence levels were de-
termined for each source and operating condition evaluated.       Copyright statement. The works published in this journal are
It was found that an optimised laser fluence can be valid for     distributed under the Creative Commons Attribution 4.0 License.
                                                                  This license does not affect the Crown copyright work, which
real-time measurements from a variety of sources, where the
                                                                  is re-usable under the Open Government Licence (OGL). The
mass concentration was independent of laser fluence levels        Creative Commons Attribution 4.0 License and the OGL are
covering the typical operating ranges for the various sources.    interoperable and do not conflict with, reduce, or limit each other.
However, it is important to perform laser fluence sweeps to       The co-authors Prem Lobo and Greg J. Smallwood are employees

Published by Copernicus Publications on behalf of the European Geosciences Union.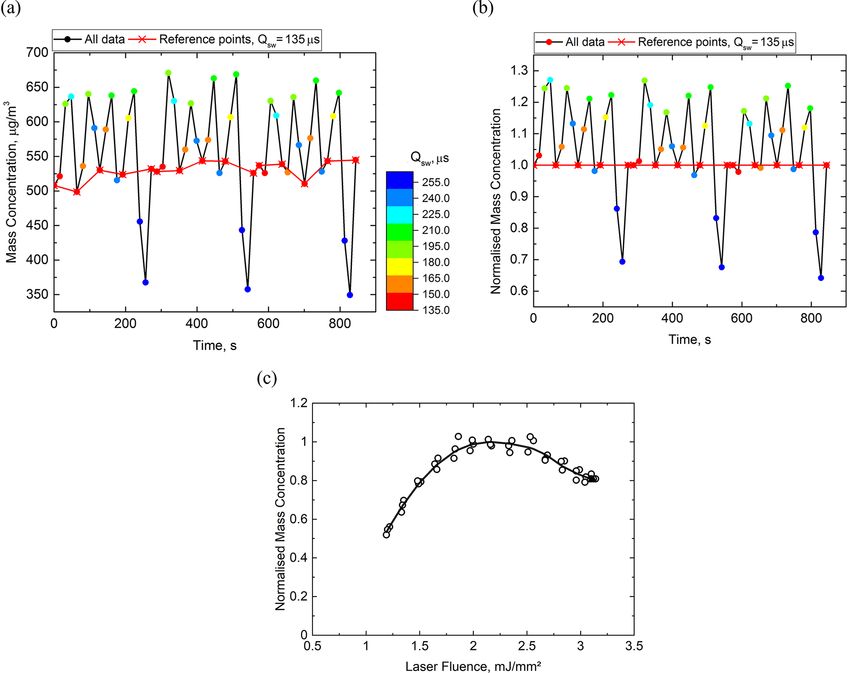
242                                                                  R. Yuan et al.: Measurement of black carbon emissions

of the Canadian Government and therefore claim Crown copyright      ganic carbon (OC) and elemental carbon (EC) aerosols sam-
for the respective contributions.                                   pled on a quartz filter (Baumgardner et al., 2012). The only
                                                                    criteria for the source used for calibrating nvPM mass in-
© Crown copyright 2022.                                             struments is that it be capable of producing an average EC
                                                                    content of the collected mass on the filter of ≥ 80 % (SAE,
                                                                    2018).
1   Introduction                                                       The LII techniques have been shown to be sensitive to
                                                                    different black carbon types, for both continuous-wave laser
Short- and long-term exposure to particulate matter (PM) can        LII (Baumgardner et al., 2012; Gysel et al., 2012; Laborde et
lead to serious health problems such as lung or heart disease       al., 2012) and pulsed laser LII, as used in the LII 300 (Dur-
(AQEQ, 2005). There is increasing emphasis on reducing PM           dina et al., 2016). The relationship between the nvPM emis-
emissions from energy conversion systems, especially for the        sions produced by these different sources and the response
transport sector. The World Health Organisation (WHO) re-           of the LII 300 instruments has not been fully investigated.
ported that up to 50 % of PM emissions in OECD coun-                It is important to identify a suitable nvPM emissions source
tries were caused by road transport, in which diesel traffic        that meets the requirements to provide reliable and robust
was the majority (United Nations Environment Programme              calibration of the LII 300 instrument used in the emissions
World Health Organisation, 2009). In addition to road traf-         certification of aircraft engines.
fic, aviation and shipping are also significant sources of PM          The LII technique has been widely applied in combustion
emissions in the transport sector. Therefore, it is strategically   studies to obtain in situ black carbon characteristics, such
important to limit the exposure to PM from various sources,         as soot volume fraction (Boiarciuc et al., 2006; Choi and
and accurate measurement of PM is a key enabler to achiev-          Jensen, 1998; Liu et al., 2011; Melton, 1984; Quay et al.,
ing this goal and developing low-PM-emission transport so-          1994; Zhang et al., 2019) and primary particle size measure-
lutions.                                                            ments (Axelsson et al., 2000; Boiarciuc et al., 2006; Boies
   The International Civil Aviation Organisation (ICAO)             et al., 2015; Mewes and Seitzman, 1997) from both labo-
Committee on Aviation Environmental Protection has                  ratory flames (Axelsson et al., 2000; Mewes and Seitzman,
adopted new standards and recommended practices limit-              1997; Tian et al., 2017; Zhang et al., 2019) and aircraft en-
ing aircraft engine non-volatile particulate matter (nvPM)          gines (soot concentration: Schäfer et al., 2000; Delhay et al.,
(also referred to as soot or black carbon) number and mass          2009; Black and Johnson, 2010; Petzold et al., 2011; Lobo
emissions to mitigate the impact of aircraft engine emis-           et al., 2015a; soot particle sizes: Boies et al., 2015). Previ-
sions on local air quality (ICAO, 2017). The nvPM refers            ous reviews on LII have provided insight on current chal-
to the particles that exist at the aircraft engine exhaust noz-     lenges, questions associated with this technique (Schulz et
zle exit plane that do not volatilise at temperatures greater       al., 2006), and current model developments (Michelsen et
than 350 ◦ C (ICAO, 2017). A standardised sampling and              al., 2015). Several models of the LII technique have been
measurement methodology for aircraft engine nvPM emis-              reviewed to quantify the soot concentration, primary particle
sions has been developed by the Society of Automotive En-           size, and peak temperature (Eckbreth, 1977; Melton, 1984;
gineers (SAE), which has been detailed in Aerospace Infor-          Roth and Filippov, 1996; Smallwood et al., 2001; Schit-
mation Report (AIR) 6241 (SAE, 2013) and Aerospace Rec-             tkowski et al., 2002; Lehre et al., 2003; Snelling et al., 2004;
ommended Practice (ARP) 6320 (SAE, 2018) and adopted                Kock et al., 2006; Michelsen et al., 2007; Sipkens and Daun,
by ICAO (ICAO, 2017). The SAE and ICAO documents                    2017). These were required because the complex mecha-
also define the performance criteria and calibration proto-         nisms incorporated in the LII model strongly influenced the
cols for the instruments to be used in the standardised mea-        predicted signal magnitudes and time evolution. The signal
surements. Currently, the two instruments that satisfy the          dependence on the laser fluence and in turn the quantification
performance criteria for nvPM mass measurements are the             of soot concentration were highlighted in each model. As the
Artium Technologies LII 300, based on laser-induced in-             laser fluence increases, soot absorbs increasing amounts of
candescence (LII), and the AVL micro soot sensor (MSS),             light energy, resulting in greater particle peak temperature
based on photoacoustic spectroscopy. The standardised sys-          and radiation magnitude. The subsequent decay rate of this
tems for aircraft engine nvPM emissions measurements using          radiation is related to the particle temperature, which in turn
these instruments have been previously evaluated and inter-         is related to the primary particle size. Sublimation can also
compared (Lobo et al., 2015a, 2020).                                occur at excessively high laser fluence levels, characterised
   The instruments used to measure nvPM mass concentra-             by the particle-volume reduction. According to the model by
tion in the exhaust of aircraft engines are calibrated by ref-      Michelsen et al. (2003), the maximum LII signal may level
erence to elemental carbon (EC) content, as determined by           off or be reduced due to this mass loss. Although there are
thermal-optical analysis (TOA) of a diffusion flame com-            differences in the temporal profiles, the various models pro-
bustion aerosol source (Durdina et al., 2016). TOA is an            vide similar results for the relative signal magnitudes as a
industry-accepted method for measuring the mass of both or-         function of laser fluence (Schulz et al., 2006; Sipkens and

Atmos. Meas. Tech., 15, 241–259, 2022                                                 https://doi.org/10.5194/amt-15-241-2022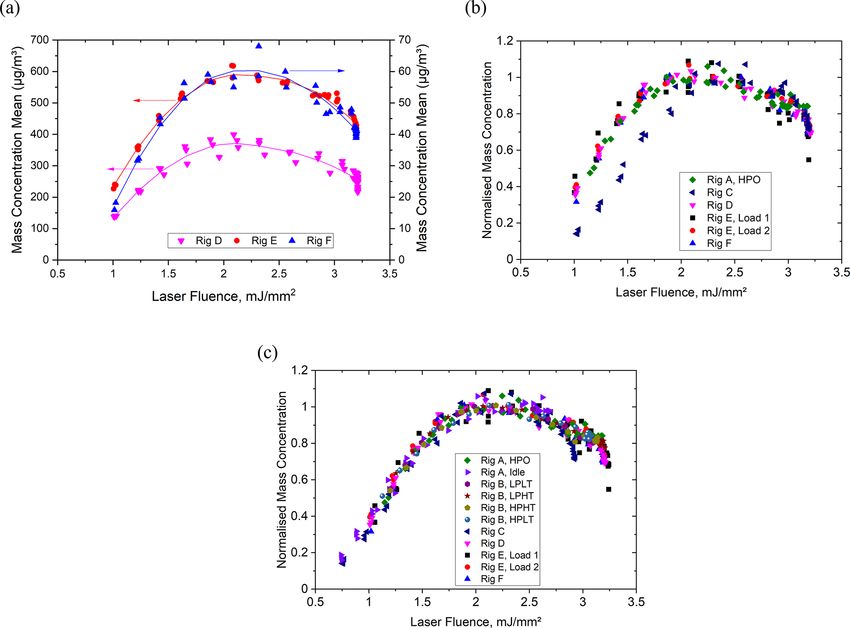
R. Yuan et al.: Measurement of black carbon emissions                                                                          243

Daun, 2017). In conventional LII techniques, the determi-          2     Experimental method
nation of the LII fluence level directly affects the accuracy
of the quantitative measure of the soot concentration. Ad-         2.1     Diagnostics methods
ditionally, further calibration (via laser extinction for exam-
ple) is required to obtain absolute rather than relative mea-      2.1.1    Laser-induced incandescence (LII)
surements. The requirement to accurately represent the tar-
get nvPM absorption and sublimation characteristic during          Laser-induced incandescence (LII) measures the thermal
calibration is an additional complexity associated with the        emission from soot particles heated by a laser to temperatures
LII technique. An improved approach, described in the lit-         in the 2500–4500 K range (Bachalo et al., 2002). Assuming
erature (Snelling et al., 2005; Thomson et al., 2006), utilises    that all the volatile and semi-volatile OC that condenses on
an auto-compensating laser-induced incandescence (AC-LII)          the BC particles will be evaporated promptly at these temper-
method. By measuring LII signals at two separate wave-             atures, the LII signals are directly related to the non-volatile
lengths and temporally resolved decay rates, AC-LII has the        particles, primarily refractory black carbon (rBC), a form of
potential to resolve the soot temperature, volume fraction,        carbon directly related to EC (Baumgardner et al., 2012).
and particle size without the need for additional calibration      The LII 300 instrument calculates a mass concentration from
sources. This method was incorporated into the commercial          the particle emission signal and the temperature determined
LII 300 instrument by Artium Technologies Inc.                     from the signal at two wavelengths (446 and 720 nm) using
   The goal of this study is to assess the suitability of the      two-colour pyrometry. As the optical properties of the parti-
nvPM emissions from a variety of different engine sources          cle may vary from source to source, a correlation factor may
and fuels to be used as a calibration source for the LII 300 in-   need to be applied to this optical determination of the mass
strument for application to the emissions certification of air-    concentration to relate the result to that of EC determined
craft engines. It was important to identify a source that met      from TOA. A multimode pulsed Nd:YAG laser, operating at a
all the requirements, produced a similar response from the         fundamental wavelength of 1064 nm, with a pulse duration of
LII 300 to that obtained from nvPM emissions from an air-          7 ns full width half maximum (FWHM) and a repetition rate
craft gas turbine engine, and was economical and practical to      of 20 Hz was used as the excitation source. The laser beam
operate. In this study, we evaluated a range of different com-     passed through a set of optics and formed into a square cross-
bustion sources that could potentially be used as calibration      section light beam uniformly incident throughout the probe
sources, including a turboshaft helicopter engine (already         volume. The measurement volume is approximate 14.7 mm3 ,
verified as an applicable aircraft engine calibration source for   and the range of fluence levels is typically 0.6–3.2 mJ mm−2 .
LII 300), an intermediate-pressure single-injector combustor          At low laser fluence levels, the peak LII signal intensity
test rig, an auxiliary power unit gas turbine engine, a diesel     rises with the laser fluence as peak particle temperatures in-
generator, a medium-sized diesel engine, and a downsized           crease. As laser fluence is increased, a threshold is reached
turbocharged direct-injection gasoline engine. The turboshaft      where the measured mass concentration becomes indepen-
helicopter engine, intermediate-pressure single-injector com-      dent of laser fluence. This plateau region extends for a range
bustor test rig, and auxiliary power unit gas turbine engine       of increasing laser fluence until a level is reached where soot
were fuelled with kerosene, while the diesel generator and         sublimation begins to dominate. At these very high laser flu-
medium-sized diesel engine burned diesel, and the down-            ences, the mass loss associated with soot sublimation has an
sized turbocharged direct-injection gasoline engine utilised       influence, and a reduction in the mass concentration may be
gasoline. The relationship between the nvPM emissions pro-         observed (Michelsen et al., 2015). Various soot fragments
duced by the different engine sources and the response of the      evaporate from the particle surface when sublimation oc-
LII 300 instrument was investigated. Laser fluence sweeps          curs (Schulz et al., 2006). Models usually assume these to
were performed at different operating conditions, and the          range from C1 to C7 (molecules having one to seven car-
fluence dependence of and variability in the technique for         bon atoms), dependent on the particle temperature (Leider et
field measurements of different nvPM sources were studied.         al., 1973). Additional research is required to understand the
The measurements using the LII 300 were compared with              sublimation loss, which is complicated by uncertainties in
other diagnostic techniques, including thermal-optical analy-      physical parameters of the carbon species, limiting the abil-
sis and photoacoustic spectroscopy, for comparison. The re-        ity of the models to fully predict phenomena in this regime
lationship between laser fluence and nvPM mass concentra-          (Michelsen et al., 2015).
tion measurement is discussed. The results from this study            In the AC-LII technique (Snelling et al., 2005), the soot
will help identify nvPM sources that can be used to calibrate      temperatures are determined by the two-colour pyrometry
the LII 300 instrument and inform the development of up-           method (in the LII 300, narrow bandpass filters centred at
dated calibration protocols to ensure repeatable and repro-        ∼ 446 nm and ∼ 720 nm are used with bandwidths of 40 and
ducible measurements of nvPM mass emissions from aircraft          20 nm, respectively). The peak soot temperature and absolute
engines using the LII 300, including a procedure to optimise       intensity of the LII signal were used to calculate soot volume
the laser fluence.                                                 fraction (fv ). With soot particle material density (ρs ) from

https://doi.org/10.5194/amt-15-241-2022                                                Atmos. Meas. Tech., 15, 241–259, 2022
244                                                                 R. Yuan et al.: Measurement of black carbon emissions

the literature, the mass concentrations of the non-volatile par-   controller. Mass flow controllers were calibrated using a Sen-
ticles, or EC, are obtained from fv × ρs . The primary particle    sidyne Gillibrator-2 bubble flow meter and corrected to the
sizes are determined from the temperature decay rates with         standard temperature and pressure reference conditions of
the assumption that conduction dominates the particle cool-        0 ◦ C and 1 atm. The total volume of sample on the quartz
ing rates for conditions below the sublimation limit (Small-       filters varied from 360 to 1820 L, depending on the load-
wood, 2008).                                                       ing for a particular condition to achieve a target mass den-
   Theoretically, the mass concentration obtained from the         sity of >10 mg cm−2 . The particulate matter (mostly black
two-colour method is valid regardless of the laser fluence ap-     carbon) in the sample flow was captured by the filter. Af-
plied, and a lower laser fluence level might be preferred to       ter collection, a 1 cm × 1 cm punch from the filter was cut
avoid the reduction in particle volume (sublimation) at high       out and mounted in an analyser (Sunset Laboratory OC-EC
laser fluence. Practically, care should be taken with low laser    Aerosol Analyser) to obtain the EC and OC content. The fil-
fluence levels for particles from unknown sources with un-         ter punch was heated in the analyser oven in stages. From 0
known combination of size distributions and morphologies           to 425 s, the sample was surrounded by an inert helium at-
as the assumption of the uniform temperature in the sam-           mosphere, and the heating process drove off any embedded
pling volume could be invalid (Liu et al., 2016). The particles    volatile organic compounds (VOCs) from the sample. The
with various sizes could reach different peak temperatures at      desorbed VOCs were further drawn into a series of catalyst
separate times, which induce uncertainties with the determi-       beds, where they were converted to CO2 and then to methane,
nation of the effective peak particle temperatures and in turn     whose concentration was measured by a flame ionisation de-
uncertainties with the derived mass concentration values. For      tector (FID) to give a measure of the organic carbon fraction
a typical effective soot temperature of 4000 K, a 100 K er-        on the filter punch. As the VOCs are heated, it is possible that
ror (2.5 % of the soot temperature) can lead to 15 % error         some were pyrolysed and converted to char, which stayed on
in the estimated soot volume fraction value (Boiarciuc et al.,     the filter punch, instead of being driven off the surface. The
2006). It is therefore important to operate the LII 300 with       quantity of the char was measured via laser extinction prop-
optimum laser fluence, in a region of laser fluence where the      agated through the sampled filter punch. From 425 to 800 s,
reported mass concentration is relatively independent of flu-      the sample was surrounded by a reactive oxygen–helium at-
ence, to minimise uncertainties. In the current work, laser        mosphere. As the oven heated the sample, the elemental car-
fluence sweep experiments (varying laser fluence from low          bon reacted with the oxygen to form CO2 , which was again
levels to high fluence conditions with all other parameters        converted to methane and measured by the FID. The elemen-
held constant) were performed for each source at different         tal carbon fraction of black carbon on the filter punch was
operating conditions. This was performed to examine the re-        then measured by subtracting the char (which was originally
lationship between the measured mass concentrations and            organic carbon) content from the total. With the two mass
LII fluence levels for multiple sources and to subsequently        values quantified, i.e. the OC mass fraction and the EC mass
determine the optimum laser fluence level for both calibra-        fraction, the total carbon (TC) on the filter punch can be ob-
tion and application to real-time nvPM mass measurements           tained. By multiplying by the stain area of the filter, the total
from aircraft engines.                                             mass of EC, OC, and TC on the entire filter was quantified.
                                                                   Having also measured the total volume of sampled gas, the
2.1.2   Thermal-optical analysis (TOA)                             mass concentration of the EC, OC, and TC was obtained.
                                                                   One uncertainty in the OC quantification from the TOA mea-
TOA measures the mass of both organic carbon (OC) and              surements was the artefact effect caused by the gas-phase
elemental carbon (EC) of the particulate matter sampled on         semi-volatile organic compounds absorbed on the filter (Dur-
a quartz filter mounted in a stainless steel filter holder. This   dina et al., 2016). To correct this artefact, the OC determined
is not a gravimetric measurement where the mass of the ele-        from a secondary filter that contained exclusively absorbed
mental carbon was measured, but rather a chemical analysis         gas-phase OC was subtracted from the OC mass determined
of the black carbon on the filter. The NIOSH 5040 (NIOSH,          from the primary filter.
2003) standard method was used for the TOA, with a mod-
ified temperature ramp as specified by ARP 6320 (SAE,              2.1.3   Photoacoustic spectroscopy
2018), to obtain the EC mass concentrations. The uncertainty
associated with this method for EC mass concentration is           In this study, a photoacoustic extinctiometer (PAX; Droplet
stated to be 16.7 % (NIOSH, 2003) due to additional uncer-         Measurement Technologies, Inc.) and a micro soot sen-
tainty in assigning the split between OC and EC. The uncer-        sor (MSS; AVL, model 483) were used to provide addi-
tainty associated with the total carbon (TC) mass concentra-       tional measurements for nvPM mass concentrations. Both
tion is 8.4 % (Conrad and Johnson, 2019). A basic overview         the PAX and MSS are based on the photoacoustic method
of the process is presented here. The sample flow through          (Adams et al., 1989), measuring the acoustic wave gener-
the quartz filters was set to 22.7 slpm for all measurement        ated by the heated gases surrounding the light-absorbing
conditions, which was controlled by a calibrated mass flow         particles due to their increased temperature after interac-

Atmos. Meas. Tech., 15, 241–259, 2022                                                 https://doi.org/10.5194/amt-15-241-2022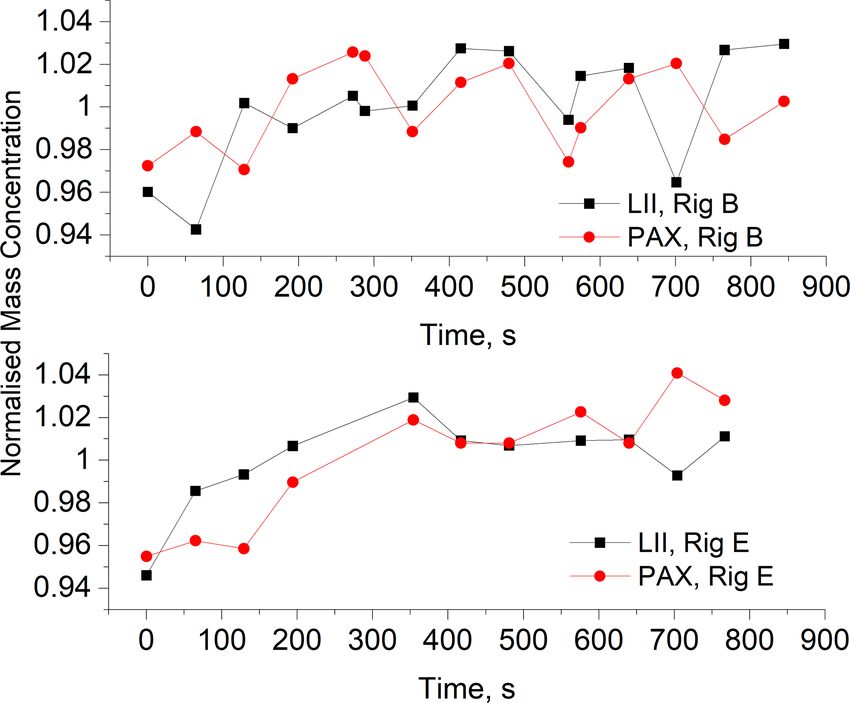
R. Yuan et al.: Measurement of black carbon emissions                                                                         245

tion with a laser. Unlike filter-based absorption methods,        source exhaust was diluted with HEPA-filtered air heated
where uncertainties related to organic aerosol coating and        to 160 ◦ C. A cyclone with a 1 µm cut size at a flow rate
light-absorbing properties are issues (Baumgardner et al.,        of 8 L min−1 was installed immediately downstream of the
2012; Corbin et al., 2019), photoacoustic measurements            diluted engine exhaust. The output flow from the cyclone
can potentially be affected by the humidity via latent heat       was transferred using a 3 m long heated (100 ◦ C) carbon-
and mass transfer from volatile droplets (Arnott, 2003)           loaded PTFE sample line and split to a pair of ejector di-
and absorption by molecular species present in the gaseous        luters (Dekati, Model DI-1000), operating in parallel to fur-
medium. The PAX and the MSS measurements rely on the              ther dilute the sample. The flow from the ejector diluters was
light-absorption properties of the PM sources, for which a        combined and transported through a mixing section to the
mass absorption cross-section (MAC) is usually assumed.           inlet of a custom-built sampling tunnel with 12 ports, which
In this work, a MAC of 7.5 ± 1.2 m2 g−1 at a wavelength           was used to distribute the diluted exhaust sample while en-
of 550 nm was applied to the PAX following the recom-             suring there was excess flow. Carbon-impregnated silicone
mendation by Bond and Bergstrom (2006), noting that the           tubing (nominal 3/8”) was used to transfer the sample to
MAC will vary with the black carbon source and operat-            the real-time instruments and the filter holders (for TOA,
ing condition. The MAC for the PAX (with a measured ab-           URG Corp. model URG-2000-30FVT). Quartz filter cas-
sorption at a wavelength λ of 870 nm) was converted us-           settes (model URG-2000-30FL) mounted in the filter holder
ing MAC(λ) = MAC(550 nm) × (550 nm/λ), assuming the               were used to hold the quartz filters.
refractive index was the same at those wavelengths, equiv-           In this study, the focus was not on the performance of the
alent to stating that the aerosol Ångström exponent (AAE) is      test rig or the operating conditions but rather the response of
1. The PAX operates at a wavelength of 870 nm and the MSS         the diagnostic instruments for a range of different combus-
at 808 nm. The MSS was previously calibrated with a soot          tion emission sources and associated fuel types – kerosene
source (CAST) of known concentration (determined by com-          (Jet A-1) for the gas turbine engines and IP rig, diesel
parison with EC from TOA), while the PAX was calibrated           (EN590) for the diesel engines, and gasoline (EN228) for
separately with ammonium sulfate and Aquadag solutions.           the GDI engine. The IP combustor rig design was developed
                                                                  as a tool for gas turbine fuel spray nozzle hardware rank-
2.1.4    Scanning mobility particle sizing                        ing for soot production, similar to Makida et al. (2006). The
                                                                  soot formation–oxidation process and maturity are different
Although the focus in this work was on the quantification         to those of typical rich-quench-lean gas turbine combustion.
of nvPM mass concentration, the particle size distributions       The real-time measurements of the nvPM mass emissions
from different engine sources were measured using a scan-         from these rigs using the LII 300 and the other diagnostic in-
ning mobility particle sizer (SMPS; TSI, USA). The SMPS           struments were recorded and compared. Table 1 summarises
consisted of an electrostatic classifier (model 3082), a dif-     the operating conditions of the various test rigs. Fuel sam-
ferential mobility analyser (model 3081), a soft X-ray neu-       ples were acquired from each of the test rigs and were sub-
traliser (model 3088), and an ultrafine condensation particle     sequently analysed (Table 2). The Jet A-1 fuels used in test
counter (model 3776). The particle size distribution data of      rigs A, B, and C had similar properties, as did the EN590
the nvPM emissions from the various sources provide addi-         fuels for test rigs D and E.
tional information on the physical properties of the particles.      To ensure stabilised conditions were reached, the sources
This will also provide information for the LII model devel-       (test rigs) were operated at the set point for a short period
opment in terms of particle size distribution functions. The      prior to nvPM data collection. The exhaust temperature, mea-
typical size range for a SMPS scan was 7–206 nm.                  sured with a thermocouple fitted to the exhaust of each rig,
                                                                  along with other operating condition data was monitored and
2.2     Test rigs and fuels                                       available as an indication of combustion stability. Once these
                                                                  operational parameters were determined to be stable, the data
Multiple sources (test rigs) were used to study the LII 300       collection for that particular set point was initiated. There
instrument’s response to the nvPM exhaust emissions at            were no exhaust aftertreatment devices on any of the rigs in
steady-state conditions. These rigs included an aircraft gas      the current work.
turbine turboshaft engine (Rolls-Royce Gnome helicopter
engine, Rig A), an intermediate-pressure gas turbine com-
bustor rig (Rolls-Royce IP rig, Rig B), a gas turbine auxil-      3     Results and discussion
iary power unit (Rover 2S/150 APU, Rig C), a diesel gen-
erator (Stephill Generators SE6000D4, Rig D), a naturally         3.1    LII 300 fluence optimisation
aspirated medium-sized (4.4 L) diesel engine (Rig E), and
a downsized (1.0 L) turbocharged gasoline direct-injection        For real-time nvPM mass quantification with the LII 300, a
(GDI) engine (Rig F). A schematic of the typical experimen-       single laser fluence level is typically used for the emission
tal set-up for the different sources is shown in Fig. 1. The      sources of interest. The laser fluence level is important for the

https://doi.org/10.5194/amt-15-241-2022                                                Atmos. Meas. Tech., 15, 241–259, 2022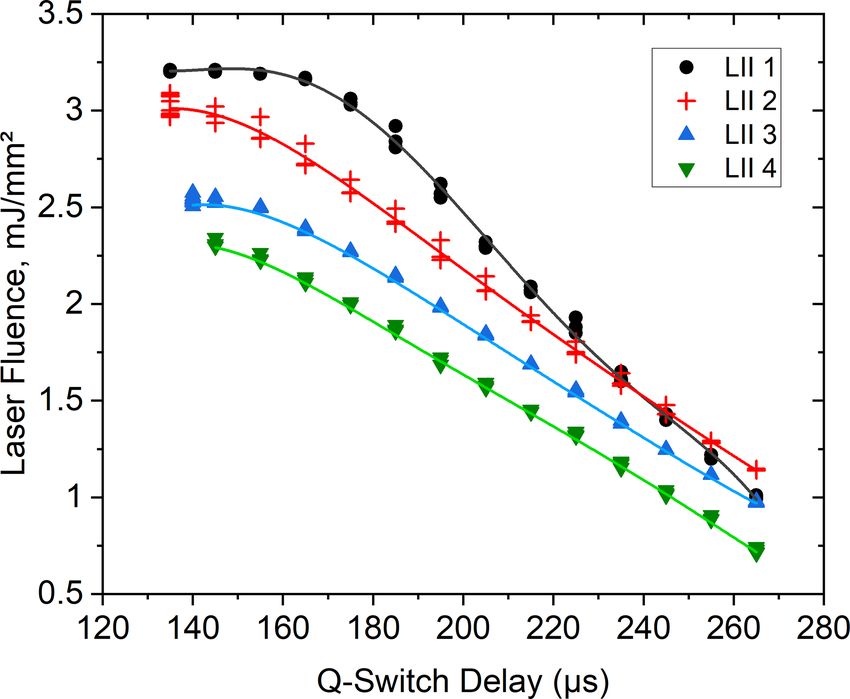
246                                                                         R. Yuan et al.: Measurement of black carbon emissions

Figure 1. Schematic diagram of the experimental set-up, illustrated for Rig A.

Table 1. Test rigs and operating conditions.

        Name      Source                                        Fuel type          Test conditions
        Rig A     Gnome helicopter gas turbine engine           Kerosene           – Idle (11 500 rpm)
                  (pressure ratio 10 : 1)                       (Jet A-1)          – High power output (HPO) (22 600 rpm)
        Rig B     Intermediate-pressure combustor               Kerosene           – Low pressure, low temperature (LPLT)
                  (pressure range 2 to 4 bar)                   (Jet A-1)          – Low pressure, high temperature (LPHT)
                                                                                   – High pressure, high temperature (HPHT)
                                                                                   – High pressure, low temperature (HPLT)
        Rig C     Auxiliary power unit gas turbine engine       Kerosene           – 6300 rpm
                  (pressure ratio 3.76 : 1)                     (Jet A-1)
        Rig D     Diesel generator                              Diesel             – 3 kW
                                                                (EN590)            – 5 kW
        Rig E     Medium-sized diesel engine                    Diesel             – Load 1: speed 1200 rpm, load 300 Nm
                                                                (EN590)            – Load 2: speed 2200 rpm, load 165 Nm
        Rig F     Downsized turbocharged gasoline direct        Gasoline           – Speed 2500 rpm, load 100 Nm
                  injection engine                              (EN228)

calibration of the instrument and its application. For the ex-          delay during the fluence sweep and using the mean value at
periments reported here, the laser fluence levels were deliber-         this reference Q-switch delay for initial normalisation of all
ately tuned over a wide range, from low to sublimation levels           data. Figure 2 shows an example of the mass concentration
of fluence, by adjusting the Q-switch (Qsw ) delay settings.            time series during one laser fluence sweep while measuring
Laser fluence sweep measurements (adjusting from low to                 the nvPM emissions from the IP gas turbine (Rig B). The
high fluence with a number of discrete steps) were performed            red line denotes the reference points at which the Q-switch
at steady-state engine operating conditions to determine the            setting was fixed corresponding to the maximum laser en-
optimum fluence for a particular nvPM source and operating              ergy output. The colour map of data points shown in Fig. 2a
condition. For the laser fluence sweep tests at steady-state en-        correlates to the Q-switch settings applied. Figure 2b is a
gine operation, measurements are unlikely to be influenced              time series of the normalised mass concentration results from
by substantial variation in the source emissions. A time-               the time-weighted method. A best fit was calculated on the
weighted normalisation (TN) method was used to account                  TN-normalised mass concentrations using the local polyno-
for fluctuations in the measured concentration caused by any            mial regression method (Loess method). The final normalisa-
modest variations in the concentration of the source emis-              tion was achieved by normalising the TN values to the peak
sions. This involved many repeats at a reference Q-switch               value of the best-fit curve, as shown in Fig. 2c. Fluence levels

Atmos. Meas. Tech., 15, 241–259, 2022                                                       https://doi.org/10.5194/amt-15-241-2022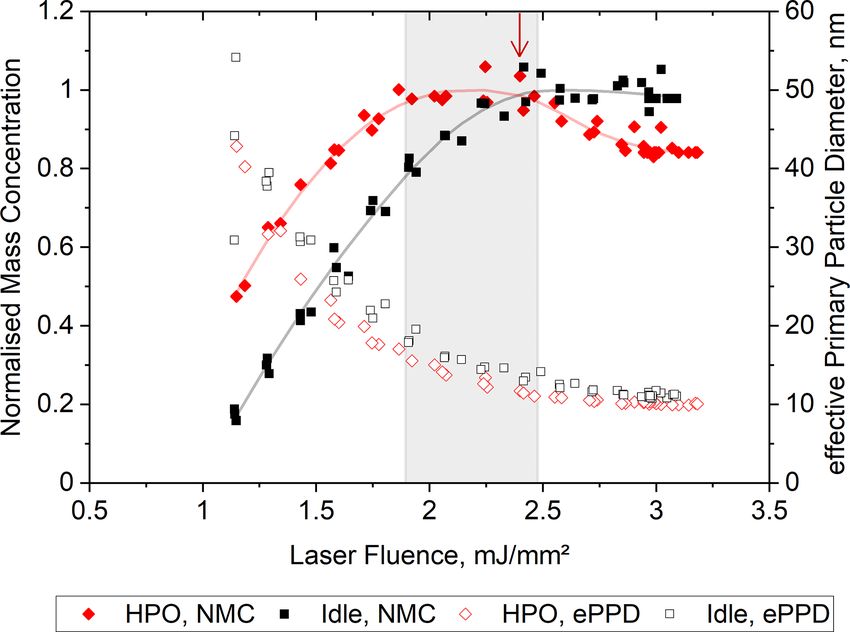
R. Yuan et al.: Measurement of black carbon emissions                                                                                   247

Table 2. (a) Physical and chemical properties for the Jet A-1 fuels (kerosene) used in Rigs A, B, and C. (b) Physical and chemical properties
for the EN590 fuels (diesel) used in Rigs D and E. (c) Physical and chemical properties for the EN228 fuel (gasoline) used in Rig F.

                       (a) Property                          Method              Allowable    Rig A       Rig B    Rig C
                                                                                     range
                       Specific density, kg m−3 (15 ◦ C)     ASTM D4052           780–820      808.6       807.0   799.2
                       Distillation temperature, ◦ C
                       – Initial boiling point (I. B. P.)    IP 123                            150.2      148.2    153.9
                       – 10 % volume recovery at             IP 123               155–201      167.5      166.4    170.6
                       – 50 % volume recovery at             IP 123                            198.0      196.0    197.8
                       – 90 % volume recovery at             IP 123                            240.4      239.3    241.2
                       – Final boiling point (F. B. P.)      IP 123               235–285      258.0      257.0    268.7
                       Aromatics, volume %                   ASTM D1319             15–23       16.5       16.5     17.3
                       Naphthalenes, volume %                ASTM D1840               0–3       1.86       1.73     1.59
                       Smoke point, mm                       ASTM D1322             20–28       22.3       22.5     23.6
                       Hydrogen, mass %                      ASTM D3343          13.4–14.3     13.72      13.74    13.86
                       Sulfur, mass %                        IP 336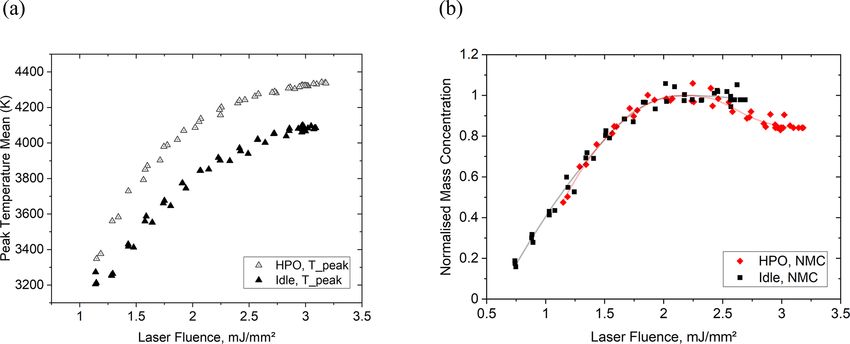
248                                                                      R. Yuan et al.: Measurement of black carbon emissions

Figure 2. Laser fluence optimisation procedure for mass concentration showing (a) all raw measurements; (b) initially normalised measure-
ments using the TN method; and (c) laser fluence sweep, superimposed with the best-fit curve (black) of the normalised mass concentration
data using the Loess method with a second-order local polynomial regression.

shown in Fig. 2c and in this work are estimated from an inter-
nal energy meter and the laser beam dimensions (measured
by a beam profile camera) in the probe volume.
   To further examine the role of source emissions variabil-
ity in the LII 300 fluence sweep measurements, the refer-
ence points of the 135 µs Q-switch delay from the LII 300
were plotted together with the data simultaneously acquired
by the PAX in Fig. 3. Results from the two sources (nvPM
emissions from the IP rig (Rig B) and from the diesel en-
gine (Rig E)) are presented. Despite subtle differences in the
variability in the two sources, the trends of the two signals
between the PAX and the LII 300 are similar for both cases,
suggesting that the uncertainties observed in the LII 300 flu-
ence sweep measurements at the reference fluence points (red
line in Fig. 2a) were likely influenced by the variability in
the source. The trend also suggests engine thermal equilib-
rium was achieved after 600 s, and there was ∼ 2 % variabil-           Figure 3. Mass concentration (normalised) measurements by the
                                                                       PAX and the LII 300 at its reference laser fluence points during
ity in mass concentration following this. In the subsequent
                                                                       fluence sweep tests using two different sources: nvPM emissions
analysis, the TN method was used for the normalisation to
                                                                       from the IP combustor (Rig B) and from the diesel engine (Rig E).
minimise the impact of source variability.

3.2     Laser fluence dependence – Rig A
                                                                       engine exhaust (Rig A) fuelled with kerosene at two differ-
3.2.1    Profiles of the measured mass concentrations                  ent steady-state engine operating conditions – (1) idle and
                                                                       (2) high power output (HPO). It is anticipated that the idle
Figure 4 shows the LII 300 laser fluence sweep vs. nor-                and HPO conditions are two extremes in terms of the prop-
malised mass concentration (solid symbols) from the Gnome              erties of the nvPM being emitted from Rig A, with those at

Atmos. Meas. Tech., 15, 241–259, 2022                                                     https://doi.org/10.5194/amt-15-241-2022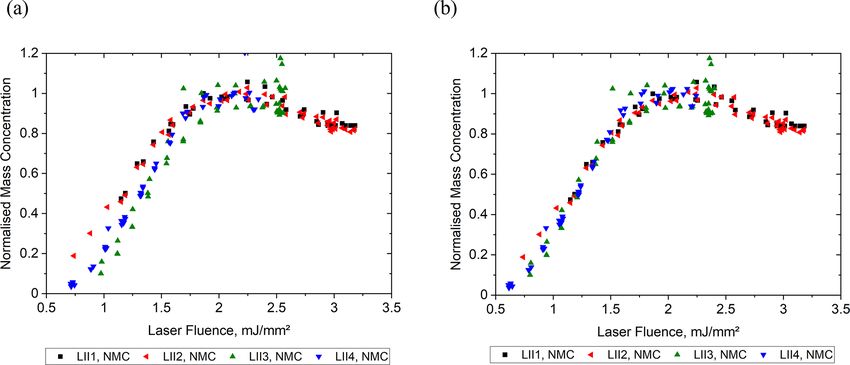
R. Yuan et al.: Measurement of black carbon emissions                                                                                    249

idle being less mature and with more volatile organic com-
pounds and the opposite for the HPO condition. Perform-
ing fluence sweep tests at these two conditions aided in de-
termining an optimum laser fluence level to cover the full
range of conditions from this source for real-time nvPM mass
measurements. At laser fluence levels below 1.7 mJ mm−2
(Fig. 4), the measurements showed an almost monotonic in-
crease with fluence between the measured nvPM mass con-
centrations and the laser fluence. The measurement of nvPM
mass concentration was independent of the laser fluence lev-
els in the range of 1.9 to 2.5 mJ mm−2 for the HPO con-
dition and 2.2 to 3.2 mJ mm−2 for the idle condition. The
shaded area in Fig. 4 corresponds to the data range that is
within 2 % of the peak value of the Loess best-fit curve1 from
the HPO condition. To determine an optimum laser fluence
level for real-time nvPM mass concentration measurements,
                                                                        Figure 4. Normalised mass concentration (NMC) mean and the
a fluence level at which the normalised mass concentration
                                                                        derived effective primary particle diameter (ePPD) mean across
(NMC) data fell within the optimum range (within 2 % er-
                                                                        the different laser fluence levels using the nvPM source from the
ror) at both conditions would be ideal as these two engine              kerosene-fuelled Rig A at high power output (HPO) and at idle
conditions are anticipated to represent the extremes in terms           conditions (idle). The shaded area indicates the ±2 % data range of
of the properties of the nvPM emissions. For the Gnome en-              the HPO case. The arrow indicates an optimum laser fluence level
gine, a fluence level at 2.4 mJ mm−2 (Fig. 4 arrow) was se-             for real-time nvPM mass concentration measurements for all power
lected as optimum for this source across all operating condi-           conditions.
tions and used in subsequent comparisons with results from
the other diagnostic techniques (as discussed in Sect. 3.5).
While not the focus of this study, it is interesting to note            further as the focus of this study is on nvPM mass concentra-
the impact of laser fluence and source operating condition              tion measurements.
on the effective primary particle diameters (ePPDs) result-
ing from the LII 300 measurements, as shown in Fig.4 (via               3.2.2   Sublimation
the decay rate of the LII signal) (Schulz et al., 2006). The
relationship between the effective primary particle diameter            It was observed that at the HPO condition for Rig A, the max-
and the laser fluence is most significant at low fluence levels         imum nvPM mass concentration was reached at a laser flu-
(2.5 mJ mm−2 ) sublimation occurs,              periment. The peak particle temperatures reported by the
and there may be a modest mass loss and potential reduction             LII 300, shown in Fig. 5a, permit further investigation into
in particle size. In the region of optimum fluence the effective        the difference in response to the nvPM produced at the idle
primary particle diameter is relatively insensitive to laser flu-       and HPO conditions. The particles reach a lower peak tem-
ence. At all fluence levels, the effective primary particle di-         perature2 for the idle condition compared with that for HPO
ameters measured at idle were larger than those measured at             across the range of laser fluence levels applied. The combus-
the HPO condition. The obtained ePPDs at optimum fluence                tion is fairly inefficient at the idle condition for Rig A, and
levels are within a similar range (6–19 nm by LII) reported             >2000 ppm of unburnt hydrocarbons has been previously ob-
for other gas turbine engines (Boies et al., 2015; Saffaripour          served at this condition. It is suspected that due to the com-
et al., 2020). Further investigation into the ePPD measured by          bustion inefficiency at the idle condition, the soot particles
the LII 300 and corresponding size comparisons with other                  2 The temperature is determined by two-colour pyrometry and
techniques such as transmission electron microscopy (TEM)
                                                                        therefore influenced by the nvPM optical properties, i.e. the relative
images will be addressed in future work and is not discussed            value of E(m) between the two detection wavelengths. In this study,
                                                                        it is assumed that the value of the absorption function, E(m), is
   1 The region near the peak of the Loess best fit within the 2 %      the same at both wavelengths (Snelling et al., 2005). The different
error band is defined and referred to as a plateau regime (relatively   particle properties at HPO and idle may invalidate this assumption,
uniform response to the fluence level) in the following sections. The   but the potential effect would only account for
250                                                                 R. Yuan et al.: Measurement of black carbon emissions

measured at the engine exit plane were coated with VOCs            ence
R. Yuan et al.: Measurement of black carbon emissions                                                                                       251

Figure 5. (a) Peak particle temperature mean from the LII 300 for the range of laser fluence levels at the two operating conditions. (b)
Shifting of the data in Fig. 4 with the idle condition’s data aligned with that for HPO. NMC (normalised mass concentration) using the nvPM
source from the kerosene-fuelled Rig A.

Figure 6. Normalised mass concentration (NMC) mean across the different laser fluence measured from the kerosene-fuelled Rig A by
multiple LII instruments (LIIs 1 to 4): (a) original output from the multiple LII instruments and (b) the laser fluence axis of instruments LII 3
and LII 4 was shifted to fit the data from LII 1.

ment with the prior results of aggregate diameter from TEM                 For the NMC at the low-pressure (LP) condition, both the
image analysis by Saffaripour et al. (2017).                               low-temperature (LT) and high-temperature (HT) cases were
                                                                           coincident; however, the two high-pressure (HP) cases were
3.3   LII 300 fluence sweeps from multiple                                 modestly shifted to higher fluence, with the high-pressure,
      kerosene-fuelled rigs – Rigs B and C                                 low-temperature (HPLT) results having the larger shift, only
                                                                           0.12 mJ mm−2 . Sublimation was observed above a fluence
Figures 9 and 10 compare the mass concentration profiles as                of 2.5 mJ mm−2 for all four test conditions, with the HPLT
a function of laser fluence levels from the different test rigs,           condition requiring slightly more fluence than the other con-
Rig B (IP rig) and Rig C (APU), respectively, both operat-                 ditions. The TOA measurements for the four cases indicate
ing with kerosene fuel. The laser fluence sweep tests for the              similar organic carbon content, with the OC/TC ratio of 0.43
four operation conditions of Rig B (Fig. 9) resulted in sim-               (LPLT), 0.41 (LPHT), 0.43 (HPHT), and 0.47 (HPLT). The
ilar trends with fluence for the NMC. In general, the mass                 relatively high OC/TC ratio suggests that additional laser en-
concentration results (Fig. 9a, original output) were less de-             ergy was used to evaporate volatile organic material coating
pendent on the laser fluence levels (plateau) over the fluence             the nvPM. The higher OC/TC for the HPLT condition com-
range of 1.8 to 2.5 mJ mm−2 , where peak mass concentration                pared to the rest of the conditions is consistent with requiring
was observed at ∼ 2.1 mJ mm−2 for the two low-pressure                     additional fluence across the entire range, from low fluence
cases and ∼ 2.2 mJ mm−2 for the two high-pressure cases.

https://doi.org/10.5194/amt-15-241-2022                                                           Atmos. Meas. Tech., 15, 241–259, 2022
252 R. Yuan et al.: Measurement of black carbon emissions
to sublimation. Shifts to the laser fluence axis were applied to
the HP cases to account for evaporation of organics, shown in
Fig. 9b, demonstrating the self-similarity of the fluence data
observed for all four conditions with Rig B.
The laser fluence sweep measurements using the nvPM
source from Rig C are shown in Fig. 10. Peak mass con-
centration was obtained at ∼ 2.25 mJ mm−2 laser fluence
of Rig C, similar to that from Rig A (∼ 2.25 mJ mm−2 )
and Rig B (2.2–2.5 mJ mm−2 ), operating with the same fuel
(kerosene). Mass concentration measurements were less de-
pendent on the laser fluences in the range of 2 to 3 mJ mm−2
for Rig C.
The similar performance of the LII 300 measurements
from multiple rigs demonstrated the robustness of this tech-
nique and revealed that an optimised laser fluence can be
valid for real-time measurements from a variety of sources.
On the other hand, it is shown that laser fluence shifts may
Figure 7. Correlation between the Q-switch delay settings and the be required to align the fluence sweeps for different operat-
laser fluence levels from the LII 300 instruments (LIIs 1–4). ing conditions, even from the same sources (such as shown
in Figs. 4–5 from Rig A). This suggests that possible differ-
ences in the composition (such as volatile organic coatings),
morphological characteristics (internal structure of the pri-
mary particles or aggregation), or optical absorption proper-
ties of the particles at different operating conditions may be
important. This observation suggests that care must be taken
in selecting the optimum laser fluence when using a single
or different source (such as a laboratory flame) for calibrat-
ing LII 300 instruments such that it is valid (in the plateau
regime) for both the calibration source and the intended ap-
plication. In most cases it is possible to select one laser flu-
ence that is in the plateau regime for all operating conditions
for a single source.
3.4 LII 300 fluence dependence – different sources and
fuels
The laser fluence dependence was further investigated for
Rigs D–F, which were reciprocating engine sources with
intermittent combustion and burned diesel or gasoline fu-
els, unlike Rigs A–C, which were steady-state combus-
tion sources with kerosene fuel. The results are shown in
Fig. 11a and demonstrate that, similar to the results for
Rigs A–C, there is a wide range of laser fluence levels (1.7–
2.7 mJ mm−2 ) where the measurements of mass concentra-
tions were insensitive to the laser fluence levels (plateau
Figure 8. (a) Typical particle size distributions measured using the regime). This allows a moderate laser fluence to be applied
SMPS for the multiple sources and operating conditions: Rig A in practical applications to avoid the mass loss due to subli-
(kerosene-fuelled, HPO condition), Rig B (kerosene-fuelled, four mation and at the same time reduce the reliance on a critical
operating conditions), and Rig D (diesel-fuelled, two load condi- laser fluence value as the same result is obtained across this
tions); (b, c) typical TEM images of soot produced by a turboshaft range of laser fluences. Mass concentrations obtained from
engine (speed: 13 000 (b) and 21 000 rpm (c); shaft horse power: 70 Rigs D–F were normalised by the maximum of each rig in-
(b) and 630 shp (c); and the estimated global equivalence ratio of dividually and plotted together with those from Rig A and
0.25 (b) and 0.18 (c), respectively) at a magnification of 45 000×
Rig C in Fig. 11b, with all the data acquired using the same
(Saffaripour et al., 2017).
instrument (LII 1). As with Rigs A–C, it should be noted that
at low fluence levels (R. Yuan et al.: Measurement of black carbon emissions 253
Figure 9. Laser fluence sweep performance using Rig B as the nvPM source, with four operating conditions. NMC – normalised mass
concentration. Superimposed are the best-fit curves from the Loess method. (a) Original output from the LII instrument and (b) the laser
fluence axis of HPHT and HPLT was shifted (left shift of 0.05 and 0.12, respectively) to fit the LP curves.
operation conditions, which is beyond the scope of this pa-
per.
The laser fluence sweeps showed similar results in terms
of achieving an optimum fluence range with a plateau regime
for the NMC measurements across multiple rigs and fuels,
which may suggest the option of utilising cost-effective rigs
as nvPM sources for calibration prior to measurements on
aircraft gas turbine engines. The data suggest a near univer-
sality of the fluence sweeps, with the need to shift some by a
fixed amount of fluence to compensate for differences in the
particle properties, but all with the same shape and exhibit-
ing a plateau regime over which the response is uniform for
a range of laser fluence values. Utilising an optimum fluence
level of 2.2 mJ mm−2 , which corresponds to the peak of the
Figure 10. Laser fluence sweep results using sources from Rig C.
best fit from Rigs D to F, will fall within the 2 % error band,
NMC – normalised mass concentration. The best-fit curve from the which defines the plateau regime for the HPO condition of
Loess method is shown with a black line. Rig A. It should be noted that the shift in the fluence lev-
els measured on Rig A (shown in Fig. 4) required to align
the fluence sweeps at the idle and HPO conditions (shown
ported mass concentrations were lower than those measured in Fig. 5b) would lead to a 4 % bias error for the idle con-
when the laser fluence level is in the plateau regime. dition of Rig A if the fluence is set at 2.2 mJ mm−2 . At en-
In general, similar behaviour is observed in the normalised gine idle or at conditions where less mature soot (Migliorini
data from all the rigs and fuels in the plateau ranges. Fig- et al., 2011) or fewer volatile coatings are encountered, the
ure 11b illustrates that the optimum fluence from Rig A laser fluence range for the plateau regime (with a 2 % error
overlaps well with that from other rigs, except for Rig C. band) will need to be shifted to a higher fluence level, cover-
The results from Rig C require a shift on the fluence axis ing the range from 2.4 to 3.2 mJ mm−2 . The optimum fluence
(of around 0.3 mJ mm−2 ) in order to align with those from to cover the full range of operating conditions for Rig A is the
Rig A (HPO condition), as shown in Fig. 9c, where the flu- region where these two plateau regime ranges overlap in the
ence data from 6 rigs and a total of 11 conditions converge range of 2.4 to 2.5 mJ mm−2 .
after the fluence shifts were applied. This shift was due to the
combustion-formed soot particles emitted from Rig C, which 3.5 Comparison of mass concentration results from
had different physical and chemical characteristics compared different diagnostic techniques
to the soot formed from Rig A. Further analysis would re-
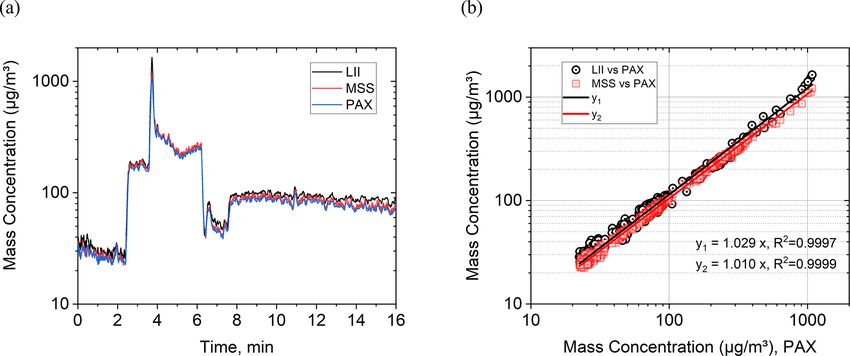
quire much greater understanding of the soot morphology, The nvPM mass concentration was simultaneously measured
structure, and composition characteristics from the various using LII 300, PAX, and MSS for a range of conditions for
https://doi.org/10.5194/amt-15-241-2022 Atmos. Meas. Tech., 15, 241–259, 2022254 R. Yuan et al.: Measurement of black carbon emissions Figure 11. (a) Laser fluence dependence of mass concentration measurements from LII 300 using multiple nvPM sources from diesel- (Rigs D and E, Load 2) and gasoline-fuelled (Rig F) engine exhausts at typical operation conditions. Superimposed are the best-fit curves from the Loess method. (Arrows point at the corresponding y axis.) (b) Normalised mass concentration vs. laser fluences from Rigs A and C to F. Measurements were carried out by the same instrument LII 1 for the kerosene cases (Rigs A, C) as for the diesel and gasoline cases (Rigs D to F). Rig E, Load 1: speed 1200 rpm, load 165 Nm; Load 2: speed 2200 rpm, load 300 Nm. (c) Combined data from all rigs with the laser fluence axis of Rig C and Rig E, Load 1, shifted to the left by 0.27 and −0.05 mJ mm−2 , respectively. Rigs A–F. Here the real-time nvPM mass concentration mea- time instruments were computed by calculating the relative surements from Rig A are discussed (Fig. 12) as an example standard deviation, RSD (standard deviation of the sampled for interpreting the results from the laser-induced incandes- mass concentration data normalised to their average value), cence and photoacoustic real-time diagnostic techniques. indicating the variability in the nvPM mass measurement. Figure 12 shows that a high degree of correlation was The LII 300, PAX, and MSS results generally are not sig- found between the LII 300, PAX, and MSS for nvPM mass nificantly different than those for EC from TOA, with error concentration measurements. From the linear curve fits over bars overlapping within the uncertainty (16.7 %) of the TOA nearly 2 orders of magnitude (y1 – LII vs. PAX – and y2 – EC determination. The real-time instruments’ results were MSS vs. PAX – with an intercept value 0), the mass concen- higher (1 %–20 %) than the EC results from TOA on nvPM trations from the LII 300 and PAX are within 2.9 % of each emissions from most rigs, except the PAX result from Rig D other, and the mass concentrations from the LII 300 and MSS (3 kW). The PAX result from Rig D (3 kW) was 4 % lower are within 1.9 % of each other, much less than the measure- than that for the EC result; however, it was still within the ment uncertainties associated with each of the instruments. uncertainty in the TOA EC measurement. Unlike other cases The LII 300 measurements for nvPM mass concentrations investigated where the nvPM mass concentrations were ob- were further compared with the EC results obtained from served to be in the range of 100–800 µg m−3 , the nvPM mass TOA. The results from the multiple rigs are shown in Fig. 13, emissions of Rig F were lower, ∼ 40 µg m−3 . The TOA EC normalised to the EC results. The measurements from the uncertainty from the NIOSH method is greatest at the low- PAX and MSS instruments are also included for compari- est mass concentrations (NIOSH, 2003) and is reduced at son. The nvPM mass concentrations measured by the real- higher mass concentrations. In comparison of the real-time time instruments, i.e. LII 300, PAX, and MSS, were aver- instruments’ performance, for the cases investigated, PAX aged for the same duration as the filter collection by the results were on average 6 % lower than those for the LII 300 corresponding TOA measurements. The error bars of real- from the kerosene-fuelled rigs, 10 % lower than those for the Atmos. Meas. Tech., 15, 241–259, 2022 https://doi.org/10.5194/amt-15-241-2022
R. Yuan et al.: Measurement of black carbon emissions                                                                           255

Figure 12. (a) Mass concentration profiles for LII 300, PAX, and MSS and (b) correlations between LII 300 and MSS nvPM mass concen-
trations to those from PAX (Rig A).

LII 300 from the diesel-fuelled rigs, and 6 % lower than those
for the LII 300 from the gasoline-fuelled rig. MSS results
were on average 7 % higher than those for the PAX from
both kerosene-fuelled and diesel-fuelled rigs. This agrees in
general with the finding of previous studies (Smallwood et
al., 2010; Durdina et al., 2016; Lobo et al., 2020; Corbin et
al., 2020), and the discrepancy between the various instru-
ments from source to source and amongst the different fuels
is likely caused by difference in the properties of the parti-
cles (morphology, structure, and optical absorption), the dif-
ferent content of non-refractory components of the particles
(i.e. quantities of bound H and O, volatiles, nitrates, ash, sul-
fates, etc.) (Smallwood et al., 2010), and uncertainties asso-
ciated with varying relative humidity content in the heated
sampling cell (for photoacoustic instruments) (Arnott, 2003)
as well as the choice of the split point in determining EC          Figure 13. Comparison of the mass concentration results from the
                                                                    multiple rigs and diagnostic techniques. The shaded area marks
from TOA (Baumgardner et al., 2012). In terms of identify-
                                                                    the 16.7 % uncertainty in the TOA from the NIOSH method
ing a substitute for the aircraft gas turbine helicopter engine     (NIOSH, 2003). The nvPM mass concentrations are in the range
(Rig A) for calibrating the LII 300, Rig C (APU) appears            of 90–470 µg m−3 from Rig A, 500–600 µg m−3 from Rig B, 670–
to be the closest in terms of LII 300 response, 1 % higher          780 µg m−3 from Rig C, 300–550 µg m−3 from Rig D 5 kW, 200–
than EC from TOA on the same source, well within the un-            270 µg m−3 from Rig D 3 kW, 230–590 µg m−3 from Rig E, and
certainty in the methods. In terms of the variability in nvPM       20–70 µg m−3 from Rig F.
mass concentrations results, the LII 300 exhibited a lower
variation of 5 % on average among all the rigs and operating
conditions investigated compared to that for the other instru-      4   Summary
ments, which was 6 % for PAX, 7 % for MSS, and 7 % for
EC from TOA. A higher variability was shown for cases of            New standards and recommended practices adopted by the
low nvPM mass emissions (such as from Rig F or Rig D at             ICAO require the nvPM mass and number emissions from
3 kW; refer to nvPM mass concentrations’ ranges detail in           aircraft engines to be quantified during emissions certifi-
Fig. 13 caption) for both PAX and MSS than the variability          cation tests. The LII 300, the only commercial LII instru-
exhibited for cases of high nvPM mass emissions (such as in         ment utilising the AC-LII method, has been used to measure
Rigs B and E). This trend of a low variability in nvPM mass         nvPM mass emissions from aircraft engines. Previous stud-
at high concentrations is consistent with results from emis-        ies reported the sensitivity of the LII technique to the type
sions measurements of the miniCAST soot generator (Lobo             of black carbon sources. In this study the response of the
et al., 2020) and other aircraft engines (Lobo et al., 2015b,       LII 300 instrument to different nvPM from a range of dif-
2016).                                                              ferent sources and fuels was investigated to understand the
                                                                    relationship between the laser fluence values and the result-
                                                                    ing nvPM mass concentrations and to evaluate the suitability

https://doi.org/10.5194/amt-15-241-2022                                                 Atmos. Meas. Tech., 15, 241–259, 2022
256 R. Yuan et al.: Measurement of black carbon emissions
of different sources and fuels to be used as an nvPM calibra- Rolls-Royce. The authors also thank Dan Clavel and Brett Smith,
tion source for the LII 300. For all the tests using multiple who assisted with the data collection. Ruoyang Yuan would like to
rigs as sources of nvPM emissions, LII 300 measurements acknowledge the funding from the EPSRC and the David Clarke
demonstrated a plateau regime with a range of laser fluence Fellowship to support her work.
values where the resulting nvPM mass concentration mea-
surements were insensitive to the laser fluence levels applied.
The shape of the fluence sweep curves was nearly universal Financial support. This research has been supported by Transport
Canada and the Engineering and Physical Sciences Research Coun-
for all sources, operating conditions, and fuels investigated.
cil (grant no. EP/S017259/2).
Optimising the laser fluence for the plateau regime over the
range of source operating conditions was shown to reduce
potential uncertainties for the LII 300 associated with the Review statement. This paper was edited by Pierre Herckes and re-
corresponding range of nvPM properties. viewed by four anonymous referees.
Data demonstrated that the LII 300, PAX, and MSS had
similar response and performance in the real-time measure-
ments of nvPM emissions from multiple rigs studied. Com-
pared to other diagnostic instruments, the real-time measure- References
ment output of LII 300 exhibited no significant differences Adams, K. M., Davis, L. I., Japar, S. M., and Pierson, W. R.: Real-
and high correlation (>97 %) with the photoacoustic instru- time, in situ measurements of atmospheric optical absorption in
ments. To assess suitability of replacing an aircraft gas tur- the visible via photoacoustic spectroscopy-II. Validation for at-
bine engine as a calibration source, further work is required mospheric elemental carbon aerosol, Atmos. Environ., 23, 693–
to establish the repeatability and reproducibility of particle 700, https://doi.org/10.1016/0004-6981(89)90017-6, 1989.
sources as well as investigating additional laboratory sources, Air quality expert group (AQEQ): Particulate Matter in the
including the miniCAST, MISG (mini-inverted soot genera- UK: Summary, Defra, London, ISBN 0-85521-144-X, available
tor), and nebulised carbon black particles. In addition, future at: https://uk-air.defra.gov.uk/library/assets/documents/reports/
work should include investigating the morphology charac- aqeg/Particulate_Matter_in_The_UK_2005_Summary.pdf (last
teristics, composition, and optical absorption of the various access: 10 December 2020), 2005.
Arnott, W. P.: Photoacoustic and filter-based ambient aerosol
particulate matter sources from multiple operating conditions
light absorption measurements: Instrument comparisons and
to further understand the relationship between soot particle
the role of relative humidity, J. Geophys. Res., 108, 4034,
characteristics and the response of real-time instruments used https://doi.org/10.1029/2002JD002165, 2003.
for the measurement of nvPM mass concentration. Axelsson, B., Collin, R., and Bengtsson, P.-E.: Laser-
induced incandescence for soot particle size measure-
ments in premixed flat flames, Appl. Optics, 39, 3683,
Data availability. The datasets analysed during the current study https://doi.org/10.1364/ao.39.003683, 2000.
are available from the corresponding author on request. Bachalo, W. D., Sankar, S. V, Smallwood, G. J., and Snelling, D.
R.: Development of the Laser-Induced Incandescence Method
for the Reliable Characterization of Particulate Emissions, in: the
Author contributions. GJS, MPJ, PL, MCP, and AS conceived and International Symposia on Applications of Laser Techniques to
planned the study and performed the experiments. RY processed Fluid Mechanics, Lisbon, 2002.
the experimental data and performed the analysis. RY drafted the Baumgardner, D., Popovicheva, O., Allan, J., Bernardoni, V., Cao,
manuscript with input from PL and GJS and designed the figures. J., Cavalli, F., Cozic, J., Diapouli, E., Eleftheriadis, K., Gen-
PL and GJS assisted in interpreting the results. DB contributed to berg, P. J., Gonzalez, C., Gysel, M., John, A., Kirchstetter, T. W.,
the discussion on the time-weighted normalisation method. All au- Kuhlbusch, T. A. J., Laborde, M., Lack, D., Müller, T., Niess-
thors discussed the results and contributed to the final paper. ner, R., Petzold, A., Piazzalunga, A., Putaud, J. P., Schwarz,
J., Sheridan, P., Subramanian, R., Swietlicki, E., Valli, G., Vec-
chi, R., and Viana, M.: Soot reference materials for instru-
Competing interests. The contact author has declared that neither ment calibration and intercomparisons: a workshop summary
they nor their co-authors have any competing interests. with recommendations, Atmos. Meas. Tech., 5, 1869–1887,
https://doi.org/10.5194/amt-5-1869-2012, 2012.
Black, J. D. and Johnson, M. P.: In-situ laser-induced incandes-
cence of soot in an aero-engine exhaust: Comparison with certi-
Disclaimer. Publisher’s note: Copernicus Publications remains
fication style measurements, Aerosp. Sci. Technol., 14, 329–337,
neutral with regard to jurisdictional claims in published maps and
https://doi.org/10.1016/j.ast.2010.02.007, 2010.
institutional affiliations.
Boiarciuc, A., Foucher, F., and Mounaïm-Rousselle, C.: Soot
volume fractions and primary particle size estimate by
means of the simultaneous two-color-time-resolved and 2D
Acknowledgements. The authors would like to acknowledge the laser-induced incandescence, Appl. Phys. B, 83, 413–421,
funding from Transport Canada for this project and support from https://doi.org/10.1007/s00340-006-2236-8, 2006.
Atmos. Meas. Tech., 15, 241–259, 2022 https://doi.org/10.5194/amt-15-241-2022You can also read