Persistence of moist plumes from overshooting convection in the Asian monsoon anticyclone
←
→
Page content transcription
If your browser does not render page correctly, please read the page content below
Research article
Atmos. Chem. Phys., 22, 3169–3189, 2022
https://doi.org/10.5194/acp-22-3169-2022
© Author(s) 2022. This work is distributed under
the Creative Commons Attribution 4.0 License.

               Persistence of moist plumes from overshooting
                convection in the Asian monsoon anticyclone
           Sergey M. Khaykin1 , Elizabeth Moyer2 , Martina Krämer3 , Benjamin Clouser2 , Silvia Bucci4,a ,
               Bernard Legras4 , Alexey Lykov5 , Armin Afchine3 , Francesco Cairo6 , Ivan Formanyuk5 ,
       Valentin Mitev7 , Renaud Matthey8 , Christian Rolf3 , Clare E. Singer2,b , Nicole Spelten3 , Vasiliy Volkov5 ,
                                        Vladimir Yushkov5 , and Fred Stroh3
            1 Laboratoire      Atmosphères, Observations Spatiales (LATMOS), UVSQ, Sorbonne Université,
                                                    CNRS, IPSL, Guyancourt, France
                       2 Department of the Geophysical Sciences, University of Chicago, Chicago, IL, USA
                3 Institut für Energie und Klimaforschung (IEK-7), Forschungszentrum Jülich, Jülich, Germany
            4 Laboratoire de Météorologie Dynamique (LMD), CNRS, IPSL, ENS-PSL, École Polytechnique,

                                                    Sorbonne Université, Paris, France
                      5 Central Aerological Observatory of Roshydromet, Dolgoprudny, Russian Federation
       6 Institute of Atmospheric Sciences and Climate (CNR-ISAC), National Research Council of Italy, Rome, Italy
                            7 Centre Suisse d’Electronique et de Microtechnique, Neuchâtel, Switzerland
                                8 Institut de Physique, University of Neuchâtel, Neuchâtel, Switzerland
                    a now at: Institut für Meteorologie und Geophysik, University of Vienna, Vienna, Austria
           b now at: Department of Environmental Science and Engineering, California Institute of Technology,

                                                          Pasadena, CA, USA
                            Correspondence: Sergey M. Khaykin (sergey.khaykin@latmos.ipsl.fr)

                                  Received: 7 August 2021 – Discussion started: 31 August 2021
                        Revised: 9 January 2022 – Accepted: 29 January 2022 – Published: 10 March 2022

      Abstract. The Asian monsoon anticyclone (AMA) represents one of the wettest regions in the lower strato-
      sphere (LS) and is a key contributor to the global annual maximum in LS water vapour. While the AMA wet
      pool is linked with persistent convection in the region and horizontal confinement of the anticyclone, there re-
      main ambiguities regarding the role of tropopause-overshooting convection in maintaining the regional LS water
      vapour maximum. This study tackles this issue using a unique set of observations from aboard the high-altitude
      M55-Geophysica aircraft deployed in Nepal in summer 2017 within the EU StratoClim project. We use a com-
      bination of airborne measurements (water vapour, ice water, water isotopes, cloud backscatter) together with
      ensemble trajectory modelling coupled with satellite observations to characterize the processes controlling water
      vapour and clouds in the confined lower stratosphere (CLS) of the AMA. Our analysis puts in evidence the dual
      role of overshooting convection, which may lead to hydration or dehydration depending on the synoptic-scale
      tropopause temperatures in the AMA. We show that all of the observed CLS water vapour enhancements are
      traceable to convective events within the AMA and furthermore bear an isotopic signature of the overshooting
      process. A surprising result is that the plumes of moist air with mixing ratios nearly twice the background level
      can persist for weeks whilst recirculating within the anticyclone, without being subject to irreversible dehydra-
      tion through ice settling. Our findings highlight the importance of convection and recirculation within the AMA
      for the transport of water into the stratosphere.

Published by Copernicus Publications on behalf of the European Geosciences Union.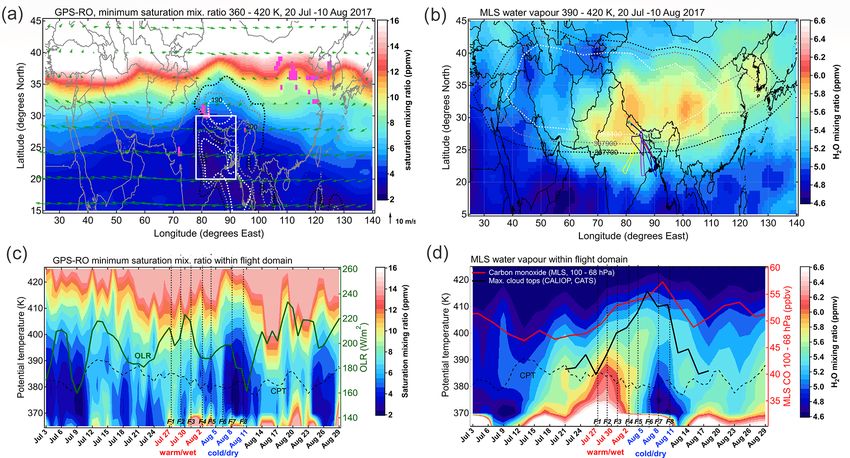
3170                                  S. M. Khaykin et al.: Persistence of moist convective plumes in the lower stratosphere

1   Introduction                                                   Legras and Bucci, 2020). In general, there is no consensus
                                                                   regarding the primary convective source regions, nor regard-
Water vapour in the lower stratosphere has a direct im-            ing the net convective effect of deep convection on the CLS
pact on surface climate and stratospheric ozone chemistry          water vapour, which points out the complexity of physical
(e.g. Dessler et al., 2013; Dvortsov and Solomon, 2001;            processes in the AMA system.
Anderson et al., 2017). The variability of global lower               Notably, most of the observational evidence regarding the
stratospheric water vapour is, to first order, regulated by        mechanisms controlling AMA water is derived from passive
the minimum temperature in the tropical tropopause layer           satellite measurements, which due to their coarse vertical
(TTL) – the main gateway for stratospheric entry of tropo-         resolution cannot resolve the small-scale processes such as
spheric moisture (e.g. Fueglistaler et al., 2009, and refer-       moistening produced by localized injections of ice. The high-
ences therein). This way, the variation of stratospheric wa-       resolution measurements of water vapour within the AMA
ter vapour follows the annual cycle of TTL temperatures ex-        using small balloons and research aircraft have only recently
periencing the minimum during Austral summer, when the             become available (Bian et al., 2012; Gottschaldt et al., 2018;
TTL is coldest and driest above the western Pacific region         Vernier et al., 2018; Brunamonti et al., 2018). The most ex-
(e.g. Randel and Jensen, 2013). During boreal summer, one          tensive set of high-resolution measurements including wa-
of the primary contributors to the annual maximum of lower         ter vapour, ice water, water isotopic ratio, aerosols and vari-
stratospheric water vapour is the Asian monsoon (e.g. Ban-         ous tracers is provided by the StratoClim aircraft campaign,
nister et al., 2004; Fueglistaler and Haynes, 2005; Ueyama et      which was held in July–August 2017 and involved the high-
al., 2018) and the associated Asian summer monsoon anticy-         altitude M55-Geophysica aircraft deployed in Kathmandu,
clone (AMA).                                                       Nepal (Stroh et al., 2022; Krämer et al., 2020).
   The AMA is one of the largest atmospheric circulation              In this study, we combine local airborne measurements
features on Earth, owing its existence to frequent deep con-       with global satellite observations to characterize the mech-
vection above southern Asia and the Bay of Bengal, strong          anisms of convective impact on water vapour and clouds
surface heating over the Tibetan Plateau, and orographic           through both mass and energy transport above the cold point
updraughts at the southern slopes of the Himalayas (e.g.           tropopause. We provide observational evidence of convec-
Hoskins and Rodwell, 1995). The AMA is characterized by a          tively induced lower stratosphere hydration and dehydration
persistent maximum of water vapour extending up to 68 hPa          of both irreversible and reversible types. The link between
(Park et al., 2007; Santee et al., 2017), which makes it the       the local variations and phase transitions of water with deep
wettest region in the boreal summer lower stratosphere. Gen-       convection across the Asian anticyclone is investigated using
erally, this large-scale maximum is conditioned by convec-         ensemble trajectory modelling constrained by satellite detec-
tive uplift of moist air in the Asian monsoon region and its       tions of convective cloud tops. Section 2 of this article de-
horizontal confinement within the anticyclone (Dethof et al.,      scribes the experimental and modelling setup, and Sect. 3
1999; Ploeger et al., 2015).                                       provides the satellite view of synoptic-scale development in
   The transport of moist air into the stratosphere occurs         the TTL during the campaign period and presents the ensem-
via different pathways: slow radiatively driven ascent (e.g.       ble of airborne measurements. The convective source regions
Garny and Randel, 2013), fast convective overshooting (e.g.        and their AMA-wide effects on water vapour are analysed in
Fu et al., 2006), and adiabatic transport across the horizontal    Sect. 4. Section 5 documents and analyses the observed pro-
boundaries of the AMA (e.g. Pan et al., 2016) into the tropi-      cesses controlling water vapour above the tropopause and is
cal and midlatitude stratosphere (Randel et al., 2010; Wright      followed by the discussion and summary in Sect. 6.
et al., 2011; Dethof et al., 1999; Vogel et al., 2016; Rolf et
al., 2018; Nützel et al., 2019). The role of different transport
                                                                   2     Data and methods
pathways, particularly of the convective overshooting and its
predominant source regions, is subject of ongoing debate.          2.1    StratoClim campaign and airborne instruments
   A relatively small impact of overshooting convection on
AMA humidity is found by James et al. (2008), Wright et            The main experiment of the EU Framework Programme 7
al. (2011), Randel et al. (2015) and Zhang et al. (2016),          (FP7) StratoClim project was the deployment of the Rus-
whereas Fu et al. (2006), Ueyama et al. (2018) and Bruna-          sian high-altitude M55-Geophysica aircraft in Kathmandu,
monti et al. (2018) suggest that this process can be an im-        Nepal, during July–August 2017. The campaign included
portant contributor to the total water in the Asian TTL. The       eight flights (hereinafter referred to as Fx, where x is the
convective impact of different source regions (e.g. Bay of         flight number) performed every second day during the pe-
Bengal, Tibetan Plateau, southern slopes of the Himalayas or       riod 27 July–10 August in both the morning and afternoon
Sichuan Basin) is also under debate (Bannister et al., 2004;       hours. Three of the flights were performed within the Nepali
Bergman et al., 2012; Fu et al., 2006; Lelieveld et al., 2007;     borders, whereas in the rest of the flights the aeroplane flew
Wright et al., 2011; Devasthale and Fueglistaler, 2010; James      out to the southwest, south and southeast from Nepal, reach-
et al., 2008; Park et al., 2007; Tissier and Legras, 2016;         ing the Bay of Bengal (see Fig. S1 of the Supplement). The

Atmos. Chem. Phys., 22, 3169–3189, 2022                                             https://doi.org/10.5194/acp-22-3169-2022
S. M. Khaykin et al.: Persistence of moist convective plumes in the lower stratosphere                                      3171

Geophysica aircraft hosted a large number of in situ and re-        measurements of water vapour and water isotopologues un-
mote sensors for measuring gaseous and particulate upper-           der UTLS conditions, i.e. low temperature and humidity en-
troposphere–lower-stratosphere (UTLS) composition. A full           vironment. The new version of the instrument is a tunable
description of the campaign is provided by Stroh et al. (2022,      diode laser (TDL), off-axis integrated cavity output spec-
same issue). In this study, we use in situ measurements of wa-      trometer (Singer et al., 2022, same issue). The spectrometer
ter vapour, total water, and water isotopologues respectively       scans absorption lines of both H2 O and HDO near 2.647 µm
by the Fluorescent Lyman-Alpha Stratospheric Hygrometer             wavelength in a single current sweep. With a 90 cm long
(FLASH), Fast In situ Stratospheric Hygrometer (FISH), and          multi-pass cell, the effective path length amounts to more
Chicago Water Isotope Spectrometer (ChiWIS) instruments             than 7 km. During the airborne campaign, the instrument
as well as particle backscatter measurements by the onboard         has demonstrated measurement precision for 10 s integra-
multiwavelength aerosol scattersonde (MAS) and miniature            tion times of 18 ppbv and 80 pptv in H2 O and HDO, respec-
aerosol lidar (MAL).                                                tively. The measurements were reported at 0.2–0.5 Hz fre-
                                                                    quency depending on the ambient mixing ratio and the de-
2.1.1   In situ water measurements
                                                                    sired signal-to-noise ratio. Periods of the flights where the
                                                                    internal cell pressure of ChiWIS was below 30 hPa are not
FLASH-A (Fluorescent Lyman-Alpha Stratospheric Hy-                  reported because of the large influence of vapour desorption
grometer for Aircraft) is an airborne instrument of the             from the cavity walls. ChiWIS reported measurements for all
FLASH hygrometer family designed specifically for the               the StratoClim flights except F1 and F5.
M55-Geophysica aircraft (Sitnikov et al., 2007). The instru-           FISH (Fast In situ Stratospheric Hygrometer) is a closed-
ment was redesigned in 2009 (Khaykin et al., 2013) for the          path Lyman-α fluorescence hygrometer with a forward-
RECONCILE campaign (von Hobe et al., 2013) and substan-             facing inlet, which enables measurement of total water (sum
tially improved for the StratoClim experiment. FLASH-A              of gas-phase water and sublimated ice crystals). The mea-
is mounted inside a gondola under the right wing of Geo-            surement accuracy is 6 %–8 %, whereas the precision of 1 Hz
physica and has a rear-facing inlet, enabling water vapour          data is estimated at 0.3 ppmv (Zöger et al., 1999; Meyer
measurements. With the aspiration rate of 470 cm3 s−1 , the         et al., 2015). Inside the cirrus clouds, the ice water content
air samples in a 90 cm3 measurement chamber are fully ex-           (IWC) is calculated by subtracting the FLASH-A gas-phase
changed every 0.19 s. The chamber is maintained at constant         water from the total water measured by FISH, as described
temperature (24 ◦ C) and pressure (36 hPa). Before a flight,        by Afchine et al. (2018). The minimum detectable IWC is
the instrument is ventilated for several hours using dry air        3 × 10⁻² ppmv (∼ 3 × 10⁻³ mg m−3 ). The FISH instrument
(< 1 ppmv), whereas the inlet tube, heated to 30 ◦ C, is kept       has provided measurements for flights F2, F4, F6, F7 and F8.
sealed before the aircraft climbs to a 250 hPa level to avoid          The point-by-point intercomparison between FLASH-
chamber contamination by moist tropospheric air.                    A, ChiWIS and FISH clear-air measurements reported by
   Unlike the previous airborne versions of FLASH-A with            Singer et al. (2022) revealed a remarkable degree of agree-
transverse optical setup, the StratoClim FLASH-A rendi-             ment and an equally high capacity of all hygrometers to re-
tion has a coaxial optics similar to that of the FLASH-B            solve fine-scale spatial structures in UTLS water vapour. In
balloon-borne instrument (Yushkov et al., 1998). The water          clear-sky periods at mixing ratios below 10 ppmv, the mean
vapour mixing ratio is detected by sensing the fluorescence         bias between FISH and FLASH-A was −1.47 % with an r 2
light yielded by photodissociation of water molecules after         value of 0.930. For ChiWIS and FLASH-A, the mean bias
their exposure to Lyman-α radiation. A near Lyman-α line            was −1.42 % and +0.74 % with r 2 values of 0.928 and 0.930
(123.6 nm) is produced by a krypton lamp, whereas the hy-           for clear-sky and in-cloud periods at mixing ratios below
droxyl fluorescence at the 300–325 nm wavelength range is           10 ppmv, respectively. Singer et al. (2022) also found good
detected by a photomultiplier operating in photon-counting          agreement of the airborne measurements with the collocated
mode. The accuracy of water vapour measurements in the              Microwave Limb Sounder (MLS) water vapour profiles as
1–100 ppmv range is estimated at 8 %, whereas the preci-            well as with concomitant balloon soundings in Dhulikhel,
sion of 1 Hz data in the stratosphere is 0.2 ppmv with a de-        Nepal (Brunamonti et al., 2018), using a cryogenic frost point
tection limit of 0.1 ppmv for 5 s integration time. FLASH-          hygrometer (CFH) instrument. Altogether, this provides a
A was calibrated against a reference MBW-373L frost-point           high degree of confidence in the StratoClim water vapour
hygrometer before and after the aircraft deployment as well         measurement.
as during the campaign using FISH calibration facility. Dur-
ing the StratoClim campaign, FLASH-A operated in all the            2.1.2   In situ temperature and cloud measurements
eight scientific flights as well as during the transfer flight to
Kathmandu.                                                          The temperature was measured by TDC (thermodynamic
   ChiWIS (Chicago Water Isotope Spectrometer) is an                complex), a modified Rosemount five-hole probe that pro-
airborne implementation of the ChiWIS-lab instrument                vides an accuracy of 0.5 K and precision of 0.1 K for tem-
(Sarkozy et al., 2020) designed for atmospheric chamber             perature measurements at 1 Hz frequency (Shur et al., 2007).

https://doi.org/10.5194/acp-22-3169-2022                                           Atmos. Chem. Phys., 22, 3169–3189, 2022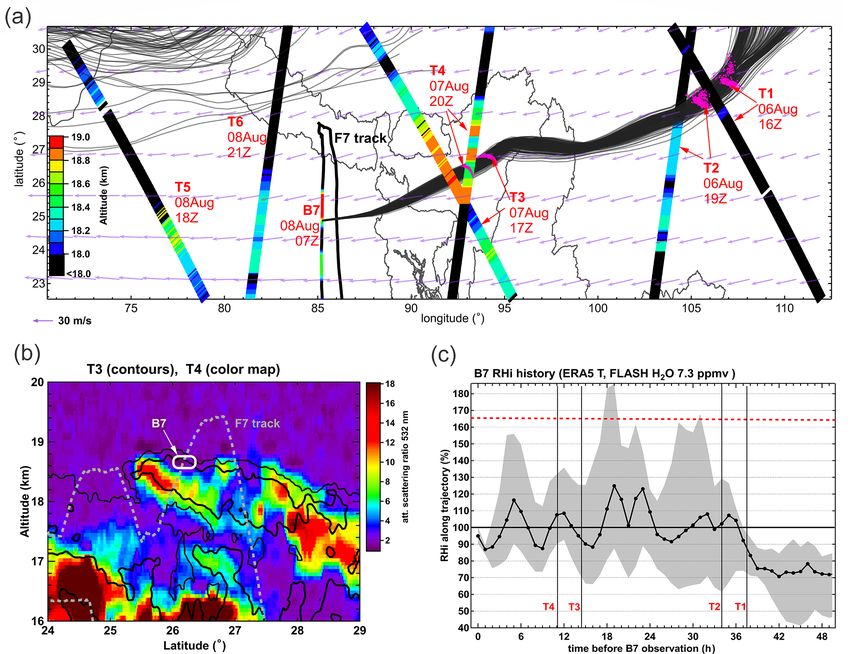
3172                                 S. M. Khaykin et al.: Persistence of moist convective plumes in the lower stratosphere

We used TDC measurements of temperature and pressure to           1000 m in the UTLS. Here we use the CALIOP 532 nm
convert the FLASH-A water vapour mixing ratio into relative       level 1B version 4.0 product for diagnosing the cloud
humidity over ice (RHi) as well as to compute the saturation      vertical cross sections and for quantifying the cloud top
mixing ratio using the saturation vapour pressure equation        altitude. To enhance the sampling of clouds, we also use
by Murphy and Koop (2005). The accuracy of TDC mea-               level 1 backscatter product at 1064 nm provided by NASA’s
surements is discussed by Singer et al. (2022) and Stroh et       Cloud-Aerosol Transport System (CATS) lidar operating
al. (2022).                                                       aboard the International Space Station (Yorks et al., 2016).
   NIXE-CAPS (New Ice eXpEriment: Cloud and Aerosol               The CATS 1064 nm backscatter is converted to 532 nm using
Particle Spectrometer) is mounted under the right wing of a       the CALIOP colour ratio.
Geophysica aircraft and measures the cloud particle number           The GPS radio occultation (RO) technique provides verti-
size distributions in the size range of 3–930 µm diameter at a    cal profiles of atmospheric variables with high vertical reso-
time resolution of 1 Hz (Meyer, 2012). The IWC values de-         lution (∼ 0.5 km around the tropopause), global geographical
rived from particle size distributions are found to be in good    and full diurnal coverage, and high accuracy (< 1 K) (Steiner
agreement with those derived from FISH total water mea-           et al., 1999). We use RO dry temperature profiles from COS-
surements (Afchine et al., 2018). The lower detection limit of    MIC (Anthes et al., 2008), GRACE (Beyerle et al., 2005),
the instrument is 0.05 ppmv (≈ 0.005 mg m−3 ). NIXE-CAPS          and Metop A/B missions (Luntama et al., 2008) for analysing
provided measurements in all the flights.                         the temperature and minimum saturation mixing ratio within
   In situ measurements of cloud/aerosol backscatter and          the AMA during July and August 2017.
with a time constant of 10 s were provided by the forward-
looking backscatter probe MAS (multiwavelength aerosol            2.3   Definitions
scattersonde) described by Buontempo et al. (2006). To dis-
tinguish between clear-sky and in-cloud measurements, here        In this section, we define the key terms regarding the vertical
we use a threshold of 1.2 units of backscatter ratio at 532 nm    structure of AMA and physical processes therein.
together with a 2.5 % threshold in the volume depolariza-            The vertical boundaries of the tropical tropopause tran-
tion (corresponding to particle depolarization of 8 %–10 %).      sition layer (TTL) can be defined using two different ap-
MAS instruments operated in all the flights except F1, for        proaches reviewed by Pan et al. (2014). The mass-flux ap-
which we used NIXE-CAPS data (Afchine et al., 2018) to de-        proach (Fueglistaler et al., 2009) defines the lower boundary
tect the clouds. Singer et al. (2022) showed good agreement       as the tropically averaged level of all-sky zero net radiative
between the cloud detections by both of these instruments.        heating (14 km, 355 K) and the upper boundary as 18.5 km
   Remote measurements of cloud backscatter below and             (425 K), where the local mass flux becomes comparable to
above the aircraft were conducted by miniature aerosol li-        that of the Brewer–Dobson circulation (Fu et al., 2006). An-
dar (MAL) (Mitev et al., 2002). Backscatter ratios at 532 nm      other approach is based on the TTL thermal structure, where
are derived after applying a noise filter, range correction and   the lower and upper boundaries are defined respectively as
correction for incomplete overlap in the near range, allowing     the level of minimum stability and the cold point tropopause
observations as close as 40 m from the aircraft.                  (CPT) (Gettelman and de F. Forster, 2002). Pan et al. (2014)
                                                                  found that the thermally defined TTL boundaries are consis-
2.2    Satellite observations
                                                                  tent with those derived from the ozone–water-vapour rela-
                                                                  tionship. In this study, we adopt the thermal definition of the
The Microwave Limb Sounder (MLS) instrument, operating            TTL as in this case the boundaries can be derived from the lo-
aboard the NASA Aura satellite, measures various chemi-           cal instantaneous measurements provided by the Geophysica
cal species and temperature and provides over 3500 verti-         aircraft.
cal profiles per day between 82◦ S and 82◦ N. Here we use            Since the location of the Geophysica deployment is not
the version 4.2 water vapour profiles described by Livesey et     tropical in the geographical sense, we refer to the TTL in
al. (2017), who report for the lower to middle stratosphere       this region as the Asian tropopause transition layer (ATTL)
a vertical resolution of 3.0–3.1 km, horizontal resolution of     with an upper boundary at the CPT derived from ERA5 tem-
190–198 km and an accuracy of 8 %–9 %. The data screening         perature profiles collocated with the flight tracks and us-
criteria specified by Livesey et al. (2017) have been applied     ing airborne temperature profiles. Following Brunamonti et
to the data. To interpolate the water vapour profiles onto a      al. (2018), we refer to the upper layer of the Asian anticy-
common potential temperature grid, we use the MLS tem-            clone as the confined lower stratosphere (CLS) with a lower
perature product provided at the same pressure levels.            boundary at the CPT level and an upper boundary corre-
   Cloud-Aerosol Lidar with Orthogonal Polarization               sponding to the top level of confinement, which they estimate
(CALIOP) is a primary instrument aboard the CALIPSO               as 63.5 hPa (∼ 440 K) for the 2017 AMA season.
satellite, operational since 2006 (Winker et al., 2009) and          A convective overshoot (also termed “ice geyser” by
providing backscatter coefficients at 532 and 1064 nm with        Khaykin et al., 2009) is defined as detrainment of ice crys-
a vertical resolution of 60 m and horizontal resolution of        tals above the local CPT (Danielsen, 1993). Depending on

Atmos. Chem. Phys., 22, 3169–3189, 2022                                            https://doi.org/10.5194/acp-22-3169-2022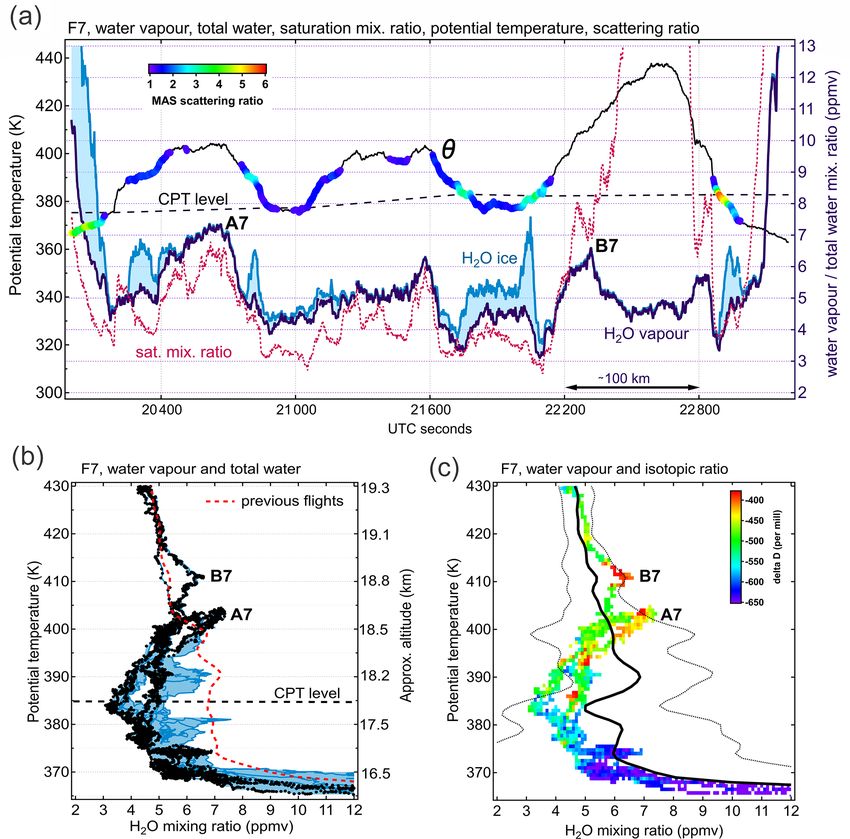
S. M. Khaykin et al.: Persistence of moist convective plumes in the lower stratosphere                                         3173

the relative humidity at the level of detrainment, this pro-        the total number of convective hits identified by this analysis.
cess can lead either to CLS moistening by rapid ice subli-          The convective origin of the sampled parcels is statistically
mation or to irreversible dehydration via uptake of vapour          diagnosed in terms of the fraction of convective hits per 1 s
by the injected ice crystals, their growth and sedimentation        sample as well as the convective age of parcel, i.e. the time
(e.g. Jensen et al., 2007; Schoeberl et al., 2018). The clouds      since convective hit.
that have formed in the CLS as a result of local cooling are           It should be noted that the trajectory model integrates 1000
termed in situ cirrus. An in situ cirrus cloud is not to be con-    backward trajectories per data point along the flight track,
fused with the above anvil cirrus plume (AACP), which is a          whereas the parcels’ vertical diffusion is represented by a
plume of ice and water vapour in the LS that occurs in the lee      random noise equivalent to a diffusion D = 0.1 m2 s−1 as
of overshooting convection (Homeyer et al., 2017; O’Neill et        in Bucci et al. (2020). As such, the integration is a discretiza-
al., 2021). A secondary cloud refers to an in situ cirrus that      tion of the adjoint equation of the advective diffusive equa-
has nucleated from an air mass enhanced in water vapour as          tion, which is well posed for backward integration (Legras et
a result of convective overshoot.                                   al., 2005). Unlike single-trajectory Lagrangian calculations,
                                                                    this method does not generate spurious small-scale features
2.4   Ensemble trajectory modelling and convective cloud
                                                                    as backward time increases and can be shown to converge
      top data
                                                                    with time for a pure passive scalar. With that, the trajecto-
                                                                    ries from each data point come from several, possibly many,
For investigating the link between the variations in wa-            sources, and the results presented are a statistics over these
ter vapour observed locally by the Geophysica aircraft and          1000 trajectories.
the deep convection upwind detected using satellite IR im-             Obviously, the results can be affected by biases in the wind
agery, we use the TRACZILLA Lagrangian model (Pisso and             field, heating rates and the cloud height product used in this
Legras, 2008), a modified version of FLEXPART (Stohl et             study. The ERA5 is presently considered as the most ad-
al., 2005). The simulation was designed to release an ensem-        vanced reanalysis, and it was shown to display very consis-
ble of 1000 back trajectories every second along the aircraft       tent transport properties of diabatic versus kinematic trajec-
flight path, travelling back in time for 30 d. The calculation of   tories (Legras and Bucci, 2020), which are in excellent agree-
back trajectories was performed using the European Centre           ment with observations (Brunamonti et al., 2018; von Hobe
for Medium-Range Weather Forecasts (ECMWF) ERA5 re-                 et al., 2021). The main concern in the Asian monsoon re-
analysis horizontal winds and diabatic heating rates provided       gion is that ERA5 displays high penetrative convection over
at hourly frequency and 31 km horizontal resolution.                the Tibetan Plateau, which might bias the heating rates in the
   For detection of convective cloud encounters (convec-            upper TTL over this region (SPARC, 2022). As the trajecto-
tive hits) along the diffusive back trajectories, we use cloud      ries involved in this studied are mostly outside the plateau,
top information from geostationary satellites (MSG1 and             we do not expect any significant impact.
Himawari-8). To cover the entire AMA region, we make
use of the cloud top product from both the MSG1 images
                                                                    3     Evolution of AMA conditions: two modes
for longitudes west of 90◦ E and the Himawari-8 images for
longitudes east of 90◦ E. The MSG1 satellite operated by            3.1    Satellite perspective
EUMETSAT carries the Spinning Enhanced Visible and In-
frared Imager (SEVIRI), providing multi-wavelength image            The 2017 Asian monsoon season was not marked by an
collection with spatial resolution of 1–3 km and temporal res-      anomalous dynamical behaviour (Manney et al., 2021); how-
olution of 15 min (Schmetz et al., 2002). The Himawari-8            ever, the campaign occurred during a break-to-active transi-
geostationary satellite, launched by the Japan Meteorologi-         tion. The strongest convective activity took place in late July
cal Agency (JMA), carries the Advanced Himawari Imager              and early August above the southern slopes of the Himalayas
(AHI), providing the images at 0.5–2 km spatial resolution          and the Tibetan Plateau, as can be inferred from the low out-
with 10 min intervals (Bessho et al., 2016). For computa-           going longwave radiation (OLR) displayed as dashed con-
tional reasons, we use one image every 20 min.                      tours in Fig. 1a. The OLR distribution in July–August 2017 is
   The cloud top height data were taken from the European           very similar to its climatological pattern reported by Randel
Organisation for the Exploitation of Meteorological Satel-          et al. (2015) (see their Fig. 5). The thermal conditions across
lites (EUMETSAT) Satellite Application Facility (SAF) on            the Asian TTL (ATTL) exhibit a remarkable variability with
Support to Nowcasting and Very Short Range Forecasting              minimum saturation mixing ratios between 14–18 ppmv in
(NWC) products (Schulz et al., 2009; Derrien et al., 2010;          the warmer northern part of the AMA and 2 ppmv above
Sèze et al., 2015). The analysis was restricted to the high-        the colder southern slopes where the Geophysica flights took
est and opaque cloud classes that are representative of deep        place. The horizontal distribution of CLS water vapour (390–
convection. In this study, we consider the convective hits          420 K layer) averaged over 3 weeks before and during the
above 100 hPa only, corresponding to the cloud tops poten-          Geophysica flights (Fig. 1b) reveals a pool of moist air with
tially overshooting the tropopause. They constitute 24.3 % of       two maxima near the centre of the anticyclone.

https://doi.org/10.5194/acp-22-3169-2022                                            Atmos. Chem. Phys., 22, 3169–3189, 2022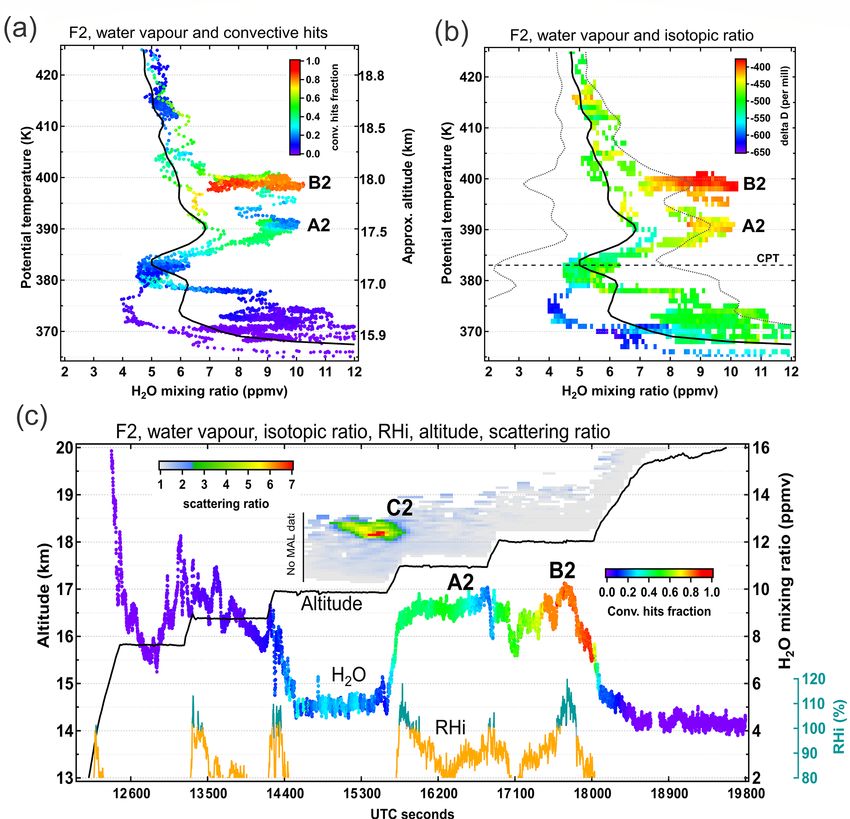
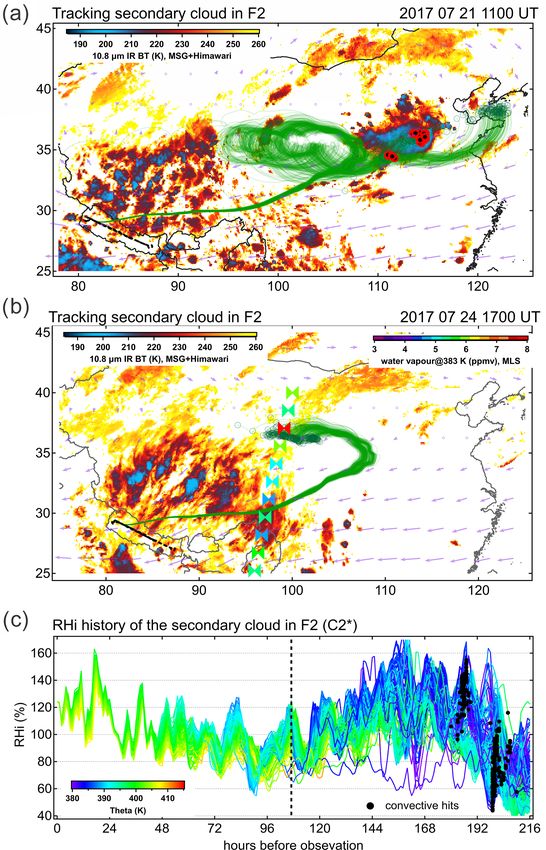
3174                                     S. M. Khaykin et al.: Persistence of moist convective plumes in the lower stratosphere

Figure 1. Overview and evolution of AMA UTLS conditions during July–August 2017 from satellite observations. (a) Colour map shows
the GPS-RO minimum saturation mixing ratio (ppmv) encountered within the 360–420 K layer during the 20 July–10 August period. Dashed
contours indicate National Centers for Environmental Prediction (NCEP) OLR (W m−2 ) in the range 190–210 W m−2 (contour interval
10 W m−2 ). Green arrows are wind velocity vectors (ERA5, 70–100 hPa average for the campaign period). Pink pixels mark the most
probable sources of the hydrated features (see Sect. 4.2). White rectangle indicates the flight domain. (b) Horizontal distribution of MLS water
vapour in the confined LS (390–420 K layer) averaged over the 20 July–10 August period with the date-coloured flight tracks superimposed
(see Fig. 2 for colour definition). Dashed contours depict the Montgomery stream function (m−2 s−2 ), which is used to define the horizontal
boundaries of the AMA at 390–410 K levels (Santee et al., 2016). (c) Evolution of the GPS-RO minimum saturation mixing ratio profile
within the flight domain (20–30◦ N, 78–92◦ E). Green curve plotted versus right-hand axis depicts the domain-mean OLR. (d) Evolution
of the MLS water vapour profile within the flight domain. The solid black curve depicts the maximum level of cloud tops detected using
CALIOP and CATS satellite lidars. The red curve indicates MLS carbon monoxide (68–100 hPa mean). The vertical dashed lines indicate
the flight dates (flight number is given as Fx) and their vertical extent, and the dashed curve marks the average CPT potential temperature
level (GPS-RO) in both panels (c) and (d).

   The time evolution of temperature in terms of the H2 O                 marked by stronger convective activity in the region reflected
saturation mixing ratio (Fig. 1c) and water vapour (Fig. 1d)              by low OLR (Fig. 1c), i.e. colder and higher cloud tops, and
within the flight domain shows an interesting development of              a higher carbon monoxide mixing ratio (Fig. 1d). Since the
the UTLS conditions before and during the campaign period.                carbon monoxide is a tracer for troposphere-to-stratosphere
In mid-July, a humid layer in the ATTL starts to build up and             transport, the elevated CO concentration in the LS is in-
propagates above CPT up to about 410 K by early August.                   dicative of the enhanced upward flux across the tropopause
The first four Geophysica flights were conducted during this              (e.g. Randel et al., 2010). The cold/dry mode period is also
moisture build-up period, characterized by relatively warm                marked by a widespread occurrence of ice clouds above the
CPT temperatures (Fig. 1c), which we term the “warm/wet”                  CPT (377–390 K) and as high as the 415 K level according to
mode. It should be noted that the 2017 AMA season was                     high-resolution cloud profiling by CALIOP and CATS satel-
marked by a strong positive anomaly in water vapour ranging               lite lidars (Fig. 1d). We note that the cold convective period
from 1 to 2 ppmv but without a significant tropopause tem-                had a transient effect on the CLS water vapour, which mostly
perature anomaly (Fig. S2 in the Supplement). The positive                recovers the late July values, after the cessation of convective
water vapour anomaly is not specific to the AMA region and                activity and tropopause warming in the flight domain by mid-
reflects the global wet anomaly in the tropics and subtropics,            August. A similar inference was reported by Brunamonti et
as revealed by MLS observations (not shown).                              al. (2018) on the basis of balloon soundings in Nepal during
   In early August, after the warm/wet mode period, the                   the airborne campaign in July–August 2017.
ATTL experienced a rapid cooling, and the last four flights
sampled a colder and drier ATTL. This “cold/dry” mode is

Atmos. Chem. Phys., 22, 3169–3189, 2022                                                       https://doi.org/10.5194/acp-22-3169-2022
S. M. Khaykin et al.: Persistence of moist convective plumes in the lower stratosphere                                               3175

Figure 2. (a) Water vapour mixing ratio profiles taken by FLASH hygrometer. The flight dates are shown in the legend. The dashed rectangle
marks the CPT vertical range. The white solid and dashed lines depict the mean water vapour profile for the warm/wet and cold/dry modes
respectively (see Fig. 1c, d). (b) Saturation mixing ratio profiles computed from TDC measurements of temperature and pressure. The
horizontal dashed lines in both panels mark the vertical range of CPT level encountered during the campaign. Note the strong variability of
water vapour at the CPT level and accumulation of sharp enhancements in the lower stratosphere.

3.2   Airborne perspective                                              rated environment with RHi spanning 40 %–175 % (Fig. 3a).
                                                                        The credibility of RHi data is ensured by an excellent agree-
                                                                        ment across the three airborne hygrometers and tempera-
The airborne measurements of water vapour and temperature
                                                                        ture sensors (Singer et al., 2022). In the presence of ice
shown in Fig. 2 reflect the satellite-derived development of
                                                                        crystals (Fig. 3b), the RHi is generally well above 100 %
the UTLS conditions. The ensemble of water vapour profiles
                                                                        although the subsaturated cloud occurrences were also ob-
obtained using the FLASH hygrometer during the eight Stra-
                                                                        served in both dry and wet parts of the water vapour spec-
toClim flights is shown in Fig. 2a. The H2 O vertical profiles
                                                                        trum. Such occurrences are mainly caused by short excur-
at and above the CPT level show a remarkable variability
                                                                        sions of temperature above the frost point, which does not
over the 2-week campaign period with mixing ratios rang-
                                                                        necessarily lead to permanent evaporation and depends on
ing from 2.8 to 10.2 ppmv. On average, the warm/wet mode
                                                                        the air parcel’s (Lagrangian) temperature history. The occur-
yielded an L-shaped mean H2 O profile (solid curve), which is
                                                                        rence of ice crystals was recorded at levels 15 K (∼ 1 km)
characteristic of the boreal subtropical conditions, although
                                                                        above the local CPT. The highest-level clouds were detected
with notable enhancements at and above the CPT. In con-
                                                                        by the upward-looking MAL at 412 K (18.5 km), which is
trast, the cold convective period revealed the vertical distribu-
                                                                        consistent with NIXE-CAPS detection of cloud particles up
tion more typical for the tropical tropopause conditions, with
                                                                        to 415 K (Krämer et al., 2020, their Fig. 11) as well as with
the hygropause at the CPT level. The airborne measurements
                                                                        the maximum cloud altitudes inferred from satellite lidars
during both synoptic periods show an accumulation of sharp
                                                                        (415 K). The presence of ice in supersaturated air is more
moist layers above the CPT and up to the 410 K level which
                                                                        specific to the cold dry parcels (see also Krämer et al., 2020,
are diagnosed in the following section. These layers consti-
                                                                        their Fig. 10d), which suggests a local dehydration during the
tute the CLS wet pool seen by MLS, although their sharp
                                                                        cold/dry period.
vertical structures of sub-kilometre scale cannot be resolved
                                                                           A different perspective on the environmental conditions
by the satellite.
                                                                        of cloud occurrence around the CPT is provided in Fig. 3c,
   The large variability of water vapour is consistent with
                                                                        showing the distribution of IWC as a function of RHi. The
the tropopause temperature variability, showing a minimum
                                                                        binned ensemble is restricted to the samples, for which both
saturation mixing ratio between 2.5 and 6.5 ppm and highly
                                                                        MAS and NIXE-CAPS data indicate the presence of ice par-
variable CPT vertical structure (Fig. 2b), presumably modu-
                                                                        ticles. The ice crystals found in the subsaturated air above
lated by gravity waves. The CPT potential temperature varied
                                                                        the local CPT are likely to be in the process of sublimation
between 370–391 K, which is fully consistent with the GPS-
                                                                        and therefore have a potential for a permanent CLS hydra-
RO data.
                                                                        tion. Conversely, the crystals in the supersaturated environ-
   The highly variable thermal conditions led to a remark-
                                                                        ment will retain their aggregate state and the largest ones
able dispersion of RHi around the CPT. The clear-sky mea-
                                                                        (characterized by higher IWC) will sediment down below
surements reveal both a subsaturated and strongly supersatu-

https://doi.org/10.5194/acp-22-3169-2022                                                 Atmos. Chem. Phys., 22, 3169–3189, 2022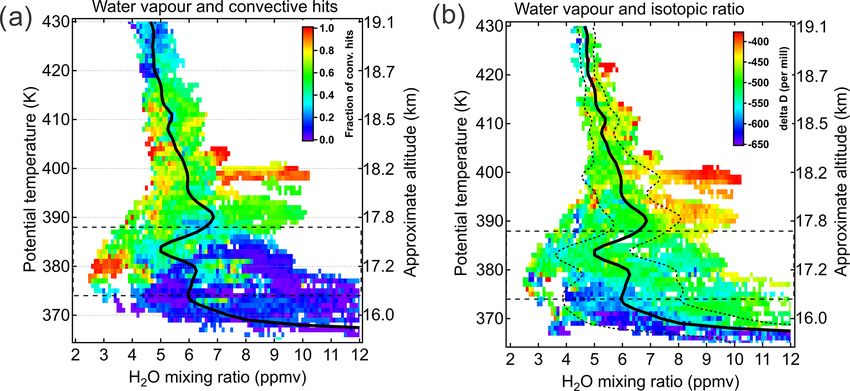
3176                                     S. M. Khaykin et al.: Persistence of moist convective plumes in the lower stratosphere

Figure 3. (a, b) Binned distribution of maximum RHi (computed from FLASH and TDC measurements) as a function of FLASH water
vapour and potential temperature relative to the local CPT level (bin size 0.1 ppmv by 1 K) for (a) clear-sky conditions and (b) cloud
occurrence detected by MAS (see Sect. 2.1.2). (c) Binned distribution of ice water content (IWC) exceeding 0.1 ppmv from NIXE-CAPS
instrument inside clouds detected by MAS as a function of relative humidity over ice (RHi) and potential temperature relative to the local CPT
level. The presence of ice crystals in subsaturated air (RHi < 100 %) above the cold point tropopause potentially leads to permanent hydration
of the CLS, whereas in supersaturated air the ice crystals are expected to sediment out of the CLS, thereby leading to its dehydration.

the tropopause, thereby causing permanent dehydration of                 of the cold/dry mode with large-scale convection in the flight
the CLS. We note that the ice particles in the subsaturated              domain. While the driest parcels are linked with the local or
environment account for 14 % of the particles detected above             nearby convective events, the wettest ones are traced back
the local CPT. This is consistent with a comprehensive anal-             to distant convective events all along the circulation pattern
ysis of airborne data from various campaigns by Krämer et                of the anticyclone, which occurred several days before their
al. (2020), who pointed out significantly larger amounts of              outflows were sampled by the Geophysica aircraft. The only
IWC in subsaturated ice crystals above the CPT in the AMA                exception is F6, which was influenced by a young outflow
compared to that in the surrounding tropical regions, which              of a large convective system in the vicinity of the flight (see
underlines the importance of the AMA as the source of LS                 Sect. 4.2 and Fig. S4).
water.
                                                                         4.1    Isotopic composition of convective plumes
4   Convective influence on CLS water vapour                             The relation of moist layers with overshooting convection
                                                                         can be reliably diagnosed using the isotopic ratio of water
The influence of overshooting convection on the ob-                      (HDO/H2 O), which is enhanced for water vapour molecules
served water vapour variability was investigated using                   sublimated from ice (Moyer et al., 1996; Hanisco et al.,
TRACZILLA ensemble trajectory modelling constrained by                   2007). Figure 4b clearly shows that the wetter parcels in the
satellite cloud imaging and ERA5 reanalysis (see Sect. 2.4).             lower stratosphere are isotopically enhanced, and the wettest
Figure 4a displays a binned ensemble of the measured wa-                 of them bear the strongest isotopic signature. This unambigu-
ter vapour mixing ratios colour-coded by the convective hits             ously points out that the hydrated layers have been produced
fraction. The trajectory analysis suggests that the convec-              by overshooting ice geysers. Remarkably, the wet and iso-
tive origin is characteristic to anomalously wet and anoma-              topically enhanced pixels in Fig. 4b are found as high as the
lously dry parcels, which points out the dual role of over-              420 K level, which is 30–50 K above the cold point. Given the
shooting convection on the AMA water vapour, i.e. hydra-                 diabatic heating rate of 1.1 K d−1 in the AMA and the aver-
tion/dehydration. The link to overshooting convection is par-            age recirculation time of 16 d within the anticyclone (Legras
ticularly obvious for a strong water vapour enhancement                  and Bucci, 2020), these hydrated parcels could, in principle,
peaking at the 399 K level, which corresponds to F2 of the               have recirculated twice before being sampled by the aircraft.
warm/wet mode (see Sect. 5.1 for detailed analysis of this
flight), and for a smaller enhancement at 403 K, correspond-
                                                                         4.2    Geographical distribution of convective sources
ing to F7 (see Sect. 5.2). The results for the individual flights
are provided in Fig. S3. The hydrated features (layers of en-            Figure 5 shows the composite map of convective clouds
hanced water vapour, exceeding 1-σ of the campaign ensem-                (highest cloud classes), which are linked by trajectories
ble) are denoted throughout the article as Ax or Bx, where x             with the observed hydrated and isotopically enhanced wet-
is the flight number.                                                    and-heavy parcels and thereby represent the most probable
   The elevated convective hits fraction is also characteristic          sources of the convectively processed CLS air sampled by
to the driest bins between 370–400 K, corresponding to F8                the aircraft. The wet-and-heavy parcels are defined as those

Atmos. Chem. Phys., 22, 3169–3189, 2022                                                     https://doi.org/10.5194/acp-22-3169-2022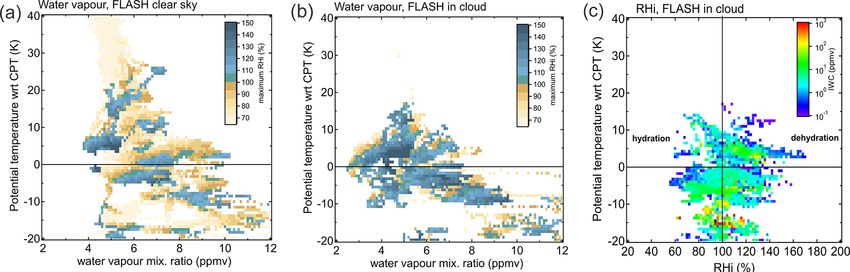
S. M. Khaykin et al.: Persistence of moist convective plumes in the lower stratosphere                                                  3177

Figure 4. Binned ensemble (bin size 0.1 ppmv by 1 K) of FLASH H2 O measurements from all flights except F1 and F5 for which no
isotopic data are available. The pixels are colour-coded by (a) convective hits fraction (see text for details) and (b) the ChiWIS HDO/H2 O
isotopic ratio. The black solid and dashed curves depict campaign-median H2 O profile and 1 standard deviation respectively (all flights). The
horizontal dashed lines mark the vertical range of the CPT level encountered during the campaign. Note that the convective origin is specific
to both anomalously wet and anomalously dry parcels (a), whereas the wettest parcels in the lower stratosphere are isotopically enhanced (b).

located above the local CPT with water mixing ratios ex-                 convective hits and wet-and-heavy parcels as compared with
ceeding 1 standard deviation from the median (dashed curve               the product used by Bucci et al. (2020).
in Fig. 4b) at a given potential temperature level and with                 While the warm/wet mode flights were largely influenced
isotopic ratios above −400 ‰ (except for F1 and F5 where                 by convection in the northeastern part of the AMA, the wet-
the HDO measurements are not available and the selection                 and-heavy parcels sampled during flights F5–F7 are sourced
is done based on H2 O only). The fraction of wet-and-heavy               to various different locations. A large convective system over
parcels to all parcels sampled above the local CPT varies                northeastern India in the vicinity of the flight on the same day
from 0.5 % (F6) to 11 % (F2) between the different flights.              is responsible for the hydration feature in F6 at the 380 K
No wet-and-heavy parcels have been detected in F8, which                 level. The convective source of the wet air sampled by F5
is why it is not displayed in Fig. 5.                                    is found above western India, although we note that no iso-
   The composite map suggests a broad geographical scatter               topic data are available for this flight, whereas the number of
of the convective clouds across the Asian anticyclone. The               parcels with a mixing ratio exceeding 1 standard deviation is
lifetime of hydrated parcels, as inferred from the back tra-             small for this flight. In flight F7, the enhanced water vapour
jectories, ranges from ∼ 12 h (F6) to about 12.7 d (F7) (see             features above 400 K (A7 and B7; see Sect. 5) originate from
Fig. S4 for convective age in individual flights). The wet-              two different sources: the lower-level feature (A7) is traced
and-heavy parcels sampled during the warm/wet mode (F1                   back to a group of relatively small systems along the eastern
through F4) originate from various convective systems in                 Chinese coast that occurred 3.9 d before the measurement,
northeastern China and the Korean Peninsula, all of them oc-             whereas the upper one (B7) originates from a large cluster of
curring north of 35◦ N. The convective age for these parcels             small-scale convective systems in the centre of the Asian an-
varies between 2.6 and 9.9 d. Sensibly, the shortest age cor-            ticyclone above the northern foothills of the Himalayas. We
responds to the lower-height moist layer at the 390 K level              note that this particular region is marked by enhanced wa-
(F2), whereas the longest age is found for the wet-and-heavy             ter vapour amount according to MLS averages over the cam-
parcels detected as high as at 410 K in F4. The moist fea-               paign period (cf. Fig. 1b). The B7 parcels have thus followed
tures in the flight F2 (A2 and B2; see Sect. 5), found at 390            the anticyclonic circulation path for nearly a full loop before
and 399 K levels, are sourced to different convective events             arriving to the flight domain, which took 12.7 d.
that occurred 2.6 and 4.7 d before being sampled by the Geo-                The potential for a vapour-rich parcel travelling within
physica aircraft. We note that while the 1σ error of the age             the AMA CLS to permanently hydrate the stratosphere is
estimates is generally less than an hour, the attribution of             determined by the Lagrangian temperature history. We did
convective sources largely depends on the cloud top data.                not analyse the RHi variation along the trajectories; how-
In particular, the improved v2018.1 trajectory product cou-              ever, we quantified the minimum temperatures encountered
pled with NWC SAF geostationary data analysis provided                   across AMA using high-resolution GPS-RO profiling. As
a qualitatively better correlation between the distribution of           follows from Fig. 1a, the subtropical part of the AMA has
                                                                         never cooled below the H2 O saturation mixing ratios of

https://doi.org/10.5194/acp-22-3169-2022                                                  Atmos. Chem. Phys., 22, 3169–3189, 2022
3178 S. M. Khaykin et al.: Persistence of moist convective plumes in the lower stratosphere
Figure 5. Composite map of convective clouds (highest cloud class) linked by back trajectories with the observed hydrated (wet-and-heavy)
parcels. The colour of convective systems indicates the flight number (Fx; see legend) in which the respective parcels were sampled. The
same colour code is used to mark the flight segments where these parcels were probed. The convective age (days) is indicated for each
convective system. The convective sources for the features of interest in flight F2 (A2, B2, C2*) and F7 (A7, B7) are annotated (see Sect. 5).
The arrows are wind velocity vectors (ERA5, 70–100 hPa average).
around 8 ppmv in July–August 2017, enabling the vapour- 5 Long-range transport and evolution of moist
rich patches to travel along the northern flank of the anti- convective plumes
cyclone without freezing. Remarkably, the majority of con-
vective systems identified as the most probable sources of The hydrated layers in the CLS characteristic of elevated
wet-and-heavy parcels (shown in Fig. 5 and marked by black convective hits fraction and/or isotopic enhancement (wet-
pixels in Fig. 1a) have occurred within the warm tropopause and-heavy) were detected at altitudes between 16.9–19.0 km
environment in the northern subtropical part of AMA. (380–415 K) in all the flights except F8, with the magni-
It is noteworthy that the probed wet-and-heavy parcels tude of water vapour mixing ratio enhancement between 0.9–
(shown along the flight tracks in Fig. 5) are all located in the 5 ppmv (see Fig. S3). The largest enhancement (5 ppmv) was
northernmost part of the flight domain, i.e. nearer the centre observed in F2 at 399 K (B2 feature), whereas the highest al-
of the AMA. This is consistent with the spatial distribution titude of hydrated layer centred at 18.9 km (411 K) was sam-
of AMA CLS water vapour inferred from MLS (Fig. 1b), pled in F7 (B7 feature). The flights F2 and F7 represent re-
showing the maxima above the Tibetan Plateau and Sichuan spectively warm/wet and cold/dry modes (see Sect. 3); how-
region, which is around the centre of the anticyclone. With ever, in both of these flights the observed moist layers origi-
that, the air circulating near the outer edge of the anticyclone nated from distant convective events. In this section, we pro-
is bound to pass the colder TTL above central India and the vide further insight into the results of F2 and F7 and describe
southern slopes, where the organized large-scale convection the evolution of the respective moist convective plumes using
occurring during the second part of the campaign (cf. Fig. 1) airborne and satellite measurements.
has led to cooling and dehydration around the CPT level. The
efficiency of the convectively induced dehydration, counter-
acting with the convective moistening in the warmer TTL 5.1 Warm and wet mode: flight F2
regions of the AMA, is considered on a case-by-case basis in During the warm/wet mode period, the mean CPT-level wa-
the next section. ter vapour mixing ratio was 7.2 ppmv, whereas the minimum
saturation mixing ratio ranged from 5.5 to 6.9 ppmv, accord-
ing to the airborne data (Fig. 2). During F2, the aircraft was
cruising side to side along the Himalayan foothills within
Nepali borders, gaining altitude in 500 m steps before climb-
ing to 21 km (Fig. 6c). The water vapour vertical profile in
Atmos. Chem. Phys., 22, 3169–3189, 2022 https://doi.org/10.5194/acp-22-3169-2022S. M. Khaykin et al.: Persistence of moist convective plumes in the lower stratosphere 3179
Figure 6. Results of F2 measurements (29 July) with the features of interest marked A2, B2 and C2. (a) Water vapour profile (FLASH)
colour-coded by convective hits density (see text for details). (b) Same as panel (a) but colour-coded by the ChiWIS HDO/H2 O isotopic
ratio. The black solid and dashed curves depict the campaign-median H2 O profile and 2 standard deviations respectively. (c) Time series of
flight altitude (black curve), water vapour (colour-coded by convective hits density) and RHi (right-hand axis) computed from FLASH and
TDC measurements. The colour map shows the scattering ratio measured by MAL (upward-looking).
Fig. 6a and b reveals two layers above the CPT (marked A2 5 d, the convective plume responsible for B2 feature has re-
and B2) with the water mixing ratio peaking at 10.2 ppmv, tained such an amount of moisture.
twice the campaign-median value at the CPT level. It should The underlying wet layer (A2) at ∼ 390 K (∼ 17.5 km)
be noted that all the three airborne hygrometers report iden- is traced back to a different convective event ageing 2.4 d
tical spatial structures and absolute values of humidity for (cf. Fig. 5). However, given that the magnitude of enhance-
these layers, providing full confidence in this observation ment is nearly the same as that of its upper-level twin, it is
(see Fig. 3 in Singer et al., 2022). conceivable that both A2 and B2 represent the outflow of the
The upper layer (B2) topping at 399 K (∼ 18 km) is char- same convective event in northeastern China, and the lower-
acterized by a very large fraction of convective hits reach- level A2 feature is a result of gravitational settling of ice crys-
ing 0.9 (Fig. 6a) with an average age of 4.7 d (cf. Fig. 5). tals shortly after injection.
The convective origin of B2 is unambiguously confirmed by
a strong enhancement in the HDO/H2 O ratio of −340 ‰. Secondary cloud formation
This is substantially higher than the isotopic ratio found for
the equivalent-humidity air below the CPT (about −480 ‰ For an air parcel at 82 hPa bearing 10 ppmv of water vapour
at the 373 K level). The enhanced isotopic ratio in this layer (as reported for B2), the saturation is achieved at −78.5 ◦ C.
clearly indicates that the water vapour enhancement was pro- The B2 feature was characterized by the maximum RHi of
duced by sublimation of ice. It is remarkable that after nearly 116 % (Fig. 6c) at −79 ◦ C. At these conditions, a local cool-
ing of 2 ◦ C, which can be produced by a gravity wave (e.g.
https://doi.org/10.5194/acp-22-3169-2022 Atmos. Chem. Phys., 22, 3169–3189, 20223180 S. M. Khaykin et al.: Persistence of moist convective plumes in the lower stratosphere
Kim and Alexander, 2015), would boost the RHi to 165 %.
This corresponds to the homogeneous freezing threshold at
this temperature; hence, such a cooling would almost cer-
tainly lead to formation of a secondary cloud. Such a cloud
was detected by the upward-looking MAL at 18–18.5 km
(398–412 K) in F2 with the maximum scattering ratio of 8.1
(marked C2 in Fig. 6c).
Interestingly, the bottom of this cloud is found at the same
potential temperature level as the hydrated layer B2 and only
about 350 km away from it. Nevertheless, these features ap-
pear to have different convective sources. Figure 7a shows
the back trajectories released from this cloud intersecting a
large convective system above northeast China (as indicated
by red circles with black filling) on 21 July, which is 8 d be-
fore F2. The fraction of trajectories intersecting this convec-
tive system amounts to 47 %. In an attempt to investigate the
evolution of humidity of this air mass, we searched for the
MLS swaths collocated in space and time (within 500 km and
1 h) with the tracked parcels. A perfect match was found on
24 July: the MLS swath lies precisely across the cluster of
the tracked parcels as shown in Fig. 7b. The nearest MLS
profile reports 8 ppmv at the parcel level, which is 2–3 ppmv
wetter than the neighbouring measurements along the same
orbit. This suggests that the moist plume remained compact
(at least in the meridional plane) up to 3 d after the convective
event.
The Lagrangian temperature history of this air mass
(Fig. 7c) suggests that since the convective encounter, the
parcels remained subsaturated most of the time and, in par-
ticular, during the collocated measurement by MLS. The
RHi was estimated from the ERA5 temperature and pressure
along the back trajectories, whereas the mixing ratio was as-
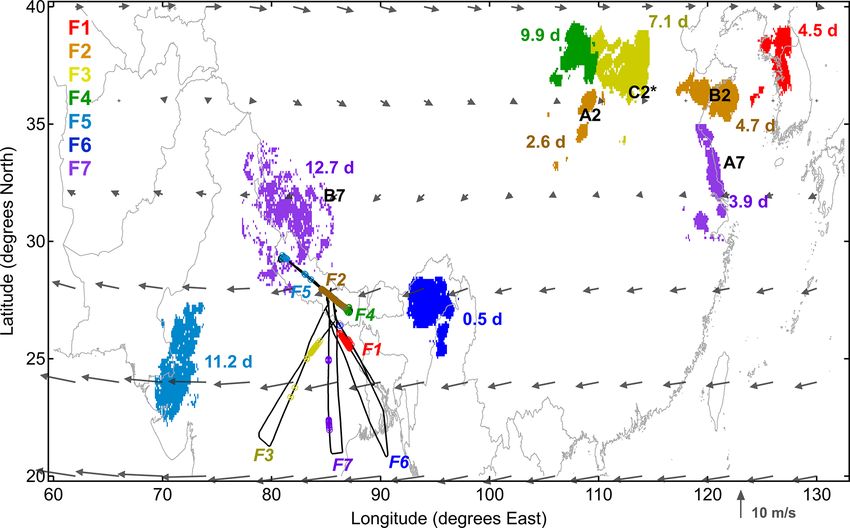
Figure 7. Trajectory analysis of the secondary cloud (C2) detected
sumed to be constant at 12 ppmv. The episodes of moder-
in F2 (29 July). (a) Back trajectories (green curves) and convec-
ate supersaturation with RHi reaching 140 % were encoun-
tive hits locations (black-filled red circles) superimposed onto the
tered between about 144 and 170 h before the sampling, and infrared brightness temperature (IR BT) at the time of convective
it is conceivable that cirrus could have formed around that hits (cf. time stamp in the panel). (b) Same as panel (a) but for the
time, with some water lost to sedimentation. However, the time of the MLS sampling of the moist plume. The spatiotemporally
episodes of strong supersaturation with RHi reaching the ho- collocated MLS swath is displayed as markers colour-coded by the
mogeneous freezing threshold were encountered only during H2 O mixing ratio at the 393 K level. The wettest MLS measure-
the last day before the measurement, when the parcels were ment coincides with the location of hydrated parcels. (c) Relative
entering the colder CLS above the southern slopes. The RHi humidity over ice evolution along the back trajectories with colour
along the back trajectories during the last day reached 160 %, coding by potential temperature computed from ERA5 temperature
which would enable ice nucleation and repartitioning of the and assumed H2 O mixing ratio of 12 ppmv (see text for details). The
black markers show the locations of convective hits, and the vertical
excessive vapour into a secondary cloud.
dashed line indicates the time of MLS sampling of the moist plume
on 24 July.
5.2 Cold and dry mode: flight F7
The cold/dry mode was marked by a synoptic-scale cool-
ing throughout the 370–400 K layer extending across the potential temperature is marked with ice particle occurrence
CPT. The largest vertical extent of the cold layer was ob- detected by MAS, which shows the presence of subvisible
served in F7, where the saturation mixing ratio dropped be- cirrus clouds (colour tagging) with a scattering ratio below 6
low 4 ppmv throughout the 370–397 K layer (cf. Fig. 2b). extending up to the 400 K level.
The northbound flight leg of F7 (see flight track in Fig. S1) The water vapour time series in Fig. 8a reveals a remark-
included several porpoises across the CPT level (varying be- ably large horizontal variation of mixing ratio in this layer,
tween 375–383 K) as shown in Fig. 8a. The time series of spanning 3.0 to 6.2 ppmv on a horizontal scale of 100 km.
Atmos. Chem. Phys., 22, 3169–3189, 2022 https://doi.org/10.5194/acp-22-3169-2022S. M. Khaykin et al.: Persistence of moist convective plumes in the lower stratosphere 3181
Figure 8. Results of F7 measurements (8 August) with the features of interest marked A7 and B7. (a) Time series of potential temperature
θ (left-hand axis) and water vapour/total water (right-hand axis). The θ time series is tagged by cloud occurrence and colour-coded by
the scattering ratio. The IWC is shown as cyan shading stacked on the water vapour curve, and the darker cyan curve depicts the total
water (right-hand axis). The dashed magenta line depicts the saturation mixing ratio (right-hand axis). The CPT level displayed as the black
dashed line is inferred from airborne measurements. (b) Vertical profiles of water vapour (black circles), total water (cyan) and IWC (cyan
shading). The red dashed curve indicates the mean water vapour profile from the previous flights (F1–F6). (c) Binned water vapour profile
with pixels colour-coded by the HDO/H2 O isotopic ratio. The black solid curve depicts the campaign-median H2 O profile, and the dotted
curves represent 2 standard deviations respectively.
Almost the entire CPT-porpoising segment of F7 shown in crystals were produced by overshooting as suggested by Lee
Fig. 8a (20 000–22 200 s) is supersaturated with RHi reach- et al. (2019) for this particular flight.
ing 155 %, whereas the water vapour variation follows the Above the layer of thin cirrus reaching the 400 K level, the
saturation mixing ratio with a high degree of correlation water vapour profiles in F7 reveal two enhancements, marked
(r = 0.97). The occurrence of ice particles detected by MAS in Fig. 8 as A7 and B7. The B7 feature is characterized by a
is reflected by enhancements in IWC shown as blue shading maximum enhancement of 1.9 ppmv at 410 K in a layer ex-
in Fig. 8a and b. The magnitude of IWC enhancements (up tending between 405–415 K (18.5–19 km). Both A7 and B7
to 3.3 ppmv) is comparable to the magnitude of water vapour moist features are characteristic of significant isotopic en-
reduction, which suggests that these ice crystals have formed hancement (Fig. 8c), whereas the B7 is also marked by an
in situ as a result of synoptic-scale CPT cooling. Indeed, as enhanced fraction of convective hits (cf. Figs. 4a and S3).
shown in Fig. 8b, the total water does not exceed the back- From the convective sources’ analysis in Sect. 4.2, we know
ground level represented by the mean water vapour from the that the hydrated feature B7 has a convective age of 12.7 d,
previous flights. It is however still possible that some of these during which the moist convective plume has made a nearly
complete circle within the AMA. During this time, the mix-
https://doi.org/10.5194/acp-22-3169-2022 Atmos. Chem. Phys., 22, 3169–3189, 2022You can also read