The Transthyretin/Oleuropein Aglycone Complex: A New Tool against TTR Amyloidosis - MDPI

Page created by Lewis Schneider
 
CONTINUE READING
The Transthyretin/Oleuropein Aglycone Complex: A New Tool against TTR Amyloidosis - MDPI
pharmaceuticals

Article
The Transthyretin/Oleuropein Aglycone Complex: A New Tool
against TTR Amyloidosis
Francesco Bemporad                  , Manuela Leri * , Matteo Ramazzotti                , Massimo Stefani and Monica Bucciantini

                                          Department of Experimental and Clinical Biomedical Sciences “Mario Serio”, University of Florence,
                                          Viale Morgagni 50, 50134 Florence, Italy; francesco.bemporad@unifi.it (F.B.); matteo.ramazzotti@unifi.it (M.R.);
                                          massimo.stefani@unifi.it (M.S.); monica.bucciantini@unifi.it (M.B.)
                                          * Correspondence: manuela.leri@unifi.it

                                          Abstract: The release of monomers from the homotetrameric protein transthyretin (TTR) is the first
                                          event of a cascade, eventually leading to sporadic or familial TTR amyloidoses. Thus, ligands able
                                          to stabilize TTR and inhibit monomer release are subject of intense scrutiny as potential treatments
                                          against these pathologies. Here, we investigated the interaction between TTR and a non-glycated
                                          derivative of the main olive polyphenol, oleuropein (OleA), known to interfere with TTR aggregation.
                                          We coupled fluorescence studies with molecular docking to investigate the OleA/TTR interaction
                                          using wild-type TTR, a monomeric variant, and the L55P cardiotoxic mutant. We characterized a
                                          fluorescence band emitted by OleA upon formation of the OleA/TTR complex. Exploiting this signal,
                                          we found that a poorly specific non-stoichiometric interaction occurs on the surface of the protein
                                          and a more specific stabilizing interaction takes place in the ligand binding pocket of TTR, exhibiting
                                          a KD of 3.23 ± 0.32 µM, with two distinct binding sites. OleA interacts with TTR in different modes,
                                          stabilizing it and preventing its dissociation into monomers, with subsequent misfolding. This
                                result paves the way to the possible use of OleA to prevent degenerative diseases associated with
         
                                          TTR misfolding.
Citation: Bemporad, F.; Leri, M.;
Ramazzotti, M.; Stefani, M.;
                                          Keywords: transthyretin; polyphenols; systemic amyloidosis; misfolding
Bucciantini, M. The Transthyretin/
Oleuropein Aglycone Complex: A
New Tool against TTR Amyloidosis.
Pharmaceuticals 2022, 15, 277.
https://doi.org/10.3390/
                                          1. Introduction
ph15030277                                      Transthyretin (TTR), also known as prealbumin, is a 55 KDa circulating protein pro-
                                          duced by liver and, to a lesser extent, by choroid plexus, with a well-established role in
Academic Editor: Kwang-Won Lee
                                          the transport of thyroxine (T4) and retinol in the plasma and the cerebrospinal fluid [1].
Received: 26 January 2022                 Structurally, TTR is a homotetramer, where the four monomers are assembled with a 2:2:2
Accepted: 21 February 2022                symmetry resulting in a dimer of dimers. In each dimer, monomer interaction is stabilized
Published: 23 February 2022               through H-bonds involving the two-edge H and F β-strands; the back-to-back association
Publisher’s Note: MDPI stays neutral      of the two dimers is stabilized by a limited number of contacts, giving rise to two symmet-
with regard to jurisdictional claims in   rical binding sites for T4, at the dimer–dimer interface [2]. According to computational
published maps and institutional affil-   analysis, human TTR possesses a relatively high intrinsic propensity to β-aggregation [3],
iations.                                  and such a propensity is strongly enhanced in a set of genetic TTR variants as a result of a
                                          destabilization of the native TTR structure [4].
                                                Presently, over 130 TTR gene mutations have been associated with pathological phe-
                                          notypes, with autosomal dominant inheritance [5–8]. Under proper conditions, wild-type
Copyright: © 2022 by the authors.         TTR (wt-TTR) or TTR variants polymerize into amyloid fibrils in vivo, similarly to over
Licensee MDPI, Basel, Switzerland.        30 other known peptides/proteins involved in different amyloid diseases. Most of the
This article is an open access article    reported TTR mutations result in loss of tetramer stability, with tetramer dissociation into
distributed under the terms and
                                          misfolded monomers and dimers that undergo aberrant partial refolding with generation
conditions of the Creative Commons
                                          of amyloidogenic intermediates [9]. Importantly, a strong correlation does exist between
Attribution (CC BY) license (https://
                                          the thermodynamic/kinetic stability of TTR variants and their propensity to grow into
creativecommons.org/licenses/by/
                                          misfolded, soluble and insoluble aggregates [10,11]. Considering the importance of TTR
4.0/).

Pharmaceuticals 2022, 15, 277. https://doi.org/10.3390/ph15030277                                      https://www.mdpi.com/journal/pharmaceuticals
The Transthyretin/Oleuropein Aglycone Complex: A New Tool against TTR Amyloidosis - MDPI
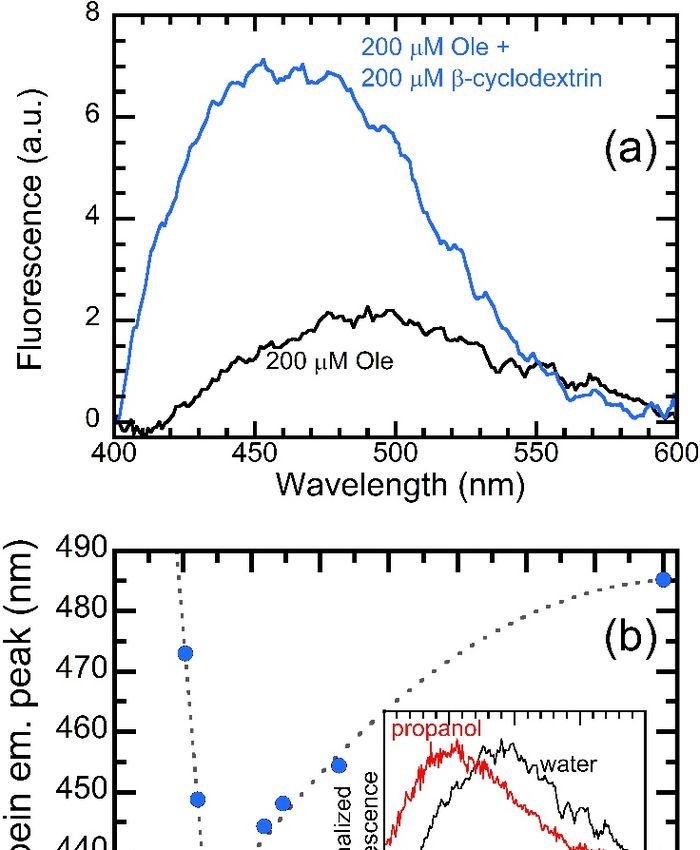
Pharmaceuticals 2022, 15, 277                                                                                             2 of 17

                                tetramer stability and the structure of the monomer, an engineered monomeric variant
                                of TTR (M-TTR) has been generated. M-TTR is a F87M/L110M double mutant rationally
                                designed to modify the monomer–monomer interface, such that tetramer formation under
                                physiological conditions is hindered [12].
                                      The different forms of senile or familial systemic TTR amyloidosis (A-TTR) are charac-
                                terized by the presence, in the affected tissues/organs, of extracellular deposits of amyloid
                                fibrils composed of TTR polymers. A-TTR include senile systemic amyloidosis (SSA), famil-
                                ial amyloid cardiomyopathy (FAC), familial amyloid polyneuropathy (FAP), and central
                                nervous system selective amyloidosis (CNSA). SSA is a common, age-related, amyloidosis
                                characterized by the accumulation of wt-TTR fibrils [1], predominantly in the heart and, to a
                                lesser extent, in other organs [13,14]. Depending on the type of A-TTR, the clinical features
                                of these pathologies include a diffuse polyneuropathy, a severe form of cardiomyopathy, or
                                severe neurological symptoms; the latter include seizures, stroke-like episodes, dementia,
                                psychomotor deterioration, hydrocephalus, spinal cord infarction, and variable amyloid
                                deposition in the vitreous humor. In addition to the peripheral nerves and the myocardium,
                                pathological amyloid deposits of TTR are detected in the walls of leptomeningeal vessels
                                and the surrounding connective tissue structures, as well as in the pia arachnoid and sub-
                                pial region, with risk of cerebral infarction and, in later stages, cerebral hemorrhage [5,15].
                                In particular, a severe form of FAP, characterized by early-onset and rapid progressive
                                amyloidosis with severe cardiac involvement (FAC), results from amyloid deposits in the
                                heart parenchyma of a number of mutants, particularly the highly amyloidogenic Leu55Pro
                                (L55P) mutant [16–18].
                                      A-TTR are severe diseases due to the substantial lack of effective therapies other than
                                symptomatic ones, and also since their progression is already in an advanced stage when
                                their signs and symptoms appear. In addition, the increased aging of the population poten-
                                tially fosters the cases of amyloidosis involving wt-TTR (SSA). Accordingly, if coupled to
                                the pharmacological tools presently available, early diagnosis and prevention are important
                                to slow disease progression and to improve its prognosis.
                                      Recently, different approaches targeting amyloid deposits and interfering with organ
                                damage have been developed that are being tested in clinical trials (see later). The results
                                of these ongoing trials, together with a better understanding of the amyloidogenic process
                                and an improved knowledge of the mechanisms of organ damage, will help to establish
                                the role of novel agents and to identify potential alternative therapeutic targets.
                                      The usefulness of exploiting stabilizers of the tetrameric structure of TTR avoiding
                                its disassembly has led us, in recent years, to develop molecules, such as diflunisal and
                                Tafamidis, that associate with and stabilize TTR by occupying the central cavity of the
                                tetramer normally designed to harbor T4. Preclinical studies and clinical trials have
                                supported the protection by these molecules against disease occurrence [19]. Diflunisal
                                is an off-label treatment option whose use has limitations due to its non-steroidal anti-
                                inflammatory drug (NSAID) properties [20]. Tafamidis stabilizes both wt-TTR and 14 TTR
                                variants clinically tested, as well as 25 TTR variants tested ex vivo [21]. Presently, Tafamidis
                                is the first Food and Drug Administration (FDA) and European Medicines Agency (EMA)-
                                approved targeted treatment for TTR cardiomyopathy (ATTR-CM). More recently, other
                                molecules have been developed; these include AG10, a small molecule TTR stabilizer [22],
                                and PRX004, the first investigated intravenous immunotherapy drug for treatment of
                                A-TTR (https://clinicaltrials.gov/ct2/show/NCT03336580; accessed on 20 January 2022).
                                Patisiran and Inotersen are silencers of TTR mRNA that have been approved by FDA
                                for TTR polyneuropathy. These molecules work to prevent translation and to reduce
                                TTR production by hepatocytes [23]. Patisiran is a small interfering RNA (siRNA) that
                                targets the 30 untranslated region of TTR mRNA, causing TTR mRNA degradation through
                                RNA interference [24]. Inotersen reduces TTR production by binding to TTR mRNA, with
                                ensuing reduction in serum TTR levels and TTR deposits in tissues (https://www.ema.
                                europa.eu/en/medicines/human/EPAR/tegsedi; accessed on 20 January 2022). Other
                                molecules able to interfere with TTR production, unfolding, and aggregation presently
The Transthyretin/Oleuropein Aglycone Complex: A New Tool against TTR Amyloidosis - MDPI
Pharmaceuticals 2022, 15, 277                                                                                             3 of 17

                                under investigation include TTR fibril disrupters such as doxycycline, which target amyloid
                                deposits to prevent further tissue damage [23].
                                      In this context, several natural polyphenols have been reported to interfere with the
                                misfolding of several amyloidogenic proteins and to inhibit their aggregation into amyloid.
                                In particular, attention has been focused on some flavonoids [25] and natural polyphenols
                                in relation to their ability to bind and to stabilize TTR, hindering its fibrillization. The most
                                investigated plant polyphenols include resveratrol [26], curcumin [27], epigallocatechin
                                3-gallate (EGCG) [28], and more recently, oleuropein aglycone (OleA), the main phenolic
                                component of the extra virgin olive oil [29]. Notably, an EGCG preparation (GTE) is a
                                nonpharmacological option that is used for the treatment of ATTR-CM [23].
                                      Most of the studies reported above have shown that all these compounds stabilize
                                TTR and inhibit its aggregation by strongly suppressing tetramer dissociation, maintain-
                                ing protein solubility [28,29], or alternatively, by inducing TTR oligomerization into a
                                homogeneous population of small off-pathway non-toxic aggregates [30]. We previously
                                reported that OleA does not inhibit aggregation of both wt-TTR and L55P-TTR; rather, it
                                reduces the exposure of protein aromatic residues during the amyloidogenic process. We
                                found that the presence of OleA during non-native aggregation under acid conditions of
                                wt-TTR and L55P-TTR induced an increase in Trp quenching; this finding suggests that the
                                stabilization by OleA of meta-stable misfolded intermediates of TTR relies on the reduction
                                in their surface hydrophobicity. Overall, the data reported suggest that OleA induces some
                                remodeling of the supramolecular structure of the growing aggregates [29].
                                      Although our previous work highlighted the ability to alter aggregation exerted by
                                OleA, those data were collected under non-physiological acidic conditions. Consequently,
                                in the present study, we further investigated the TTR-OleA relation by analyzing in depth
                                the native interaction between OleA and different forms of TTR (wt-TTR, L55P-TTR and
                                M-TTR) under physiological conditions to improve the knowledge, at a molecular level,
                                of both the anti-amyloidogenic activity of this polyphenol and the underlying molecular
                                mechanisms. These aspects are of great importance to assess the possible use of this
                                plant polyphenols as natural TTR stabilizers to prevent the onset of different sporadic
                                and familial TTR amyloidosis. Indeed, a deeper knowledge of the OleA-TTR interaction
                                is a prerequisite to devise new therapeutic strategies aimed at exploiting these natural
                                compounds, alone or in combination with other molecular treatments, to prevent A-TTR
                                and other amyloid-associated diseases.

                                2. Results
                                2.1. Molecular Docking of Polyphenols to Native TTR
                                      We carried out molecular docking experiments to explore the possible ability of small
                                molecules, namely Oleuropein (Ole), Oleuropein aglycone (OleA), T4, and resveratrol,
                                to bind the crystal structure of the biologically active wt-TTR and its mutant L55P-TTR.
                                Autodock-Vina was asked to suggest the 20 best poses showing a difference of at most
                                3 Kcal/mol from the best and the worst pose. In a free-to-bind (i.e., not indicating a
                                specific docking area) experiment, T4 was correctly located into the already-described C2
                                symmetric funnel-shaped T4 binding site at the dimer–dimer interface (Figure 1), with
                                a binding energy of −5.9 Kcal/mol. The interaction of resveratrol in the same site was
                                even stronger (−6.3 Kcal/mol). On the contrary, the best pose of Ole was not in the main
                                funnel; rather, it was localized in the secondary funnel, identified as the halogen binding
                                site [31]. However, removal of the sugar moiety from Ole led OleA to interact with the
                                main funnel very strongly (−7.7 Kcal/mol), thus displaying the highest affinity in this
                                experimental set-up.
                                      We then repeated the docking simulation by specifically testing the penetration
                                into, and the binding to, the main funnel of the investigated molecules. T4 penetrated
                                deeper in the funnel than in the previous setup, although with a lower interaction energy
                                (−5.0 Kcal/mol). The opposite behavior was observed when studying resveratrol, which
                                penetrated less deeply but with a stronger interaction energy (−7.6 Kcal/mol). Ole in-
The Transthyretin/Oleuropein Aglycone Complex: A New Tool against TTR Amyloidosis - MDPI
Pharmaceuticals 2022, 15, 277                                                                                                 4 of 17

Pharmaceuticals 2022, 15, x FOR PEER REVIEW
                                     teraction in the tested main funnel was deep and with a docking energy slightly lower
                                         than resveratrol (−7.4 Kcal/mol). Again, OleA exhibited the highest interaction energy
                                         (−8.1 Kcal/mol).

                                         Figure 1. Orthogonal side views of the TTR tetramer binding OleA in the best (most stable) pose, as
                                        Figure  1. Orthogonal side views of the TTR tetramer binding OleA in the best (most stab
                                         determined by molecular docking experiments performed with Autodock-Vina.
                                        determined by molecular docking experiments performed with Autodock-Vina.
                                                 Given the cooperative nature of T4 binding to TTR, we also checked whether the
                                          previously   tested,
                                                 We then       ligand-freethe
                                                             repeated        TTRdocking
                                                                                   was not sufficiently
                                                                                              simulation prepared  to host ligandstesting
                                                                                                             by specifically       (considering
                                                                                                                                           the penetr
                                          that, during docking, the involved part of the protein is considered as a rigid body).
                                        and     the binding
                                          Therefore,   we repeatedto,the
                                                                       theexperiments
                                                                             main funnel with aof  the investigated
                                                                                                 different                 molecules.
                                                                                                           crystal structure              T4the
                                                                                                                              of TTR, where  penetrat
                                        inmain
                                            thefunnel
                                                   funnelwasthan     in the
                                                              originally       previous
                                                                           bound              setup,thealthough
                                                                                   to T4, allowing                  with
                                                                                                        protein to be       a lower
                                                                                                                       considered      interaction
                                                                                                                                   in an “open”    en
                                          state. We prepared
                                        Kcal/mol).               this new experiment
                                                         The opposite         behavior   bywas
                                                                                             removing   T4 fromwhen
                                                                                                  observed      the main   funnel andresveratrol,
                                                                                                                         studying      repeated    wh
                                          the analysis as before. This time, all tested molecules spontaneously (i.e., without targeting)
                                        trated less deeply but with a stronger interaction energy (−7.6 Kcal/mol). Ole i
                                          docked into the main funnel, and OleA displayed the highest affinity (−8.8 Kcal/mol),
                                        infollowed
                                            the tested     main funnel
                                                      by resveratrol    (−6.9 was    deep T4
                                                                               Kcal/mol),    and(−with    a docking
                                                                                                   6.3 Kcal/mol),    andenergy
                                                                                                                         Ole (−6.0slightly  lower tha
                                                                                                                                     Kcal/mol).
                                        trol
                                          Thus,(−7.4
                                                  whenKcal/mol).       Again,
                                                        tested in silico,         OleA exhibited
                                                                          OleA exhibits   an affinity forthe
                                                                                                          thehighest    interaction
                                                                                                              TTR binding               energy (−8.1 K
                                                                                                                             pocket comparable
                                          to, if Given
                                                 not higher  than,  the  affinities displayed   by other  known   ligands.
                                                          the cooperative nature of T4 binding to TTR, we also checked wh
                                        previously
                                         2.2. Excitationtested,
                                                         −Emissionligand-free
                                                                    Matrices      TTR was not sufficiently prepared to host ligand
                                        eringWethat,
                                                  thenduring     docking,
                                                        investigated          the involved
                                                                       the OleA-wt-TTR          part of
                                                                                          interaction     the protein
                                                                                                       in vitro            is considered
                                                                                                                by recording   fluorescence as a ri
                                        Therefore,     we repeated
                                         emission–excitation   matrices,the
                                                                          usingexperiments       with a different
                                                                                fluorescence wavelengths                crystal
                                                                                                              in the 280–340   nm structure
                                                                                                                                   range for of TT
                                         excitation and in the 350–600 nm range for emission. Figure 2 shows that the excitation–
                                        the main funnel was originally bound to T4, allowing the protein to be consid
                                         emission matrix of OleA alone did not reveal detectable fluorescence emission; the matrix
                                        “open”
                                         obtainedstate.     We prepared
                                                    for wt-TTR   displayed the this  newfluorescence
                                                                                 intrinsic  experiment        by removing
                                                                                                          typical                T4 from the ma
                                                                                                                   of a buried tryptophan
                                        and
                                         uponrepeated
                                               excitation inthe
                                                             the analysis
                                                                 280–310 nmas    before.
                                                                              range, namely This   time,
                                                                                              a band       all at
                                                                                                     centered   tested
                                                                                                                   335 nmmolecules       spontaneo
                                                                                                                           and no emission
                                         at higher targeting)
                                        without     wavelengths docked
                                                                   (Figure 2b). Interestingly,
                                                                             into   the mainwe      observed
                                                                                                 funnel,    anda different  behavior when
                                                                                                                   OleA displayed         the highe
                                         OleA and TTR were incubated together for 24 h at a concentration of 15 µM and 5.0 µM,
                                        (−8.8  Kcal/mol), followed by resveratrol (−6.9 Kcal/mol), T4 (−6.3 Kcal/mol), and
                                         respectively. In this case, a previously undetected signal appeared, located between 400
                                        Kcal/mol).
                                         and 450 nm.Thus,      when
                                                        This signal     tested
                                                                     could      inobserved
                                                                           not be   silico, OleA
                                                                                              whenexhibits
                                                                                                     OleA or TTRan affinity     for alone
                                                                                                                     were present   the TTRin bindi
                                        comparable
                                         solution, makingto,this
                                                             if not
                                                                 bandhigher    than,
                                                                       a possible      the affinities
                                                                                  candidate              displayed
                                                                                             to investigate             by other
                                                                                                             the interaction between known
                                                                                                                                       these ligan
                                         two species.
                                        2.2. Excitation−Emission Matrices
                                             We then investigated the OleA-wt-TTR interaction in vitro by recording flu
                                        emission–excitation matrices, using fluorescence wavelengths in the 280–340 nm
                                        excitation and in the 350–600 nm range for emission. Figure 2 shows that the e
                                        emission matrix of OleA alone did not reveal detectable fluorescence emission;
The Transthyretin/Oleuropein Aglycone Complex: A New Tool against TTR Amyloidosis - MDPI
Pharmaceuticals
Pharmaceuticals        2022,
                2022, 15, 27715, x FOR PEER REVIEW                                                                                                      5 of 18 5 of 17

                                     Figure    2. Excitation−emission matrices (EEM) in the 280–340 nm excitation range and in the
                                          Figure 2. Excitation−emission matrices (EEM) in the 280–340 nm excitation range and in the 350--
                                     350–600
                                          600 nmnmemission
                                                     emission   range.
                                                             range.  The The  samples
                                                                          samples   testedtested    were
                                                                                             were (a)      (a) (b)
                                                                                                       OleA,   OleA,  (b) wt-TTR,
                                                                                                                   wt-TTR,           and
                                                                                                                            and (c) the    (c) thewt-
                                                                                                                                        complex     complex
                                          TTR/OleA    incubated  at pH  7.0 and  37  °C    ◦
                                                                                         for  24 h. In all matrices, the white-colored
                                     wt-TTR/OleA incubated at pH 7.0 and 37 C for 24 h. In all matrices, the white-colored band on      band    on the
                                     the bottom
                                          bottomright   corner
                                                    right      corresponds
                                                          corner             to theto
                                                                   corresponds       harmonic    (double (double
                                                                                       the harmonic        wavelength)  of the incoming
                                                                                                                    wavelength)    of thelight, which light,
                                                                                                                                            incoming
                                          gives an intense signal that reaches the top-scale; the small yet detectable signal in the top left corner
                                     which gives an intense signal that reaches the top-scale; the small yet detectable signal in the top
                                          (emission–excitation coordinates going from 350–315 to 400–340 nm) corresponds to the Raman
                                     left scattering
                                          corner (emission–excitation
                                                     of water.              coordinates going from 350–315 to 400–340 nm) corresponds to the
                                     Raman scattering of water.
                                          2.3. Investigation of The Interaction Between OleA and wt-TTR
                                     2.3. Investigation of the Interaction between OleA and wt-TTR
                                                 Following our initial observation of a so far undetected fluorescence band in the 400–
                                         450 Following       our initial
                                                nm range emitted              observation
                                                                        by OleA                  of a so
                                                                                     in the presence     of far
                                                                                                            TTR,undetected
                                                                                                                   we sought tofluorescence
                                                                                                                                      exploit this signal bandtoin the
                                     400–450
                                         extractnm      range emitted
                                                    quantitative             by OleA
                                                                     information      aboutin the
                                                                                              theinteraction
                                                                                                   presence of     TTR, we
                                                                                                                between     thesought       to exploit
                                                                                                                                  two molecules.         In athis
                                                                                                                                                               firstsignal
                                     to extract
                                         experiment, quantitative
                                                           we evaluatedinformation         about the
                                                                             the fluorescence           interaction
                                                                                                    measured            between
                                                                                                                at a constant          the two molecules.
                                                                                                                                   concentration        of OleA, In a
                                     firstinexperiment,
                                              the presence of   weincreasing
                                                                    evaluated    concentrations     of wt-TTR.
                                                                                     the fluorescence              The fluorescence
                                                                                                             measured       at a constant  spectra,     reported
                                                                                                                                                  concentration         of
                                         in   Figure   3a, indicate    that  the   fluorescence    intensity   of  OleA   was
                                     OleA, in the presence of increasing concentrations of wt-TTR. The fluorescence spectra,     substantially      unaffected
                                         at protein
                                     reported           concentrations
                                                    in Figure               below that
                                                                  3a, indicate        0.1 µMthe(Figure   3a), whereas
                                                                                                 fluorescence            at protein
                                                                                                                    intensity           concentrations
                                                                                                                                   of OleA                     >0.1
                                                                                                                                                was substantially
                                         µM, the signal displayed two effects; first, the signal increased as the wt-TTR concentra-
                                     unaffected at protein concentrations below 0.1 µM (Figure 3a), whereas at protein concen-
                                         tion increased (Figure 3a). The total fluorescence emitted by OleA in the presence of 100
                                     trations >0.1 µM, the signal displayed two effects; first, the signal increased as the wt-TTR
                                         µM wt-TTR was 10.6 ± 1.5 times higher than the signal emitted in the presence of 10 nM
                                     concentration increased (Figure 3a). The total fluorescence emitted by OleA in the presence
                                         wt-TTR. Second, the signal displayed a blue shift that was more evident as the concentra-
                                     of 100
                                         tion µM      wt-TTR
                                                of wt-TTR          was 10.6
                                                               increased.    The±peak 1.5 times    higherofthan
                                                                                           wavelengths        OleAthe  weresignal
                                                                                                                              435 oremitted
                                                                                                                                        413 nm in   inthethepres-
                                                                                                                                                                presence
                                     of 10
                                         ence of 10 nM or 100 µM wt-TTR, respectively. To highlight this effect, we normalized theas the
                                              nM    wt-TTR.      Second,      the   signal    displayed     a blue    shift   that    was   more       evident
                                     concentration
                                         spectra to theofsignalwt-TTR      increased.
                                                                      emitted     at 420 nm  The   peak3b).
                                                                                               (Figure     wavelengths of OleA were 435 or 413 nm
                                     in the presence
                                                 To extractof     10 nM or 100
                                                               a dissociation            µM (K
                                                                                   constant    wt-TTR,
                                                                                                 D) value respectively.
                                                                                                           for the OleA-TTR     Tocomplex
                                                                                                                                      highlight  from thistheeffect,
                                                                                                                                                                flu- we
                                     normalized
                                         orescence the  data,spectra    to the
                                                                we plotted         signal
                                                                                total  OleA emitted    at 420vs.
                                                                                              fluorescence      nm    (Figure
                                                                                                                   wt-TTR         3b).
                                                                                                                              concentration        (Figure 3c).
                                         The Toresults
                                                  extract of this analysis confirmed
                                                             a dissociation         constant the (K
                                                                                                 increase   in the
                                                                                                    D ) value    forsignal
                                                                                                                       the observed
                                                                                                                             OleA-TTR      on increasing
                                                                                                                                               complex from     wt- the
                                         TTR     concentration.      However,       the  trace  obtained   did  not   reach   a
                                     fluorescence data, we plotted total OleA fluorescence vs. wt-TTR concentration (Figure 3c).plateau,    even     at  wt-TTR
                                     Theconcentrations
                                            results of this    in analysis
                                                                   the 10–100       µM range,the
                                                                                confirmed         theincrease
                                                                                                       maximum    in protein
                                                                                                                      the signal concentration
                                                                                                                                       observed we     on could
                                                                                                                                                             increasing
                                     wt-TTR concentration. However, the trace obtained did not reach a plateau, even atpa-
                                         reach     in our  experimental       setting.    Consequently,     we   could   not   extract    a quantitative          wt-TTR
                                         rameter from these data. When we considered the emission wavelength, a different trend
                                     concentrations in the 10–100 µM range, the maximum protein concentration we could reach
                                         was observed. In fact, the fluorescence spectra began to exhibit a significant blue shift at
                                     in our experimental setting. Consequently, we could not extract a quantitative parameter
                                         wt-TTR concentrations above 0.1 µM, and this shift reached a plateau starting from 40
                                     fromµM.  these    data.observe
                                                 We could        When awe        considered
                                                                            plateau               the either
                                                                                        by plotting    emission      wavelength,
                                                                                                              the center    of mass (COM) a different
                                                                                                                                                   or the trend
                                                                                                                                                              ratio was
                                     observed.
                                         between the fluorescence at 428 and 413 nm (Supplementary Figure S1). This trend is at
                                                     In  fact,  the  fluorescence       spectra    began   to  exhibit   a  significant      blue     shift   sug-wt-TTR
                                     concentrations
                                         gestive of a binding process that begins at protein concentrations above 0.1 µM and We
                                                             above     0.1  µM,     and    this  shift  reached      a plateau       starting     from      40   µM.
                                     could     observe
                                         reaches           a plateau
                                                      saturation         by plotting
                                                                    at protein              either theabove
                                                                                    concentrations        center40of   mass
                                                                                                                     µM.        (COM) or the
                                                                                                                           Consequently,          the ratio
                                                                                                                                                         data between
                                                                                                                                                                 re-
                                     the ported
                                           fluorescence
                                                    in Figure at3d
                                                                 428   andnormalized
                                                                    were     413 nm (Supplementary              Figurei.e.,
                                                                                            to the bound fraction,        S1).
                                                                                                                             theThis     trend
                                                                                                                                   fraction       is suggestive
                                                                                                                                              of OleA      bound of a
                                         to wt-TTR
                                     binding      processunder   a certain
                                                              that  beginscondition.
                                                                               at proteinWe      plotted the bound
                                                                                              concentrations       abovefraction
                                                                                                                             0.1 µM  vs. and
                                                                                                                                         protein     concentra-
                                                                                                                                               reaches        saturation
                                         tion (Figure
                                     at protein            3d) and fitted
                                                     concentrations            the data
                                                                           above     40 µM.to a Consequently,
                                                                                                binding equilibrium,        as reported
                                                                                                                     the data     reported   in in
                                                                                                                                                 theFigure
                                                                                                                                                       Methods   3d were
                                         section. The
                                     normalized         tooutcome
                                                            the bound  of this   analysisi.e.,
                                                                             fraction,       yielded
                                                                                                  the afraction
                                                                                                         KD valueof  of OleA
                                                                                                                        3.23 ± 0.32
                                                                                                                                 bound µM.to  Thus,
                                                                                                                                                  wt-TTRour data under a
                                     certain condition. We plotted the bound fraction vs. protein concentration (Figure 3d)
                                     and fitted the data to a binding equilibrium, as reported in the Methods section. The
                                     outcome of this analysis yielded a KD value of 3.23 ± 0.32 µM. Thus, our data show that it
                                     is possible to exploit the fluorescence emitted by OleA in the presence of wt-TTR to gauge
                                     affinity parameters.
The Transthyretin/Oleuropein Aglycone Complex: A New Tool against TTR Amyloidosis - MDPI
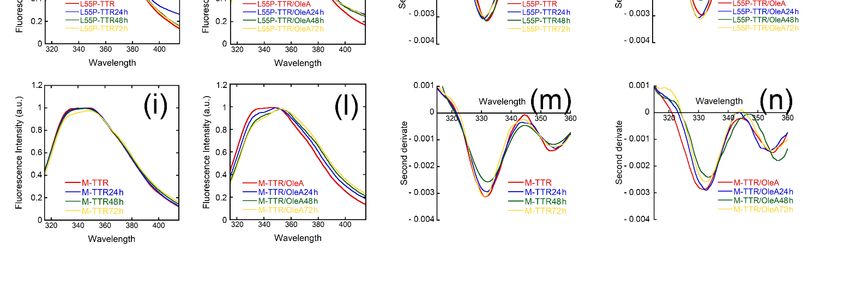
Pharmaceuticals 2022, 15, x FOR PEER REVIEW                                                                                6 of 18

Pharmaceuticals 2022, 15, 277                                                                                                                                             6 of 17
                                           show that it is possible to exploit the fluorescence emitted by OleA in the presence of wt-
                                           TTR to gauge affinity parameters.

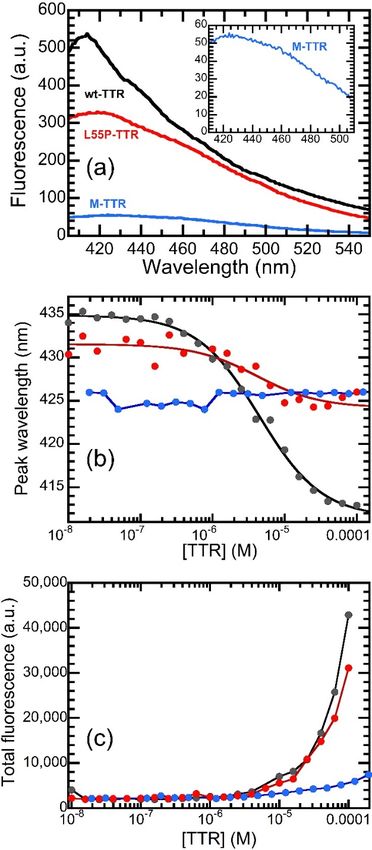
                                           Figure 3. OleA-wt-TTR interaction. (a) Fluorescence emission spectra of OleA in the presence of
                                                         3. OleA-wt-TTR
                                              Figureconcentrations
                                           increasing                    of wt-TTRinteraction.        (a)−4Fluorescence
                                                                                     in the 1 × 10⁻⁸ M-10   M range. The coloremission
                                                                                                                                 varies fromspectra
                                                                                                                                              blue to of OleA in the presence of
                                                                                                          −8 M to 1 × 10⁻⁴−M,        −4 inMtherange.
                                           purple  as the protein
                                              increasing             concentration increases
                                                               concentrations         of wt-TTRfrom 1 ×in
                                                                                                        10the  1 × 10 8 M-10  as shown           color The color varies from blue
                                           scale. (b) The same spectra shown in panel (a), normalized to the signal emitted at 420 nm to high-
                                                                                                                               1 × 10    − 8                 −4 M, as shown in the
                                              to the
                                           light  purple      asofthe
                                                     blue shift     the protein
                                                                        emission we concentration        increases
                                                                                      observed on increasing  wt-TTR from
                                                                                                                       concentration.  Color M      as1 × 10
                                                                                                                                              scaleto
                                           incolor
                                               panel (a). (c) Total  emission intensities  of the spectra reported  in panel (a) plotted  vs. wt-TTR
                                                      scale. (b) The same spectra shown in panel (a), normalized to the signal emitted at 420 nm to
                                           concentration. The concentration refers to the tetramer. Color scale as in panel (a). (d) The fraction
                                              highlight
                                           of wt-TTR bound   the   blueplotted
                                                               to OleA    shift vs.
                                                                                 ofwt-TTR
                                                                                     the emission       weThe
                                                                                             concentration.  observed      on refers
                                                                                                                concentration  increasing      wt-TTR concentration. Color scale
                                                                                                                                     to the tetramer.
                                           We calculated the fraction bound from the analysis of the blue shift of the emission, as reported in
                                              as in panel (a). (c) Total emission intensities of the spectra reported in panel (a) plotted vs. wt-TTR
                                           the Methods section. Color scale as in panel (a).
                                            concentration. The concentration refers to the tetramer. Color scale as in panel (a). (d) The fraction of
                                           2.4. Investigation
                                             wt-TTR      boundof ThetoInteraction Between vs.
                                                                        OleA plotted      OleAwt-TTR
                                                                                              and TTR Mutants
                                                                                                      concentration.
                                                                                                                  The concentration refers to the tetramer.
                                               For comparison with the data obtained with wt-TTR, the same experiment was re-
                                            We   calculated   the fraction  bound   from  the analysis  of the blue shift of the emission, as reported in the
                                           peated in the presence of two TTR mutants, L55P-TTR and M-TTR. Indeed, the binding
                                            Methods     section.  Color   scale as in panel  (a).
                                           pocket is known to be altered in the L55P variant and absent in M-TTR. The emission
                                           spectra of 0.5 µM OleA recorded in the presence of different concentrations of the two
                                             2.4. Investigation
                                           variants                   of the Interaction
                                                    are shown in Supplementary                between
                                                                                    Figure S2a, where theOleA
                                                                                                           spectraand  TTR in
                                                                                                                   measured    Mutants
                                                                                                                                 the pres-
                                           ence of the two variants at 100 µM protein concentration are compared with that of wt-
                                                    For
                                           TTR. These     comparison
                                                       spectra illustrate thatwith
                                                                               the twothe   data
                                                                                        mutant    obtained
                                                                                                proteins inducedwith     wt-TTR,
                                                                                                                  a different         the same experiment was re-
                                                                                                                              effect when
                                             peatedtoinwt-TTR;
                                           compared        the presence         of two
                                                                   in fact, the blue       TTR mutants,
                                                                                     shift shown               L55P-TTR
                                                                                                  by OleA in the                and M-TTR. Indeed, the binding
                                                                                                                   presence of L55P-TTR
                                           was much less intense than that observed with wt-TTR (Figure 4a). Indeed, the emission
                                             pocket is known to be altered in the L55P variant and absent in M-TTR. The emission spec-
                                           peak shifted from 431.2 nm to 425.2 nm upon increasing L55P-TTR concentration from
                                             tratoof
                                           0.01   1000.5
                                                      µM,µMa 6.0 OleA
                                                                 nm shiftrecorded
                                                                           that was muchin lower
                                                                                            the presence      of shift
                                                                                                 than the 22 nm   different
                                                                                                                       observedconcentrations
                                                                                                                                 with wt-       of the two variants
                                            are shown in Supplementary Figure S2a, where the spectra measured in the presence of
                                            the two variants at 100 µM protein concentration are compared with that of wt-TTR. These
                                            spectra illustrate that the two mutant proteins induced a different effect when compared
                                            to wt-TTR; in fact, the blue shift shown by OleA in the presence of L55P-TTR was much
                                            less intense than that observed with wt-TTR (Figure 4a). Indeed, the emission peak shifted
                                            from 431.2 nm to 425.2 nm upon increasing L55P-TTR concentration from 0.01 to 100 µM, a
                                            6.0 nm shift that was much lower than the 22 nm shift observed with wt-TTR (Figure 4b).
                                            Although the reduced shift observed made the data noisier, we attempted a quantitative
                                            analysis to calculate the OleA-L55P-TTR affinity constant, as reported above for wt-TTR.
                                            The analysis yielded a KD value of 3.12 ± 0.62 µM, which is, within the experimental error,
                                            substantially identical to the affinity calculated for wt-TTR. When the M-TTR data were
                                            analyzed, we found that this variant was unable to induce any significant shift of OleA
                                            emission. In fact, even at low protein concentration, the emission of OleA occurred at
                                            slightly shorter wavelengths that with wt-TTR: the peak was present at 426 nm even in the
                                            presence of M-TTR concentrations as low as 0.01 µM. However, the peak remained in the
                                            same position even when the protein concentration was increased up to values of 195 µM,
                                            the maximum concentration we could reach.
The Transthyretin/Oleuropein Aglycone Complex: A New Tool against TTR Amyloidosis - MDPI
tempted a quantitative analysis to calculate the OleA-L55P-TTR affinity constant, as re-
                                ported above for wt-TTR. The analysis yielded a KD value of 3.12 ± 0.62 µM, which is,
                                within the experimental error, substantially identical to the affinity calculated for wt-TTR.
                                When the M-TTR data were analyzed, we found that this variant was unable to induce
                                any significant shift of OleA emission. In fact, even at low protein concentration, the emis-
                                sion of OleA occurred at slightly shorter wavelengths that with wt-TTR: the peak was
Pharmaceuticals 2022, 15, 277   present at 426 nm even in the presence of M-TTR concentrations as low as 0.01 µM. How-                             7 of 17
                                ever, the peak remained in the same position even when the protein concentration was
                                increased up to values of 195 µM, the maximum concentration we could reach.

                                Figure 4. Interaction between OleA and TTR mutants. (a) Comparison between the emission of OleA
                                Figure   4. Interaction between OleA and TTR mutants. (a) Comparison between the emission of OleA
                                at a concentration of 0.5 µM in the presence of 100 µM wt-TTR (black), L55P-TTR (red), and M-TTR
                                at a concentration
                                (blue). The inset showsof  0.5 µM in the
                                                         a magnification      presence
                                                                          of the spectrumof  100 µM
                                                                                           recorded  in wt-TTR    (black),
                                                                                                        the presence        L55P-TTR
                                                                                                                      of M-TTR. (b) Peak (red), and M-TTR
                                wavelength
                                (blue).  Theofinset
                                               the OleA
                                                     showsspectra as a function of the
                                                              a magnification        ofconcentration
                                                                                        the spectrum of wt-TTR  (black),
                                                                                                         recorded        L55P-TTR
                                                                                                                     in the        (red),of M-TTR. (b) Peak
                                                                                                                            presence
                                and M-TTR (blue). (c) Total fluorescence emitted by OleA as a function of the concentration of wt-
                                wavelength     of the OleA
                                TTR (black), L55P-TTR    (red), spectra
                                                                and M-TTR as (blue).
                                                                             a function of the concentration of wt-TTR (black), L55P-TTR (red),
                                and M-TTR (blue). (c) Total fluorescence emitted by OleA as a function of the concentration of wt-TTR
                                (black), L55P-TTR (red), and M-TTR (blue).

                                      A different trend was observed when the emission intensity was taken into considera-
                                tion (Supplementary Figure S2 and Figure 4c). In fact, both mutants were able to induce an
                                increase in the emission of OleA, yet with different intensities. The total emission values in
                                the presence of 100 µM protein were 42,800, 31,100, and 5600 a.u. for wt-TTR, L55P-TTR,
                                and M-TTR, respectively. However, it is important to point out that the concentrations
                                shown in Figure 4c are molar concentrations. Given the monomeric nature of M-TTR,
                                the different ability of OleA to induce fluorescence increases may be at least partially
                                compensated for by normalizing the data to the mass concentration. This mathematical
                                operation would reduce the emission intensities of the tetrameric wt-TTR and L55P-TTR
                                by four times.

                                2.5. Biophysical Characterization of the Emission by OleA
                                      The change in OleA fluorescence we observed remains elusive and cumbersome to
                                interpret. The question arises as to whether the observed changes of emission correspond
                                to a true binding event and whether or not this binding occurs within the binding site of
                                TTR, or rather, it results from a non-specific interaction at the protein surface. Therefore,
                                to better interpret our data, we made a series of measurements of OleA fluorescence.
The Transthyretin/Oleuropein Aglycone Complex: A New Tool against TTR Amyloidosis - MDPI
Pharmaceuticals 2022, 15, 277                                                                                                                         8 of 17

                                            First, we investigated OleA emission in the presence of β-cyclodextrin (βCD), a cyclic
                                            oligosaccharide containing seven glucose molecules with a hydrophilic outer surface and a
                                            hydrophobic inner cavity, known to be able to harbor phytochemicals [32]. We measured
                                            the emission of OleA in water, in the absence or in the presence of an identical molar
                                            concentration of βCD (Figure 5a). We found that the emission of OleA displayed increased
                                            intensity and a blue shift in the presence of βCD. In fact, the total fluorescence emitted in
                                            the presence of βCD was 3.3 ± 0.1 times higher than that measured in the absence of the
                                            molecule. As far as the emission wavelength is concerned, we measured
        Pharmaceuticals 2022, 15, x FOR PEER REVIEW                                                                9 of 18
                                                                                                                          peak wavelengths
                                            of 459 and 485.2 nm in the presence and in the absence of βCD, respectively.

                                   Figure 5. Biophysical characterization of the fluorescence emitted by OleA. (a) Fluorescence spectra
                                  Figure  5. Biophysical characterization of the fluorescence emitted by OleA. (a) Fluorescence spectra
                                  of 200 µM OleA recorded in water in the absence (black) or in the presence (blue) of 200 µM β-
                                  of 200 µM (b)
                                  cyclodextrin. OleA   recorded
                                                    OleA             in water
                                                          emission peak         in theofabsence
                                                                         as a function             (black)
                                                                                         solvent relative    or in the
                                                                                                          permittivity  (ε/εpresence
                                                                                                                             0). The inset(blue) of 200 µM β-

                                  shows a comparison
                                  cyclodextrin.    (b) between   the OleA emission
                                                       OleA emission       peak asspectra  recorded
                                                                                     a function   ofinsolvent
                                                                                                        water (ε/ε 0 = 79.4) (black) or in
                                                                                                                relative     permittivity (ε/ε0 ). The inset
                                  propanol (ε/ε0 = 21.8) (red). (c) Comparison of total OleA fluorescence intensity measured in the
                                  shows
                                  presenceaofcomparison
                                              100 µM hen eggbetween     the OleA
                                                                white lysozyme      emission
                                                                                (HEWL),       spectra
                                                                                         bovine          recorded
                                                                                                serum albumin         in water
                                                                                                                 (BSA),            (ε/ε0 = 79.4) (black) or in
                                                                                                                          or wt-TTR.
                                  propanol (ε/ε0 = 21.8) (red). (c) Comparison of total OleA fluorescence intensity measured in the
                                  presence of 100 µM hen egg white lysozyme (HEWL), bovine serum albumin (BSA), or wt-TTR.
The Transthyretin/Oleuropein Aglycone Complex: A New Tool against TTR Amyloidosis - MDPI
Pharmaceuticals 2022, 15, x FOR PEER REVIEW                                                                                                               10 of 18

Pharmaceuticals 2022, 15, 277                                                                                                                               9 of 17

                                        Next, to possibly assign the emission of OleA to the effect of a hydrophobic chemical
                                 environment,
                                        Next, to possiblywe measured
                                                                   assign the the emission
                                                                                    fluorescence of OleA spectra
                                                                                                               to theof effect
                                                                                                                         OleA of   inadifferent   solvents
                                                                                                                                        hydrophobic            with
                                                                                                                                                         chemical
                                 varying     relative       permittivity      (ε/ε  0) (Figure 5b). When we plotted the peak wavelength vs.
                                 environment, we measured the fluorescence spectra of OleA in different solvents with vary-
                                 ε/ε0relative
                                 ing  , a significant        blue shift
                                                   permittivity       (ε/εwas      observed upon increasing the hydrophobicity. In fact, in
                                                                            0 ) (Figure 5b). When we plotted the peak wavelength vs. ε/ε0 ,
                                 water    (ε/ε  0  =  80)   the  peak    was
                                 a significant blue shift was observed upon     present     at 485.2     nm, whereas
                                                                                                  increasing                 in 1-buthanol In
                                                                                                                   the hydrophobicity.          (ε/ε 0 = 17.5),
                                                                                                                                                   fact,         the
                                                                                                                                                          in water
                                 peak0 was
                                 (ε/ε    = 80)located
                                                  the peak    at was
                                                                 433.7present
                                                                         nm, leading
                                                                                   at 485.2 usnm,
                                                                                                to establish
                                                                                                      whereas aindirect         link between
                                                                                                                       1-buthanol       (ε/ε0 = the
                                                                                                                                                 17.5),hydropho-
                                                                                                                                                          the peak
                                 bicity
                                 was      of theat
                                       located       chemical
                                                        433.7 nm,  environment
                                                                      leading us to     and   the observed
                                                                                           establish     a directbluelink shift.
                                                                                                                           between the hydrophobicity of
                                        We alsoenvironment
                                 the chemical          investigated and   whether       the ability
                                                                                 the observed        blueto induce
                                                                                                             shift. an increase in OleA fluorescence
                                 was We a specific        feature   of   TTR     or,   rather,
                                             also investigated whether the ability to induce      it  was    sharedan   with      other in
                                                                                                                            increase      proteins.   A series of
                                                                                                                                            OleA fluorescence
                                 samples      containing         OleA    in  the   presence      of   the  same     concentration
                                 was a specific feature of TTR or, rather, it was shared with other proteins. A series                   (100  µM)    of differentof
                                 proteins,containing
                                 samples       hen egg white     OleA lysozyme
                                                                         in the presence (HEWL), of the bovine
                                                                                                           same serum          albumin
                                                                                                                    concentration           (BSA)
                                                                                                                                         (100  µM)and       wt-TTR
                                                                                                                                                      of different
                                 were investigated.
                                 proteins,    hen egg white    The fluorescence
                                                                    lysozyme (HEWL),     intensities
                                                                                                   bovine at 485
                                                                                                              serumnm albumin
                                                                                                                         of these samples
                                                                                                                                      (BSA) and were    measured
                                                                                                                                                   wt-TTR     were
                                 and normalized
                                 investigated.        Theatfluorescence
                                                                the value observed
                                                                                 intensities in at
                                                                                                 the485 absence
                                                                                                           nm of of     proteins
                                                                                                                     these    samples (Figure
                                                                                                                                           were5b).   The results
                                                                                                                                                 measured       and
                                 of this experiment
                                 normalized                    are rather
                                                    at the value       observedcomplex      to elucidate.
                                                                                       in the    absence ofHEWL    proteins did(Figure
                                                                                                                                   not induce
                                                                                                                                            5b). any
                                                                                                                                                  Thesignificant
                                                                                                                                                        results of
                                 increase
                                 this         in fluorescence
                                       experiment           are rather intensity
                                                                           complex    of to
                                                                                          OleA.      The signal
                                                                                             elucidate.       HEWL    in the
                                                                                                                          didpresence
                                                                                                                                 not induce  of 100
                                                                                                                                                any µM       HEWL
                                                                                                                                                       significant
                                 was 1.16in
                                 increase     ± 0.17      times higher
                                                  fluorescence              thanof
                                                                     intensity      that   measured
                                                                                       OleA.    The signal in theinabsence
                                                                                                                     the presence of protein.
                                                                                                                                        of 100 However,
                                                                                                                                                µM HEWLinwas     the
                                 1.16  ± 0.17
                                 presence      of times
                                                    BSA, we   higher    than that
                                                                  observed             measured
                                                                                a completely            in the absence
                                                                                                     different     effect: the of signal
                                                                                                                                    protein.
                                                                                                                                           was However,
                                                                                                                                                 24.7 ± 1.5in    the
                                                                                                                                                              times
                                 presence
                                 higher than  of BSA,that we     observed
                                                             measured       fora OleA
                                                                                  completely
                                                                                           alone.different       effect:was
                                                                                                     This increase         the signal
                                                                                                                                  greaterwas   24.7
                                                                                                                                            than  that± recorded
                                                                                                                                                         1.5 times
                                 higher    than thatofmeasured
                                 in the presence               an identicalfor amount
                                                                                 OleA alone.         This increase
                                                                                             of wt-TTR.        Indeed,was   we greater
                                                                                                                                  observed  than
                                                                                                                                              thatthat
                                                                                                                                                    therecorded
                                                                                                                                                         signal in
                                 in
                                 thethe  presence
                                      presence        of of   anµM
                                                            100   identical
                                                                       wt-TTR   amount
                                                                                    was 10.6 of wt-TTR.
                                                                                                  ± 1.5 times  Indeed,
                                                                                                                    higher wethanobserved     that the signal
                                                                                                                                       that measured       withoutin
                                 the  presence        of   100  µM    wt-TTR       was    10.6  ±    1.5  times    higher
                                 the protein. We conclude that the ability to induce an increase in OleA fluorescence is not   than   that  measured      without
                                 the  protein.
                                 a specific          We conclude
                                                feature                   that theitability
                                                              of TTR; rather,                      to induce
                                                                                         is a property             an increase
                                                                                                              shared      by TTRin       OleA
                                                                                                                                       with     fluorescence
                                                                                                                                             other,   but not all, is
                                 not  a specific
                                 proteins.     Probably,featurethe of increased
                                                                       TTR; rather,        it iswe
                                                                                       effect    a property
                                                                                                       observedshared depends   by onTTRsurface
                                                                                                                                           with other,      but not
                                                                                                                                                   properties     —
                                 all, proteins.
                                 mainly     in terms   Probably,     the increased effect
                                                            of hydrophobicity—of                     we observedprotein.
                                                                                              the investigated            depends on surface properties
                                 —mainly      in terms
                                        Finally,              of hydrophobicity—of
                                                      we investigated         the effect ofthe  OleA  investigated
                                                                                                          binding onprotein.
                                                                                                                           the thermodynamic stability of
                                        Finally,     we    investigated      the   effect   of
                                 TTR by means of urea-induced equilibrium unfolding experiments OleA      binding     on  the    thermodynamic
                                                                                                                                        in the presencestability
                                                                                                                                                             and ofin
                                 TTR    by  means        of  urea-induced         equilibrium        unfolding      experiments
                                 the absence of 100 µM OleA (Figure 6). The tryptophan fluorescence spectra were col-                   in the presence      and  in
                                 the  absence
                                 lected   and the  of 100data µM   OleA
                                                                 were       (Figure as
                                                                        analyzed        6).reported
                                                                                             The tryptophan          fluorescence
                                                                                                          in the Methods                spectra
                                                                                                                                   section.  Thewere     collected
                                                                                                                                                   results   of this
                                 and   the  data     were     analyzed     as   reported     in  the    Methods       section.
                                 analysis indicate that, in the case of wt-TTR, OleA binding induced a slight, yet significant,   The   results  of this   analysis
                                 indicate
                                 increasethat,in the  in thermodynamic
                                                           the case of wt-TTR,          OleA of
                                                                                   stability    binding      induced
                                                                                                    the protein.       Thea slight,    yet significant,
                                                                                                                              free energy     change upon  increase
                                                                                                                                                                 un-
                                 in the
                                 folding  thermodynamic
                                            (∆           ) were      stability
                                                                  22,600    ±  200 of  the
                                                                                     and     protein.
                                                                                           21,800     ±    The
                                                                                                         200      free
                                                                                                              J/mol    inenergy
                                                                                                                          the        change
                                                                                                                                 presence      upon
                                                                                                                                             and  in   unfolding
                                                                                                                                                      the   absence
                                      H2 O
                                 (∆G  U − F ) were
                                 of OleA,                22,600 ±Different
                                               respectively.          200 and 21,800results±were 200 J/mol
                                                                                                         obtainedin thewithpresence
                                                                                                                                L55P-TTR and and
                                                                                                                                              in theM-TTR.
                                                                                                                                                       absenceThe of
                                 OleA,   respectively.
                                 valuesH of     ∆              Different     results    were    obtained      with     L55P-TTR
                                                             obtained for L55P-TTR were 23,000 ± 300 and 22,800 ± 300 J/mol in the    and   M-TTR.     The   values
                                           2O
                                 of ∆G
                                 absence U−F and in the for
                                                obtained            L55P-TTR
                                                                presence     of the were    23,000
                                                                                       ligand,         ± 300 and 22,800
                                                                                                   respectively,        whereas   ± 300   J/mol in
                                                                                                                                     the values    ofthe
                                                                                                                                                       ∆ absence ob-
                                                                                                                           H2 O
                                 and  in the
                                 tained   for presence
                                              M-TTR were  of theofligand,
                                                                    20,400 respectively,    whereas
                                                                             ± 200 and 20,200    ± 200theJ/mol
                                                                                                           values   the∆G
                                                                                                                in of      U − F obtained
                                                                                                                         absence   and in for
                                                                                                                                            the
                                 M-TTR
                                 presence  were
                                             of the   ligand,±respectively.
                                                  of 20,400     200 and 20,200     ± 200
                                                                                This       J/mol infurther
                                                                                      experiment     the absence     and in
                                                                                                              supports    thethe  presence
                                                                                                                                pieces       of
                                                                                                                                       of evi-
                                 the ligand,
                                 dence        respectively.
                                         concerning            This experiment
                                                        TTR-OleA      interaction.further
                                                                                    Ligandsupports
                                                                                              bindingthe    pieces
                                                                                                        to the      of evidence
                                                                                                               wild-type          concerning
                                                                                                                             protein  induces
                                 TTR-OleA
                                 an increaseinteraction.      Ligand binding
                                                 in the thermodynamic             to the wild-type
                                                                               stability             proteinHowever,
                                                                                          of the tetramer.     induces an     increase in
                                                                                                                            L55P-TTR    hasthea
                                 thermodynamic        stability  of the  tetramer.  However,    L55P-TTR     has  a  compromised
                                 compromised binding pocket that alters the binding, leaving protein stability unaffected            binding
                                 pocket   that alters the
                                 by the interaction.     Webinding,
                                                             also found leaving   proteinisstability
                                                                            that M-TTR               unaffected
                                                                                             unable to   bind OleA  byand,
                                                                                                                        the accordingly,
                                                                                                                             interaction. Wewe
                                 also
                                 could found   that M-TTR
                                         not detect            is unableeffect
                                                       any significant      to bind OleA
                                                                                 on the     and, accordingly,
                                                                                         thermodynamic           we could
                                                                                                             stability  of thenot  detectinany
                                                                                                                                protein     the
                                 significant
                                 presence ofeffect    on the thermodynamic stability of the protein in the presence of the ligand.
                                                the ligand.

                                 Figure 6.
                                 Figure  6. Equilibrium
                                            Equilibriumunfolding
                                                          unfoldingexperiments
                                                                      experiments ofof
                                                                                    TTRTTRin the  absence
                                                                                              in the      (black)
                                                                                                     absence      and and
                                                                                                              (black) in the
                                                                                                                           inpresence   (red)
                                                                                                                              the presence
                                 of 100 µM   OleA.  Data reported  refer to wt-TTR   (left), L55P-TTR   (center), and M-TTR    (right).
                                 (red) of 100 µM OleA. Data reported refer to wt-TTR (left), L55P-TTR (center), and M-TTR (right).      Con-
                                 tinuous lines represent best fits of data to the model edited by Santoro and Bolen [33].
                                 Continuous lines represent best fits of data to the model edited by Santoro and Bolen [33].
The Transthyretin/Oleuropein Aglycone Complex: A New Tool against TTR Amyloidosis - MDPI
Pharmaceuticals 2022, 15, x FOR PEER REVIEW                                                                                     11 of 18
Pharmaceuticals 2022, 15, 277                                                                                                    10 of 17

                                    2.6. Effects of Oleuropein Aglycone on TTR under Physiological Conditions
                                 2.6. Effects of Oleuropein Aglycone on TTR under Physiological Conditions
                                          Our previous data showed that OleA interacts specifically in the tryptophan (Trp)
                                        Our previous data showed that OleA interacts specifically in the tryptophan (Trp)
                                    region of TTR during the aggregation process, under acidic conditions [29]. In the present
                                 region of TTR during the aggregation process, under acidic conditions [29]. In the present
                                    study, we analyzed the effect of OleA on the native tetrameric structure of wt-TTR, L55P-
                                 study, we analyzed the effect of OleA on the native tetrameric structure of wt-TTR, L55P-
                                    TTR, and M-TTR under physiological conditions (pH 7.0). The data obtained by the equi-
                                 TTR, and M-TTR under physiological conditions (pH 7.0). The data obtained by the
                                    librium unfolding were confirmed by the analysis of TTR intrinsic fluorescence in the
                                 equilibrium unfolding were confirmed by the analysis of TTR intrinsic fluorescence in the
                                    presence or in the absence of OleA at different incubation times (Figure 7). Second deri-
                                 presence or in the absence of OleA at different incubation times (Figure 7). Second derivate
                                    vate spectra showed two peaks at around 330 nm and 350 nm that are associated with
                                 spectra showed two peaks at around 330 nm and 350 nm that are associated with different
                                    different polarities of the environment surrounding aromatic residues due to the presence,
                                 polarities of the environment surrounding aromatic residues due to the presence, in each
                                 TTRin monomer,
                                        each TTR monomer,
                                                     of two Trp ofresidues
                                                                   two Trp residues     at positions
                                                                              at positions  41 and 79.41 and
                                                                                                          The79. The
                                                                                                               330 nm330  nm peak,
                                                                                                                       peak,         typical
                                                                                                                               typical of
                                 theofnatively
                                        the natively
                                                foldedfolded
                                                         proteinprotein  with buried
                                                                  with buried     indoleindole   moieties,
                                                                                          moieties,         is theevident,
                                                                                                     is the most   most evident,
                                                                                                                            whereaswhereas
                                                                                                                                      the
                                 lessthe less intense
                                       intense  350 nm  350peak
                                                             nm peak
                                                                 is dueisto
                                                                          duethetocontribution
                                                                                   the contribution   of solvent-exposed
                                                                                                 of the  the solvent-exposedTrp.Trp.  In our
                                                                                                                                  In our
                                 experimental setting, we found that the two peaks were unaffected by the presence of OleA, of
                                    experimental      setting, we   found   that  the  two  peaks  were    unaffected  by  the  presence
                                    OleA,
                                 also  afteralso  afterincubation
                                             protein    protein incubation
                                                                    for 72 h, for  72 h, confirming
                                                                               confirming   that the that  the OleA/TTR
                                                                                                      OleA/TTR            interaction
                                                                                                                   interaction  does notdoes
                                    notthe
                                 affect  affect  the structure
                                             structure          of the protein.
                                                         of the native  native protein.

                                 Figure 7. Intrinsic fluorescence emission spectra recorded at different times of incubation of wt-
                                 TTR (a), L55P-TTR (e), and M-TTR (i) before and after OleA supplementation to the incubation
                                     Figure 7. Intrinsic fluorescence emission spectra recorded at different times of incubation of wt-TTR
                                 mixture (b,f,l). The spectra were normalized to fluorescence intensity of 1.0 at λmax , λexc = 295 nm.
                                     (a), L55P-TTR (e), and M-TTR (i) before and after OleA supplementation to the incubation mixture
                                 (c,d,g,h,m,n). The second derivatives were obtained from the previous emission spectra.
                                     (b,f,l). The spectra were normalized to fluorescence intensity of 1.0 at λ max, λexc = 295 nm.
                                     (c,d,g,h,m,n). The second derivatives were obtained from the previous emission spectra.
                                 3. Discussion

                                    3. The knowledge of the mechanism by which polyphenolic compounds interfere with
                                       Discussion
                                 amyloid aggregation is of great importance, considering that (i) the growth of amyloid
                                         Theisknowledge
                                 assemblies    a commonof     the mechanism
                                                           feature            by which
                                                                    of many systemic andpolyphenolic   compounds
                                                                                          neurodegenerative           interfere
                                                                                                                 diseases,       with
                                                                                                                           includ-
                                    amyloid   aggregation  is  of great importance, considering   that (i) the  growth
                                 ing type 2 diabetes, FAP, FAC, AL-amyloidosis, Alzheimer’s disease, Parkinson’s disease,of  amyloid
                                    assemblies is a common
                                 Creutzfeldt–Jakob’s   disease,feature   of many
                                                                  Huntington’s   systemic
                                                                               disease, andand  neurodegenerative
                                                                                             many   others; (ii) a largediseases,
                                                                                                                         numberin-
                                 of studies indicate that these molecules are able to interfere in several ways with proteindis-
                                    cluding  type 2 diabetes,  FAP, FAC,  AL-amyloidosis,  Alzheimer’s    disease,  Parkinson’s
                                    ease, Creutzfeldt–Jakob’s
                                 misfolding   and the ensuing disease,
                                                                  growth ofHuntington’s  disease, and
                                                                             amyloid assemblies;   andmany       others;
                                                                                                         (iii) the       (ii) aand
                                                                                                                   selection    large
Pharmaceuticals 2022, 15, 277                                                                                          11 of 17

                                development of small molecules able to inhibit, or to interfere with, the growth of toxic
                                protein assemblies, most often unstable pre-fibrillar aggregates, or to reduce their ability
                                to bind to the cell membrane could have a considerable clinical application. Therefore,
                                establishing the mechanism by which polyphenols disrupt aggregation-prone conforma-
                                tions is of paramount importance to reach a complete knowledge of the structure–activity
                                relationships of these natural compounds. Recent papers suggest that aromatic interactions
                                favor molecular recognition of amyloidogenic sequences by enhancing the directionality
                                and orientation needed for the ordered self-assembly process and hence fibril assembly
                                kinetics [34].
                                      It has been reported that several polyphenols interact with amyloidogenic aromatic
                                residues hindering the stacking of π-systems [35,36], thus inhibiting the elongation phase of
                                fibril growth or the assembly of large oligomers without interfering with early nucleation
                                events [37]. In particular, many natural polyphenols, including resveratrol [38], OleA [29],
                                curcumin [39], and EGCG [30], have been reported to inhibit the fibrillogenesis process
                                of amyloid precursor proteins and peptides in vitro and, possibly, in vivo. We previously
                                reported that OleA hinders the amyloid aggregation of both wt-TTR- and L55P-TTR [29].
                                In particular, we observed that OleA significantly reduces solvent exposure of those aro-
                                matic residues that become uncovered following tetramer disassembly and the ensuing
                                misfolding of the resulting monomers/dimers. All previous published data were col-
                                lected under acidic conditions, providing an environment suitable to induce tetrameric TTR
                                destabilization, a condition required to trigger the subsequent amyloid aggregation process.
                                      To better interpret previously published data, in the present study, we sought to inves-
                                tigate the molecular features underlying OleA interaction with the structure of tetrameric
                                TTR under physiological conditions (pH 7.0) for each variant. For the first time, we ob-
                                served that OleA undergoes fluorescence emission following incubation with TTR. This is
                                not surprising, considering that, even in the case of resveratrol and its main metabolites,
                                the fluorescence spectra of these molecules have been used to assess their ability to inter-
                                act with TTR [40]. The interaction between OleA and TTR induced two distinct effects
                                on OleA fluorescence: an increased fluorescence intensity and a blue shift, even though
                                these phenomena seemed to occur at different protein concentrations. The emission shift
                                appeared at concentrations of wt-TTR higher than 10−7 M and was complete at 40 µM.
                                The signal enhancement became evident above 10−6 M and did not reach a plateau at
                                100 µM, the maximum protein concentration we could reach. A plot displaying the blue
                                shift of OleA fluorescence, assessed as the ratio between the signals at 413 and 428 nm,
                                vs. fluorescence intensity illustrates these observations, suggesting that these events may
                                be the spectroscopic signature of two different processes, which appear in the plot as two
                                distinct linear regions (Supplementary Figure S3). Our biophysical investigation allows
                                the blue shift to be assigned to a binding mode, whereby one OleA molecule occupies
                                the binding site of TTR: at low protein concentration, OleA is free in solution and solvent
                                relaxation induces a red shift in the emission of OleA. Indeed, we could obtain a similar
                                blue shift when OleA was incubated with βCD, a molecule providing a hydrophobic cage.
                                Furthermore, the same blue shift was obtained in hydrophobic solvents and the docking
                                studies corroborate this binding mechanism.
                                      As far as the signal increase at high protein concentrations is concerned, it must be
                                noted that this increase was obtained in the presence of different proteins Furthermore,
                                even M-TTR, although devoid of quaternary structure and thus of the binding pocket,
                                exhibited a significant, yet lower, ability to increase OleA fluorescence. These two pieces of
                                evidence suggest that the increase in fluorescence may be due to a non-specific interaction
                                of OleA at the protein surface, rather than to a specific binding in the TTR binding site.
                                However, the fluorescence increase did not reach a plateau at protein concentrations at
                                which the first binding event was saturated and, consequently, no more OleA molecules
                                could still be available under these conditions. A possible explanation of this result is
                                that one OleA molecule interacts with more than one TTR molecule, although the second
                                interaction displays a lower affinity.
Pharmaceuticals 2022, 15, 277                                                                                           12 of 17

                                      The interaction modes described for the first time in the present work are novel but not
                                unique, considering that several small compounds interact with the TTR surface inducing
                                tetramer stabilization and impairing amyloid fibril formation [28]. Among these molecules,
                                natural flavonoids, such as EGCG, do not bind at the T4 binding site and stabilize the
                                tetrameric structure by a stable interaction at the surface of each TTR monomer [28]. In
                                particular, EGCG binds at the dimer–dimer interface, with a resulting effect similar to that
                                of a cross-linker [41]. Our results indicate that OleA binds both at the main funnel and at
                                the hydrophobic surfaces of TTR. Considering the very low toxicity of EGCG and OleA, it
                                would be possible to suggest, and to investigate, the existence of a synergistic effect between
                                these two, and possibly other, polyphenols; the latter could be an encouraging strategy to
                                increase the stabilizing effects of wild-type and mutant forms of TTR by plant polyphenols.
                                      Our data suggest that OleA displays a KD of ~3.0 uM for wt-TTR, a value similar to
                                that reported for other polyphenols, such as curcumin (KD ~2.0 uM [42,43]). These values
                                are higher than those reported for drugs used for TTR-amyloidosis such as Tafamidis
                                (4.4 ± 1.3 nM [44]) and Diflunisal (407 ± 35 nM [44]), but this may be not relevant. In fact,
                                Miller and co-workers reported that the KD value is not an essential parameter to define
                                a good molecule able to reduce TTR amyloidogenicity [44]. In their study, they analyzed
                                the KD values of different drugs such as AG10, Tafamidis, Diflunisal, and Tolcapone and
                                showed that the efficiency of these drugs does not correlate with their KD value; rather, it
                                is related to their binding enthalpy values [44]. These data agree with the energy value
                                reported for OleA obtained with the DOCKING assay, where OleA displayed the highest
                                affinity and interaction energy. A different, yet weak, interpretation is that the surface
                                interaction we identified may play an important role with respect to the inhibition of aggre-
                                gation. Indeed, we previously showed that OleA alters the aggregation pathway, leading
                                to the formation of off-pathway oligomeric assemblies [29]. An interaction occurring at the
                                protein surface seems more suitable to interfere with intermolecular interactions than a
                                binding event occurring within the protein structure. Consequently, the synergistic effect
                                of the two interaction modes described here may underlie the biological activity of OleA.

                                4. Materials and Methods
                                4.1. Oleuropein Deglycosylation
                                     Oleuropein was purchased from Extrasynthese and deglycosilated by treatment with
                                almond β-glycosidase (EC 3.2.1.21, Fluka, Sigma-Aldrich, St. Louis, MI, USA), as previously
                                described [45]. Briefly, a 10 mM solution of oleuropein in 310 µL of 0.1 M sodium phosphate
                                buffer, pH 7.0, was incubated with 8.9 I.U. of β-glycosidase overnight at room temperature.
                                The reaction mixture was centrifuged at 18,000 rpm for 10 min to precipitate OleA, which
                                was resuspended in dimethylsulfoxide (DMSO) in stocks at 50 mM concentration. The
                                complete oleuropein deglycosylation was confirmed by assaying the glucose released
                                in the supernatant with a Glucose (HK) Assay kit (Sigma-Aldrich, St. Louis, MI, USA).
                                Stocks of OleA were kept frozen protected from light and were used within the same day
                                once opened.

                                4.2. Preparation of TTR Samples
                                     Recombinant wt-TTR- and L55P-TTR were expressed and purified according to Man-
                                gione et al. [46]. Lyophilized TTR was dissolved at 1.6 mM in 30 mM sodium phosphate
                                buffer, and pH 7.0. M-TTR was purified as previously reported [12]. In brief, the cleared
                                lysate was loaded on a Q-Sepharose High Performance resin (GE Healthcare) and eluted
                                with a sodium chloride gradient. Then, the protein was further purified by gel filtration
                                with a HiLoad 16/600 Superdex 75 pg (GE). The eluted protein was dialyzed against 20 mM
                                potassium phosphate, 150 mM NaCl buffer at pH 7.3 enriched with 2.0 mM DTT.

                                4.3. Docking Experiments
                                     Ligand interaction with the investigated TTR molecules was investigated by molec-
                                ular docking with the AutoDock Vina software [47]. The reference 3D structures for the
You can also read