Thermal acclimation of tropical coral reef fishes to global heat waves
←
→
Page content transcription
If your browser does not render page correctly, please read the page content below

RESEARCH ARTICLE

                                    Thermal acclimation of tropical coral reef
                                    fishes to global heat waves
                                    Jacob L Johansen1,2†‡*, Lauren E Nadler2,3,4†§*, Adam Habary2,
                                    Alyssa J Bowden5,6, Jodie Rummer2,4
                                    1
                                     Hawaii Institute of Marine Biology, University of Hawaii, Kaneohe, United States;
                                    2
                                     ARC Centre of Excellence for Coral Reef Studies, James Cook University,
                                    Townsville, Australia; 3Halmos College of Arts and Sciences, Nova Southeastern
                                    University, Dania Beach, United States; 4College of Science and Engineering, James
                                    Cook University, Townsville, Australia; 5CSIRO, Hobart, Australia; 6Institute of
                                    Marine and Antarctic Studies, University of Tasmania, Hobart, Australia

                                    Abstract As climate-driven heat waves become more frequent and intense, there is increasing
                                    urgency to understand how thermally sensitive species are responding. Acute heating events
                                    lasting days to months may elicit acclimation responses to improve performance and survival.
                                    However, the coordination of acclimation responses remains largely unknown for most
*For correspondence:                stenothermal species. We documented the chronology of 18 metabolic and cardiorespiratory
jacob.johansen@hawaii.edu (JLJ);    changes that occur in the gills, blood, spleen, and muscles when tropical coral reef fishes are
lauren.e.nadler@gmail.com (LEN)     thermally stressed (+3.0˚C above ambient). Using representative coral reef fishes (Caesio cuning
†
 These authors contributed          and Cheilodipterus quinquelineatus) separated by >100 million years of evolution and with stark
equally to this work                differences in major life-history characteristics (i.e. lifespan, habitat use, mobility, etc.), we show
                                    that exposure duration illicited coordinated responses in 13 tissue and organ systems over 5
Present address: ‡Hawaii
                                    weeks. The onset and duration of biomarker responses differed between species, with C. cuning –
Institute of Marine Biology,
                                    an active, mobile species – initiating acclimation responses to unavoidable thermal stress within the
University of Hawaii, Kaneohe,
United States; §Halmos College      first week of heat exposure; conversely, C. quinquelineatus – a sessile, territorial species –
of Arts and Sciences, Nova          exhibited comparatively reduced acclimation responses that were delayed through time. Seven
Southeastern University, Dania      biomarkers, including red muscle citrate synthase and lactate dehydrogenase activities, blood
Beach, United States                glucose and hemoglobin concentrations, spleen somatic index, and gill lamellar perimeter and
                                    width, proved critical in evaluating acclimation progression and completion, as these provided
Competing interests: The
authors declare that no             consistent evaluation of thermal responses across species.
competing interests exist.
Funding: See page 18
Received: 21 May 2020               Introduction
Accepted: 05 January 2021           While sea surface temperatures (SSTs) are expected to rise by 2.0–4.8˚C by the end of the century
Published: 26 January 2021          (Collins et al., 2013; IPCC, 2013; Pörtner et al., 2019), a potentially more pressing development is
                                    the increasing frequency and severity of extreme acute heating events worldwide (e.g.
Reviewing editor: Kristin
Tessmar-Raible, University of
                                    Frölicher et al., 2018; Hobday et al., 2016; IPCC, 2013; Pörtner et al., 2019; Wernberg et al.,
Vienna, Austria                     2013). Examples include the marine heat waves that occurred in the Mediterranean Sea in 2003, in
                                    Western Australia in 2011, and on the Great Barrier Reef (GBR) in 2016 and 2017 (Ainsworth et al.,
   Copyright Johansen et al. This
                                    2016; Garrabou et al., 2009; Hughes et al., 2017). These events cause acute increases of up to 5˚C
article is distributed under the
                                    above seasonal average SSTs over the course of days and can last for several weeks
terms of the Creative Commons
Attribution License, which          (Garrabou et al., 2009; Hughes et al., 2017). The resulting heat stress typically leads to large-scale
permits unrestricted use and        coral bleaching on coral reefs, mass mortality of fishes and invertebrates, and reduced commercial
redistribution provided that the    fisheries catch (Garrabou et al., 2009; Pearce et al., 2011). To date, climate change studies in
original author and source are      marine systems have focused primarily on long-term projected temperature means rather than the
credited.                           accompanying diurnal and monthly extreme temperatures that already occur today (e.g.

Johansen, Nadler, et al. eLife 2021;10:e59162. DOI: https://doi.org/10.7554/eLife.59162                                              1 of 30
Research article                                                                                   Ecology Evolutionary Biology

                                   Grenchik et al., 2013; Nay et al., 2015; Pörtner et al., 2019; Rummer et al., 2014; Vasseur et al.,
                                   2014). Yet, climate change winners and losers will ultimately be determined by the capacity of indi-
                                   viduals and species to compensate for thermal stress in both the short (days, weeks, months) and
                                   longer term (years, decades, centuries).
                                       As oceans warm beyond the temperatures under which species have evolved, marine ectotherms
                                   will either need to relocate (e.g. to cooler waters or greater depths; Feary et al., 2014;
                                   Habary et al., 2017; Nay et al., 2015) or acclimate and adapt to maintain performance
                                   (Johansen and Jones, 2011; Sandblom et al., 2016; Strobel et al., 2012; Tirsgaard et al., 2015).
                                   Acclimation and adaptation are particularly important for the many species that cannot relocate due
                                   to lack of mobility or specific resource requirements, including many Arctic and tropical coral reef
                                   stenotherms (Feary et al., 2014; Matis et al., 2018). The species will instead have to safeguard fit-
                                   ness and survival via physiological adjustments (Donelson et al., 2018; Munday et al., 2017).
                                       The capacity for most species to maintain fitness under the rapid incursion of anthropogenic cli-
                                   mate change remains uncertain. Given the critical importance of marine resources for human sur-
                                   vival, the likely responses of aquatic ectotherms (especially fishes) to climate change is vigorously
                                   debated, and several theories have been proposed to predict these physiological and ecological
                                   responses. The Gill-Oxygen Limitation Theory (GOLT) proposes that body size and function in fish is
                                   limited by the gills’ inability to adjust and supply sufficient oxygen to satisfy increasing metabolic
                                   costs under elevated temperatures (Pauly, 2019). Similarly, the Oxygen and Capacity Limited Ther-
                                   mal Tolerance (OCLTT) hypothesis proposes cardio-respiratory transport and tissue demand as the
                                   main determinants of an organism’s performance under ocean warming (Portner, 2014). However,
                                   mixed empirical evidence has led to a controversy about the exact mechanisms affecting species’
                                   performance under elevated temperatures, as neither of the prevailing theories are able to explain
                                   all observed responses (reviewed in Audzijonyte et al., 2019; Ern et al., 2017; Jutfelt et al., 2014;
                                   Jutfelt et al., 2018). More broadly unifying principles are currently lacking (but see
                                   Audzijonyte et al., 2019; Clark et al., 2013; Ern, 2019). Recent reviews have, therefore, empha-
                                   sized the urgent need for cross-disciplinary, mechanistic studies that explore the timescales over
                                   which thermal responses occur to assess the processes associated with acclimation and adaptation
                                   in thermally sensitive species (Audzijonyte et al., 2019; Jutfelt et al., 2018).
                                       In accordance with theoretical expectations, some cold- and warm-adapted marine teleosts can
                                   acclimate to minimize deleterious effects of rising ocean temperatures (Donelson et al., 2011;
                                   Gienapp et al., 2008; Grenchik et al., 2013; Norin et al., 2016; Somero, 2015; Strobel et al.,
                                   2012), maintaining critical processes like growth and swimming performance (Le Roy et al., 2017;
                                   Shama and Wegner, 2014; Shama et al., 2014). Other traits, like fecundity, exhibit only limited
                                   acclimation capacity in these stenotherms, with concomitant declines in offspring health and survival
                                   (Donelson et al., 2014; Donelson et al., 2016). If critical life-history processes cannot be protected,
                                   we are likely to see cascading detrimental impacts on productivity, abundance, and/or whole ecosys-
                                   tem biodiversity across all trophic levels, including ecologically important functional groups and fish-
                                   eries species (Brandl et al., 2020; Johansen et al., 2015; Pearce et al., 2011; Rodgers et al.,
                                   2018; Wernberg et al., 2013).
                                       Previous seminal work on temperate and freshwater eurythermal species helped clarify which
                                   physiological responses are likely to occur during acclimation in stenothermal species (Angil-
                                   letta, 2009; Barton, 2002; Brett, 1971; Fry and Hart, 1948; Guderley and Blier, 1988;
                                   Hofmann and Todgham, 2010; Madeira et al., 2016). Elevated temperatures typically increase
                                   metabolic processes in all tissues (but see Brodte et al., 2006; Lannig et al., 2005), subsequently
                                   increasing energetic demands (Fry and Hart, 1948; Richter et al., 2010). In the short-term (i.e.
                                   hours, days), processes involved in the oxygen and energy supply may suffer reduced efficiency due
                                   to, for example, increased heat-shock protein expression (Richter et al., 2010; Somero, 2012). In
                                   these cases, due to oxygen limitation, anaerobic pathways may be upregulated, typically evidenced
                                   by increasing activity of the metabolic enzyme lactate dehydrogenase (LDH; Jayasundara and Som-
                                   ero, 2013). Over prolonged time periods (i.e. weeks, months, years), aerobic pathways will be
                                   required to sustain performance under elevated energetic demands (Jayasundara and Somero,
                                   2013), which can be detected through rising citrate synthase (CS) activity associated with increased
                                   mitochondrial density within the tissues (Fangue et al., 2009). To increase oxygen delivery to tis-
                                   sues, blood oxygen transport parameters may also be altered, including the number of RBC supplied
                                   from cell stores in the spleen (Lilly et al., 2015) and increased hemoglobin oxygen binding affinity

Johansen, Nadler, et al. eLife 2021;10:e59162. DOI: https://doi.org/10.7554/eLife.59162                                             2 of 30
Research article                                                                                   Ecology Evolutionary Biology

                                   (Jayasundara and Somero, 2013; Lilly et al., 2015). In teleosts, blood oxygen uptake in the gills
                                   can be maximized by a reduction in oxygen diffusion distance across the lamellae and/or an increase
                                   in total gill surface area available for diffusion (Bowden et al., 2014). Finally, the combined adjust-
                                   ments within the tissues, blood, and gills will result in changes at the whole-organism level
                                   (Prosser, 2013), particularly an increase in resting oxygen uptake rates – a proxy for standard meta-
                                   bolic rate (SMR; Lefevre, 2016; Rao and Bullock, 1954) and altered maximum oxygen uptake rates
                                   during activity, which is a proxy for maximum metabolic rate (MMR; Pörtner and Farrell, 2008). The
                                   difference between SMR and MMR is aerobic scope (ASc), which indicates the individual’s capacity
                                   to invest in fitness-enhancing processes beyond basic maintenance (Eliason et al., 2013;
                                   Johansen and Jones, 2011). While many eurythermal species can maintain ASc across a wide tem-
                                   perature span, ASc often declines in stenothermal (i.e. Arctic and tropical) individuals experiencing
                                   thermal stress beyond that under which they have evolved (Drost et al., 2016; Franklin et al., 2013;
                                   Johansen and Jones, 2011; Lefevre, 2016). According to current literature, both the sequence and
                                   combination of physiological responses to elevated temperatures remain unclear. Each compensa-
                                   tory mechanism can be energetically costly and/or hinder other fitness-enhancing processes. Individ-
                                   uals must, therefore, balance the tradeoff between the rate of acclimation to thermal stress and the
                                   repercussions of each physiological response to overall fitness.
                                       Studies that focus on single physiological responses, single time points, or natural seasonal ther-
                                   mal differences may provide an incomplete snapshot of the capacity for thermal acclimation and the
                                   ultimate consequences for fitness and survival under elevated temperatures (Cossins et al., 1977;
                                   Madeira et al., 2016; Sidell et al., 1973; Somero, 2015). In order to understand the sequence of
                                   coordinated physiological responses associated with prolonged thermal stress, an integrative
                                   approach across multiple levels of biological organization and time points is required (Angil-
                                   letta, 2009; Guderley, 1990; Johnston and Dunn, 1987; Madeira et al., 2016; Sidell et al., 1973;
                                   Somero, 2015). Currently, we do not have a clear, comprehensive understanding of the sequence or
                                   duration of physiological responses – from discrete biochemical mechanisms to whole-animal perfor-
                                   mance – involved with acclimation to elevated temperatures. These physiological responses will ulti-
                                   mately dictate fitness in a changing environment (Boyd et al., 2015; Horodysky et al., 2015), either
                                   within the lifespan of an individual (e.g. diel variations, seasonal changes, or acute heat-waves) or
                                   over generational timespans (e.g. progressive climate change) (Angilletta, 2009; Donelson et al.,
                                   2012; Schulte et al., 2011).
                                       This study aimed to identify the key physiological compensatory responses and sequence of
                                   responses that occur when warm-adapted stenothermal fishes are exposed to elevated tempera-
                                   tures beyond those for which they have evolved. We focused on two representative stenothermal
                                   fishes found in tropical coral reef ecosystems (Lough, 2012; Tewksbury et al., 2008): the five-lined
                                   cardinalfish Cheilodipterus quinquelineatus (Apogonidae) and the redbelly yellowtail fusilier Caesio
                                   cuning (Caesionidae). These species evolved under highly stable thermal regimes, as seasonal water
                                   temperatures typically fluctuate less than 4˚C across the majority of tropical reefs (Donner, 2011;
                                   Lough, 2012). These species are also separated by more than 100 million years of evolution
                                   (Near et al., 2013) and differ in most major life-history characteristics, including lifespan (8 years), habitat use (site-attached versus roaming), and mobility (sedentary versus mobile) for
                                   C. quinquelineatus and C. cuning, respectively (Randall et al., 1997). We hypothesized that these
                                   differences in life history characteristics may alter the physiological responses to unfavorable thermal
                                   conditions, with C. quinquelineatus resilient to short-term perturbations (due to its sedentary and
                                   site-attached life-history) as evidenced by a slower, less substantial acclimation response when com-
                                   pared to C. cuning (which could escape unfavorable conditions through its roaming, mobile life his-
                                   tory). We compared fish accustomed to current-day maximum temperatures (summer average: 29˚C)
                                   to fish exposed to conditions typical of acute heating events and in line with projected future climate
                                   change conditions (+3.0˚C) (Garrabou et al., 2009; Hughes et al., 2017; IPCC, 2013;
                                   Pörtner et al., 2019). Thermal acclimation was assessed weekly over a 5-week period using a com-
                                   prehensive set of 18 hematological and cardiorespiratory parameters. These parameters included
                                   biochemical pathways within tissues and blood, blood oxygen transport and gill morphology, as well
                                   as whole animal metabolism and body condition (see Table 1 for full list). Based on previous reports
                                   of the timing and duration of physiological responses of stenothermal fishes to elevated tempera-
                                   tures (e.g. Madeira et al., 2016; Sidell et al., 1973; Somero, 2015), we hypothesized that it would

Johansen, Nadler, et al. eLife 2021;10:e59162. DOI: https://doi.org/10.7554/eLife.59162                                             3 of 30
Research article                                                                                                 Ecology Evolutionary Biology

Table 1. Acclimation responses of 18 hematological and cardiorespiratory parameters.
Type             Parameter                          Definition
Muscle + Gill    Citrate synthase activity (CS)     An exclusive marker of the mitochondrial matrix and a marker of mitochondrial density in tissues
                 Lactate dehydrogenase (LDH)        An enzyme involved in anaerobic energy production
Spleen           Spleen somatic index (SSI)         The relative spleen to body mass, used to assess release of red blood cell stores into the blood stream
                 Spleen [Hb]                        An indicator of red blood cell production within the spleen
Blood            Mean corpuscular hemoglobin        Hemoglobin concentration in red blood cells, indicative of blood oxygen carrying capacity
                 content (MCHC)
                 Hematocrit (Hct)                   The ratio of red blood cells to the total volume of blood
                 Hemoglobin (Hb)                    The protein responsible for transporting oxygen in the blood
                 Whole blood lactate                Lactic acid appears in the blood as a result of anaerobic metabolism
                 Whole blood glucose                Used to support the metabolic pathways in the mitochondria and cytoplasm
Gill             Lamellar perimeter                 The perimeter of a cross-section of the lamellae measured histologically as a proxy for total diffusible
                                                    surface area for O2 transport over the lamellae.
                 Lamellar width                     The histological total diameter of the lamellae epithelium and capillary. Lamellar width is here used to
                                                    indicate the epithelial thickness of the lamellae (i.e. diffusion distance for O2).
                 Epithelial thickness               A measure of the diameter of the epithelia on the lamellae
Whole body       Standard metabolic rate (SMR)      Baseline oxygen consumption required to maintain bodily functions.
metabolism
                 Maximum metabolic rate (MMR) Maximal oxygen consumption
                 Aerobic scope (ASc)                The difference between MMR and SMR, indicating the maximal O2 available for activity.
Whole body       Fulton’s K condition factor        Length-mass relationship used to estimate health of an individual
condition

                                        take a minimum of 3 weeks for the putative ‘slower acclimating species’ (C. quinquelineatus) to sta-
                                        bilize all hematological and cardiorespiratory parameters following elevated temperature exposure.

                                        Results
                                        Weeks 0–1: initial thermal stress responses
                                        Relative to controls, C. cuning showed changes in blood and muscle parameters within the first
                                        week of exposure to elevated temperatures. Blood glucose levels in C. cuning more than doubled
                                        from weeks 0 to 1, from 1.93 to 4.65 mM (pp.c.week1 = 0.003; Figure 1) (p.c.week1 denotes a planned
                                        comparison [p.] between control [c.] and week one individuals. See Materials and methods for
                                        details). In the pectoral muscle of C. cuning, the anaerobic metabolic enzyme, LDH, declined precipi-
                                        tously in week 0 compared to controls, from 1.36 to 0.61 mM (pp.c.week0 = 0.003; Figure 2). Con-
                                        versely, muscle LDH in C. quinquelineatus was consistent with control levels from weeks 0 to 1 (pp.c.
                                        week0 > Pcutoff, pp.c.week1 > Pcutoff; Figure 2).
                                            Both C. cuning and C. quinquelineatus exhibited changes in metabolic oxygen transport charac-
                                        teristics, demand, and/or aerobic capacity immediately following exposure to elevated temperature.
                                        Relative to controls, C. cuning exhibited greater lamellar width (pp.c.week1 = 0.002; Figures 3 and
                                        4) and higher SMR (pp.c.week0 = 0.021; Figure 5) within 1 week of exposure to the elevated tempera-
                                        ture treatment. However, only moderate, non-significant increases in MMR (pp.c.week0 > Pcutoff) and
                                        ASc (pp.c.week0 > Pcutoff; Figure 5) were found. Conversely, C. quinquelineatus showed no acute
                                        changes to gill structure (Figures 3 and 4) and only a moderate, non-significant increase in SMR (pp.
                                        c.week0 > Pcutoff; Figure 5). However, both MMR and ASc were significantly higher for C. quinqueli-
                                        neatus in the first week of temperature treatment, relative to controls (MMS: pp.c.week0
Research article                                                                                              Ecology Evolutionary Biology

                                   Figure 1. Effect of 5 weeks’ exposure to elevated temperatures (+3.0˚C) on whole blood. (A) Lactate and (B)
                                   glucose concentrations in Caesio cuning. The first blue column in each figure illustrates the control (29.0˚C). Letters
                                   above columns indicate significant differences between treatment groups, determined through multiple
                                   comparisons post-hoc testing (based on linear mixed-effects model analysis). ‘NS’ denotes that the model did not
                                   indicate any significant effects of temperature. Error bars are s.e.m., and numbers in parentheses below each
                                   category on the x-axis denote sample sizes for each group.

                                   Weeks 2 –3: delayed acclimation responses
                                   A number of traits exhibited delayed acclimation responses 2–3 weeks after exposure to elevated
                                   temperature. In C. cuning, blood glucose levels remained elevated until week 2 following high-tem-
                                   perature treatment (pp.c.week2 = 0.029); however, levels did not vary significantly different from con-
                                   trols from week 3 onwards (Figure 1). In week 3, C. quinquelineatus showed a peak in LDH activity
                                   in the pectoral muscle (pp.c.week3 = 0.021; Figure 2), and spleens contracted by 56.2% (as measured
                                   through spleen somatic index, SSI; pp.c.week3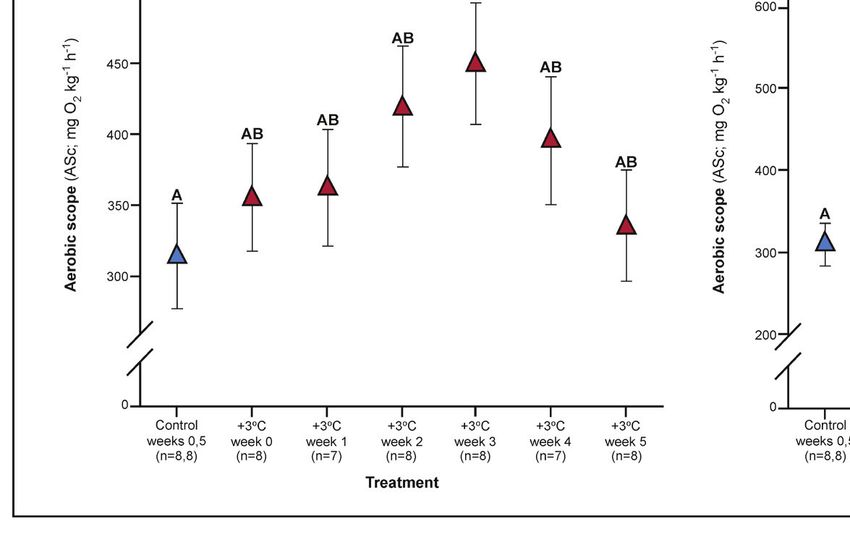
Research article                                                                                               Ecology Evolutionary Biology

Figure 2. Effect of 5 weeks’ exposure to elevated temperature (+3.0˚C) on citrate synthase (CS) and lactate dehydrogenase (LDH) enzyme activity in the
pectoral muscle of Caesio cuning (A and B) and Cheilopterus quinquelineatus (C and D). The first blue column in each figure illustrates the control (29.0˚
C). Letters above columns indicate significant differences between treatment groups, determined through multiple comparisons post-hoc testing
(based on linear mixed-effects model analysis). Error bars are s.e.m., and numbers in parentheses below each category on the x-axis denote sample
size.

                                        Gill morphology in both species also shifted in weeks 2 and 3. Caesio cuning continued to show
                                     increased lamellar width through weeks 2 and 3 (pp.c.week2
Research article                                                                                            Ecology Evolutionary Biology

                                   Figure 3. Gill parameters examined throughout the five weeks’ exposure to elevated temperature (+3.0 ˚C). (A)
                                   Illustration of gill parameters examined. The response of lamellar perimeter to elevated changed through time (in
                                   mm) in Caesio cunning (B) and Cheilopterus quinquelineatus (C). The first blue column in each figure illustrates the
                                   control (29.0 ˚C). Letters above columns indicate significant differences between treatment groups, determined
                                   through multiple comparisons post-hoc testing (based on linear mixed-effects model analysis). The white bar
                                   denotes data excluded from analyses due to low n, but shown for clarity. Error bars are s.e.m., and numbers in
                                   parentheses below each category on the x-axis denote sample size.

                                   Weeks 3–5: stabilization of acclimation responses
                                   The succession of physiological parameters began plateauing after 3–5 weeks of continuous expo-
                                   sure to elevated temperatures. In C. cuning, CS activity in the gill and pectoral muscle was one of
                                   the last parameters to respond to elevated temperatures, as both traits declined to a significant min-
                                   imum in week 4 (Muscle: pp.c.week4 = 0.011; Gill: pp.c.week4 0.5 for both; Figure 2, Appendix 1—figure 2). Caesio cuning also required 4
                                   weeks for all morphological gill parameters to return to control values (pp.c.week4 > Pcutoff), following

Johansen, Nadler, et al. eLife 2021;10:e59162. DOI: https://doi.org/10.7554/eLife.59162                                                         7 of 30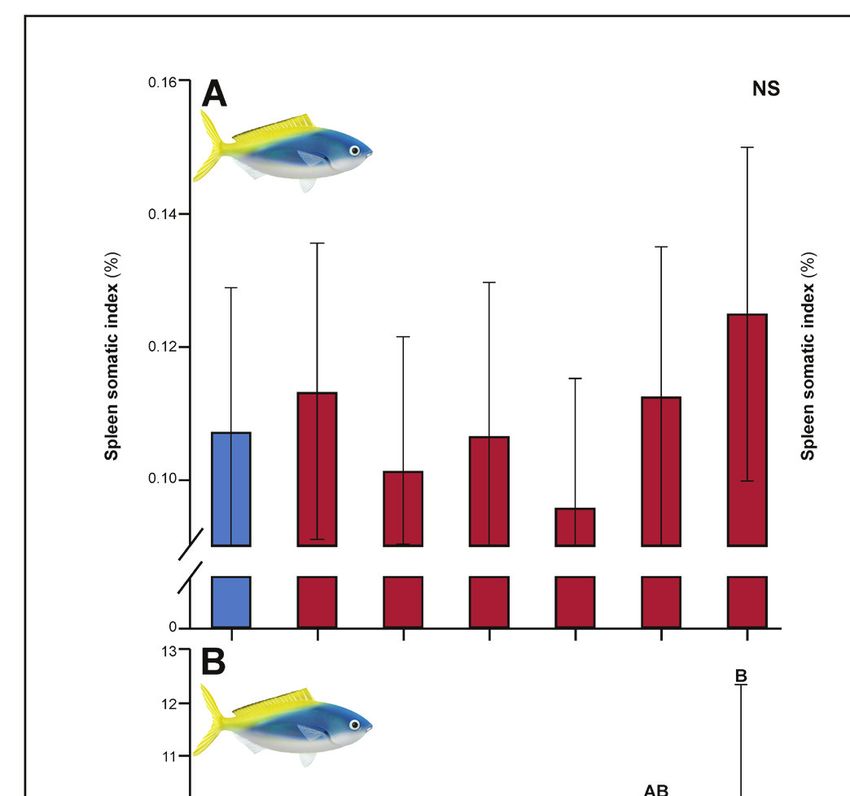
Research article                                                                                               Ecology Evolutionary Biology

Figure 4. Effect of 5 weeks’ exposure to elevated temperatures (+3.0˚C) on epithelial thickness and lamellar width (both in mm) in the gills of Caesio
cuning (A and B) and Cheilopterus quinquelineatus (C and D). The first blue column in each figure illustrates the control (29.0˚C). Letters above columns
indicate significant differences between treatment groups, determined through multiple comparisons post-hoc testing (based on linear mixed-effects
model analysis). The white bar denotes data excluded from analyses due to low n, but shown for clarity. ‘NS’ denotes that the model did not indicate
any significant effects of temperature. Error bars are s.e.m., and numbers in parentheses below each category on the x-axis denote sample size.

                                     increased lamellar width in weeks 1–3 and increased lamellar perimeter in week 3 (Figures 3 and
                                     4). Conversely, C. quinquelineatus showed no change in gill CS activity but exhibited a peak in CS
                                     activity in the pectoral muscle in week 4 (pp.c.week4 = 0.004; Figure 2) and declining muscle LDH
                                     activity from weeks 3 to 5 (pp.c.week5 = 0.016; Figure 2). In both species, MMR and ASc both
                                     returned to control values in week 4 (Figure 5). However, in C. quinquelineatus, this was accompa-
                                     nied by a 38.5% mortality rate after exhaustive exercise in weeks 3 and 4 (Appendix 1—figure 1).

                                     Past week 5: ongoing acclimation
                                     Several parameters had yet to stabilize in either species after 5 weeks’ exposure to elevated temper-
                                     atures. For C. cuning, spleen [Hb] exhibited a non-significant trend (pp.c.week5 > Pcutoff) to increase
                                     over the entire 5-week period culminating in a significant peak in week 5 relative to week 0 (pp.week0.
                                     week5=0.007), indicative of ongoing compensatory mechanisms for blood oxygen transport (Figure 6).
                                     While C. quinquelineatus showed no significant change in spleen [Hb] over the 5-week exposure
                                     period, this species did exhibit a significant reduction in spleen somatic index (pp.c.week5
Research article                                                                                             Ecology Evolutionary Biology

Figure 5. Effect of 5 weeks’ exposure to elevated temperatures (+3.0˚C) on metabolic performance of Caesio cuning (A and B) and Cheilopterus
quinquelineatus (C and D). Estimates of standard (white circles) and maximum (black circles) metabolic rates (A and C) and aerobic scope (ASc =
triangles, B and D) are illustrated. The first blue data point in panels B and D represent the control (29.0˚C). Letters above data points indicate
significant differences between treatment groups, determined through multiple comparisons post-hoc testing (based on linear mixed-effects model
analysis). Error bars are s.e.m., and numbers in parentheses below each category on the x-axis denote sample size.

                                    Non-responsive parameters
                                    Several parameters were unaltered by elevated temperature through time. Neither species exhibited
                                    significant plasticity in gill LDH activity over the 5-week exposure period (Appendix 1—figure 2).
                                    Additionally, although spleen [Hb] increased over the 5-week exposure to elevated temperatures in
                                    C. cuning (Figure 6), we found no indication of new RBCs being released into circulation over the
                                    first 5 weeks’ exposure, as there were no significant differences in hematocrit, whole blood [Hb],
                                    MCHC, or spleen somatic index between control and +3.0˚C-exposed individuals (pp.c.week5 > pcutoff;
                                    Figure 6, Appendix 1—figure 2). Caesio cuning also showed no change in blood [lactate] from con-
                                    trol levels at any time point (Figure 1), suggesting that this species was not relying heavily on anaer-
                                    obic energy production to the point that lactate was detectable in the plasma. Individuals from both
                                    species and all treatments also maintained Fulton’s K condition factor (i.e. body condition, Appen-
                                    dix 1—figure 3), suggesting that the physiological changes detected in +3.0˚C-exposed individuals
                                    were due to changing temperature conditions rather than waning health under laboratory
                                    confinement.

                                    Discussion
                                    Understanding the impacts of global change on species fitness and resilience requires a comprehen-
                                    sive, integrative approach across multiple levels of biological organization and time points

Johansen, Nadler, et al. eLife 2021;10:e59162. DOI: https://doi.org/10.7554/eLife.59162                                                         9 of 30
Research article                                                                                               Ecology Evolutionary Biology

Figure 6. Effect of 5 weeks’ exposure to elevated temperatures (+3.0˚C) on spleen somatic index and spleen hemoglobin concentration of Caesio
cuning (A and B) and Cheilopterus quinquelineatus (C and D). The first blue column in each figure illustrates the control (29.0˚C). Letters above columns
indicate significant differences between treatment groups, determined through multiple comparisons post-hoc testing (based on linear mixed-effects
model analysis). ‘NS’ denotes that the model did not indicate any significant effects of temperature. Error bars are s.e.m., and numbers in parentheses
below each category on the x-axis denote sample size.

                                     (Cossins et al., 1977; Sidell et al., 1973; Somero, 2015). Here, we provide the first comprehensive
                                     assessment of the key compensatory mechanistic responses and sequence of events that occur when
                                     warm-adapted stenothermal fishes are exposed to elevated temperatures above those for which
                                     they have evolved. Elevated temperature resulted in discrete responses in the gills, blood, spleen,
                                     and muscle across 13 separate hematological and cardiorespiratory parameters (see Table 1 for
                                     details). As hypothesized, the specific acclimation responses and duration of events differed among
                                     the study species, potentially due to divergent evolution and ecology. Caesio cuning exhibited rapid
                                     responses to thermal stress, with nearly immediate changes detected in gill morphology and blood
                                     parameters. Cheilodipterus quinquelineatus, conversely, largely exhibited a delayed response in all
                                     parameters measured, potentially contributing to the much higher (>50%) mortality seen across the
                                     5-week heating event. Importantly, we identified seven conserved physiological parameters across
                                     both species that may be useful as biomarkers for evaluating the progression of acclimation in ther-
                                     mally sensitive teleosts, and which may greatly improve our understanding and projections of ongo-
                                     ing climate change threats and disturbances.

                                     Initial stress responses
                                     For ectotherms, rising temperature causes an exponential increase in the energetic costs associated
                                     with maintaining bodily functions (i.e. Q10, Rao and Bullock, 1954). Accordingly, short-term

Johansen, Nadler, et al. eLife 2021;10:e59162. DOI: https://doi.org/10.7554/eLife.59162                                                          10 of 30
Research article Ecology Evolutionary Biology
Figure 7. Summary of the timing and duration of the physiological responses of two stenothermal fishes (Caesio cuning, top, and Cheilodipterus
quinquelineatus, bottom) to a five-week acute heating event. Summary of the timing and duration of the physiological responses of two stenothermal
fishes (Caesio cuning, top, and Cheilodipterus quinquelineatus, bottom) to a 5-week acute heating event, including responses in mortality, whole
organism demand (standard metabolic rate, SMR), whole organism supply (maximum metabolic rate, MMR, and aerobic scope, ASc), tissue demand
(citrate synthase, CS, and lactate dehydrogenase, LDH, enzyme activity in the gill and muscle tissue), and tissue supply (lamellar width and perimeter,
blood glucose, spleen [Hb], and spleen somatic index, SSI).
exposure (1 week) to elevated temperatures elicited primary stress responses in the blood, gills,
and whole animal metabolism, which is consistent with a rapid increase in total energy demand (e.g.
Angilletta, 2009; Brett, 1971; Fry and Hart, 1948; Guderley and Blier, 1988). Caesio cuning
appeared to increase energy delivery by increasing blood glucose levels, which allows enhanced
energy production via aerobic oxidative phosphorylation and glycogenolysis in the liver
(Jayasundara et al., 2013). In order to increase aerobic energy production, teleosts typically also
require increased oxygen transport at the gills for delivery to tissues and organs (e.g. Jensen et al.,
1993). Elevated temperatures will increase rates of diffusion across the gill epithelium, and our
results suggest that C. cuning increased blood flow through the gills for increased oxygen transport
(denoted by increased lamellar width). Accordingly, SMR rose immediately by 53.5% in C. cuning fol-
lowing exposure to elevated temperatures. Interestingly, C. quinquelineatus did not appear to simi-
larly increase energy supply to the organs, as there was no immediate increase in lamellar width.
This species also showed a staggering 79% mortality following exercise within the first week, sug-
gesting that the limited acclimation response may have been associated with systemic organ failure
in a high proportion of individuals.
Prolonged acclimation responses
Secondary acclimation processes were initiated after 2–3 weeks of continuous exposure to elevated
temperatures. The sequential responses in tissue enzyme activity, SSI, and gill morphology can be
linked to increased RBC concentration, enhanced oxygen transport, and improved gill oxygen
uptake (Jayasundara et al., 2013; Windisch et al., 2011). These concurrent adjustments likely con-
tributed to the measured increase in MMR and ASc through at least the second week and thereby
reduced trade-offs between energy production and demand within the tissues.
Although the observed adaptive remodeling in gill structure would allow for enhanced oxygen
acquisition (Sollid and Nilsson, 2006), changes in gill morphology can lead to trade-offs with other
physiological processes. Gill structure, in terms of diffusion distance (i.e. epithelial thickness), total
surface area (i.e. lamellar perimeter), and permeability (i.e. lamellar width), dictates both respiration
(i.e. in terms of the diffusion rate of carbon dioxide and oxygen between the gills and surrounding
water) and ion exchange for osmoregulation (Sardella and Brauner, 2007). However, the osmo-
respiratory compromise in fish posits that gill structural characteristics that promote effective respira-
tion are contrary to those that support efficient osmoregulation (Nilsson, 1986). Caesio cuning, in
particular, showed increased surface area (as evidenced by the significantly higher lamellar perimeter
Johansen, Nadler, et al. eLife 2021;10:e59162. DOI: https://doi.org/10.7554/eLife.59162 11 of 30Research article Ecology Evolutionary Biology
and width) 2–3 weeks after the initial spike in temperature, which would increase oxygen uptake
capacity at the expense of reduced control of ion exchange in the gills. Following challenges (e.g.
chasing by a predator, environmental factors), these gill changes are likely to impact osmotic homeo-
stasis (Sardella and Brauner, 2007), particularly on shallow, inshore habitats where salinity can vary
diurnally with the tide, storms, and runoff (Lough et al., 2015).
After 3–5 weeks of continuous exposure to elevated temperatures, multiple systemic morphologi-
cal and biochemical parameters started stabilizing at levels that appeared to reduce trade-offs
between competing biological functions. Indicators of anaerobic and aerobic energy metabolism
within the blood and tissues peaked by week 4 (specifically LDH, MMR, ASc, lamellar perimeter and
width, and muscle and gill CS). Most parameters subsequently returned to control values in weeks
4–5, consistent with a steady decreasing need for anaerobic metabolism and increasing aerobic
energy production. These trends suggest that adjustments to sustain increased energy production
required at least 4–5 weeks of continuous exposure to elevated temperatures to plateau (see Table 1
for duration of individual parameters). However, in both species, pathways relevant for RBC produc-
tion and storage exhibited signs of on-going recovery beyond week 5, with SSI still depleted in C.
quinquelineatus and rising spleen [Hb] in C. cuning.
Divergent acclimation pathways with same endpoints relates to species
evolution and life history
We found two divergent strategies for maintaining oxygen transport and energy production during
prolonged exposure to elevated temperatures. Caesio cuning exhibited a more immediate and com-
prehensive series of responses to thermal stress, including increasing splenic hemoglobin concentra-
tions (i.e. RBC production), progressive changes in gill structure, altered aerobic and anaerobic
enzymatic activity, and elevated blood glucose. These physiological responses can be associated
with increasing oxygen transport in response to rising metabolic maintenance costs at high tempera-
ture (Seebacher et al., 2015; Sollid and Nilsson, 2006). Importantly, the combined physiological
adjustments within C. cuning appeared to allow this species to return maximal oxygen transport to
control levels within 5 weeks, and allowed them to maintain a high survival rate despite thermal
stress. In contrast, C. quinquelineatus appeared to have a very limited capacity for rapid acclimation,
as thermal stress severely compromised survival. As hypothesized for this species, plasticity in physi-
ological and morphological traits appeared to be delayed, with few changes observed until 2–3
weeks following exposure to elevated temperatures, at which point plasticity in enzyme activity, gill
structure, and SSI were finally observed. These delays likely contributed to the notably high mortality
rate observed in the first 2 weeks in the high-temperature treatment group for this species (Li et al.,
2015), with 20–79% mortality rates following exercise during this time period.
These two contrasting acclimation responses (immediate vs. delayed) may be related to the life
history strategies of each species. Notably, C. cuning is a roaming species that utilizes a high propor-
tion of aerobic red musculature and exhibits greater aerobic metabolic performance to move rapidly
among habitats seeking foraging opportunities (Randall et al., 1997). As a result, this species is
equipped to leave areas of unfavorable localized biophysical conditions, for instance, by swimming
deeper when temperatures in the shallow waters become too warm (Randall et al., 1997). By com-
parison, C. quinquelineatus is a sedentary, highly site-attached and territorial species, remaining
between coral branches during daytime and foraging in the water column close to shelter at night
(Randall et al., 1997). For swimming, C. quinquelineatus relies almost exclusively on anaerobic white
glycolytic muscle (Stickland, 1975) and may regularly be exposed to short fluctuations of tempera-
tures in its sheltered, shallow water habitats (e.g. during low tide) (Biro et al., 2010). Consequently,
in light of these life history strategies, it is logical for C. cuning to immediately initiate metabolically
costly compensatory mechanisms in situations where a stressor cannot be avoided, while C. quinque-
lineatus would benefit from delaying similar processes given the frequency with which they are
exposed to short-term perturbations. Unfortunately, while delayed responses may be beneficial for
short-term and relatively benign fluctuations in temperature, this strategy is unlikely to be advanta-
geous under prolonged thermal stress and may come at the expense of fitness-enhancing processes.
Indeed, SMR seemed to temporarily reduce below control levels in C. quinquelineatus in week 3,
potentially indicating incipient organ failure or a shutdown of non-critical functions, such as repro-
ductive organs. More than 50% of all C. quinquelineatus died over the course of the 5-week acclima-
tion period following exercise; whereas, no mortality was observed in C. cuning, potentially
Johansen, Nadler, et al. eLife 2021;10:e59162. DOI: https://doi.org/10.7554/eLife.59162 12 of 30Research article Ecology Evolutionary Biology
highlighting that we only saw acclimation responses in the most thermally resilient subset of the C.
quinquelineatus population.
The devastating impacts of climate change on marine resources reinforces the urgent need for
cross-disciplinary studies addressing the timescales, mechanisms, and limitations of thermal
responses in ectothermal marine species (Audzijonyte et al., 2019; Jutfelt et al., 2018). The GOLT
hypothesis asserts that fishes are unable to make necessary morphological adjustments to gill tissues
to meet increased oxygen demands under elevated temperatures (Pauly, 2019) and has been pro-
posed as a unifying explanation for an observed reduction in size and mass of fishes under climate
change (Pauly and Cheung, 2018). Here, we found clear signs of adaptive remodeling of the gill
perimeter and width in both of the species tested, resulting in increased lamellar surface area after
1–3 weeks of continuous exposure to elevated temperatures. As such, the responses reported here
do not conform to the GOLT. Instead, these data provide further support to the counter argument
in Lefevre et al., 2017, Lefevre et al., 2018, which states that gill surface area can increase to sup-
port metabolic needs and that temperature-driven changes in size and mass must be explained by
other mechanisms (Lefevre et al., 2018). Our results do, however, support the idea that cardio-
respiratory transport and tissue demand are primary determinants of an organism’s performance
under ocean warming (see extended discussions in Ern, 2019; Portner, 2014; Sandblom et al.,
2016), as an increase in total energy supply appeared to support C. cuning through the 5-week
acclimation period. whereas a lack of aerobic energy availability was associated with mass mortality
in C. quinquelineatus.
Useful biomarkers of thermal stress and ongoing acclimation
Seven biomarkers stood out as useful, conserved indicators to assess the degree and progress of
thermal acclimation. These include muscle CS activity, as an indication of changes in aerobic metab-
olism and mitochondrial density (Jayasundara et al., 2013; Windisch et al., 2011); blood glucose
and muscle LDH activity, as indicators of anaerobic energy production (Jayasundara et al., 2013;
Windisch et al., 2011); splenic RBC stores (SSI and Spleen [Hb]), denoting altered oxygen transport
capacity (Ken-Ichi, 1988), and lamellar perimeter and width, illustrating changes to oxygen uptake
capacity over the gills (Sollid and Nilsson, 2006). These seven parameters responded to short-term
and prolonged exposure to elevated temperatures in one or both of our study species, and all sub-
sequently returned to control values, except for splenic RBC stores. Although never previously exam-
ined in such detail, similar responses have been suggested in other non-warm adapted, thermally-
sensitive species during prolonged exposure to elevated temperatures (Jayasundara et al., 2013;
Windisch et al., 2011). The Antarctic notothenioid (Trematomus bernacchii) and eelpout (Pachycara
brachycephalum), for example, both appear to increase CS and LDH activities in response to rising
energetic needs (Jayasundara et al., 2013; Windisch et al., 2011). These responses were attributed
to both a shift in the primary metabolic fuel from lipids to carbohydrates, as carbohydrates can sus-
tain anaerobic metabolism (Jayasundara et al., 2013), and a decrease in ATP-generating capacity,
either due to limitations in oxygen delivery or impaired oxidative phosphorylation due to mitochon-
drial failure (Jayasundara et al., 2013; Windisch et al., 2011). Our data provide new insight to sup-
port these findings for warm- and cold-adapted stenotherms alike. Similar responses in oxygen
transport capacity and gill structure have also previously been recorded in some temperate marine
and tropical freshwater fishes (Chapman et al., 2000; Sollid and Nilsson, 2006). Populations of Afri-
can cichlids can increase lamellar surface area to facilitate greater oxygen transport (Chapman et al.,
2000; Schaack and Chapman, 2003), highlighting that the acclimation responses identified here
may, in fact, be useful biomarkers in a range of tropical species. Due to differences among species,
however, our data highlight that it is critical to examine several biomarkers together to more accu-
rately ascertain whether acclimation is still ongoing at a given time point.
Conclusions and recommendations
A mechanistic understanding of the rates, processes, and limitations of acclimation to global warm-
ing is critically important to understand species resilience into the future and to improve the accu-
racy of fisheries and ecosystem projections. Our study provides the first comprehensive, mechanistic
investigation of the thermal acclimation processes of tropical stenothermal fishes and the rates at
which they occur. Some parameters, such as SMR, may adjust within as little as 2 weeks. However,
Johansen, Nadler, et al. eLife 2021;10:e59162. DOI: https://doi.org/10.7554/eLife.59162 13 of 30Research article Ecology Evolutionary Biology
many other physiological parameters, including ASc and splenic RBC stores, appear to require signif-
icantly longer exposure periods to adjust. These results suggest that studies relying on shorter accli-
mation periods of less than 5 weeks may not capture the complete acclimation or performance
capacity of a species following an acute heating event.
Materials and methods
Study species and maintenance
Two species of tropical coral reef fishes were collected from locations in the northern Great Barrier
Reef using barrier nets, hand nets, and a mild clove oil anaesthetic solution under Marine Parks Per-
mit #G10/33239.1. The five-lined cardinalfish, C. quinquelineatus (n = 143 fish; 1.48 ± 0.08 g, body
mass ± SE), was collected from Sudbury Reef (17.00˚S, 146.08˚E) in the Cairns region in March-April
2014. The redbelly yellowtail fusilier C. cuning, (n = 110 fish; 22.20 ± 1.03 g, body mass ± SE), was
collected from the reefs surrounding Lizard Island (14.67˚S, 145.46˚E) in December 2013. In both
instances, water temperature was within 1˚C of control. Fishes were transported to the Marine and
Aquaculture Research Facilities Unit (MARFU) at James Cook University in Townsville, Queensland,
Australia.
All fishes were maintained in aquaria for a minimum of 14 days before acclimation trials began.
Fishes were maintained with a continuous supply of recirculated, filtered, aerated, and UV-sterilized
sea water and fed to satiation daily with aquaculture pellets (NRD pellets, INVE Aquaculture, Salt
Lake City, USA) and hatched Artemia spp. under a 12 hr:12 hr light:dark photoperiod. Individuals of
each species were randomly assigned to the control or high-temperature (+3.0˚C) treatment and
either assessment of metabolic performance (using respirometry protocols) or tissue analyses (see
Table 2 for sample sizes by treatment). To account for size differences between the two study-spe-
cies, all experimental setups and holding tanks were optimized for body size (body mass, standard
length, fish density, and total biomass). All C. cuning individuals (i.e. both those assigned to respi-
rometry protocols and tissue analyses) were housed in 400 L round aquaria (diameter: 1.2 m, depth:
50 cm), at a density of approximately 1.4 g L 1 seawater. One week prior to experimentation, indi-
vidual C. cuning that were assigned to respirometry trials were implanted with a unique visible
implant elastomer (VIE) tag (Northwest Marine Technology, Inc, Shaw Island, USA) subcutaneously
below the dorsal fin, which allowed for individual recognition through time with little to no deleteri-
ous impacts to the animal (Hoey and McCormick, 2006). For C. quinquelineatus, given cardinal-
fishes sensitivity to handling stress (Nilsson et al., 2010; Rummer et al., 2014), individuals assigned
to respirometry trials were each placed in their own individual transparent 3 L aquaria adjacent to
conspecifics, in order to allow for individual identification through time while minimizing risk of
stress-induced mortality. Fish used for tissue analyses were housed in 9L aquaria (W:22.0 cm x
H:22.5 cm x L:22.0 cm) at a density of approximately 1 g L 1 seawater. All animal care and experi-
mental procedures complied with those framed by the James Cook University Animal Ethics Com-
mittee (Permit A2089, approved for this study).
Table 2. Sample size of each parameter across species and exposure week.
For histological samples, each Individual was used for both tissue and gill analyses. For respirometry (due to ethical requirements to
minimize sample numbers), we used a mixed-staggered repeated measures design in which each individual was tested twice where
possible, but with a 3-week separation between each trial (i.e. Week 0 and Week 3, Week 1 and Week 4, and Week 2 and Week 5).
Species Parameter Ctrl Week 0 Crtl Week 5 Week 0 Week 1 Week 2 Week 3 Week 4 Week 5
C. quinquelineatus Tissue 8 8 7 8 8 8 8 6
C. quinquelineatus Gill (thickness, perimeter, width) 5, 4, 4 6, 3, 3 5, 5, 5 5, 6, 6 7, 6, 6 2, 2, 2 7, 4, 4 6, 5, 5
C. quinquelineatus Respirometry / mortality 8 8 14 10 9 13 13 0
C. cuning Tissue / blood 8 8 8 8 8 8 8 8
C. cuning Gill (thickness, perimeter, width) 7, 6, 6 5, 4, 4 8, 8, 8 7, 5, 5 5, 5, 5 8, 5, 5 7, 5, 7 6, 6, 6
C. cuning Respirometry / mortality 8 8 8 7 8 8 7 8
Johansen, Nadler, et al. eLife 2021;10:e59162. DOI: https://doi.org/10.7554/eLife.59162 14 of 30Research article Ecology Evolutionary Biology
Temperature acclimation
All fishes were either assigned to a control group (29.0 ± 0.5˚C; target temperature treatment ±
range) or a high-temperature group (32.0 ± 0.5˚C). The control temperature replicated the average
summer temperature experienced in the northern Great Barrier Reef (Hughes et al., 2017). The
high-temperature treatment was chosen to simulate the estimated +3.0˚C already experienced dur-
ing acute heating events and also projected as the mean rise in summer temperature by 2100
(Collins et al., 2013; Garrabou et al., 2009; Hughes et al., 2017; IPCC, 2013; Pörtner et al.,
2019). In order to reach the experimental temperature for this treatment, water temperature was
increased at a rate of 1.0˚C day 1 until the target temperature was reached. Water temperature was
maintained using automated heaters (5000W, Control Distributions, Carlton, Australia). To estimate
the time required for acclimation, +3.0˚C exposed fishes were tested and sampled weekly for 4–5
consecutive weeks and compared to concurrent control samples taken in the beginning and end of
the experimental period. To ensure a post-absorptive state, food was withheld from all fishes for 24
hr prior to experimentation or sampling (Niimi and Beamish, 1974).
Respirometry
Oxygen uptake rates (MO _ 2 ) were obtained using intermittent-flow respirometry and used as a proxy
for whole-animal aerobic metabolic rate (Svendsen et al., 2016). Three estimates of metabolic rate
were examined: (1) SMR (metabolic rate of a fasted and resting individual), (2) MMR (the maximum
aerobic metabolic rate that an individual can achieve, Svendsen et al., 2016), and (3) ASc (the scope
for activities beyond basic maintenance) calculated as the absolute difference between MMR and
SMR (Chabot et al., 2016; Norin and Clark, 2016; Roche et al., 2013). To measure MO _ 2 , individual
fish were placed into a 0.5 m (diameter) round aquarium containing well-aerated and temperature-
controlled seawater (0.2 m deep), which was maintained at the same temperature as the fish’s accli-
mation temperature (5000W, Control Distributions, Carlton, Australia). Fish were first chased contin-
uously by hand for 3 min and then scooped into a mesh net and maintained out of the water for
either 1 min (C. cuning) or 30 s (C. quinquelineatus) (Clark et al., 2013; Killen et al., 2017;
Roche et al., 2013; Rummer et al., 2016). Following air exposure, fish were immediately placed
into an acrylic cylindrical, intermittent-flow respirometry chamber (110 mL for C. quinquelineatus and
370 mL for C. cuning following the design of Svendsen et al., 2016) and submerged in an 800 L
temperature-controlled water bath (5000W heater, Control Distributions, Carlton, Australia). Within
10 s of placing the fish into the chamber, post-exercise MO _ 2 was monitored continuously. This con-
tinued for a period of 7 min (C. cuning) or 9 min (C. quinquelineatus), after which time a submersible
flush pump (Aquapro AP200LV, 200 L h 1) flushed each chamber with aerated, temperature-con-
trolled seawater from the surrounding water bath (3 min for both species). Following this, fish
remained in chambers (with intermittent flushing cycles) to recover from exercise and reach SMR for
an additional 18–24 hr, a time period deemed more than sufficient in similar reef fish species in past
studies (Chabot et al., 2016; Roche et al., 2013). Each chamber was mixed continuously throughout
each trial using a recirculating pump connected to the chamber in a closed loop, in order to ensure
a homogenous concentration of oxygen throughout the chamber (Svendsen et al., 2016). A total of
eight respirometry chambers were run in parallel. The 7- and 9-min measuring periods were chosen
to ensure that MO_ 2 produced a linear decline in oxygen saturation within the chambers sufficient to
calculate slope, but short enough to maintain oxygen saturation levels above 80% for each species
(following Svendsen et al., 2016).
Throughout the entire respirometry trial, dissolved oxygen concentration (mg L 1) of the water in
each chamber was measured continuously (frequency 0.5 Hz) using an oxygen-sensing optode
mounted in the recirculation loop, to ensure that flow was sufficient for a rapid response time of the
sensor (Svendsen et al., 2016). These optodes were linked to two 4-channel Firesting Optical Oxy-
gen Meters (Pyro Science, Aachen, Germany), which were connected to a PC that logged all oxygen
data.
Raw text files were imported into LabChart v.6.1.3 (ADInstruments, Dunedin, New Zealand) and
_ 2 (mg O2 kg 1 h 1) was calculated from each slope (linear regression of oxygen concentration
MO
decline over time) throughout the trial using equations modified from Bushnell et al., 1994 and
Schurmann and Steffensen, 1997, taking into consideration the volume of the respirometry cham-
ber, mass of the fish, and water displacement of the fish. The maximal oxygen uptake rate was
Johansen, Nadler, et al. eLife 2021;10:e59162. DOI: https://doi.org/10.7554/eLife.59162 15 of 30Research article Ecology Evolutionary Biology
calculated during the first measurement period following exercise, defined as the steepest 1 min
slope section with an r2 >0.99, and used to estimate MMR. The SMR was estimated from the aver-
age of the lowest 10% of MO _ 2 values recorded during the 18–24 hr recovery period (Clark et al.,
2013; Rummer et al., 2014; Rummer et al., 2013). Background MO _ 2 (calculated as an exponential
increase based on measures of oxygen depletion in the empty respirometer before and after each
_ 2 measurements. An exponential increase in background respiration
trial) was subtracted from all MO
was used to account for the typical growth rate of bacteria. To limit background respiration rates to
less than 5% of a fish’s SMR, all water flowed through a 36W UV filter (Blagdon Pro, UVC 16200,
China) during experiments. Additionally, between all experiments, chambers and pumps were rinsed
with a 10% bleach solution and fresh water and allowed to dry before commencing further trials.
Blood and tissue analyses
Fishes were captured from holding tanks and isolated in flow-through holding containers within their
respective holding tanks for 4 hr prior to blood and tissue sampling, as this minimized capture stress
immediately prior to sampling and allowed all fish to be sampled in the same state. Immediately
prior to sampling, all fish were euthanized by cranial concussion. All animals were then weighed (Mb;
body mass, in g) and measured (L; standard length, in mm), so that Fulton’s K Condition Factor
could be calculated using the equation:
K ¼ 100 Mb =L3 :
For C. cuning only, blood was drawn from the caudal vein and collected in 1 mL heparinized syrin-
ges. Whole blood hemoglobin concentration was determined using a HemoCue (Hb 201 System,
Australia Pty Ltd.) with 10 mL of whole blood (reported as grams per 100 mL using a calibration curve
according to Clark et al., 2008 corrected for tropical reef species by Rummer et al., 2013). Whole
blood glucose and lactate concentrations (mM) were measured using 15 ml of blood in an Accutrend
Plus (Roche Diagnostics Australia Pty Ltd.). Hamatocrit (Hct) was determined by centrifuging 60 ml of
whole blood in heparinized micro-capillary tubes for 3 min and calculated as the ratio of packed
RBCs to total blood volume (%). Both whole blood hemoglobin and Hct were used to calculate the
mean corpuscular hemoglobin content (MCHC). Plasma volume was generally insufficient for other
analyses (e.g. Cl-, HCO-3, total CO2, and catecholamines). No blood analyses were conducted on C.
quinquelineatus, as it was not possible to draw a sufficient volume of blood. However, some blood
oxygen transport properties were assessed by analyzing the spleen (e.g. spleen somatic index and
spleen hemoglobin concentration).
For all animals, pectoral muscle and spleen tissue was dissected, flash frozen in liquid nitrogen,
and stored at 80˚C until later analyses. The second gill arch from each side of the fish was also dis-
sected. One gill arch was flash frozen in liquid nitrogen and stored at 80˚C for subsequent enzyme
analyses, while the second gill arch was preserved in 10% neutral buffered formalin (replaced after
48 hr with 70% EtOH) for histological analyses. The spleen-somatic index (SSI) was calculated as the
ratio of the spleen to body mass (expressed as a %). The spleen was then homogenized in 1 mL
Drabkin’s solution (Sigma-Aldrich cat. no. D5941; St. Louis, MO, USA) and absorbance was mea-
sured spectrophotometrically at 540 nm. Spleen hemoglobin concentration was then calculated by
applying a millimolar extinction coefficient of 11 and accounting for spleen volume (by mass).
Frozen gill and red muscle tissues were homogenized in an enzyme extraction buffer (5 mM
EDTA, 0.1% Triton X-100, 0.2 mM dithiothreitol, 50 mM HEPES (pH 7.4 at 25.0˚C)) using a
FastPrep 24 homogenizer (MP Biomedicals, Santa Ana, USA). The supernatant was stored at 80˚C
and used for the subsequent enzyme assays. All assays were performed on a temperature-controlled
Spectramax Plus 384 Microplate Reader spectrophotometer (Molecular Devices, Sunnyvale, CA) at
25.0˚C. Protein content (mg mL 1) was determined using the Bradford’s method with a standard
curve built using serial dilutions of commercially available bovine serum albumin standards (BSA);
this is an accepted and standard means for determining the total protein concentration of a homog-
enate (Bradford, 1976). LDH, an indicator of anaerobic energy production, was measured using a
modified assay from Johnston et al., 1977. The assay buffer consisted of 50 mM Tris-HCl, 2 mM
sodium pyruvate and 0.15 mM NADH (pH 8.0). Absorbance was measured at 340 nm for 3 min. CS,
the first enzyme in the tricarboxylic acid (TCA) cycle and marker of mitochondrial density, was mea-
sured according to McClelland, 2005. The assay buffer contained 20 mM TRIS (pH 8.0), 0.1 mM
Johansen, Nadler, et al. eLife 2021;10:e59162. DOI: https://doi.org/10.7554/eLife.59162 16 of 30You can also read