Automatically Discovering Unknown Product Attributes Impacting Consumer Preferences
←
→
Page content transcription
If your browser does not render page correctly, please read the page content below

Marketing Science Institute Working Paper Series 2022
Report No. 22-107

Automatically Discovering Unknown Product Attributes Impacting Consumer
Preferences

Ankit Sisodia, Alex Burnap and Vineet Kumar

“Automatically Discovering Unknown Product Attributes Impacting Consumer Preferences” © 2022

Ankit Sisodia, Alex Burnap and Vineet Kumar

MSI Working Papers are Distributed for the benefit of MSI corporate and academic members and the general public.
Reports are not to be reproduced or published in any form or by any means, electronic or mechanical, without
written permission.

Automatically Discovering Unknown Product
 Attributes Impacting Consumer Preferences
 Ankit Sisodia, Alex Burnap, Vineet Kumar
 Yale School of Management, ankit.sisodia@yale.edu, alex.burnap@yale.edu, vineet.kumar@yale.edu

 February 2022

 Marketing models typically focus on understanding how structured product attributes impact consumer
 preferences. However, obtaining attributes present in unstructured data (e.g. text or images), although
 important, rely on human (expert) judgment. Our research building on recent advances in disentangled rep-
 resentations (with statistical independence and semantic meaning) in deep learning aims to discover such
 attributes from unstructured data automatically, without human intervention. The recent deep learning lit-
 erature has emphasized supervision of the discovered attributes on ground truth, as unsupervised approaches
 are not theoretically guaranteed to discover unique disentangled representations. Our approach does not
 require ground truth on the visual attributes, which is assumed in most of the literature. We instead use
 readily available structured product attributes as supervisory signals, and identify which signals work best.
 Our approach is practically useful since we do not need to specify the number of attributes or their meaning,
 yet we discover semantically interpretable and statistically independent attributes. We apply this approach
 to automatically discover visual product attributes of high-end watches auctioned at Christie’s, and discover
 6 semantically interpretable visual attributes providing a disentangled representation. We find that supervi-
 sory signals such as ‘brand’ promote disentanglement relative to the unsupervised approach, but surprisingly
 ‘price’ does not.

 Key words : Attribute Discovery, Deep Learning, Disentanglement

 1
Marketing Science Institute Working Paper Series

2 Sisodia, Burnap, and Kumar: Automatically Discovering Unknown Product Attributes

1. Introduction
Product attributes form the basis of consumer choice and willingness to pay (WTP) for almost all
products and services. At the market level, hedonic demand theory posits that market demand for
a product is the aggregation of demand over its underlying product attributes (Lancaster 1966).
Unsurprisingly, attributes form the foundation for quantitative models used in marketing and
economics, for tasks ranging from quantifying consumer preferences (Guadagni and Little 1983),
pricing products and services (Mahajan et al. 1982) as well as modeling competitive markets (Berry
et al. 1995). For these tasks, the relevant set of attributes for the model must be defined in advance;
for example, for a car this may include horsepower, fuel efficiency, and towing capacity.
 However, attributes are typically manually defined using human judgment. The (human) modeler
defines attributes using a combination of intuition and expertise, pre-defined attributes governed
by availability of structured data, and qualitative methods based on consumer input like Voice of
the Customer (Griffin and Hauser 1993). In some categories, the set of relevant attributes may be
obvious and previously determined; however, in other categories, attributes potentially unknown
to the researcher may strongly impact consumer valuation, and even the number of such unknown
attributes may not be apparent. For example, attributes capturing a product’s visual aesthetics
are critical drivers of purchase for categories like fashion goods or automobiles, yet enunciating
why a product looks appealing is challenging for researchers and consumers alike (Berlyne 1973).
 Research Goal: Our research aims to automatically discover multiple (visual) attributes directly
from unstructured big data (e.g., images), in which the attributes are semantically interpretable
(i.e. make sense to humans). Our goal is complementary to widely-adopted yet manual approaches
for attribute discovery, which either involve researcher judgment or consumer input through surveys
and focus groups. It may be helpful to understand why it is desirable to have an automated
method for attribute discovery. First, existing methods based on human judgment are inherently
not scalable to marketing channels flush with unstructured data (e.g., a brand’s social media, a
product’s textual reviews), potentially missing information required for defining attributes. Second,
prior research has found that even experienced users or researchers may not be able to define such
attributes (Berlyne 1973). Third, when the underlying attributes changes (e.g. a brand undergoes
a design change or new products enter the market), it can be quite costly to repeat the process to
obtain the new attributes (Karjalainen and Snelders 2010).
 We automatically discover attributes using a methodology built on disentangled representation
learning, an emerging area of deep learning that aims at identifying independent yet semantically-
meaningful factors of variation within data (Bengio et al. 2013). By entanglement, we mean
that a change in value across one discovered attribute impacts multiple semantically-interpretable

Marketing Science Institute Working Paper Series
Sisodia, Burnap, and Kumar: Automatically Discovering Unknown Product Attributes 3

attributes, whereas a disentangled representation would result in a change to only one semantically-
interpretable attribute, i.e. a one-to-one mapping. In our case, we disentangle (or separate out)
attributes that are present but hidden and unknown in unstructured big data commonly found
in marketing (e.g., images, text, videos), with the hope that we discover attributes beyond those
typically found in structured data, e.g., brand. Figure 1 (Tables and Figures follow Reference
throughout) illustrates the difference between disentangled and entangled representations.
 Advantages of Our Approach: Our approach provides practical advantages to both academics and
practitioners. First, our disentanglement-based approach is designed to work with unstructured big
data that would be practically obtainable in real managerial contexts (e.g., product images, textual
reviews). Thus, marketing data like sales or consumer choices (typical dependent variables Y) and
structured product characteristics (typically explanatory variables X) can now be augmented with
discovered attributes hidden in textual reviews or product images (unstructured data). Second,
the researcher does not need to define these (unknown) attributes in advance, and does not even
need to specify the number of such attributes that must be discovered. Third, our approach also
automatically determines the quantitative levels associated with each of the discovered unstruc-
tured (visual) attributes. Fourth, the output of the machine learning part of our approach can be
embedded in a downstream task, e.g. a demand estimation model, to obtain a quantitative evalu-
ation of how much each discovered unstructured (visual) attribute impacts an economic primitive
(e.g., willingness to pay). Thus, our work complements recent work in marketing that has used
deep learning methods to extract researcher-defined attributes from unstructured data such as
images (Zhang et al. 2021b,a, Zhang and Luo 2018, Troncoso and Luo 2020) or directly used the
unstructured data to find an outcome of interest such as return rate (Dzyabura et al. 2019) or
brand attributes (Liu et al. 2020).
 Methodology: Our work is connected with and situated in the context of multiple streams of
deep learning literature. We provide an overview here and refer readers to Appendix A of the
Supplement for a comprehensive literature review. Recent advances in disentanglement within
deep learning have primarily been developed using either generative adversarial networks (GANs)
(Goodfellow et al. 2020) or variational autoencoders (Kingma and Welling 2014). InfoGAN (Chen
et al. 2016) was perhaps the first GAN-based disentanglement method, and took an information-
theoretic based approach that has been employed in more recent models such as Info-StyleGAN
(Nie et al. 2020) built using StyleGAN (Karras et al. 2019). Generally, while GAN-based methods
have much higher generative quality, they tend to learn comparably more entangled representations
than VAE-based methods. A detailed comparison of the characteristics of both GANs and VAEs
is provided in Appendix A.3 of the Supplement.

Marketing Science Institute Working Paper Series
4 Sisodia, Burnap, and Kumar: Automatically Discovering Unknown Product Attributes

 Since our primary goal is to infer disentangled representations from unstructured data rather
than generating realistic unstructured data output, we base our disentanglement approach upon a
VAE, which includes an encoder neural net and decoder neural net, both of which are parametrized
by highly nonlinear deep neural networks. The encoder neural net takes high-dimensional unstruc-
tured data (e.g., images) as input and outputs a latent low-dimensional vector (i.e., discovered
attributes), whereas the decoder neural net takes as input the low-dimensional vector and attempts
to reconstruct the original data as output.1 Deep autoencoders have found recent application in
business and marketing; for example, Dew et al. (2021) used VAEs to study logo design and Malik
et al. (2019) used conditional adversarial autoencoders to study the impact of beauty premium
in human faces on career outcomes. However, these studies did not aim to obtain disentangled
representations.
 To promote disentanglement, we instead penalize the total correlation of the discovered attributes
such that they are statistically independent (Chen et al. 2018, Hoffman and Johnson 2016, Kim
and Mnih 2018). Ideally, changes along any one of the discovered attributes leads the reconstructed
image to change visually only along that one attribute.
 A key challenge of any disentanglement approach is that there is no theoretical guarantee to
discover a set of disentangled unstructured (visual) attributes even if independence is enforced,
unless the disentanglement algorithm is supervised using ground truth labels of the unstructured
(visual) attributes (Locatello et al. 2019). In other words, the labels (supervisory signals) we would
need are the same attributes we are trying to discover in the first place.2 Existing methods in deep
learning have shown that learned attributes can be disentangled if unstructured data is labeled
even if the labeling is partial, incomplete, or imprecise (Locatello et al. 2020). However, such label-
ing requires humans, contrasting with our goal of automatically disentangling attributes from data
typically found in marketing applications. Further, our work is motivated by marketing applica-
tions which typically do not have even partial ground truth of unstructured product attributes.
Our method instead leverages supervision on readily available, complete, and precise structured
data that are collected in marketing data sets. Specifically, the encoder neural net is additionally
connected to a supervised neural net, thereby connecting the discovered visual attributes to struc-
tured attributes (e.g., brand). This enables us to study the issue of supervised vs unsupervised
disentanglement; in particular, how typical structured attributes found in marketing may be used
to improve disentanglement, and thus, automated attribute discovery.
1
 For instance, images are typically high-dimensional data, since even a modest-sized image of 1,000×1,000 pixels
exists in a 1,000,000-dimensional space. But suppose each of the images represented a black and white circle; each
circle can be completely represented by the location of its center (x, y) and its radius r, thus essentially making the
data 3-dimensional.
2
 A bijective function of the attributes would work as well (Khemakhem et al. 2020).

Marketing Science Institute Working Paper Series
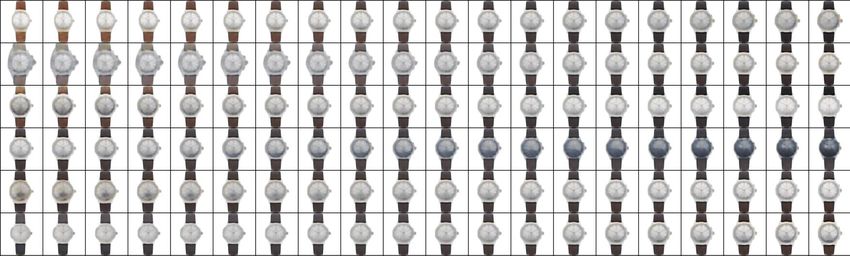
Sisodia, Burnap, and Kumar: Automatically Discovering Unknown Product Attributes 5

 Application and Results: We apply the proposed approach in the visual domain, with the goal of
automatically discovering visual attributes of luxury watches. Our empirical context uses unique
data from auctions of high-end luxury watches by Christie’s spanning a 10-year period (2010 —
2020). We chose this application for a few underlying reasons. First, watches represent a product
category where visual and design aspects captured in the images are likely to play an important
role in consumer valuation and choice behavior (Kotler and Rath 1984). Second, as typical with
marketing data, we have structured data appropriately matched up with the images. Third, the
auction mechanism provides prices that represent the true valuation (WTP) of the highest bidder,
which is an economic primitive of interest (Milgrom and Weber 1982).
 Our method automatically discovers six visual attributes of the watches. These discovered
attributes correspond to ‘size of the dial’, ‘dial color’, ‘strap color’, ‘dial shape’, ‘size of the knob’,
and ‘rim color’. Figure 2b gives an example of these discovered attributes for one randomly selected
watch. This example allows the reader to visually evaluate disentanglement performance, defined
as both attribute independence (i.e., how each attribute changes independently of each other) and
semantic interpretability (i.e., how well can humans understand) (Higgins et al. 2017, Burgess et al.
2017, Higgins et al. 2021). For example, as the attribute level for ‘dial color’ increases, the ‘dial
color’ increases from light to dark but other visual attributes remain the same.
 We next study the issue of supervised vs unsupervised disentanglement. We evaluate how well
various supervised and unsupervised modeling specifications affect disentanglement performance of
the six discovered attributes. Our supervised disentanglement model specifications include super-
visory signals related to product (e.g., brand, circa, material), place (e.g., auction location), and
price (e.g., willingness to pay), while our unsupervised disentanglement method uses no supervisory
signals at all. For model selection of supervised disentanglement models, we choose the hyperpa-
rameter settings that lead to the lowest supervised loss on a validation dataset (Locatello et al.
2020). For the unsupervised approach, we use unsupervised disentanglement ranking (UDR), a
metric for evaluating disentanglement performance when the ground-truth product attributes are
unknown as typical in real-world datasets like ours (Duan et al. 2020). In our case, we use UDR for
unsupervised disentanglement model selection (on a validation set), as well as a model comparison
metric (on a test set) for both the supervised and unsupervised disentanglement models.
 Our results are in part unexpected. In our comparison of supervisory signals for disentangle-
ment, we find that ‘brand’ helps but ‘price’ hurts disentanglement performance relative to an
unsupervised approach. This is surprising as ‘price’ is one of, if not the most significant economic
primitives affecting product design. In other words, since ‘price’ is often assumed as function of
product attributes (and consumer preferences over those attributes), we expected using it as a
supervisory signal would improve disentanglement—instead, it resulted in worse disentanglement

Marketing Science Institute Working Paper Series
6 Sisodia, Burnap, and Kumar: Automatically Discovering Unknown Product Attributes

than no supervision at all. Lastly, we provide an illustrative application in Appendix E of the
Supplement of how one might use discovered visual attributes in a typical marketing application.
In the application, we estimate the impact of visual attributes on consumer willingness-to-pay.
 Contributions: We provide an automated approach that does not rely on human judgment to
discover product attributes from unstructured data typically found in marketing. Such attributes
could be used in competitive analysis, product positioning and pricing decisions by firms. In addi-
tion to the direct value of such discovery, and understanding how they impact consumers, they can
have an indirect impact on structured attributes. When inferring economic valuation of structured
attributes, we could have omitted variables (from unstructured data), leading to biased inference
due to unobserved correlation between unstructured (visual) and structured attributes.
 From a methodological perspective, our paper makes contributions on the issue of supervised
versus unsupervised disentanglement in representation learning. First, we show that attributes
can be discovered without access to ground truth from visual or unstructured data. We show
how structured data typically available in marketing applications may be used as supervisory
signals for obtaining better disentanglement. This aspect is useful as the machine learning literature
often assumes the presence of ground truth supervisory signals, which are seldom available in real
managerial applications. Second, and equally important, we demonstrate that just the idea of using
any supervised signal might not work and may indeed backfire. The machine learning literature
has focused on using a supervised approach due to known theoretical challenges with recovering a
unique latent representation via unsupervised disentanglement. However, our research points out
that, in practice, supervised learning may not be a panacea and that the choice of supervisory signal
is critically important. In fact, many supervisory signals actually lead to worse disentanglement
than using no supervision at all (i.e., unsupervised disentanglement).
 Limitations: Our approach has several limitations worth noting and addressing in future
research. First, it requires structured data to be matched to corresponding unstructured data.
In our application the watch images are matched to corresponding structured characteristics and
auction price, but other applications may not have such structured data. Second, although the
algorithm does not require human intervention, the data is preprocessed once to ensure centering,
similar size, background color, and orientation. Third, no algorithm can guarantee semantic inter-
pretability for newly discovered features, because that is a uniquely human ability (Locatello et al.
2019, Higgins et al. 2021). However, in practice we observe that it performs well in a realistic and
practical setting. It would be useful to test the semantic interpretability of the different models
considered in our paper with humans to more thoroughly quantify semantic interpretability.

Marketing Science Institute Working Paper Series

Sisodia, Burnap, and Kumar: Automatically Discovering Unknown Product Attributes 7

2. Methodology
Our proposed approach builds on recent advances in disentangled representation learning, a stream
of machine learning focused on learning lower-dimensional re-representations of high-dimensional
data. Most disentanglement methods are built on deep generative models, most notable variational
autoencoders (VAE) and generative adversarial networks (GAN), which we describe more com-
prehensively in Appendix A of the Supplement. Our model is a VAE (Kingma and Welling 2014)
extended for supervised learning and disentanglement. Our method is illustrated in Figure 2 (Tables
and Figures follow Reference throughout). We encode unstructured data (e.g. text or images) to
discover unstructured (visual) attributes that are independent, low-dimensional and semantically
interpretable (e.g., shape) and then decode the discovered unstructured (visual) attributes to recon-
structed unstructured data as well as predict a supervised signal (e.g., typical marketing structured
data such as brand) from the discovered unstructured (visual) attributes. The model minimizes
the weighted sum of five different type of losses — reconstruction loss, mutual information loss,
total correlation loss, dimension-wise Kullbeck-Leibler (KL) loss and supervised loss.

2.1. Model: Supervised Variational Autoencoder with Disentanglement Losses
We first describe a VAE and subsequently describe how it is extended with disentanglement con-
straints and supervision using structured data. We denote the observed dataset D = {X, Y} =
{(x1 , y1 ), . . . , (xN , yN )} where the i-th observation is a high-dimensional product image xi and its
corresponding supervised signal yi . The VAE assumes a two-step data generating process. The
first step samples the (visual) discovered attributes denoted by zi ∈ RJ , where J is the maximum
number of attributes to be discovered. In the second step, the product image xi is reconstructed
from the conditional distribution pθ (x|z) = f (x; z, θ), where f (x; z, θ) is a multivariate Gaussian
distribution whose probabilities are formed by nonlinear transformation of the attributes, z, using
a neural network with parameters θ. Likewise, the signal yi is predicted from the conditional dis-
tribution pw (y |z) = f (y; z, w), where f (y; z, w) is a function formed by non-linear transformation,
with parameters w, of unstructured (visual) attributes z.
 We refer to pθ (x|z) as the decoder neural net, qφ (z|x) as the encoder neural net, and pw (y |z)
as the supervised neural net. As in variational Bayesian inference (Blei et al. 2017) the true pos-
terior pθ (z|x) is intractable, so we follow the original VAE assumption that the true posterior can
be approximated using a variational family of Gaussians with diagonal covariance log qφ (z|x) =
log N (z;µ σ 2 I) where µ and σ are the mean and the s.d. of the approximate posterior (Kingma and
 µ,σ
Welling 2014). We simultaneously train the encoder neural net, the decoder neural net, and the
supervised neural net, by minimizing a variational bound to the negative log-likelihood. In practice,
this results in a loss minimization problem to find point estimates of the neural network parameters,

Marketing Science Institute Working Paper Series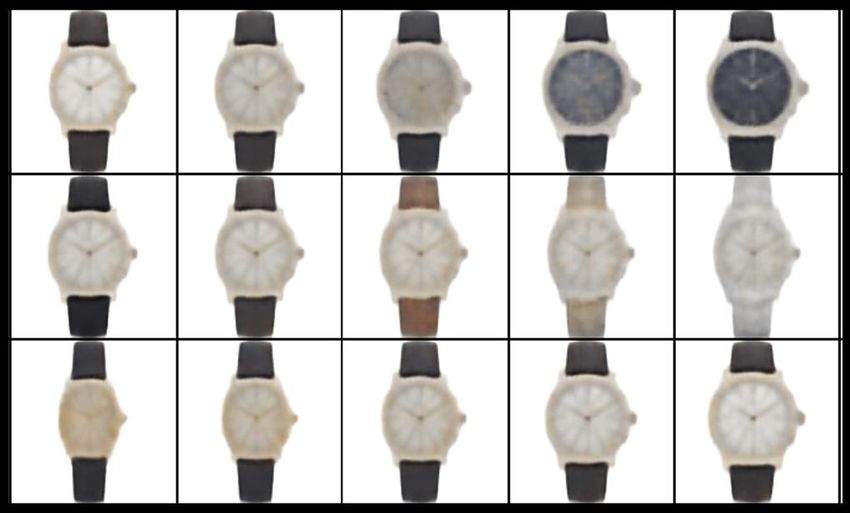
8 Sisodia, Burnap, and Kumar: Automatically Discovering Unknown Product Attributes

(θ, φ, w), while inferring a full distribution over the discovered attributes, zi ∈ RJ . The parameter
space or number of weights of the deep neural networks in intended applications are often in the
range of hundreds of thousands to hundreds of millions depending on architectural decisions (e.g.,
our chosen architecture in Appendix B of the Supplement has 1,216,390 parameters).
 The overall loss is composed of several loss terms corresponding to a VAE extended with super-
vision and disentanglement terms. We detail these losses by starting with the loss for the original
VAE in Equation (1), and refer readers to Kingma and Welling (2014) for its detailed derivation.

 L(θ, φ, w) = Eqφ (z|x) [log pθ (x|z)] + KL [qφ (z|x)||p(z)] (1)
 | {z } | {z } | {z }
 Total Loss Reconstruction Loss Regularizer Term

 To learn disentangled representations, a recent model denoted β-VAE (Higgins et al. 2017)
extends Equation 1 by imposing a heavier penalty on the regularizer term using an adjustable
hyperparameer β > 1.3 Intuitively, β-VAE uses the hyperparameter β to sacrifice reconstruction
accuracy in order to learn more disentangled representations. We adopt this decomposition and
further extend it by decomposing the regularizer term in Equation (1) into three terms (Chen et al.
2018, Hoffman and Johnson 2016, Kim and Mnih 2018). These three terms enable us to directly
and separately control disentanglement constraints of the model as follows in Equation (4).

 " J
 # J
 Y X
 KL [qφ (z|x)||p(z)] = Iq (z, x) + KL q(z)|| q(zj ) + KL [q(zj )||p(zj )] (4)
 | {z } | {z } j=1 j=1
 Regularizer Term Mutual Information
 of Total Loss Loss | {z } | {z }
 Total Correlation Dimension-Wise
 Loss KL Divergence Loss

 We finally add a supervised loss term to enforce the discovered attributes to help predict the
supervised signal y in Equation (5). This enables us to study whether using typical structured data

3
 Higgins et al. (2017) derive the β-VAE loss function as a constrained optimization problem. Specifically, the goal is
to maximize the reconstruction accuracy subject to the inferred visual attributes being matched to a prior isotropic
unit Gaussian distribution. This can be seen in Equation 2 where  specifies the strength of the applied constraint.

 max Eqφ (z|x) [log pθ (x|z)] subject to KL [qφ (z|x)||p(z)] <  (2)
 θ,φ

We can re-write Equation 2 as a Lagrangian under the KKT conditions (Kuhn and Tucker 2014, Karush 1939), where
the KKT multiplier β is a regularization coefficient. This explicit coefficient β is used as a hyperparameter (set by
the researcher) to promote disentanglement, and results in the β-VAE formulation in Equation 3.

 L(θ, φ, β; x, z) ≥ F(θ, φ, β; x, z) = Eqφ (z|x) [log pθ (x|z)] − β(KL [qφ (z|x)||p(z)]) (3)

Marketing Science Institute Working Paper Series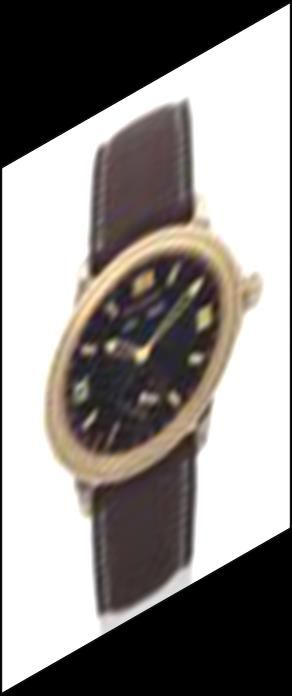
Sisodia, Burnap, and Kumar: Automatically Discovering Unknown Product Attributes 9

(e.g., ‘brand’) in a supervised approach helps improve disentanglement, and moreover, compare
supervised disentanglement versus unsupervised disentanglement.

 L(θ, φ, w) = Eqφ (z|x) [log pθ (x|z)] + α Iq (z, x) (5)
 | {z } | {z } | {z }
 Total Loss Reconstruction Mutual
 Loss Information
 Loss
 " J
 # J
 Y X
 + β KL q(z)|| q(zj ) + γ KL [q(zj )||p(zj )] + δ P (ŷ(z), y)
 | {z }
 j=1 j=1
 | {z } | {z } Supervised
 Loss
 Total Correlation Dimension-Wise
 Loss KL Divergence Loss

 Our model’s total loss is comprised of five loss terms weighted using the scaling hyperparam-
eters, (α, β, γ, δ). Adjusting these hyperparameters critically affects disentanglement performance
by adjusting the relative weight of each of the five loss terms, for which we detail the intuition
below:4
 Reconstruction Loss: Penalizing the reconstruction loss encourages the reconstructed output x̂(z)
to be as close as possible to the input data x. This ensures that the discovered attributes possess
the necessary information to be able to reconstruct the product image.
 Mutual Information Loss: Iq (z, x) is the mutual information between the discovered unstructured
(visual) attribute z and the product image x. From an information-theoretic perspective (Achille
and Soatto 2018), penalizing this term reduces the minimum amount of information about x stored
in z that is sufficient to reconstruct the data by ensuring z does not store nuisance information. A
low α would result in z storing nuisance information, whereas a high α results in loss of sufficient
information needed for reconstruction. We follow the β-TCVAE approach (Chen et al. 2018) and
impose α = 1 and not more on this term to encourage the visual attributes to store the minimum
amount of information about the raw data that is sufficient to reconstruct the raw data while not
compromising on the reconstruction accuracy. " #
 J
 Y
 Total Correlation Loss: The total correlation, KL q(z)|| q(zj ) , represents a measure of
 j=1
dependence of multiple random variables in information theory (Watanabe 1960). If the latent
variables z are independent, then the KL divergence is zero. More generally, a high penalty for the
total correlation term forces the model to find statistically independent visual attributes. A high β
results in a more disentangled representation but with potentially worse reconstruction quality. We

4
 Note that adjusting these hyperparameters also leads to different models as special cases. In the original VAE,
α = β = γ = 1 and δ = 0. In the β-VAE, α = β = γ > 1 and δ = 0, meaning that a heavier penalty is imposed on all
three terms of the decomposed regulariser term in Equation 4. Finally, in β-TCVAE, α = γ = 1, β > 1 and δ = 0
and thus there is a heavier penalty only on the total correlation loss term. In our proposed supervised approach, we
impose α = γ = 1 and find values of the hyperparameter set Ω = {β, δ}. We compare it with an unsupervised approach
in which we impose α = γ = 1, δ = 0 and find the values of the hyperparameter set Ω = {β}.

Marketing Science Institute Working Paper Series
10 Sisodia, Burnap, and Kumar: Automatically Discovering Unknown Product Attributes follow the β-TCVAE approach (Chen et al. 2018) and find the value of the hyperparameter β in order to learn disentangled representations for both supervised as well as unsupervised approaches. XJ Dimension-Wise KL Loss: The dimension-wise KL loss term, KL [q(zj )||p(zj )], penalizes the j=1 objective to push q(zj ) to the prior p(zj ) encouraging the probabilistic structure imposed by the parametric assumptions of the prior (e.g., Gaussian). This term promotes continuity in the latent space, which allows generation from a smooth and compact region of latent space. We follow the β- TCVAE approach (Chen et al. 2018) and impose γ = 1 to encourage the individual visual attributes to not deviate too much from the prior distribution while not compromising on the reconstruction accuracy. Supervised Loss: Penalizing the supervised loss P (ŷ(z), y), where ŷ(z) ∼ pw (y |z) prioritizes the discovered visual attributes z to obtain high accuracy in predicting y. We find the value of the hyperparameter δ for the supervised disentanglement approach by model selection and set δ = 0 for the unsupervised disentanglement approach. When the signal is discrete (e.g. brand), we use cross-entropy loss for the multiclass classification prediction task, and for a continuous signal (e.g. price), we use mean squared loss for the regression prediction task. 2.2. Supervised Disentanglement vs Unsupervised Disentanglement A key issue we examine in this work is whether structured data variables typically found in mar- keting contexts (e.g., brand) can be used as supervisory signals to improve disentanglement, and thus our ability to discover unstructured (visual) attributes. (Locatello et al. 2019) showed that this is challenging in theory, as there is no guarantee for finding a unique disentangled represen- tation using an unsupervised approach.5 Locatello et al. (2020) further showed that this challenge could be resolved by using supervision with ground truth attributes, in which lower supervised loss is correlated with a high score on disentanglement performance metrics. However, their approach (and several related in machine learning) are not aligned with our goal of attribute discovery for several reasons. First, needing ground truth labels of the attributes conflicts with our goals as these labels are that of the attributes we are trying to discover in the first place. Second, if the approach requires humans to (partially) label attributes, then the approach is not fully automated. Third, disentanglement performance metrics used in machine learning are generally only usable for synthetic datasets with access to ground truth attributes (Higgins et al. 2021). 5 One drawback of using a supervised disentanglement approach is that it assumes a single canonical factorisation of generative factors (Duan et al. 2020). For example, color can be represented by alternative representations like RGB, HSV, HSL, CIELAB or YUV. So, if a disentangled representation learns color aligned with HSV, then it will perform poorly if the supervised metric assumes that color should be represented by RGB. Marketing Science Institute Working Paper Series
Sisodia, Burnap, and Kumar: Automatically Discovering Unknown Product Attributes 11

 Our work instead takes an empirical viewpoint that is practical to marketing contexts. We do
not assume access to ground truth attributes, and consequently, we measure disentanglement per-
formance using two evaluation methods: (1) supervised classification accuracy on held-out data,
and (2) Unsupervised Disentanglement Ranking (UDR). UDR is a metric proposed by Duan et al.
(2020) to work in real-world data where ground truth is not available, and is based on heuristics of
good disentanglement rather than theoretical guarantees. This metric posits that for a particular
dataset and a particular VAE-based disentangled representation learning model, the unstructured
(visual) attributes learned using different seed values should be similar, whereas every entangled
representation is different in its own way. Specifically, UDR expects two disentangled represen-
tations learned from the same model on the same dataset with two different seeds to be similar
up to permutation and sign inverse. Appendix C.2 of the Supplement has details on how UDR is
operationalized.
 We investigate how well each of the (six) supervisory signals lead to better disentanglement
than the one learned by the purely unsupervised approach. We select informative visual attributes
and ignore uninformative visual attributes by calculating the KL [qφ (z|x)||p(z)] for each visual
attribute and then select attributes with KL divergence above a threshold (Duan et al. 2020). Vari-
ation across an uninformative attribute would produce little to zero visual change in the image.6
Both the supervised and unsupervised disentanglement approaches require model training (i.e.,
how model parameters are estimated), model selection (i.e., how model hyperparameters are cho-
sen), and model evaluation (i.e., how good is a selected model’s resulting disentanglement). How-
ever supervised and unsupervised approaches require different model training and selection steps,
while having the same evaluation step (so the comparison between unsupervised and supervised
approaches is apples-to-apples). We therefore describe these steps separately for the supervised
and unsupervised approaches in Appendix C of the Supplement.

3. Empirical Application
We consider an application of our proposed approach in the visual domain. Examples of visually
important aspects of products that impact consumer demand include a product’s design, packaging
and even promotion materials. Understanding their impact on consumer demand is of considerable
interest (Kang et al. 2019, Burnap et al. 2019). Existing methods either ignore visual attributes
completely, or collapse all visual (and other) unobservable attributes to form an unobserved product
characteristic (Cho et al. 2015).
6
 Rolinek et al. (2019) showed that during training, models based on VAEs enter a polarised regime where many
unstructured (visual) attributes are switched off by being reduced to the prior qφ (zj ) = p(zj ). Entering this polarized
regime allows the models to disentangle. These switched off attributes are referred to as uninformative attributes. Duan
et al. (2020) showed that models with fewer uninformative attributes do not disentangle well and their unstructured
(visual) attributes are hard to semantically interpret.

Marketing Science Institute Working Paper Series
12 Sisodia, Burnap, and Kumar: Automatically Discovering Unknown Product Attributes

3.1. Data
Our data includes watches auctioned at Christie’s auction house, spanning the years 2010 to 2020.
We choose this data for two main reasons. First, visual attributes of watches are important consid-
erations for consumers in this market. Second, the auction mechanism leads to a truthful revelation
of the buyer’s willingness to pay (WTP) for the watches.
 For each auctioned watch in the dataset, we have its image, auction attributes, structured product
attributes, and the hammer price paid at the auction (i.e., the willingness to pay). Structured
attributes include the brand of the watch, model of the watch, year of manufacture or circa,
type of movement associated with the watch, dimensions of the watch and materials used in the
watch. Auction attributes are year of the auction and location of the auction. Figure 3 (Tables
and Figures follow Reference throughout) shows a sample of watch images in our dataset. From
visual inspection, one can observe visual difference amongst the watches in the size of the dial,
shape of the dial, color of the dial, and color of the strap. The hammer price corresponding to a
consumer’s willingness to pay (in $1000s) are in constant 2000 dollars, adjusted for inflation using
the Consumer Price Index.
 The data includes both online and offline auctions. The offline locations are Dubai, Hong Kong
and New York City. A total of 199 unique brands are present in the data. Audemar’s Piguet,
Cartier, Patel Philippe and Rolex are the four brands with the largest share of observations, while
the remaining brands are coded as Others. Circa is coded as Pre-1950, 1950s, 1960s, 1970s, 1980s,
1990s, 2000s and 2010s. Movement of a watch is classified as either mechanical, automatic or quartz.
Dimensions of the watch refers to the watch diameter in case of a circular dial or the length of
the longest edge in case of a rectangular dial (in millimeters). Material is coded as gold, steel, a
combination of gold and steel or other materials. We create a time trend variable using the auction
dates. Table 1 (Tables and Figures follow Reference throughout) provides summary statistics of
the auctioned watches.

3.2. Model: Training, Selection and Evaluation
The dataset is segmented into training, validation and test data. To avoid data leakage, each watch
model was present only in one of the above subsets. The model training process requires us to specify
the dimension of the latent space, and the number of random seeds used. The process for supervised
and unsupervised both involve training across multiple seeds, but differ in the model selection step,
which obtains the hyperparameters for subsequent use (see Table 5 following references for obtained
hyperparameters corresponding to each disentanglement approach). Finally, the model evaluation
compares the set of supervised models (with each structured attribute serving as a supervisory
signal) and the unsupervised model to evaluate which of these discover visual attributes that are

Marketing Science Institute Working Paper Series
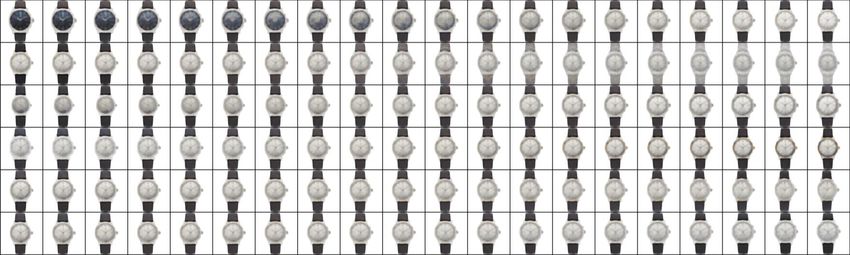
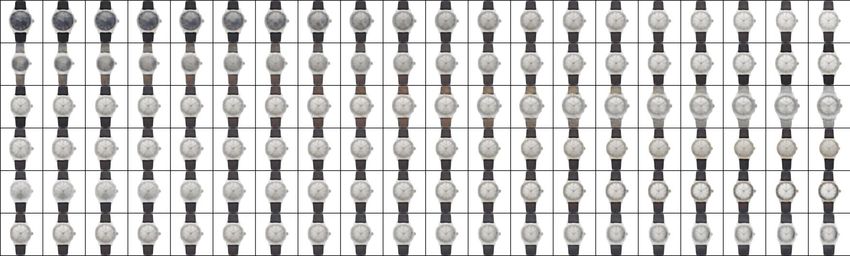
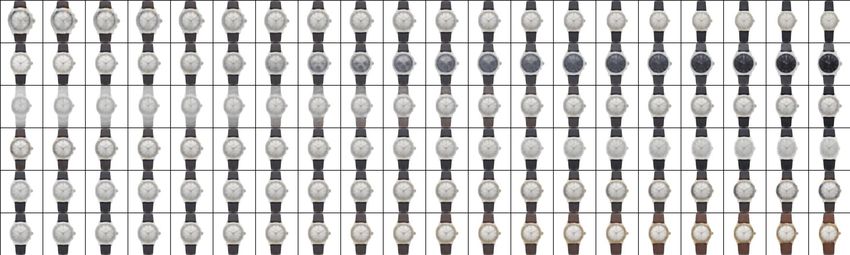
Sisodia, Burnap, and Kumar: Automatically Discovering Unknown Product Attributes 13

(a) predictive of structured attributes, and (b) obtain the highest value on the UDR metric. This
process is illustrated in Figure 7 (Tables and Figures follow Reference throughout) and detailed in
Appendix C of the Supplement. The architecture of the model is further specified in Appendix B
of the Supplement.

3.3. Results: Supervised vs Unsupervised Disentanglement
We show an example output in Figure 4 (Tables and Figures follow Reference throughout) of the
discovered visual attributes corresponding to supervisory signals ‘brand’ and ‘price’ as well as the
‘unsupervised approach’. In each row of the figure, we show how the watch image changes based
on changes in attribute values of one visual attribute, while keeping all the other attributes fixed.
We only show six visual attributes as rest of the attributes are found to be uninformative. By
uninformative, we mean that traversing along those dimensions leads to no visual changes. For a
quantitative analysis detailing this aspect, see Appendix C of the Supplement. From ex-post human
inspection (by researchers), we observe that both ‘brand (supervised approach)’ and ‘unsupervised
approach’ are able to discover six distinct unstructured (visual) attributes that are independent as
well as semantically interpretable. These are ‘dial color’, ‘strap color’, ‘dial size’, ‘rim color’, ‘knob
size’ and ‘dial shape’. However, ‘price (supervised approach)’ is only able to discover ‘dial size’,
‘strap color’ and ‘dial color’ but is not able to discover ‘rim color’, ‘dial shape’ and ‘knob size’.
We refer readers to Appendix D of the Supplement to see the visual attributes discovered by other
supervisory signals.
 We next compare the set of disentanglement approaches using two different methods for quan-
titative evaluation. First, we evaluate the visual attributes discovered from different supervisory
signals by their average performance on downstream tasks. Specifically, we characterize how well
discovered visual attributes from each of the seven disentanglement models (six supervised disen-
tanglement models and single unsupervised disentanglement model) are able to predict structured
product attributes - namely brand, year of manufacture or circa, type of movement associated with
the watch and the materials used in the watch. Using the trained models, we classify the watches
in the test set. We then calculate the average accuracy for each supervisory signal. Second, we eval-
uate the models based on the UDR metric, where a higher UDR is preferable since it corresponds
to a more disentangled representation.
 The results of the two quantitative evaluations of disentanglement performance are detailed in
Figure 5 (Tables and Figures follow Reference throughout). We plot the average accuracy for each
supervisory signal in panel (a). We find that the visual attributes learned from the supervisory
signal ‘brand’ has the highest accuracy and thus is most useful for downstream tasks. On the
other hand, visual attributes learned from ‘price’ as well as ‘auction location’ have the lowest

Marketing Science Institute Working Paper Series
14 Sisodia, Burnap, and Kumar: Automatically Discovering Unknown Product Attributes

accuracy and thus are the least useful for downstream tasks. We also plot the UDR for each
supervisory signal in panel (b). We find that the visual attributes learned from the supervisory
signal ‘brand’ also has the highest UDR. Similarly, visual attributes learned from ‘price’ as well as
‘auction location’ have the lowest UDRs. Thus, this UDR metric matches with evaluating visual
attributes on multiple downstream tasks. Interestingly, while the visual attributes learned from the
unsupervised approach has the second highest UDR, its downstream performance is not quite as
good (it was fourth highest).
 From both these evaluation approaches, we find that supervision with a typical dependent vari-
able in marketing such as ‘price’ does not necessarily lead to to the best disentanglement, whereas
‘brand’ serves as the best signal. Perhaps even more surprising, unsupervised disentanglement in
practice leads to better disentanglement than price and other supervisory signals. In other words,
while supervised signals are necessary for guaranteed disentanglement in theory, in practice we find
that several supervisory signals lead to worse performance than unsupervised disentanglement. Fur-
ther, conditional on using supervised methods, deep learning literature (Locatello et al. 2020) has
assumed ground truth on the visual attributes as the supervisory signals. We use other structured
attributes as the supervisory signal because obtaining ground truth on real-world datasets is not
feasible. We show that supervising on structured attributes helps in discovering disentangled visual
attributes. Thus, supervision can help even in the absence of ground truth on visual attributes.
 It is useful to understand why unsupervised approaches to disentangle work in practice even
though they are proven to have no theoretical guarantees. Rolinek et al. (2019) had shown that
the loss function used in unsupervised approaches does not in itself encourage disentanglement.
Indeed Locatello et al. (2019) showed that any rotationally invariant prior makes disentangled
representations learnt in an unsupervised setting unidentifiable when optimizing the loss function
for unsupervised approaches. However, Rolinek et al. (2019) showed that the interactions between
the reconstruction objective and the enhanced pressure to match a diagonal prior created by the
modified objectives of the disentangling VAEs force the decoder neural net to pursue orthogonal
representations. During training, models based on VAEs enter a polarised regime where many
unstructured (visual) attributes are switched off by being reduced to the prior qφ (zj ) = p(zj ).
Entering this polarized regime and ensuring sufficient dimensionality of the latent space are critical
in allowing the models to disentangle.
 It is also useful to understand why using brand as a supervisory signal helps in disentanglement
while other signals such as price and auction location do not. We might expect this is because, in
our case, watches have less pronounced variation in visual aesthetics by the price at which they are
auctioned. Similarly, watches with similar visual aesthetics might be auctioned at different auction
locations. At the same time, brand appears to be the best supervisory signal according to both the

Marketing Science Institute Working Paper Series
Sisodia, Burnap, and Kumar: Automatically Discovering Unknown Product Attributes 15

evaluation approaches. We conjecture that this is because watches of different brands have different
visual aesthetics (or “signatures”). Further, existing marketing research has shown that brands have
different personalities (Aaker 1997) that can be expressed through their product-related attributes,
product category associations, brand name, symbol or logo, advertising style, price, distribution
channel and user imagery (Batra et al. 1993, Liu et al. 2020). This allows the brand variable to serve
as a good supervisory signal in our setting. We also find that other structured product attributes
such as circa, material and movement have reasonable performance. We hope our findings provide
guidance to future researchers and managers using this method to automatically discover visual
attributes for their data. We provide statistics for the discovered attributes from supervision using
brand in Appendix F of the Supplement.

4. Discussion and Conclusion
Marketers have typically defined attributes based on structured characteristics of products, e.g.
brand, size and material. However, product attributes (especially visual ones) hidden in unstruc-
tured data play an important but underexamined role in marketing. We have proposed a method-
ology to automatically identify visual attributes from unstructured image data, which builds upon
the disentanglement literature in machine learning. Our approach leverages typically available
marketing variables like brand to act as a supervisory signal to obtain better disentanglement
performance, in terms of both semantic interpretability and accuracy. We have demonstrated the
potential value of our disentanglement deep learning method in an application examining how
such unstructured (visual) attributes impact consumer preferences and market price obtained in
an auction setting.
 The theoretical result of Locatello et al. (2019) showed that multiple attribute representations
are probable in the absence of a supervisory signal, leading to uncertainty about the true represen-
tation and resulted in the machine learning literature focusing mostly on supervised approaches
for disentanglement. Our research examines this assertion empirically and finds that in practice,
for automatic attribute discovery (in the absence of human intervention), supervised disentangle-
ment can lead to worse results than unsupervised disentanglement. Rather, our results point to the
idea that the choice of supervisory signal can be equally important. This finding was unexpected,
particularly for the supervisory signal price (consumer WTP), as marketers often use WTP as the
primary economic primitive in models in marketing and economics. Thus, even when the super-
visory signal likely contains ground truth information about the visual attributes (i.e., if visual
attributes impact WTP), if the supervision is weak, it may actually bias the process of recovery of
unknown attributes and lead to worse disentanglement.
 Our research has several limitations, some of which could serve as useful directions for future
work. First, it would be helpful to understand the semantic interpretability more thoroughly by

Marketing Science Institute Working Paper Series
16 Sisodia, Burnap, and Kumar: Automatically Discovering Unknown Product Attributes

surveying consumers about what discovered attributes they viewed as more or less interpretable,
and also which ones they had expected versus which ones were novel. It would also be useful to
take this model to applications involving settings with firm choices, e.g. price setting or promotion.
 Second, our method can readily be extended to other modalities of data beyond images, e.g. text
and voice or music data. Third, since consumer decision making is likely to depend on multiple
sources of information and persuasion, it would be interesting to examine whether having one
modality helps to better another, e.g. the presence of text might help disentangle images better.
Finally, it would also be helpful to obtain more insight into the specific conditions under which
certain signals perform better than unsupervised while others make disentanglement worse.

Marketing Science Institute Working Paper Series
Sisodia, Burnap, and Kumar: Automatically Discovering Unknown Product Attributes 17

Appendix A: Literature
Our work is related to two broad streams of literature. First, it is related to marketing methods for discovering
attributes and quantifying their levels. Second, our work relates to a stream of literature in machine learning
known as representation learning and more specifically to disentangled representations.

A.1. Attribute Discovery
Conventional methods in marketing science require a defined list of product attributes over which consumers
form preferences as inputs. Examples of methods that need a set of attributes as inputs range from conjoint
analysis and factor analysis, to reduced-form regression models and structural models. Along with the product
attributes themselves, these methods also need their attribute levels (i.e., the values of attributes for a given
product).
 Researchers have long relied on widely-adopted qualitative methods such as focus groups, in-depth con-
sumer interviews, and internal firm expertise to define the set of attributes and their levels (Green et al.
2001). While these qualitative methods are market research staples for good reason (Griffin and Hauser
1993), they require extensive human input on both the researcher and consumer side. Moreover, there are no
guarantees on discovering attributes that might be non-obvious to researchers ex-ante or hard to enunciate
by consumers. Our approach complements existing market research methods to discover additional inde-
pendent product attributes automatically from unstructured data. In contrast to qualitative methods, we
also discover attributes that can be semantically interpreted by humans even if they might be non-obvious
ex-ante since we correlate them with ex-post consumer decisions based on historical observed data.

A.2. Disentangled Representation Learning
Our work builds on a stream of literature in machine learning known as disentangled representation learning,
which aims to separate distinct informative factors of variation in the data (Bengio et al. 2013). For example,
a model to extract disentangled representations trained on a dataset of 3D objects might learn independent
factors of variation corresponding to object identity, position, scale, lighting and color.
 We seek good disentangled representations that are both independent as well as semantically inter-
pretable by humans. Promoting statistical independence is relatively straightforward by penalizing statistical
moments, whether certain moments (e.g., minimizing correlation (Kumar et al. 2017)) or all (e.g., penalizing
mutual information (Chen et al. 2018)). From this viewpoint, while recent deep learning methods are gener-
ally aimed at learning disentangled representations from high-dimensional unstructured data (e.g., images,
text, video), they may also be viewed as nonlinear extensions of classic marketing methods such as factor
analysis and principle component analysis, in which the learned representations are statistically independent;
albeit lower-dimensional and obtained using linear projections (Roweis and Ghahramani 1999).

A.3. Generative Modeling using GANs and VAEs
The two broad classes of generative models are based on variational autoencoders (VAEs) (Kingma and
 7
Welling 2014) and generative adversarial networks (GAN) (Goodfellow et al. 2020). Most state-of-the-art

7
 In a GAN, two neural networks compete with each other in a zero-sum game to become more accurate.

Marketing Science Institute Working Paper Series
18 Sisodia, Burnap, and Kumar: Automatically Discovering Unknown Product Attributes

disentangled representation learning methods are based on VAEs. VAEs are comprised of two models – the
encoder neural net and the decoder neural net. The encoder neural net compresses high-dimensional input
data to a lower-dimensional latent vector (latent attributes), followed by inputting the latent vector to the
decoder neural net which outputs a reconstruction of the original input data. VAEs balance having both a low
reconstruction error between the input and output data (e.g., images, text), as well as a KL-divergence of the
latent space distribution (latent attributes) from a researcher-defined prior distribution (e.g., Gaussian). The
KL-divergence term acts as a regularizer on the latent space, such that it has desired structure (smoothness,
compactness). VAEs are parametrized in both the encoder neural net and decoder neural net using neural
networks whose parameters are learned jointly.
 Several methods based on GANs have also been used for disentanglement. InfoGAN was one of the first
scalable unsupervised methods for learning disentangled representations (Chen et al. 2016). While GANs
are typically less suited relative to VAEs for representation learning, as GANs traditionally do not infer a
representation8 , InfoGAN explicitly constrains a small subset of the ‘noise’ variables to have high mutual
information with generated data. Several VAE-based methods have proven to be superior (Kim and Mnih
2018, Chen et al. 2018) than InfoGAN. Recent methods based on StyleGAN (Karras et al. 2019) such as Info-
StyleGAN (Nie et al. 2020) are able to perform disentanglement at a much higher resolution (1024×1024)
unlike the VAE-based methods. However, unlike InfoGAN, Info-StyleGAN suffers from the need for human
labels or pretrained models, which can be expensive to obtain (Voynov and Babenko 2020).
 We choose a VAE-based approach over a GAN-based approach for several reasons. First, our goal is to
propose an easy-to-train method that can be used by researchers as well as practitioners (Lee et al. 2020).
Second, our goal of discovering unique (visual) attributes that are semantically meaningful and independent
of each other requires high disentanglement performance, but reconstruction accuracy is not our primary
goal (Lee et al. 2020). GANs suffer from lower disentanglement performance because they focus on localized
concepts but not global concepts of the image (Gabbay et al. 2021). On the other hand, discovered attributes
from VAEs are much more globally distributed as compared with GANs. This allows the VAE-based methods
to discover few important and semantically interpretable unstructured (visual) attributes that can represent
the input raw data. Third, one of the benefits of our approach is that we are able to not just discover
disentangle attributes, but infer the values of these attributes for all dataums in the data. This enables use in
downstream marketing tasks that require attribute values, for example, econometric modeling to estimate the
impact of discovered attributes on WTP (see Appendix E). GANs do not conventionally infer a representation
of the data, and hence do not have this benefit. Finally, VAEs often require less data to train in comparison
with GANs (Karras et al. 2019). Thus, even though GANs can provide much better reconstruction and work
better for small and detailed objects (Locatello et al. 2020), we choose a VAE-based approach because of its
suitability to our research question. Table 3 (Tables and Figures follow Reference throughout) summarizes the
recent disentanglement methods and Table 4 (Tables and Figures follow Reference throughout) summarizes
metrics to measure disentanglement.

8
 Moreover, GANs tend to suffer from training instability. Some of the common failure modes are vanishing gradients,
mode collapse and failure to converge.

Marketing Science Institute Working Paper Series
You can also read